
Occupational Exposure to Silica Nanoparticles: Evaluation of Emission Fingerprints by Laboratory Simulations


 ,
,  and
and 
Abstract
:1. Introduction
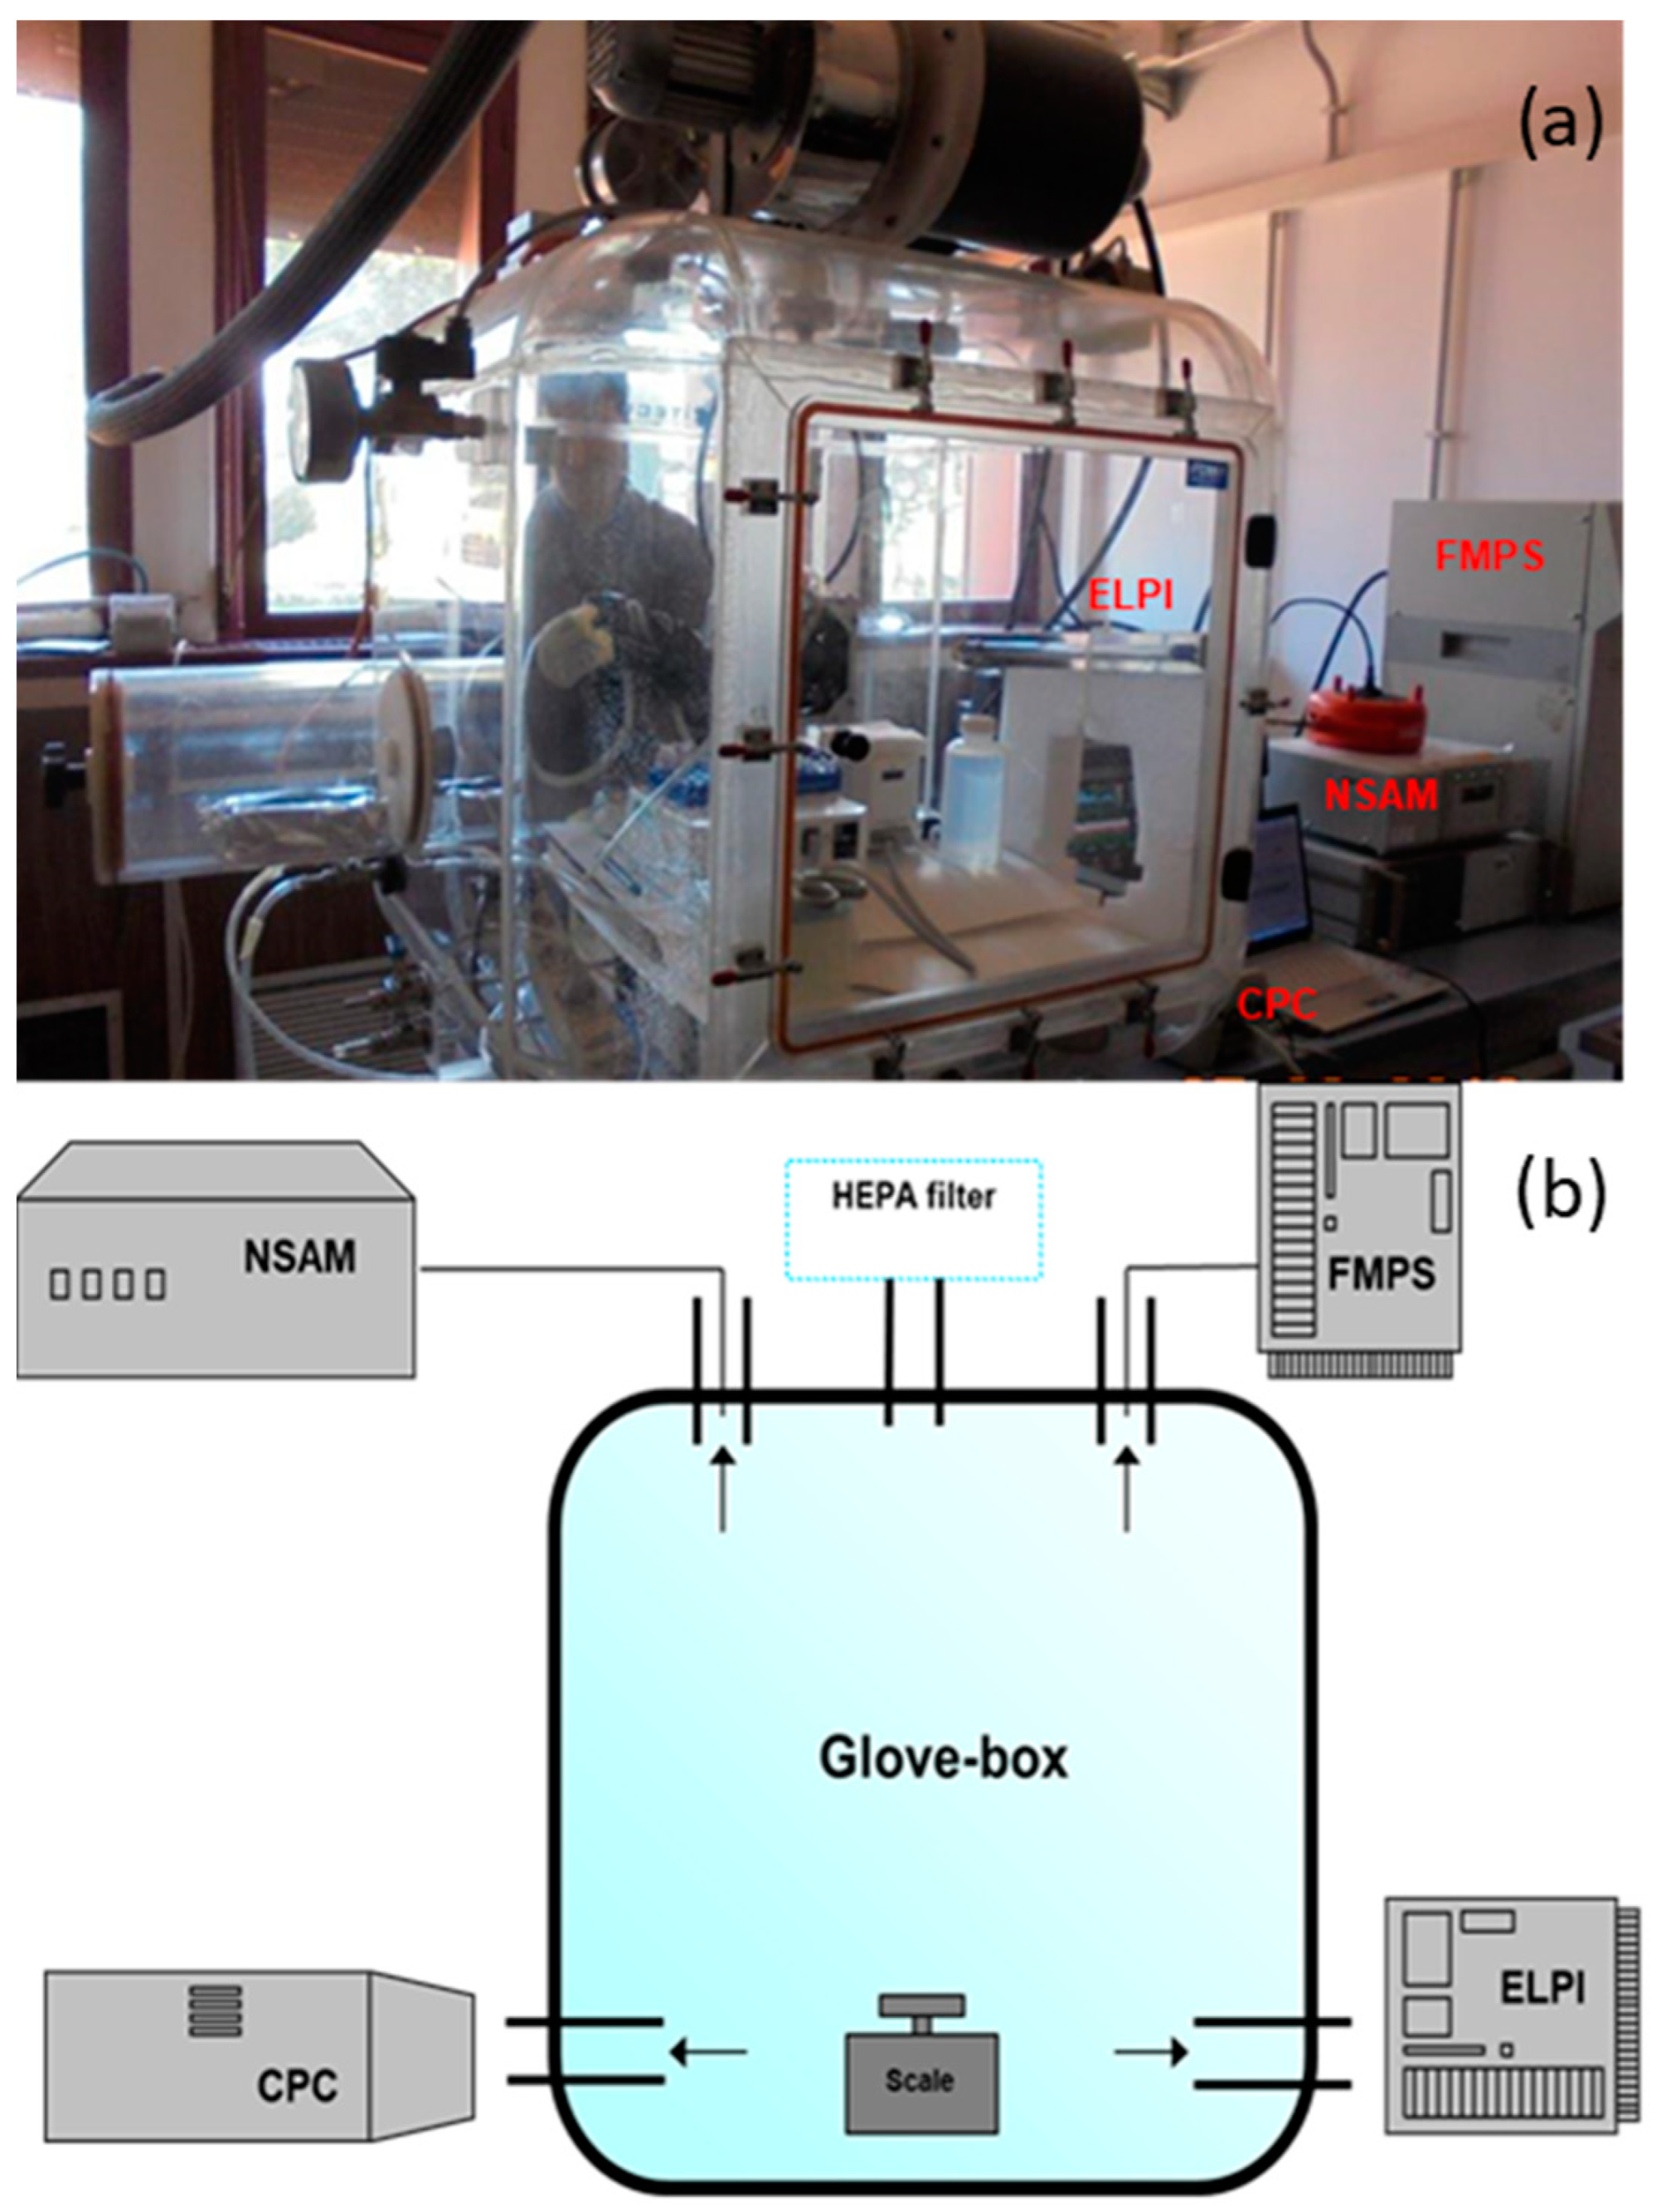
2. Materials and Methods
- -
- Condensation Particle Counter (CPC mod. 3007, TSI Inc., Shoreview, MN, USA) in order to measure the particle number concentration (PNC);
- -
- Fast Mobility Particle Sizer (FMPS mod. 3091, TSI Inc., Shoreview, MN, USA) that provides the particle size distribution (PSD) over 32 channels and simultaneously also the PNC;
- -
- Electrical Low Pressure Impactor (ELPI mod. Dekati Ltd., Kangasala, Finland) to measure real-time total PNC and PSD in the size range 6–10,000 nm and to collect on plates size classified particles for off-line analysis. Sampling supports are in aluminum (Al) with 25 mm size;
- -
- Nanoparticle surface area monitor (NSAM mod. 3550, TSI Inc, Shoreview, MN, USA) for the measurement of lung deposition surface area (LDSA) of particles, which is an important occupational parameter, corresponding to the active surface area calculated as the product of the particle area for the probability density of deposition in the different zones of the respiratory tract (A, alveolar or TB, tracheobronchial), according to the model published by the ICRP [26].
3. Results and Discussion
4. Conclusions
Author Contributions
Funding
Institutional Review Board Statement
Informed Consent Statement
Data Availability Statement
Conflicts of Interest
References
- Vance, M.E.; Kuiken, T.; Vejerano, E.P.; McGinnis, S.P.; Hochella, M.F., Jr.; Rejeski, D.; Hull, M.S. Nanotechnology in the real world: Redeveloping the nanomaterial consumer products inventory. Beilstein J. Nanotechnol. 2015, 6, 1769–1780. [Google Scholar] [CrossRef] [PubMed]
- European Commission. A European strategy for Key Enabling Technologies—A bridge to growth and jobs. In Communication from the Commission to the European Parliament, the Council, the European Economic and Social Committee and the Committee of Regions; European Commission: Brussels, Belgium, 2012. [Google Scholar]
- ISO/TS 80004-1:2015; Nanotechnologies—Vocabulary—Part 1: Core Terms. International Organization for Standardization (ISO): Geneva, Switzerland, 2015.
- Hubbs, A.F.; Sargent, L.M.; Porter, D.W.; Sager, T.M.; Chen, B.T.; Frazer, D.G.; Castranova, V.; Sriram, K.; Nurkiewicz, T.R.; Reynolds, S.H.; et al. Nanotechnology: Toxicologic Pathology. Toxicol. Pathol. 2013, 41, 395–409. [Google Scholar] [CrossRef]
- Lee, N.; Lim, C.H.; Kim, T.; Son, E.K.; Chung, G.S.; Rho, C.J.; Lee, S.R.; Yu, I.J. Which Hazard Category Should Specific Nanomaterials or Groups of Nanomaterials Be Assigned To and How? World Health Organization: Geneva, Switzerland, 2017. [Google Scholar]
- Schulte, P.A.; Geraci, C.L.; Murashov, V.; Kuempel, E.D.; Zumwalde, R.D.; Castranova, V.; Hoover, M.D.; Hodson, L.; Martinez, K.F. Occupational safety and health criteria for responsible development of nanotechnology. J. Nanoparticle Res. 2014, 16, 2153. [Google Scholar] [CrossRef]
- Basinas, I.; Jiménez, A.S.; Galea, K.S.; Tongeren, M.V.; Hurley, F. A Systematic Review of the Routes and Forms of Exposure to Engineered Nanomaterials. Ann. Work Expo. Health 2018, 62, 639–662. [Google Scholar] [CrossRef]
- Schneider, T.; Brouwer, D.H.; Koponen, I.K.; Jensen, K.A.; Fransman, W.; van Duuren-Stuurman, B.; Tongeren, M.V.; Tielemans, E. Conceptual model for assessment of inhalation exposure to manufactured nanoparticles. J. Expo. Sci. Environ. Epidemiol. 2011, 21, 450–463. [Google Scholar] [CrossRef]
- Ding, Y.; Kuhlbuschb, T.A.J.; van Tongeren, M.; Jimenez, A.S.; Tuinman, I.; Chen, R.; Alvarez, I.L.; Mikolajczyk, U.; Nickel, C.; Meyer, J.; et al. Airborne engineered nanomaterials in the workplace—A review of release and worker exposure during nanomaterial production and handling processes. J. Hazard. Mater. 2017, 322, 17–28. [Google Scholar] [CrossRef]
- Bekker, C.; Kuijpers, E.; Brouwer, D.; Vermeulen, R. Occupational exposure to nano-objects and their agglomerates and aggregates across various life cycle stages; a broad-scale exposure study. Ann. Occup. Hyg. 2015, 59, 681–704. [Google Scholar] [CrossRef]
- Maynard, A.D.; Aitken, R.J. Assessing exposure to airborne nanomaterials: Current abilities and future requirements. Nanotoxicology 2007, 1, 26–41. [Google Scholar] [CrossRef]
- Laux, P.; Tentschert, J.; Riebeling, C.; Braeuning, A.; Creutzenberg Epp, A.; Fessard, V.; Haas, K.H.; Haase, A.; Hund-Rinke, K.; Jakubowski, N.; et al. Nanomaterials: Certain aspects of application, risk assessment and risk communication. Arch. Toxicol. 2018, 92, 121–141. [Google Scholar] [CrossRef]
- OECD. Harmonized Tiered Approach to Measure and Assess the Potential Exposure to Airborne Emissions of Engineered Nano-Objects and Their Agglomerates and Aggregates at Workplaces; Series on the Safety of Manufactured Nanomaterials; ENV/JM/MONO No. 55; OECD: Paris, France, 2015; p. 19. [Google Scholar]
- OECD. Strategies, Techniques and Sampling Protocols for Determining the Concentrations of Manufactured Nanomaterials in Air at the Workplace; Series on the Safety of Manufactured Nanomaterials; ENV/JM/MONO No. 82; OECD: Paris, France, 2017; p. 30. [Google Scholar]
- Boccuni, F.; Gagliardi, D.; Ferrante, R.; Rondinone, B.M.; Iavicoli, S. Measurement techniques of exposure to nanomaterials in the workplace for low- and medium-income countries: A systematic review. Int. J. Hyg. Environ. Health 2017, 220, 1089–1097. [Google Scholar] [CrossRef]
- Kuhlbusch, T.A.; Asbach, C.; Fissan, H.; Göhler, D.; Stintz, M. Nanoparticle exposure at nanotechnology workplaces: A review Particle and Fibre. Toxicology 2011, 8, 22. [Google Scholar] [CrossRef]
- Hagendorfer, H.; Lorenz, C.; Kaegi, R.; Sinnet, B. Size-fractionated characterization and quantification of nanoparticle release rates from a consumer spray product containing engineered nanoparticles. J. Nanopart. Res. 2010, 12, 2481–2494. [Google Scholar] [CrossRef]
- Castellano, P.; Canepari, S.; Ferrante, R.; L’Episcopo, N. Multiparametric approach for an exemplary study of laser printer emissions. J. Environ. Monit. 2012, 14, 446. [Google Scholar] [CrossRef] [PubMed]
- Calcaterra, H.; Shin, N.; Quirk, P.L.; Tsai, C.S.J. Low Concentration Analysis of Silver Nanoparticles in Consumer Spray Products. Atmosphere 2020, 11, 403. [Google Scholar] [CrossRef]
- Gomez, V.; Levin, M.; Saber, A.T.; Irusta, S.; Dal Maso, M.; Hanoi, R.; Santamaria, J.; Jensen, K.A.; Wallin, H.; Koponen, I.K. Comparison of dust release from epoxy and paint nanocomposites and conventional products during sanding and sawing. Ann. Occup. Hyg. 2014, 58, 983–994. [Google Scholar] [CrossRef]
- Murugadoss, S.; Lison, D.; Godderis, L.; van den Brule, S.; Mast, J.; Brassinne, F.; Sebaihi, N.; Hoet, P.H. Toxicology of silica nanoparticles: An update. Arch. Toxicol. 2017, 91, 2967–3010. [Google Scholar] [CrossRef]
- Kim, B.; Kim, H.; Yu, I.J. Assessment of nanoparticle exposure in nanosilica handling process: Including characteristics of nanoparticles leaking from a vacuum cleaner. Ind. Health 2014, 52, 152–162. [Google Scholar] [CrossRef]
- Oh, S.; Kim, B.; Kim, H. Comparison of nanoparticle exposures between fumed and sol-gel nano-silica manufacturing facilities. Ind. Health 2014, 52, 190–198. [Google Scholar] [CrossRef]
- Malvindi, M.A.; Brunetti, V.; Vecchio, G.; Galeone, A.; Cingolani, R.; Pompa, P.P. SiO2 nanoparticles biocompatibility and their potential for gene delivery and silencing. Nanoscale 2012, 4, 486–495. [Google Scholar] [CrossRef]
- Ambrosone, A.; Scotto di Vettimo, M.R.; Malvindi, M.A.; Roopin, M.; Levy, O.; Marchesano, V.; Pompa, P.P.; Tortiglione, C.; Tino, A. Impact of amorphous SiO2 nanoparticles on a living organism: Morphological, behavioral, and molecular biology implications. Front. Bioeng. Biotechnol. 2014, 2, 37. [Google Scholar] [CrossRef]
- International Commission on Radiological Protection (ICRP). Human Respiratory Tract Model for Radiological Protection. In ICRP Publication No. 66. Annals of the ICRP; Smith, H., Ed.; Pergamon Press: Tarrytown, NY, USA, 1994. [Google Scholar]
- Boccuni, F.; Ferrante, R.; Tombolini, F.; Iavicoli, S.; Pelliccioni, A. Relationship between indoor high frequency size distribution of ultrafine particles and their metrics in a university site. Sustainability 2021, 13, 5504. [Google Scholar] [CrossRef]
- Bukowiecki, N.; Kittelson, D.B.; Watts, W.F.; Burtscher, H.; Weingartner, E.; Baltensperger, U. Real-time characterization of ultrafine and accumulation mode particles in ambient combustion aerosols. J. Aerosol Sci. 2002, 33, 1139–1154. [Google Scholar] [CrossRef]
- Schmid, O.; Stoeger, T. Surface area is the biologically most effective dose metric for acute nanoparticle toxicity in the lung. J. Aerosol Sci. 2016, 99, 133–143. [Google Scholar] [CrossRef]
- Boccuni, F.; Ferrante, R.; Tombolini, F.; Natale, C.; Gordiani, A.; Sabella, S.; Iavicoli, S. Occupational exposure to graphene and silica nanoparticles. Part I: Workplace measurements and samplings. Nanotoxicology 2020, 14, 1280–1300. [Google Scholar] [CrossRef] [PubMed]


| Technical Name | Silica Nanoparticles (SiO2 NPs) |
|---|---|
| Chemical composition | Silicon dioxide |
| Physical form and shape | Zero-dimensional (0-D) amorphous nanoparticles |
| Common form | Water solution or powder (white) |
| Density | Average bulk Density: 2.648 g/cm3 |
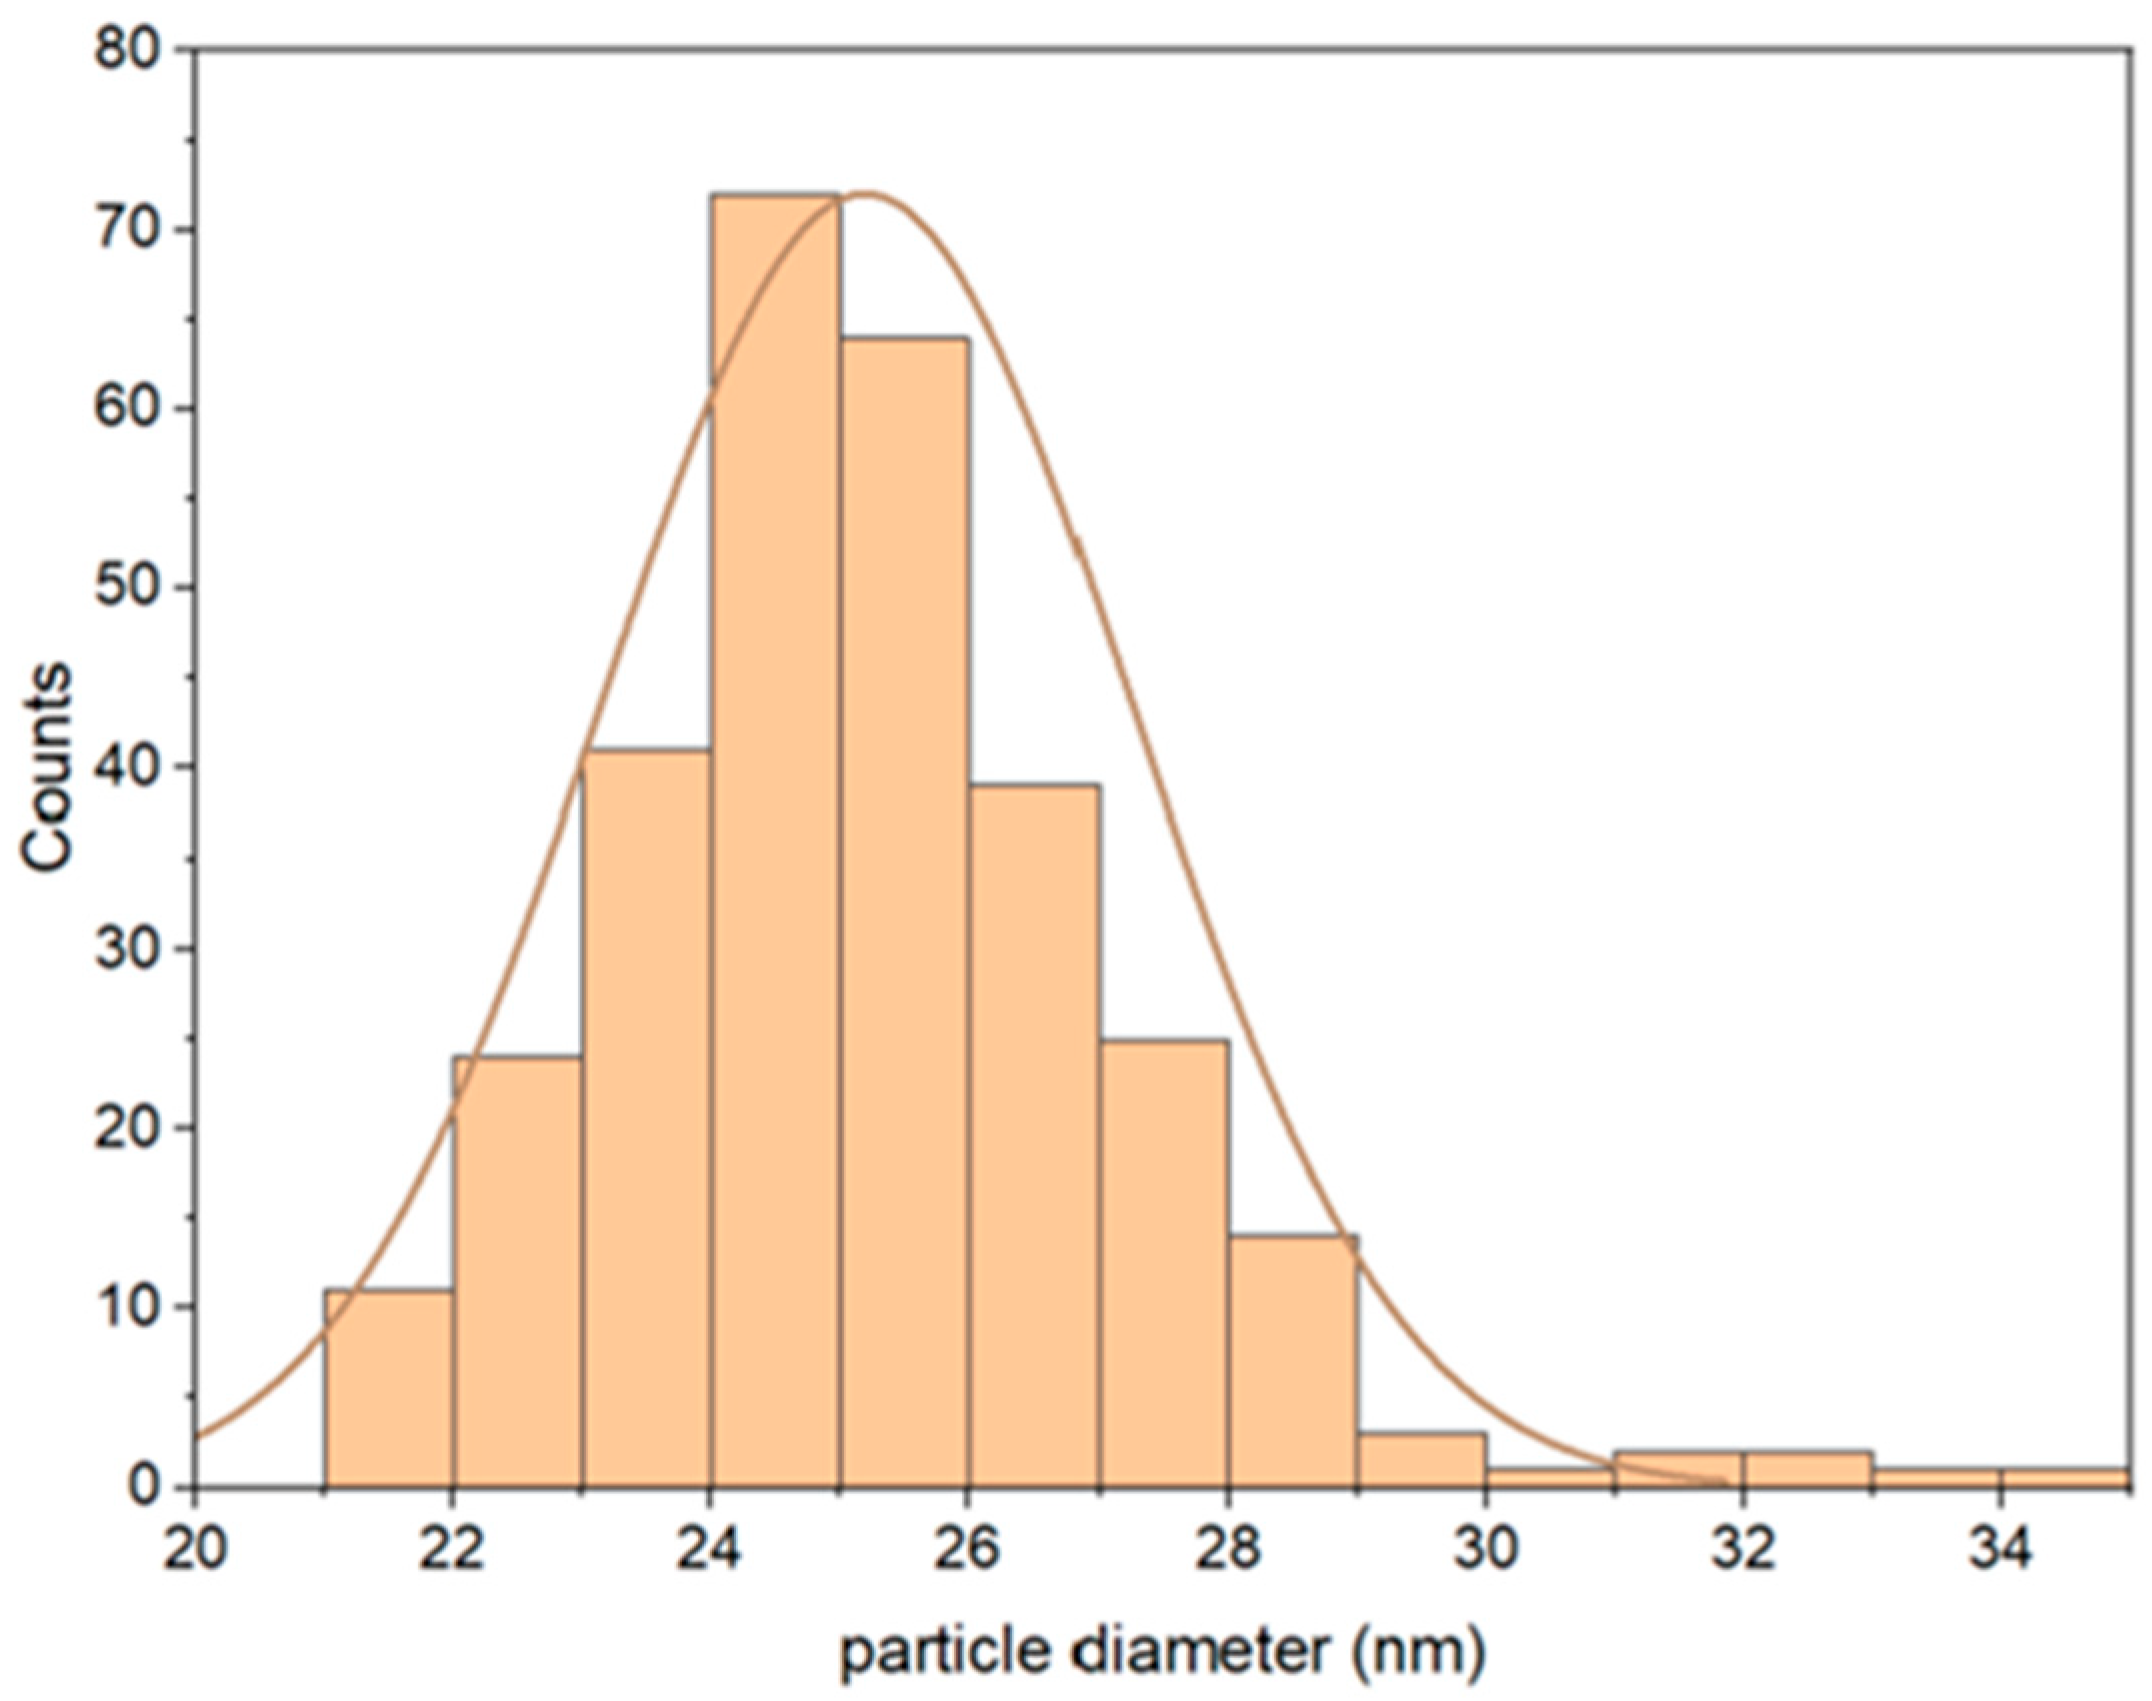
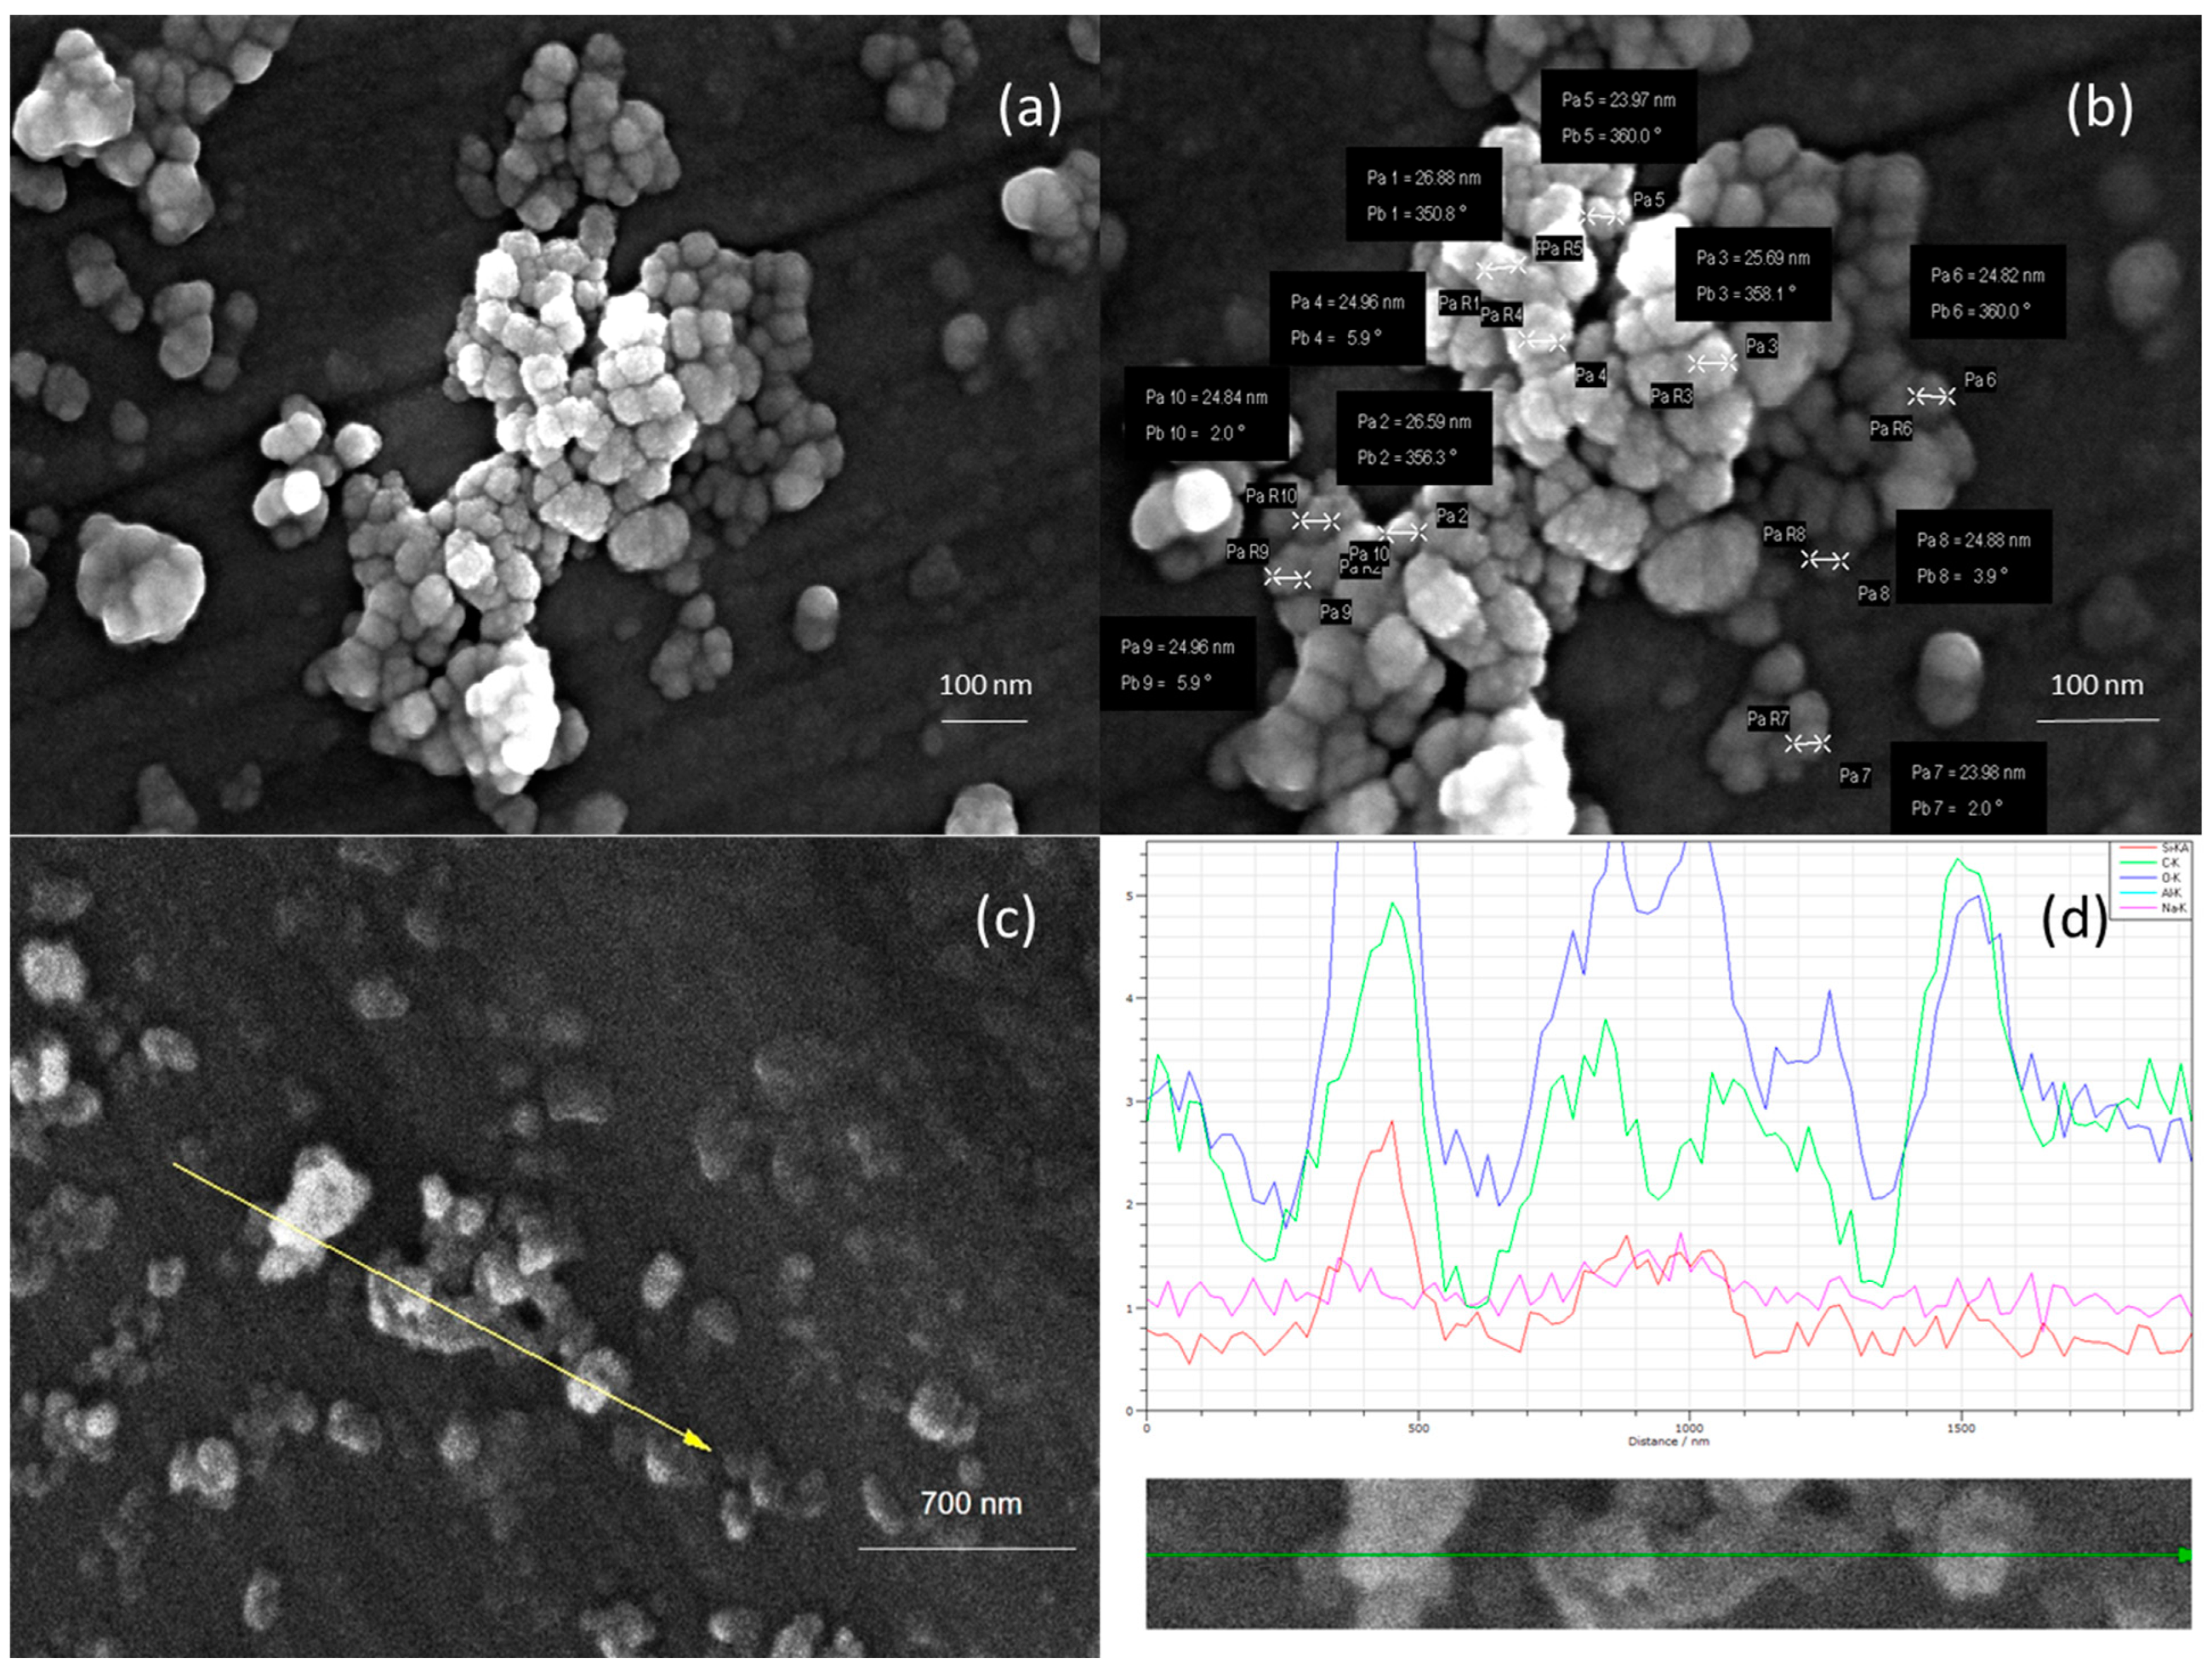
| Size | 25 ± 1 nm |
| Particle Surface area | 1962.5 nm2 |
| Instrument | Class | Principle of Operation | Output | Size Range (nm) | Time Resolution (s) | Aspiration Flow (L/min) |
|---|---|---|---|---|---|---|
| CPC TSI Inc. Mod.3007 | Real-time | Optical detection | PNC (#/cm3) | 10–1000 | 1 | 0.7 |
| FMPS TSI Inc. Mod.3091 | Real-time | Electrical mobility | PNC (#/cm3) Size distribution | 5.6–560 | 1 | 10 |
| NSAM TSI Inc. Mod.3550 | Real-time | Diffusion charging | LDSA (µm2/cm3) and total (µm2) for alveolar fraction | 10–1000 | 1 | 2.5 |
| HR-ELPI | Real-time/ Time-integrated | Electrical cascade impactor | PNC (#/cm3) Size distribution Samples for off-line analysis | 6–10,000 | 0.1 | 10 |
Publisher’s Note: MDPI stays neutral with regard to jurisdictional claims in published maps and institutional affiliations. |
© 2022 by the authors. Licensee MDPI, Basel, Switzerland. This article is an open access article distributed under the terms and conditions of the Creative Commons Attribution (CC BY) license (https://creativecommons.org/licenses/by/4.0/).
Share and Cite
Natale, C.; Ferrante, R.; Boccuni, F.; Tombolini, F.; Sarto, M.S.; Iavicoli, S. Occupational Exposure to Silica Nanoparticles: Evaluation of Emission Fingerprints by Laboratory Simulations. Sustainability 2022, 14, 10251. https://doi.org/10.3390/su141610251
Natale C, Ferrante R, Boccuni F, Tombolini F, Sarto MS, Iavicoli S. Occupational Exposure to Silica Nanoparticles: Evaluation of Emission Fingerprints by Laboratory Simulations. Sustainability. 2022; 14(16):10251. https://doi.org/10.3390/su141610251
Chicago/Turabian StyleNatale, Claudio, Riccardo Ferrante, Fabio Boccuni, Francesca Tombolini, Maria Sabrina Sarto, and Sergio Iavicoli. 2022. "Occupational Exposure to Silica Nanoparticles: Evaluation of Emission Fingerprints by Laboratory Simulations" Sustainability 14, no. 16: 10251. https://doi.org/10.3390/su141610251
APA StyleNatale, C., Ferrante, R., Boccuni, F., Tombolini, F., Sarto, M. S., & Iavicoli, S. (2022). Occupational Exposure to Silica Nanoparticles: Evaluation of Emission Fingerprints by Laboratory Simulations. Sustainability, 14(16), 10251. https://doi.org/10.3390/su141610251