Article

Optimal Evacuation Route Planning of Urban Personnel at Different Risk Levels of Flood Disasters Based on the Improved 3D Dijkstra’s Algorithm

1
School of Mathematics and Physics, Lanzhou Jiaotong University, Lanzhou 730070, China
2
Quanzhou Institute of Equipment Manufacturing, Haixi Institutes, Chinese Academy of Sciences, Quanzhou 362000, China
3
School of Advanced Manufacturing, Fuzhou University, Jinjiang 362200, China
4
School of Resources and Environmental Engineering, Jiangxi University of Science and Technology, Ganzhou 341000, China
5
Department of Safety Engineering, College of Mechanical and Electrical Engineering, Beijing University of Chemical Technology, Beijing 100029, China
6
State Key Laboratory of Safety and Health for Metal Mines, Maanshan 243000, China
*
Authors to whom correspondence should be addressed.
Sustainability 2022, 14(16), 10250; https://doi.org/10.3390/su141610250
Submission received: 8 July 2022 / Revised: 8 August 2022 / Accepted: 11 August 2022 / Published: 18 August 2022
(This article belongs to the Special Issue Data-Driven Emergency Traffic Management, Optimization and Simulation)

Abstract

:
In the event of a flood, the choice of evacuation routes is vital for personnel security. This is particularly true when road factors play an important role in evacuation time. In this study, the traditional Dijkstra algorithm for route planning is improved, and the evacuation model is improved from 2D to 3D. At the same time, the Lasso regression method is adopted to take the road factors into account in the pedestrian speed, and the location of shelter is selected and optimized through the calculation results, and then based on the improved 3D Dijkstra’s algorithm, an optimal evacuation route method in different flood disasters risk levels is proposed, which can make pedestrians reach the shelters within the shortest time. After taking into account road factors (road width, slope, non-motorized lane width, and pedestrian density), through the calculation of the pedestrian speed formula, the estimated evacuation time of pedestrians is obtained. By combining available shelters with evacuation routes, the optimized algorithm improves the evacuation efficiency facing different risk levels of flood disasters. The results show that when residents are confronted with flood disasters of once-in-20-year, once-in-50-year, and once-in-100-year, the proposed optimization algorithm can save 7.59%, 11.78%, and 17.78% of the evacuation time. Finally, according to the verification of the actual effect in Meishan Town, the proposed method of optimal evacuation route planning can effectively reduce the evacuation time of pedestrians, evaluate, and optimize the location of existing shelter, and provide suggestions for urban road reconstruction.

1. Introduction

The lifestyle of urban residents is inevitably affected by extreme weather, such as heavy rainfall, floods, and typhoons. When faced with extreme weather such as heavy rainfall, if the sudden flood is not eliminated in time, it may cause damage to the reservoir dam and threaten the lives of residents in low altitude areas downstream [1,2,3]. In addition, the flood will also cause economic losses such as the destruction of some residential houses and public facilities and the reduction of crop production in a large area [4,5]. For example, in 1979, the Machu Dam was broken by the rainfall, continued river inflow, and 20% failing of the flood gates, resulting in a death toll of 5000 to 10,000 [6]. In 2018, the Sheyuegou Dam in Xinjiang, China, was damaged by a flood. Thanks to the early warning and timely evacuation of personnel, casualties were reduced, but 20 people still lost their lives, and 8 were missing [7]. In brief, it is practically valuable and significant to efficiently evacuate people from inundated areas to shelters in advance under the information of disaster warnings [8,9,10,11].
During the evacuation of pedestrians after the early warning is issued, many factors need to be considered, such as the choice of shelter location [12] and road factors affecting walking speed. Coutinho-Rodrigues introduced a method to determine the evacuation route and the location of the shelters, which successfully verified the relationship between route length and evacuation time [13]. In addition, road factors will also affect the evacuation speed of pedestrians, a case in point is that when pedestrians go uphill, their walking speed is significantly reduced [14]. However, most of the evacuation route studies haven’t taken this into account. Previous studies have also found that pedestrian density, sidewalk width, and total pavement width can also explain the pedestrian speed to a certain extent [15,16]. When going to a shelter, people are more inclined to choose a road with fewer pedestrians, a lower cumulative climbing gradient, and less congestion. With regard to the evacuation route, if these practical road factors are taken into account, the study of the evacuation route in the inundated area would be more of practical value.
In the current study, some shortest path algorithms are proposed to improve pedestrian evacuation efficiency. These algorithms simplify the pedestrian evacuation optimization process into a 2D sub-path search problem, in which the pedestrian’s speed is usually assumed to be a fixed speed and road factors are neglected. These algorithms include the Dijkstra’s, Floyd’s, Bellman–Ford’s, and heap-based Bellman–Ford’s [17,18,19]. Among them, the Dijkstra algorithm has been widely applied and improved in the study of various disaster evacuation routes due to its clear and simple nature [20]. For example, in ultra-large area route planning, by using an improved 3D Dijkstra’s algorithm, ships consume approximately 5% less fuel across the North Atlantic Ocean, and their estimated time of arrival is more punctual [21]. Additionally, when a tsunami comes, more people can evacuate successfully if shelter capacity is properly considered, and pedestrian speeds are considered through crowd density and road width [22].
For the walking speed of pedestrians during evacuation, there are many research conclusions at present. In general, to maintain a stable speed and save physical strength, pedestrians would choose an appropriate speed according to the slope [23]. The earliest formula for the walking speed of slopes was proposed by William Naismith in 1892 [24], which explained that pedestrians take one hour every 5000 m, and it takes an extra hour every 600 m of road elevation. In recent years, several methods have been employed when considering road factors in road weights, including forward/backward stepwise regression [25] and ridge regression [26]. After comparing multiple models, the linear regression equation with multicollinearity has better prediction performance after removing low correlation variables [27].
Some previous studies on flood inundation include the inundation of inland cities caused by rainstorm, and the possible inundation area could be calculated by rainfall to calculate the possible property loss [28]. In addition, the previous study also suggested that the inundation range of flood may increase by about 30% due to the increase of river flood [29]. For different flood depths, when the flood is at 20–120 cm, the movement speed will become slower and slower with the increase of the flood depth [30]. When the flood depth exceeds 120 cm, it can be determined that the depth is the limit of human stability and evacuation safety in flowing and static water [31]. In addition, the flood flow velocity also has a certain impact on pedestrian evacuation. When walking against the water flow direction, the flow velocity further delays the evacuation and reduces the pedestrian speed [32]. However, when the flood occurs, the flood water level is too deep and there is no time for people to evacuate, so this study considers the possible inundation area before the flood occurs.
In view of the fact that there are almost no previous studies on the submersion of cities and towns due to reservoir flooding, and the limitations on pedestrian speed and road factors are often not considered in previous evacuation route studies, as well as the inability to effectively combine the path selection problems in the inundated range under different flood disasters levels, this study optimized evacuation route planning under different flood inundated ranges and proposed a 3D Dijkstra optimization algorithm that considers the factors of road width, pedestrian density, non-motorized lane width, and road slope. In addition, this study also conducted an analysis on the selection of shelters in the inundated area and the improvement rate of evacuation time was calculated under different inundated levels. Finally, the reasons for the optimization effect of the method were analyzed, and the practical application and algorithm comparison are carried out in Meishan Town, the related software has been developed and applied to the urban flood early warning system.

2. Research Areas and Methods
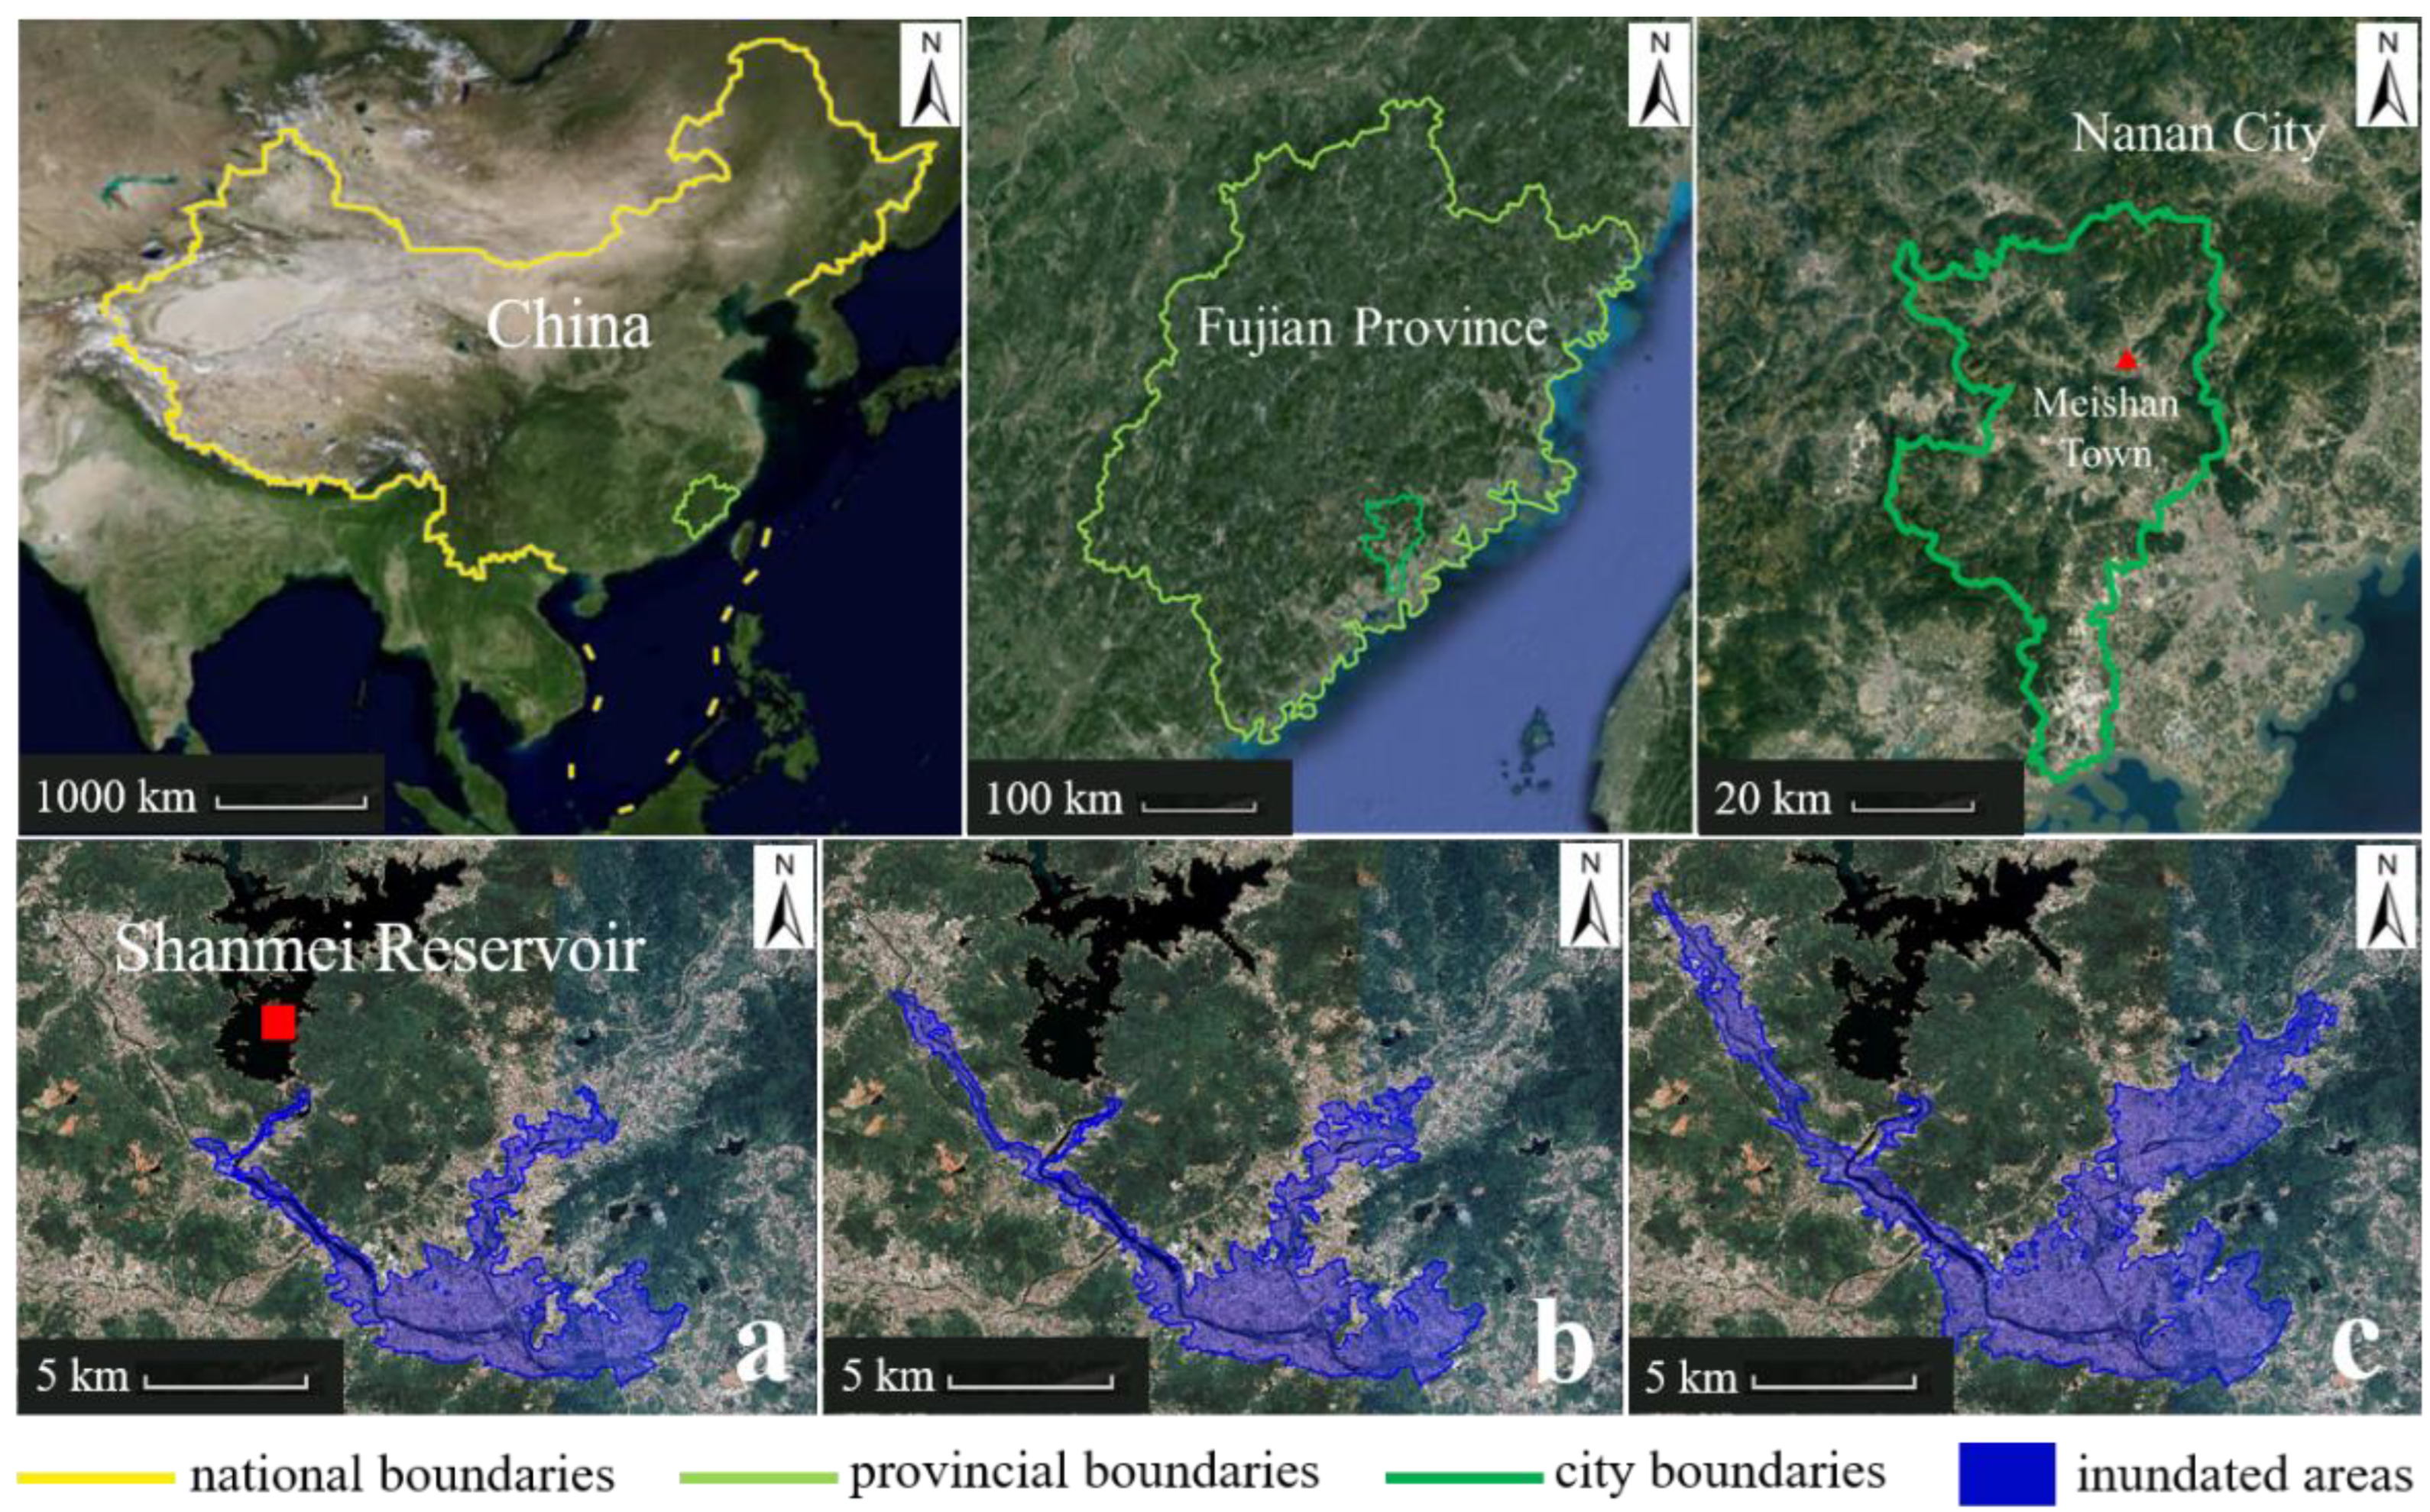
2.1. Research Area

The research area is Meishan Town, Nan’an City, Fujian Province, China (25°11′ N, 118°47′ E), which is located in the downstream area of Shanmei Reservoir (25°17′ N, 118°42′ E), with an administrative area of 59 km2 and an average annual population of more than 67,000 [33]. Shanmei Reservoir is located on the north side of Meishan Town, with a straight-line distance of 6.8 km. Because the area is close to the Taiwan Strait, it is prone to typhoon weather. For example, during the typhoon in June 1985, the total accumulated rainfall in the upstream of the Shanmei Reservoir reached 234 mm, the maximum peak flow reached 1287 m3/s, and the total accumulated flood discharge from the reservoir was 143 million m3. During the typhoon in mid-August of the same year, the total accumulated rainfall in the upstream of the reservoir was 145.8 mm, the maximum flood peak flow reached 1427 m3/s, and the total flood discharge from the reservoir was 950,000 m3 during the typhoon. In mid-August 2002, the reservoir was affected by the severe tropical storm “Beimian” [34], and the accumulated flood discharge exceeded 116 million m3. Based on the above background and according to the flood data provided by the Meishan Town government, there are three flood risk grades: once-in-20-year, once-in-50-year, and once-in-100-year. ArcGIS software was used to calculate the different inundated areas in Meishan Town. The flood inundation area was obtained from Meishan Town government, and we verified it with HEC-RAS software, the inundation area is reliable, factors affecting flood scale include flood volume, data accuracy and topographic. The research site and inundated area map is shown in Figure 1.

2.2. Route Planning Parameter Setting

For road nodes in the inundated area, the road connection graph is defined as a directed graph G ( V ,   E ) . The vector L ( V ¯ i , j ) indicates that pedestrian moves from the road node V i go to road node V j , and the corresponding distance walked and speed during evacuation are:
L ( V ¯ i j ) = [ L i j , V i j ] T
where vector L i j represents the road length of the pedestrian from the node V i to node V j , and V i j represents the original walking speed from the road node V i to road node V j . The speed of the pedestrian is not only affected by the road slope but also related to the influence of various factors. The total evacuation time T is affected by the following factors, which are defined as the cost function C i j = ( S i j , D i j , W R , W P ) , where S i j is the road slope, D i j is the density of pedestrians on the current road, and W R ,   W P represent the road width and the non-motorized lane width, respectively. These road factors are measured according to the actual situation of the city, and they will not affect each other.
The route chosen during evacuation is represented by the vector S ( V ¯ ) , which indicates the road chosen to reach the shelter, the vector S ( V ¯ ) is:
S ( V ¯ ) = [ { V i } , T ] T
where { V i } represents the set of road nodes that pass through, which is the set of road nodes included in the evacuation route; T is the time cost from the evacuation starting point to the shelter. Let T i j be the time from road node V i to road node V j considering the road conditions, and T = T i j .
For road slope data, the calculation method is to convert road angle into the slope, and the conversion formula of angle and slope is:
S i j = t a n ( π × A 180 ) × 100 %
where A is the angle observed from node V i to node V j . Equation (3) is used for the statistics and processing of road gradient data in the early stage. Furthermore, Google’s satellite map was adopted to map the roads and to count the number of houses on both sides of the road. There are 12,057 houses in Meishan Town (2021), and the total population is 64,000, the average population of each household is 5.34 [35]. Through the number of houses on both sides of the road, the number of people per household, and the road area, the pedestrian density of the current street can be obtained. In addition, the specific width of each road was obtained by using the distance measurement function of Google Maps, and the width of non-motorized lane was obtained by on-site measurement.

2.3. Lasso Regression Model

When the values of multiple variables are used to predict the value of a variable, the multiple linear regression model is:
y ( x ) = a 1 x 1 + a 2 x 2 + + a n x n + ε
where y ( x ) represents the speed of pedestrians, a 1 ~ a n are the regression coefficient, x 1 ~ x n are road factors that affect pedestrian speed, and ε is the random error term.
To solve the multicollinearity problem between independent variables, the most commonly-used model is the Lasso model [36]. The advantage of this model is that it can perform feature selection or variable elimination, and its loss function L is:
L = ( y ( x ) Y ) T ( Y y ( x ) ) + α a i 1 ( α 0 )
where α a i 1 denotes the shrinkage penalty with L1 regularization. To obtain more accurate prediction results and reduce the influence of multicollinearity between independent variables, α should be adjusted to minimize the L value.

2.4. Shelter Selection

Although there is an official shelter (Mingxin Village Shelter) in Meishan Town, it still has the shortcomings of remoteness and low upper limit of personnel capacity. According to the “Management Specifications for Natural Disaster Avoidance Points” issued by the Department of Civil Affairs of Fujian Province, the existing public buildings in the area should be used first and transformed into shelters, so that they have better disaster prevention functions. Therefore, public places such as schools, squares, and civil air defense projects next to the inundated area of Meishan Town are set up as natural disaster shelters. The above-mentioned locations are selected as shelters because these shelters have the advantages of large areas and solid houses compared to ordinary residential areas.

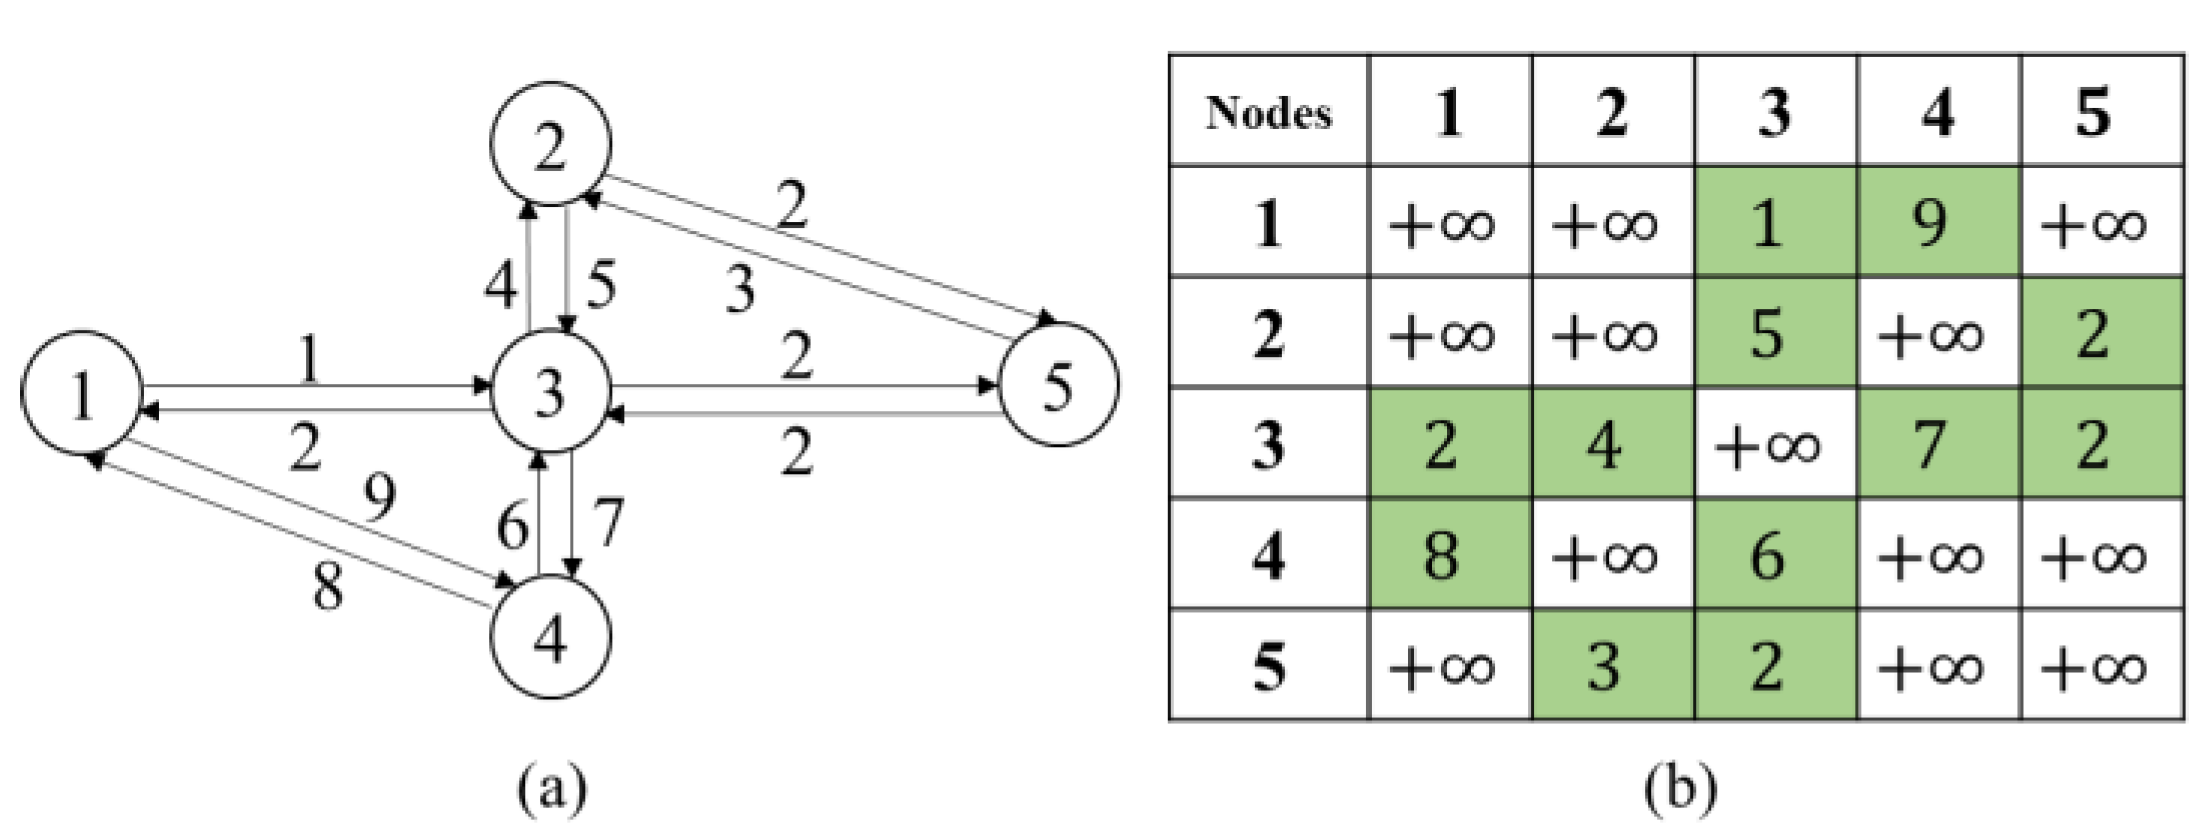
2.5. 3D Dijkstra’s Algorithm

After calculating the evacuated time of all routes, we use matrix A ( t ) to quantify the evacuation network. If the node V i and node V j in the matrix are not adjacent, the corresponding element a i j tends to + in the matrix. If node V i is adjacent to the node V j , the calculated a i j is used to represent evacuation time as Figure 2:
In Figure 2, when one point goes from 1 to 5, under the situation without considering the cycle of two adjacent points, there are 4 routes to choose, and the time spent on the departure and return trips is as shown in Table 1. When the point chooses roads in various directions, great differences exist in the time spent depending on the route chosen.

2.6. Improved 3D Dijkstra’s Algorithm Steps

The improved 3D Dijkstra’s algorithm proposed in this study aims to minimize the evacuation time. The optimization algorithm includes the following steps, and the process is as follows:
Step 1: Generate a road node matrix based on three different inundated ranges, and the matrix is used to store road information. The composition of the evacuation route E is based on n different roads. The evacuation starting point V 0 and the shelter are selected according to the inundated range and crowd density. The different roads based on the inundated range are L ( V ¯ i , j ) , i , j = 1 , 2 , , n .
Step 2: Count the positions of the shelters and select the appropriate ones according to the inundated range. With reference to the number of shelters k, shelters 1 to k are defined as V n , 1 , V n , 2 , , V n , k . All road nodes V are divided into two sets of complementary sets S and U, where S is the set of road nodes that have been obtained; initially, S only contains the evacuation starting point V 0 .
Step 3: Generate evacuation velocity formula. The time generation at the initial speed is constrained by road factors. First, it is stipulated that a road can only be passed through once. Second, the pedestrian speed should be over 0 m / s , and no negative speed is allowed. According to the previous definition, T i , j is the required single road L ( V ¯ i , j ) time. Then, T i , j = L i , j / i j f ( C ¯ i , j , V i , j ) d t is the time from node V i to node V j considering road conditions.
Step 4: Calculate T i , j between two road nodes within the inundated range and the road nodes that are not connected as + . Check whether there is a road with excessive slope and congestion; if the situation exists, skip to step 6; otherwise, skip to step 5.
Step 5: Generate the evacuation time set, when pedestrians walk on the three-dimensional road in the inundated range, the total evacuation time T is T = T i j = [ T 0 , 1 , T 1 , 2 , , T n 1 , n ] = L i , j / i j f ( C ¯ i , j , V i , j ) d t   ( i = 0 , 1 , 2 , , n 1 ,   j = 1 , 2 , , n ) . Assuming that there are k routes E from the evacuation starting point to shelters, and the route corresponding to the smallest T is the optimal evacuation route.
Step 6: Add the road slope and road congestion as attributes to the road. In this step, the constraints of road congestion and impassability will be considered to make the evacuation route more realistic condition. For roads with slopes that are too steep and road congestion, the corresponding T i , j is recorded as + , and go to step 5.
The difference between the improved algorithm in this study and the previous algorithm is that the pedestrian evacuation time is taken as the evaluation standard. Compared with the previous urban shortest path evacuation algorithm, improved 3D Dijkstra’s algorithm considers the road slope, improves the evacuation model to a 3D evacuation route, and adds factors such as road width and pedestrian density to the pedestrian speed, and optimizes the existing shelter and reasonably selects the best shelter.

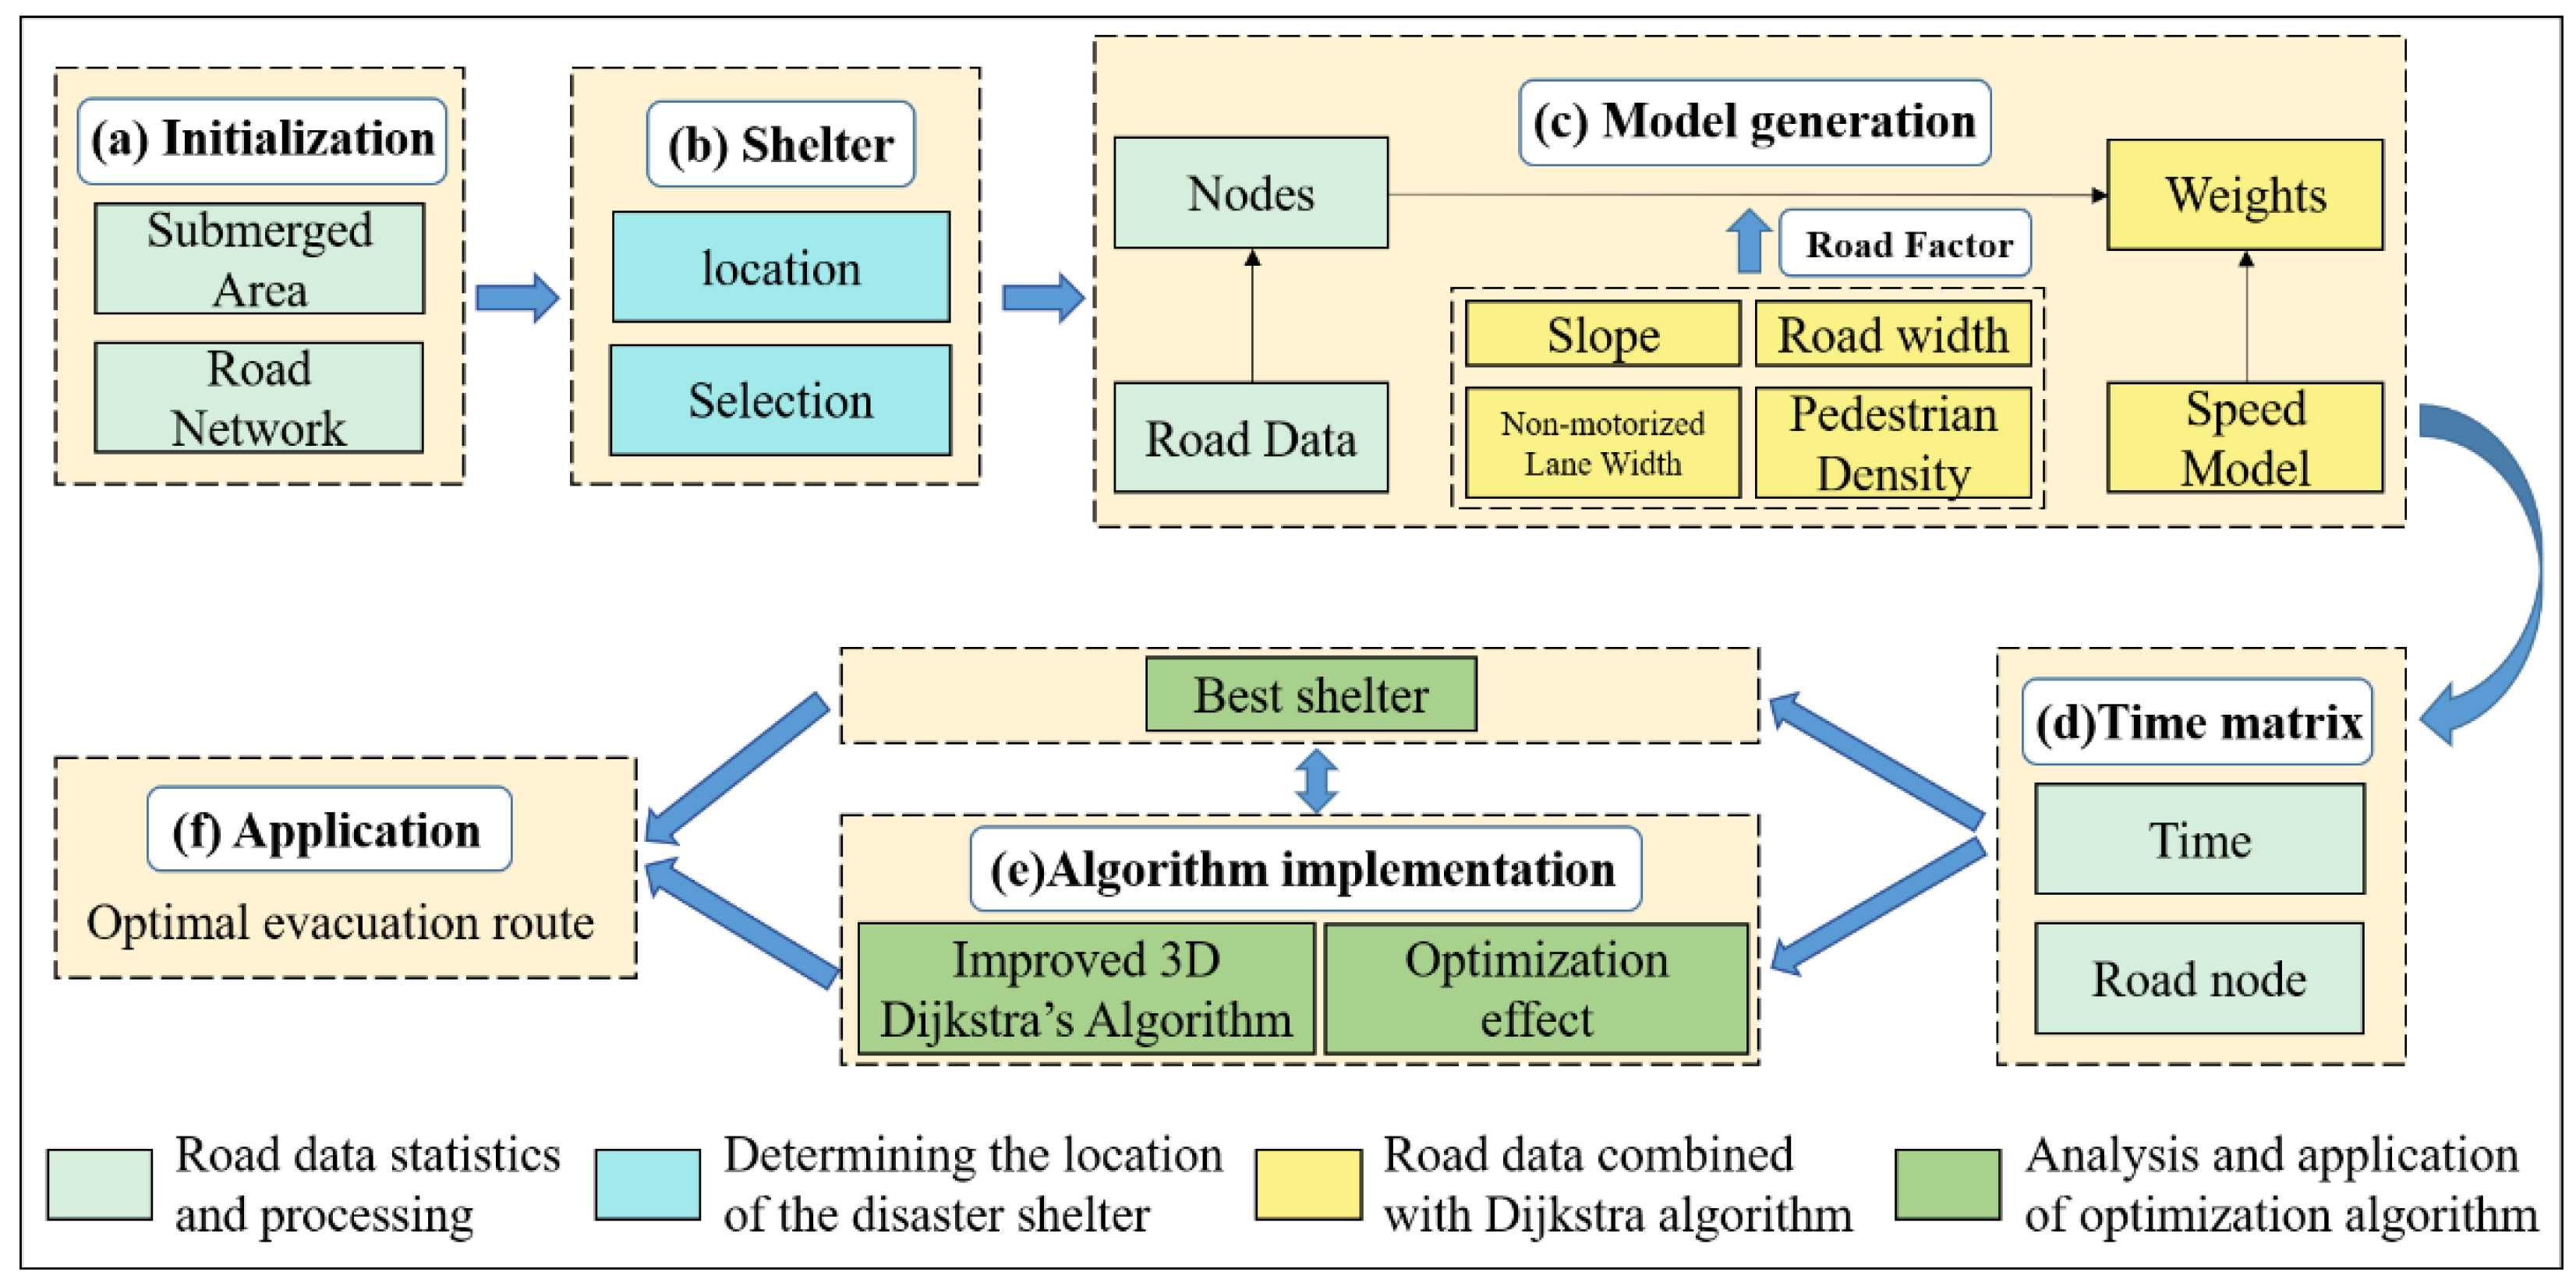
2.7. Workflow of Optimal Evacuation Route Planning

Based on the above research and analysis, improved 3D Dijkstra’s is adopted to optimize pedestrian route planning, which selects the optimal evacuation route under the constraints of road factors in the inundated areas under different flood levels. The workflow of the method is as shown in Figure 3. It is mainly divided into six parts, which can be summarized as follows: (a) inundated area and road node statistical analysis; (b) evaluation and selection of the available shelters; (c) pedestrian speed analysis model; (d) obtain the storage time matrix between road nodes; (e) realize the improved 3D Dijkstra’s algorithm and find the best shelter; (f) method application to find the optimal evacuation route.

3. Results

3.1. Road Node Statistics

The statistics of road nodes is as shown in Figure 4. The intersection between each two roads and the end of the road are regarded as a road node. Taking the inundated range under the once-in-50-year flood as an example, the road node statistics are carried out for the inundated range, there are 402 road nodes.

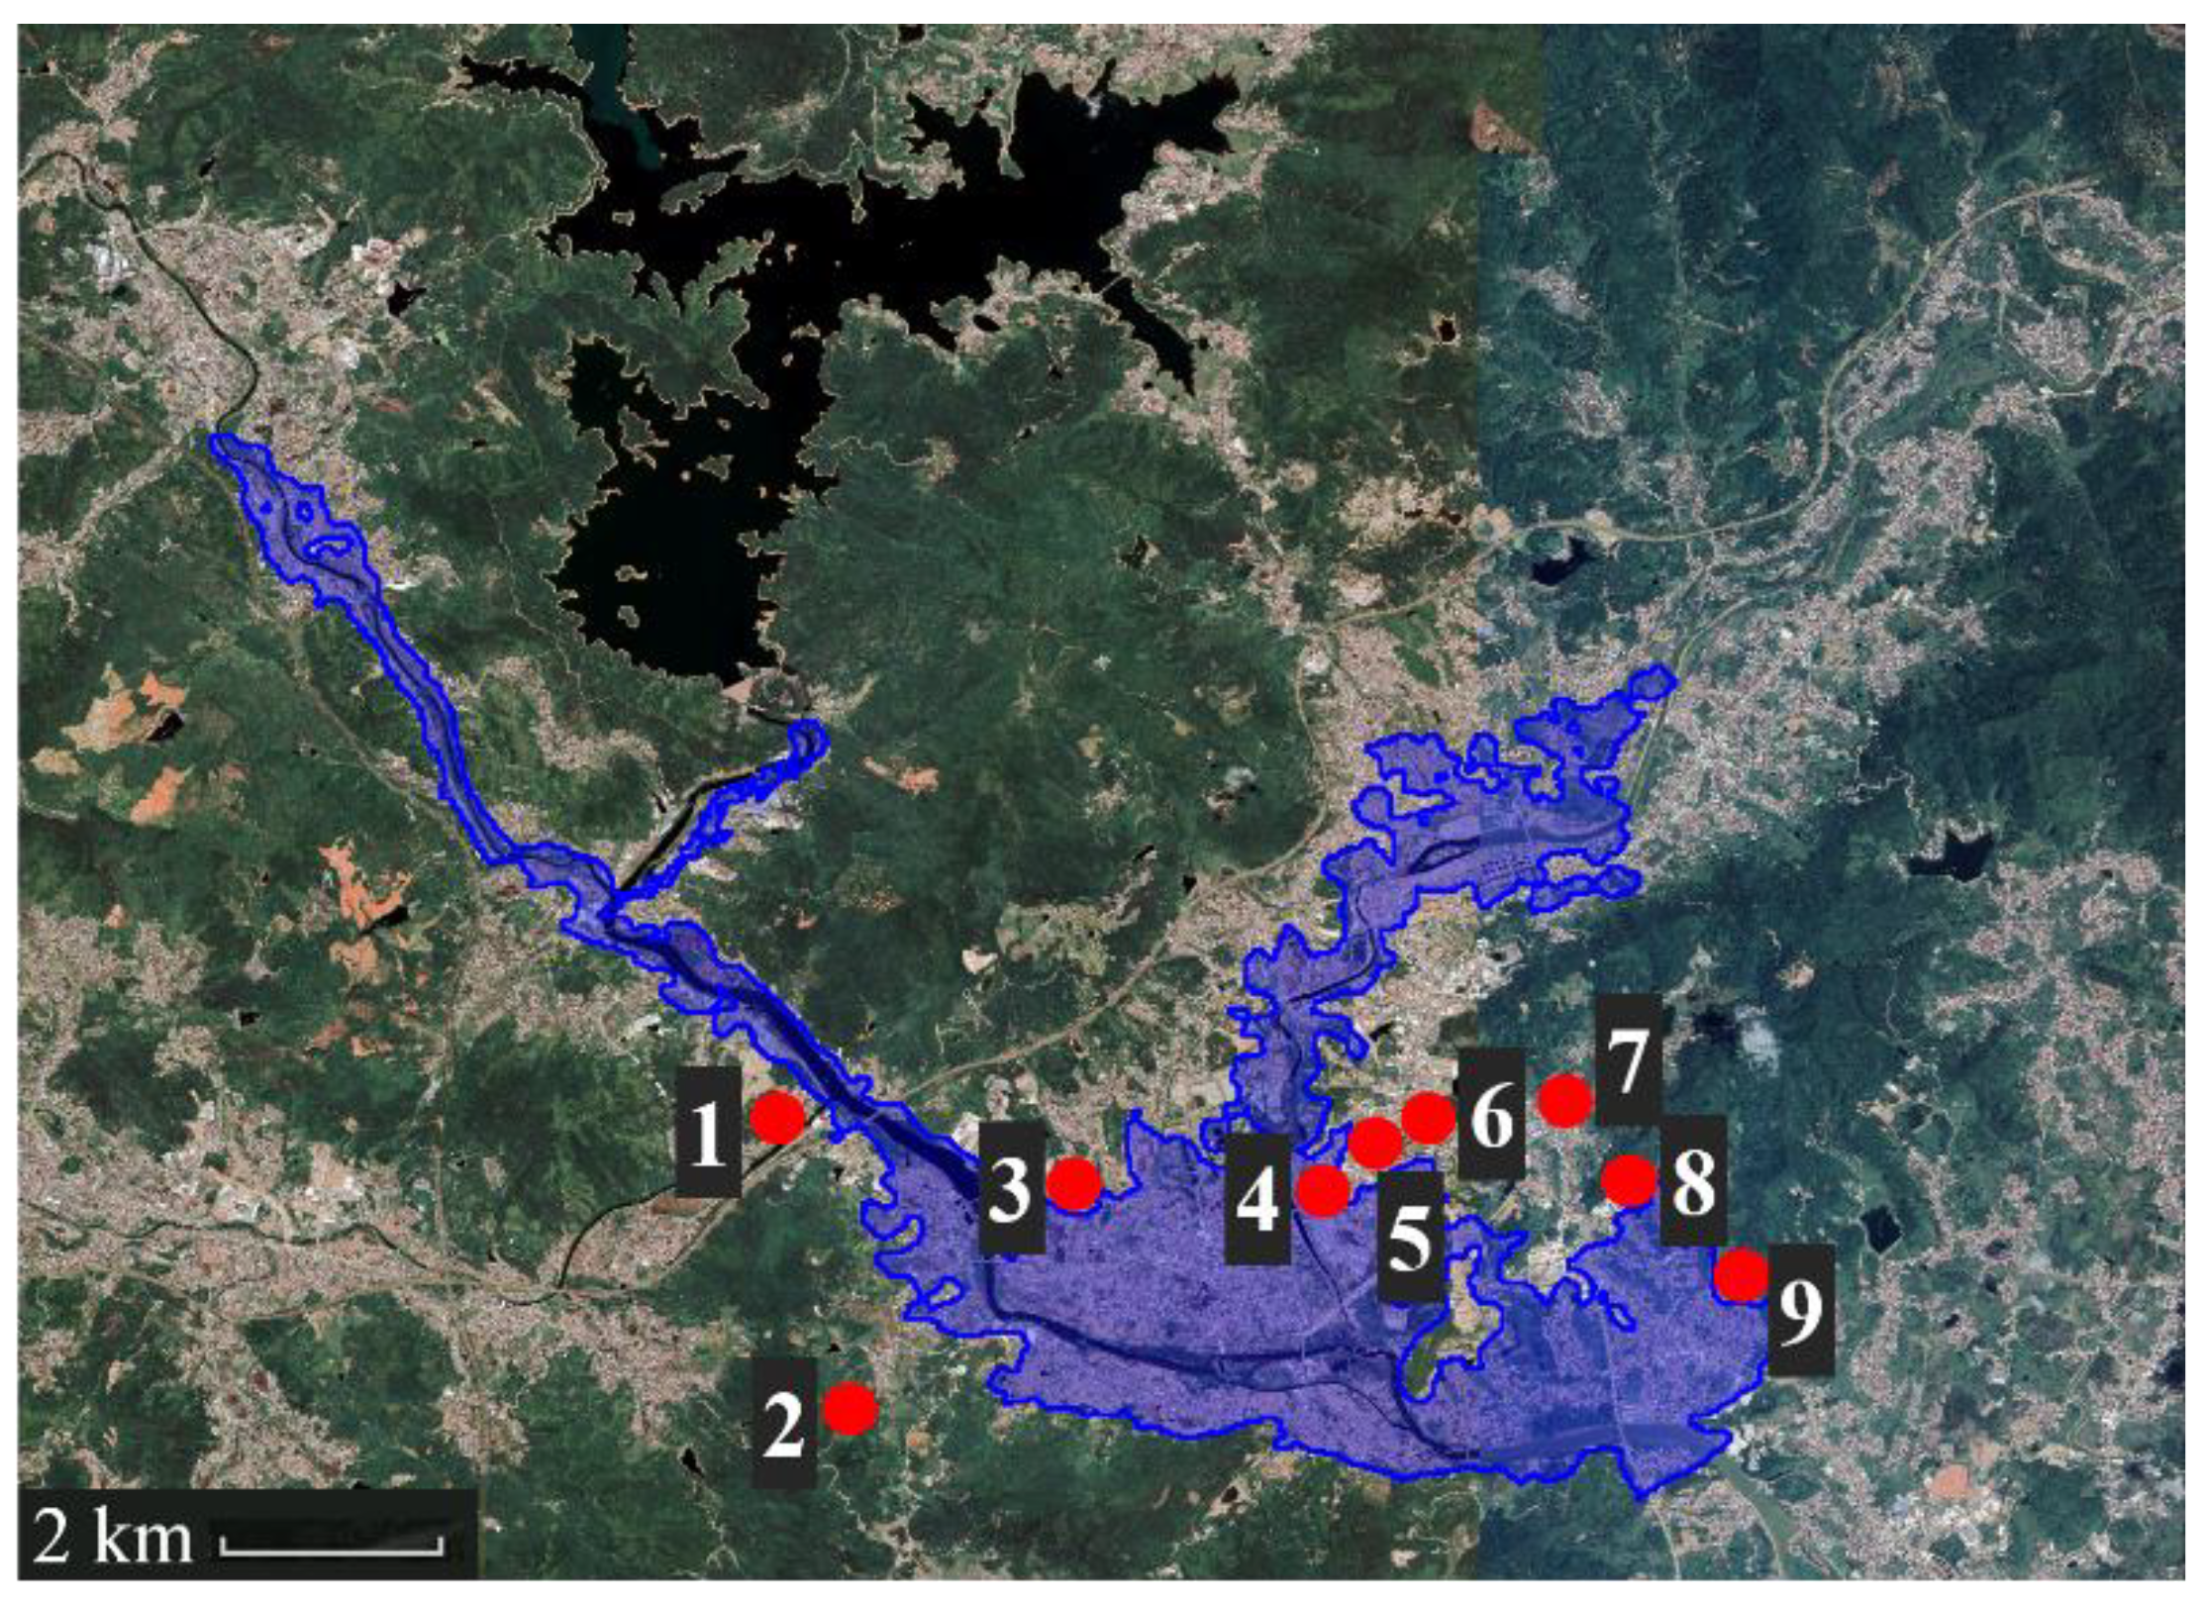
3.2. Locations of Available Shelter

The selection of shelters is crucial to the reasonable evacuation of personnel. For the flood once in decades, the scope of flood inundation is very wide, and a large number of people need to be evacuated. According to the shelter selection method and the regulations issued by Fujian Province, multiple selections of shelters under different flood levels are considered. Taking the situation of flood once-in-50-year as an example, nine available shelters in Meishan Town were selected. These areas include (1) Shuikou Village Primary School; (2) Xiaoziting Tourist Attraction; (3) Nan’an Lanyuan Middle School; (4) Guozhuan Middle School; (5) Guoguang Middle School; (6) Guoguang Second Middle School; (7) Mingxin Village Shelter (official shelter); (8) Fengxi Primary School; and (9) Puzai Village Liutang Central Primary School, which are marked using red dots in Figure 5.

3.3. Pedestrian Speed Analysis

In this study, for the weight of the evacuation route, the factors considered include road slope, pedestrian density, road width, and non-motorized lane width. According to the experimental results of some scholars [37], 60 groups of sample data on pedestrian walking speed were obtained.
According to the experimental data, after analyzing the influence of various factors on the pedestrian speed, the following speed formula can be obtained:
V f i j = 1.030 + 0.051 * W P + 0.018 * W R 1.095 * D i j
where V f i j is the speed of the pedestrian walking on the road. When the other variables remain unchanged, the width of the non-motorized lane ( W P ) increases by one meter, and the average speed of pedestrians increases by 0.051 m / s . When the width of the road ( W R ) increases by one meter, the average speed of pedestrians increases by 0.018 m / s . When the pedestrian density on the current street increases by 0.1 p / m 2 , the average speed of pedestrians decreases by 0.1095 m / s .
The road in the 2D situation is converted into the road in the 3D situation. The formulas of the speed when going uphill and downhill are, respectively:
V s u i j = 1.272 0.013 * | S i j | , S i j > 0
V s d i j = 1.272 + 0.006 * | S i j | , S i j 0
where V s u i j and V s d i j are the speeds of the pedestrians walking on the road considering the slope. The analysis shows that the walking speed will descend by 0.013 m / s with a one-degree increase in slope and rise by 0.006 m/s with a one-degree decrease in that. In the case of uphill, the slope has a greater impact on the physical strength. To maintain physical strength, the speed changes more than that of the downhill.
The evacuation time between the road nodes can be stored in the time storage matrix. The schematic diagram of the calculated evacuation time storage matrix is as shown in Figure 6: for example, 61.2 indicates that the pedestrian takes 61.2 s from road node 1 to road node 2, and 74.9 indicates that the pedestrian takes 74.9 s from road node 2 to road node 1, road nodes 1~4 and 399~402 have been marked with red numbers in Figure 4. The green cells indicate that the road node i is connected to road node j. In Dijkstra’s algorithm, + indicates that road node i in Meishan Town is not connected to road node j, that is, the time from road node i to non-adjacent road node j tends to infinity.

3.4. The Optimal Shelter

In order to meet the requirements of shelters, a large amount of funding is required for upgrading existing buildings and purchasing emergency equipment. Therefore, selecting the optimal shelter can not only meet the requirements of shortening evacuation time, but also cost less money. This study first calculates the time from all nodes in the inundated area to a certain shelter, and all the times are averaged. Then we compare the average time from all starting points to each shelter, and the shelter with the shortest average evacuation time is the optimal shelter. The average evacuation time corresponding to different shelters under different flood levels is as shown in Table 2.
For different shelters, numbers one to nine are set in sequence according to the distance between the shelter and the inundated center. The center of the inundated area in this study is the average value of the longitude and latitude of all road nodes in the inundated area. When the evacuation route under the improved 3D Dijkstra’s algorithm is adopted, for shelters one to nine under the once-in-50-year flood, the pedestrian evacuation time corresponding to shelter one is the shortest, which is 2359.65 s. Therefore, under the inundated range of once-in-50-year flood, the Guozhuan Middle School was selected as the optimal shelter. While for the once-in-20-year flood, the optimal shelter is still Guozhuan Middle School, and the shortest average evacuation time is 2303.70 s. The result of average evacuation time is mainly determined by the distribution of shelters and inundation areas. The larger the inundation range, the longer the average evacuation time of all shelters. When some newly-added inundated areas are close to the shelters, the evacuation time of the whole inundated area will be shortened. When faced with once-in-100-year flood, the inundated range is larger than that of once-in-50-year flood. Some shelters are drowned, and the only shelters available at this time are Guoguang Middle School, Guoguang Second Middle School, Shuikou Village Primary School, and Xiaoziting Tourist Attraction. When Guoguang Middle School is selected as the optimal shelter, the average evacuation time of pedestrians in the inundated area to this point is the shortest of 2219.04 s. Therefore, Guoguang Middle School was chosen as the optimal shelter in the case of once-in-100-year flood. The reason why the average evacuation time under once-in-100-year flood is less than that of the once-in-20-year and once-in-50-year flood is because that compared with the existing further inundation area, the additional inundation area under the once-in-100-year flood is closer to the shelters, thus reducing the overall average evacuation time.

3.5. Improved 3D Dijkstra’s Algorithm

By calculating the evacuation time of different starting points before and after optimization, the optimization effect of the algorithm is analyzed. This study selected nine evacuation starting points (yellow dots 1–9) within the inundated area according to the distribution of population density, and the evacuation starting point remains the same in the three inundated areas. In addition, the optimal shelter Guoguang Middle School (green dot) is not inundated under the three situations, therefore it is selected as the only destination of the evacuation nine starting points. The inundated areas and saved time under the three floods amounts are as shown in Figure 7, Figure 8 and Figure 9. The saved time is the difference in evacuation time between the 3D Dijkstra optimization algorithm and the unoptimized Dijkstra algorithm. The improvement rate is the improved efficiency of the optimized algorithm compared with the unoptimized algorithm. In the evacuation simulation process, we take the shelter as the end point of the evacuation path, and the home of the residents, that is, different road nodes, as the evacuation starting point for pedestrians.

3.6. Shelter Coverage

By using the improved 3D Dijkstra algorithm, we can obtain the time when each evacuation starting point in the flooded area reaches the nine potential shelters, calculate the shelters with the shortest evacuation time corresponding to each starting point in turn, and divide the road nodes corresponding to the same shelter into a shelter coverage range. Within this range, the pedestrian evacuation time to the corresponding shelters is the shortest, and finally divide the nine shelter ranges, as shown in the Figure 10. According to the distance calculation, the maximum radius of shelters 1–9 is 1830 m, 1990 m, 2250 m, 2830 m, 3130 m, 650 m, 1350 m, 1810 m, and 3190 m, respectively.

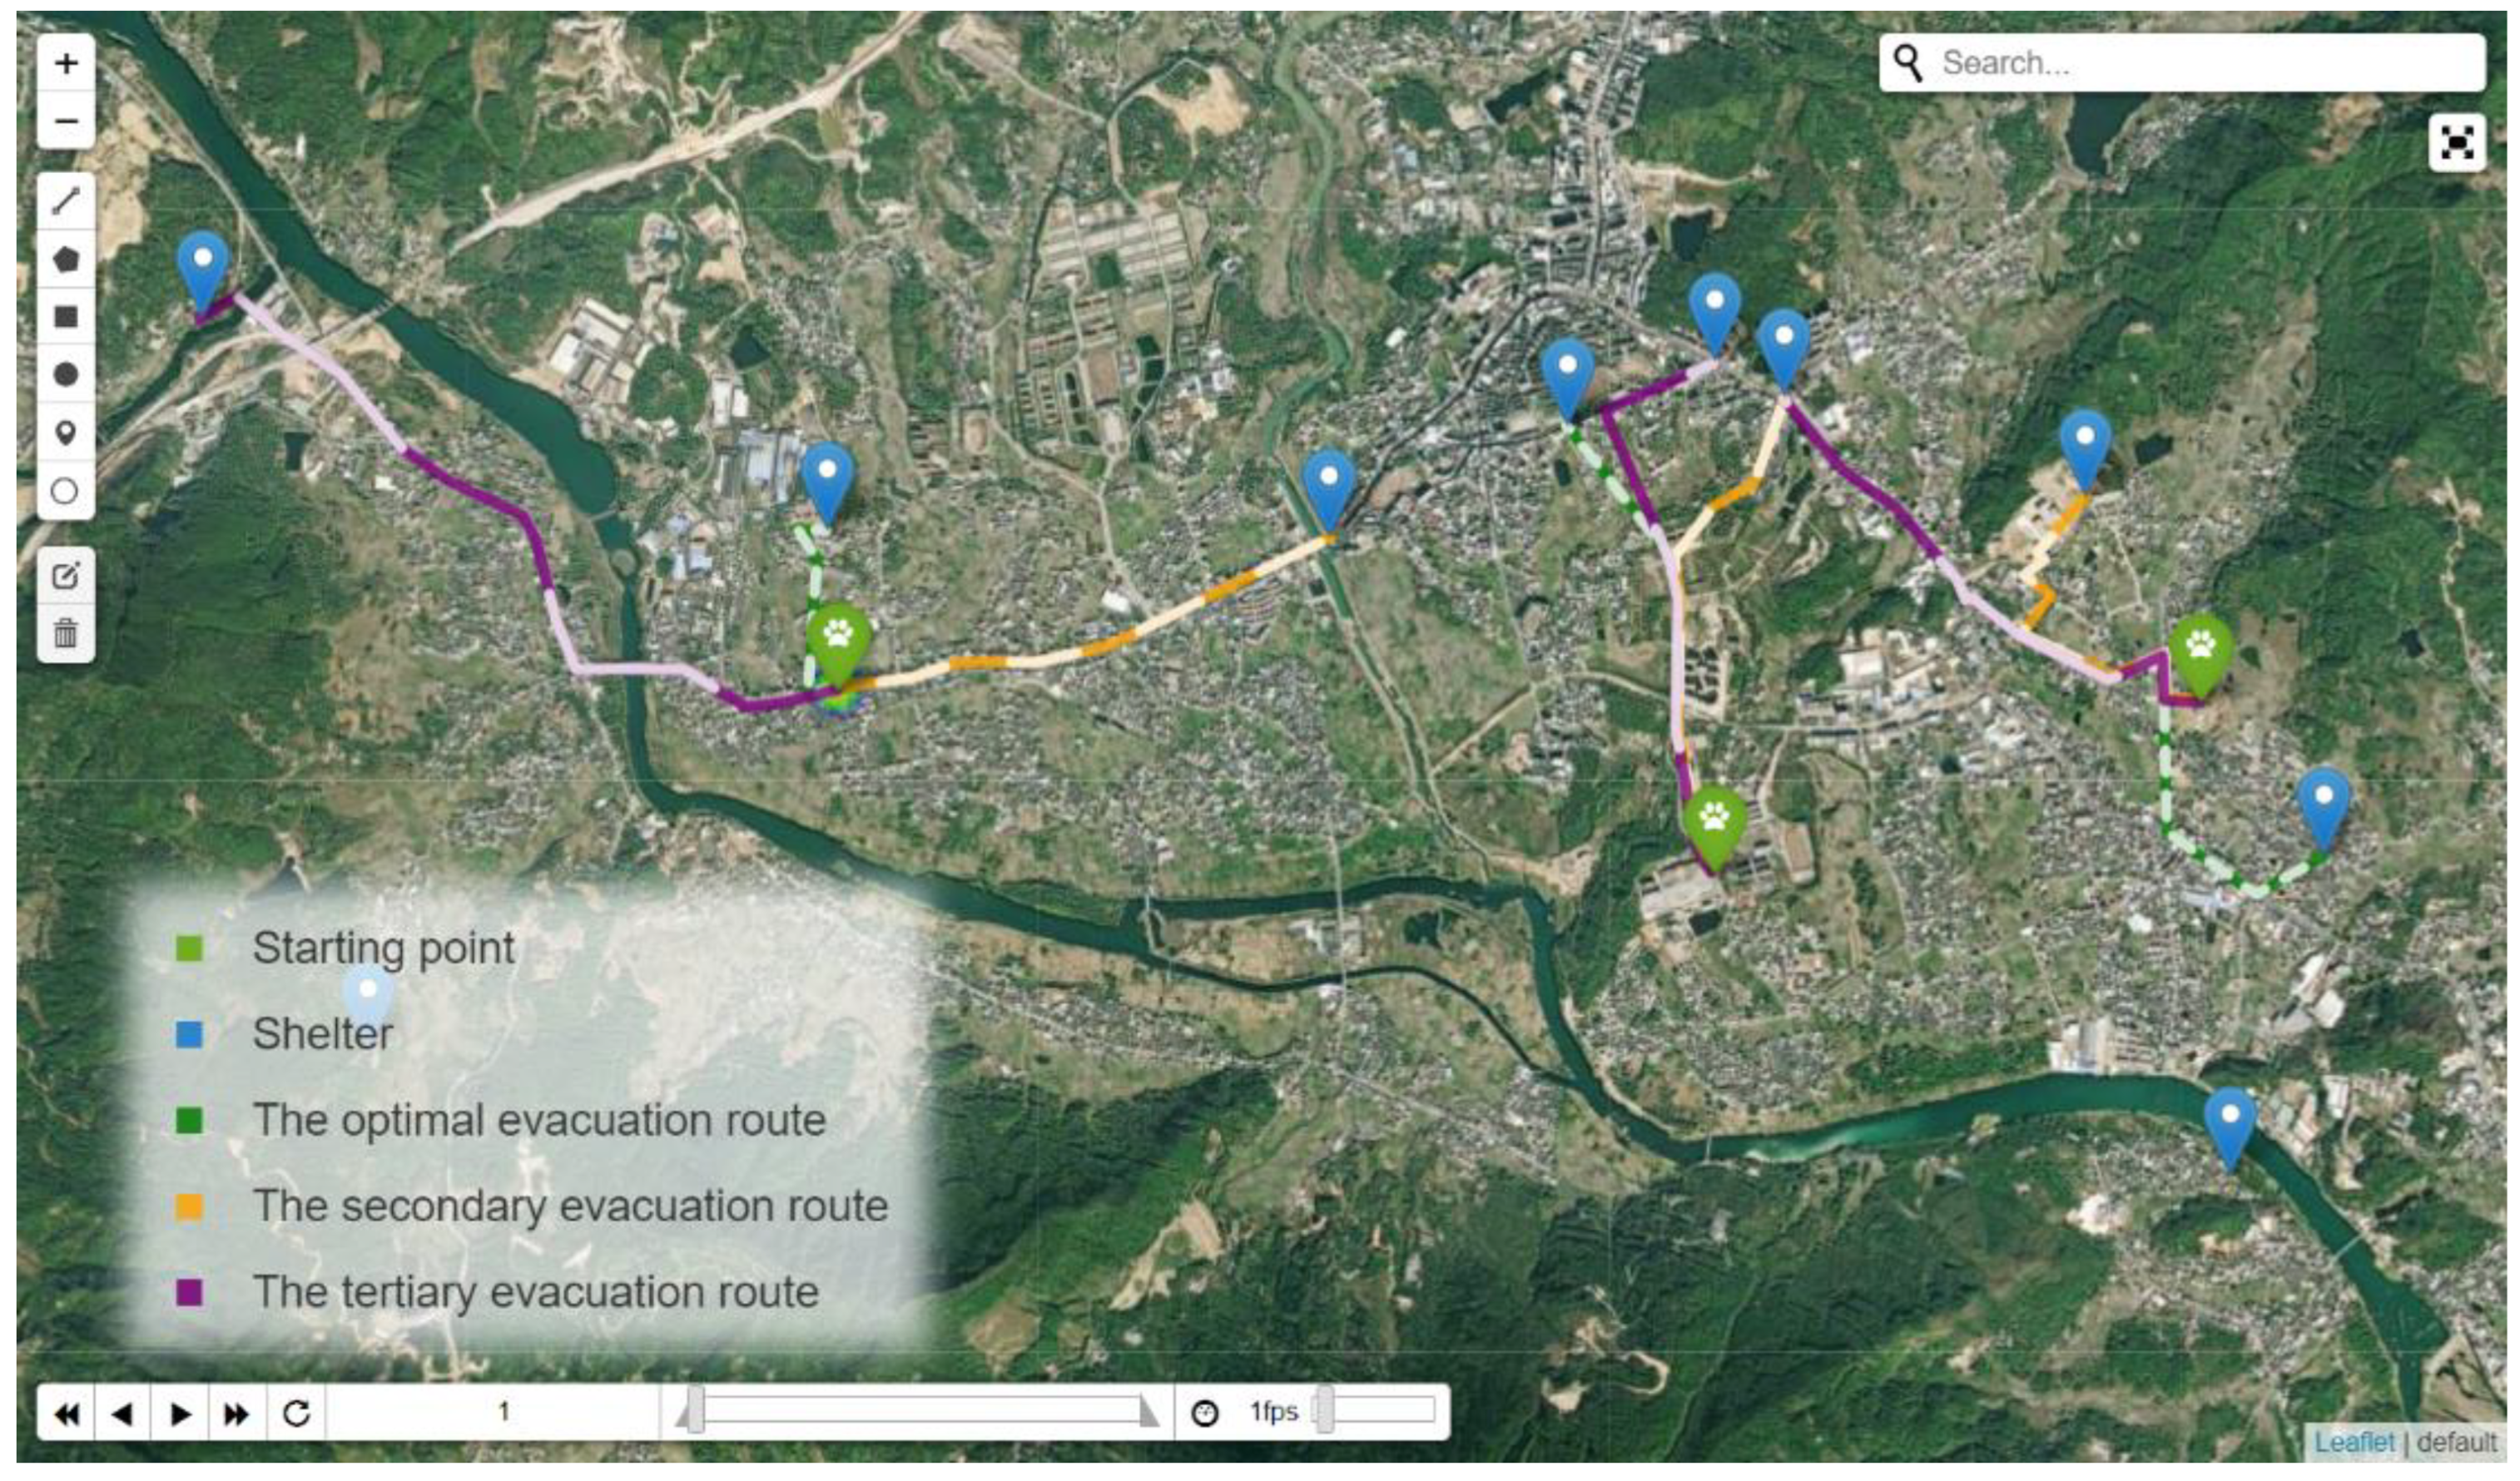
3.7. Model Application and Software

There is no relevant evacuation route software for urban flood disaster on the Internet at the moment. Therefore, this study has developed a fast, convenient map evacuation route software for urban decision-makers to evacuate people reasonably. At the same time, in the actual situation, each evacuation starting point will choose the shelter with the shortest escape time as the evacuation destination; that is, different evacuation starting points will choose different optimal shelters. For each road node in the inundated area, we find the shelter with the shortest evacuation time and give multiple alternative evacuation routes. The tool used to develop the software is Python, and the Google API is used to improve the map function, including Google Maps and the folium library.
The interface of this software is shown in Figure 11, this map can be dragged, zoomed in, and zoomed out. The blue spot is the shelter, the green route is the optimal route, and the evacuation time is the shortest. The orange route is the secondary evacuation route, and the evacuation time on it is medium. The purple route is the tertiary evacuation route, on which the evacuation time is the longest, and all routes are dynamically rolled.

4. Discussion

4.1. Optimal Shelter Location

At present, there is only one Mingxin Village Shelter for residents to evacuate. According to the selection of the optimal shelter in the previous study, when we set the new shelter in Meishan Town, Guozhuan Middle School, and Guoguang Middle School can be selected. Compared with the only existing shelter of Mingxin Village Shelter, the new one of Guozhuan Middle School can save evacuation time by additional time of 904.68 s and 400.74 s under the flood of once-in-20-year and once-in-50-year (Table 2). In addition, the Mingxin Village Shelter is inundated under the flood of once-in-100-year, the optimal shelter calculated by the algorithm is the Guoguang Middle School. From the results, the improved 3D Dijkstra’s optimization algorithm has an excellent effect on the selection and optimization of shelters and the saving of evacuation time.
The optimal shelter can be determined by combining the available shelter location selection method proposed in this study with improved 3D Dijkstra’s algorithm, the evacuation time of pedestrians to the available shelter can be obtained. By calculating the average evacuation time of pedestrians from all road nodes to available shelter, the available shelter with the average shortest evacuation time is taken as the optimal shelter. Compared with the existing Mingxin Village Shelter, the average evacuation time of all pedestrians can be shortened. Thus, the optimal shelter position can be determined by scientific method for the first time.

4.2. Time Optimization Effect

Under the condition of once-in-100-year flood, the evacuation improvement rate in this area reaches highest, the maximum evacuation efficiency is increased by 17.78% (Figure 9). For the flood conditions of once-in-20-year and once-in-50-year, the maximum evacuation efficiency can be increased by 7.59% (Figure 7) and 11.78% (Figure 8). The improved 3D Dijkstra’s algorithm in this study can shorten the evacuation time. That is because, as the distance between the evacuation starting point and the shelter increases, the change of route saves more and more time, and the improvement rate is also higher and higher. In addition, as the increase of inundated area and road lines, the road factors become more complex. Therefore, the improvement effect of some evacuation starting points is remarkable, and the overall time saved and improvement rate is generally improved.
In order to make the conclusion universal, avoid the contingency of experiment, this study also verified the overall optimization effect of the algorithm. The saved time and optimization efficiency of each road node in the inundated area is calculated in Table 3.
The 2D time calculation only consider the road length, and the pedestrian speed is not affected by the terrain. In addition, the 3D time is the time from evacuation to the shelter considering the slope and street factors. According to the research results, as the distance between shelters 1~9 and the inundated center gradually increases, more evacuation time is saved. The corresponding evacuation efficiency is improved by using the improved 3D Dijkstra’s algorithm. The reason is that as the distance increases, because of the uncertainty of the road factors, the number of optional new routes from the evacuation starting point to the shelter increases. Therefore, the farther the shelter is from the inundated center, the more time that can be saved by the algorithm proposed in this study, which also proves that the optimization effect of the algorithm is better. The reason why the average improvement rate is between 1% and 6%. It is because some areas that are closer to the shelter pull down the overall average improvement rate. For evacuation starting points far from the shelter, the results have confirmed that in the flood of different levels, the improvement rates can reach 7.59%, 11.78%, and 17.78% (Figure 7, Figure 8 and Figure 9).
Compared with the 2D Dijkstra algorithm [38] that does not consider the road factors, the algorithm proposed in this study can abandon the narrow and congested roads with large slopes. It then chooses the road with faster pedestrian speed which can save the evacuation time. In addition, compared with the current only Mingxin Village Shelter, through the increase of available shelters, available shelter with shorter evacuation time and closer distance will be adopted by pedestrians.

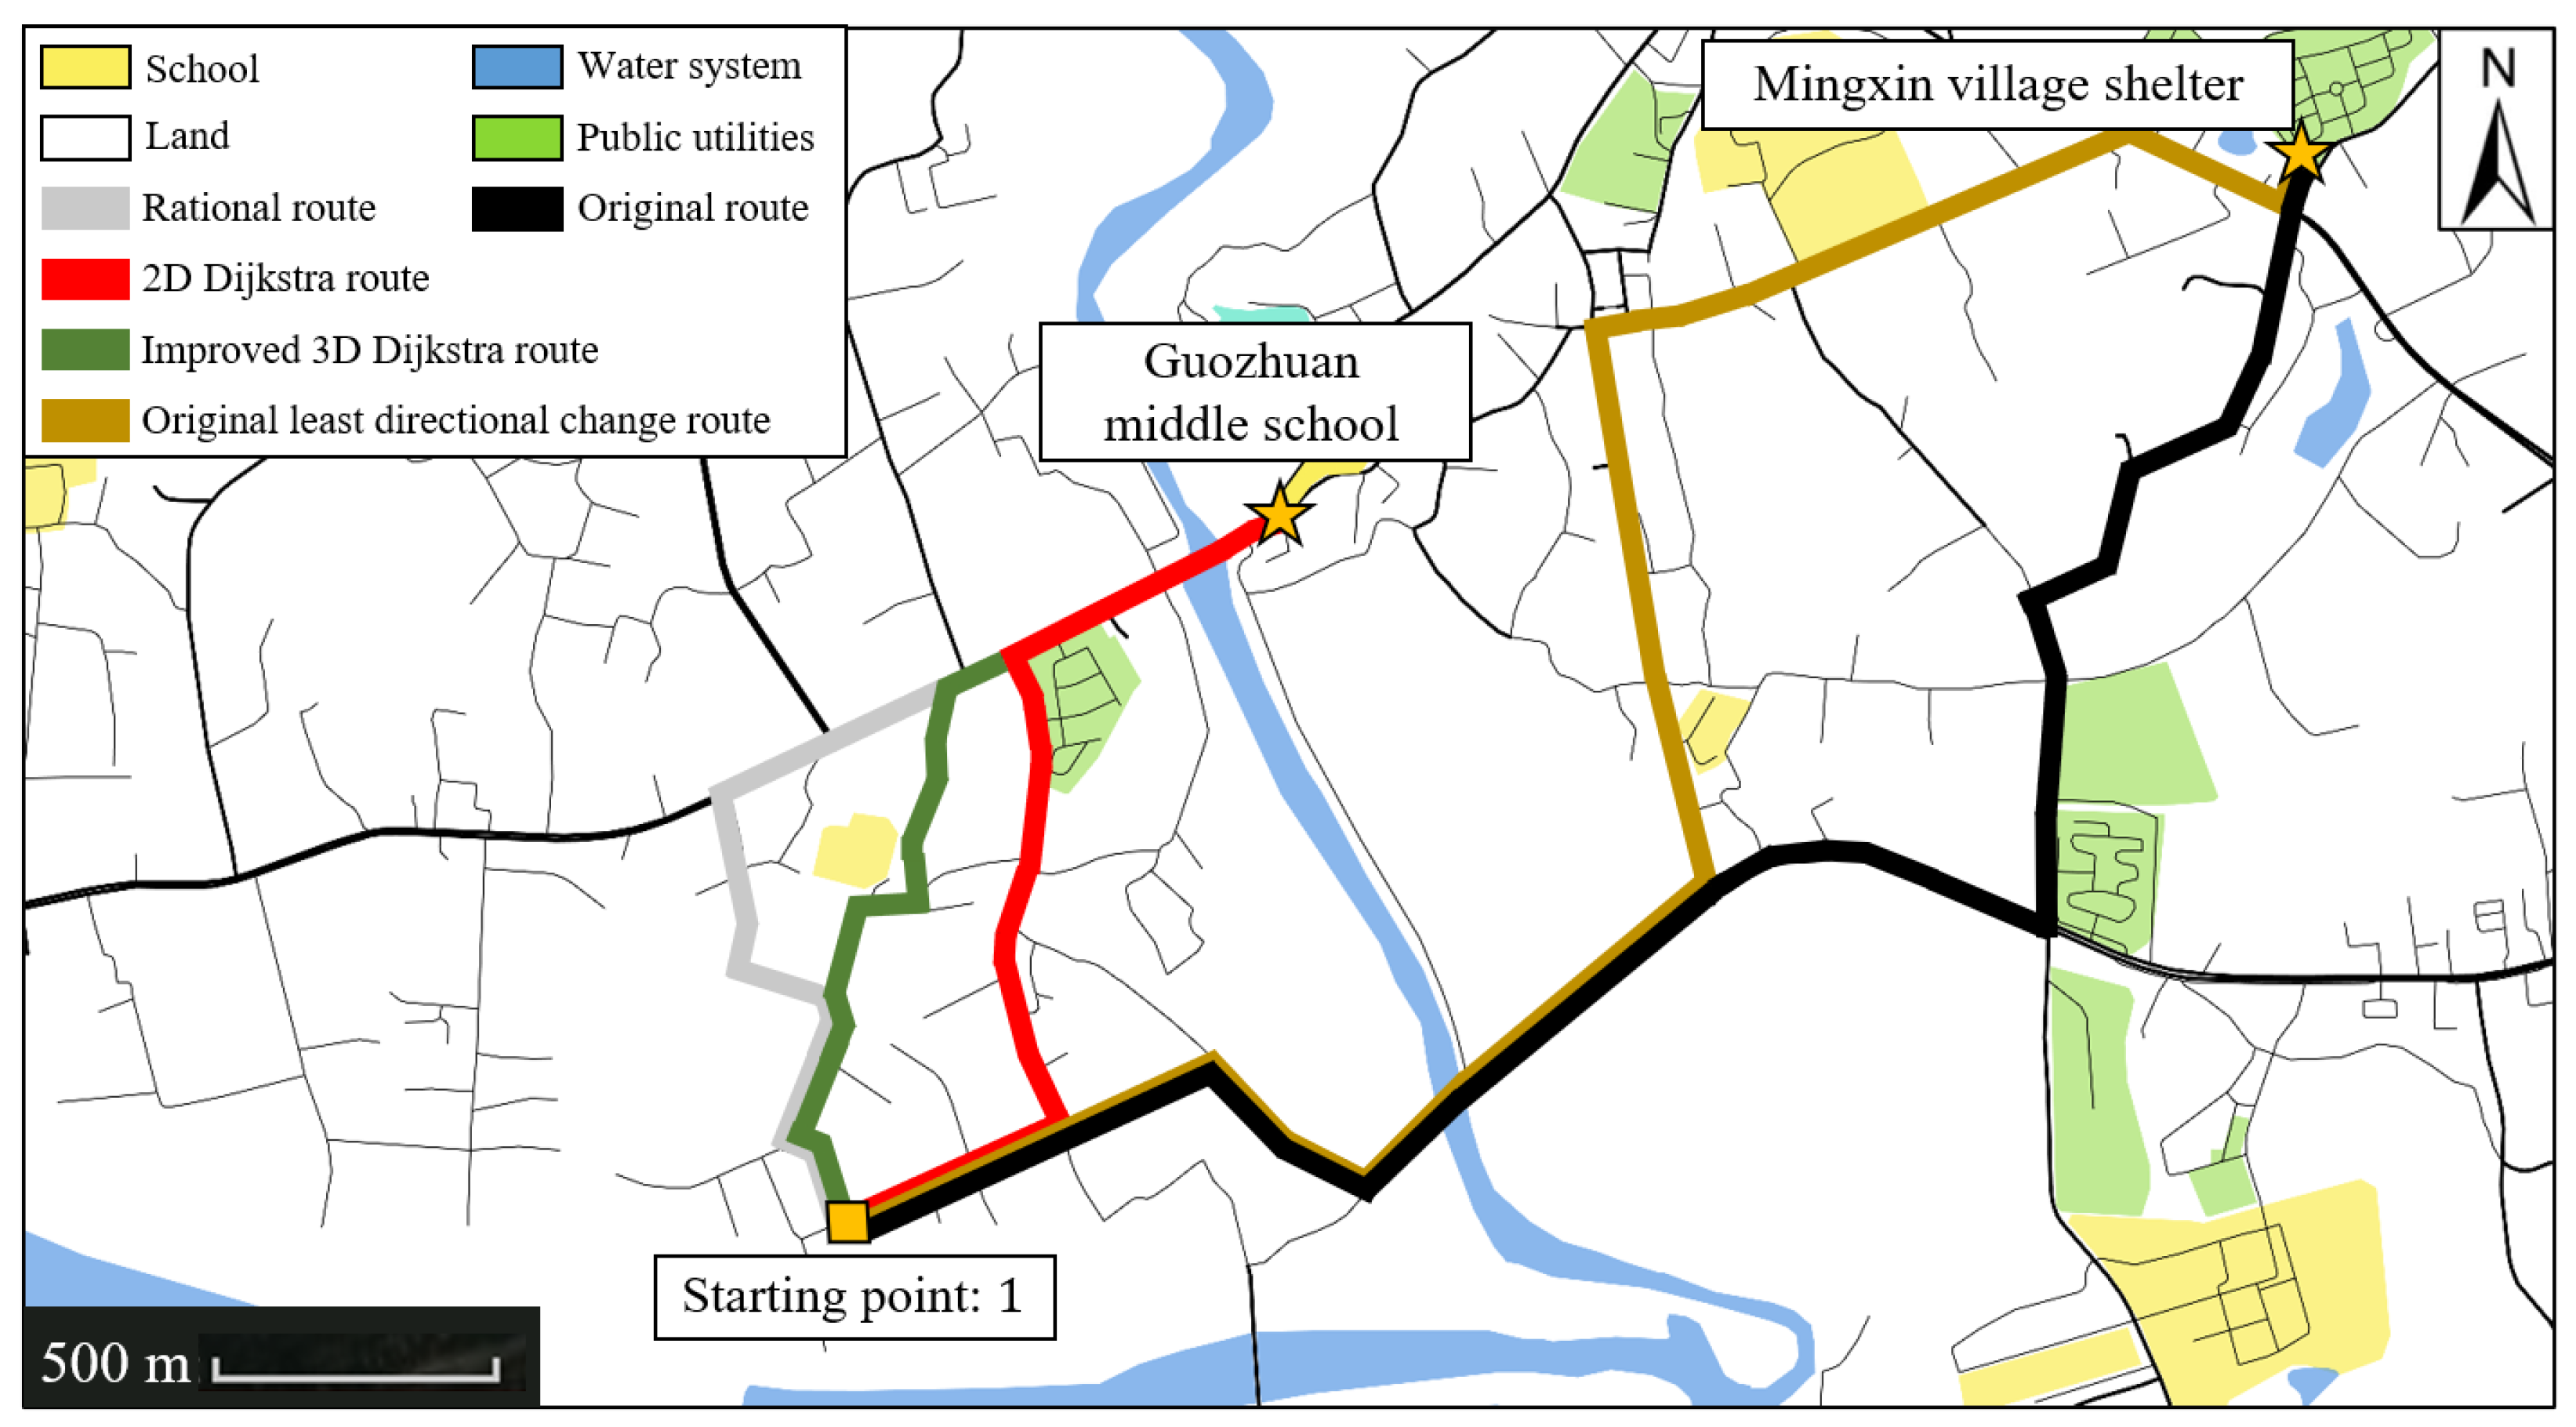
4.3. Comparison between Ours and Other Methods

At present, there is only one shelter in Meishan Town. It will take a lot of time if everyone goes Mingxin Village Shelter. Therefore, according to the proposed available shelters’ location and the improved 3D Dijkstra’s algorithm in the above research. Taking the evacuation starting point one as an example, when facing the flood of once-in-50-year, some better evacuation routes than the existing Mingxin Village Shelter are selected (Figure 12). The comparison models used are the original route, 2D Dijkstra route, rational route [39], and original least direct change route [40].
The destination of the original evacuation route is Mingxin Village Shelter, and the evacuation time is 2706.35 s. The evacuation time of rational route and 2D Dijkstra route is 1430.85 s and 1328.34 s, respectively, and the evacuation time of original least directional change route is 2880.90 s. In addition, the shortest evacuation time calculated by the improved 3D Dijkstra algorithm is 1202.54 s, 1503.81 s less than the original route.
The original route is limited by the location of the shelter and road factors, so the evacuation time is longer. The original least directional change route has a better effect on pedestrians in short-distance evacuations but does not play a good role in long-distance evacuations. The rational route aims to reduce the evacuation time of pedestrians in small spaces, tends to choose more spacious roads, and the choice of routes is biased towards subjective decision-making. The 2D Dijkstra route aims to minimize the evacuation distance, the actual evacuation time will increase due to the large road slope and blocked road. Finally, the optimal evaluation route planning based on the improved 3D Dijkstra’s algorithm proposed in this study can formulate the optimal evacuation route according to the location of available shelters and actual road conditions, taking full account of road factors and current location, and pedestrians can evacuate to the shelter in the shortest time to ensure the life safety and avoid the threat of floods.

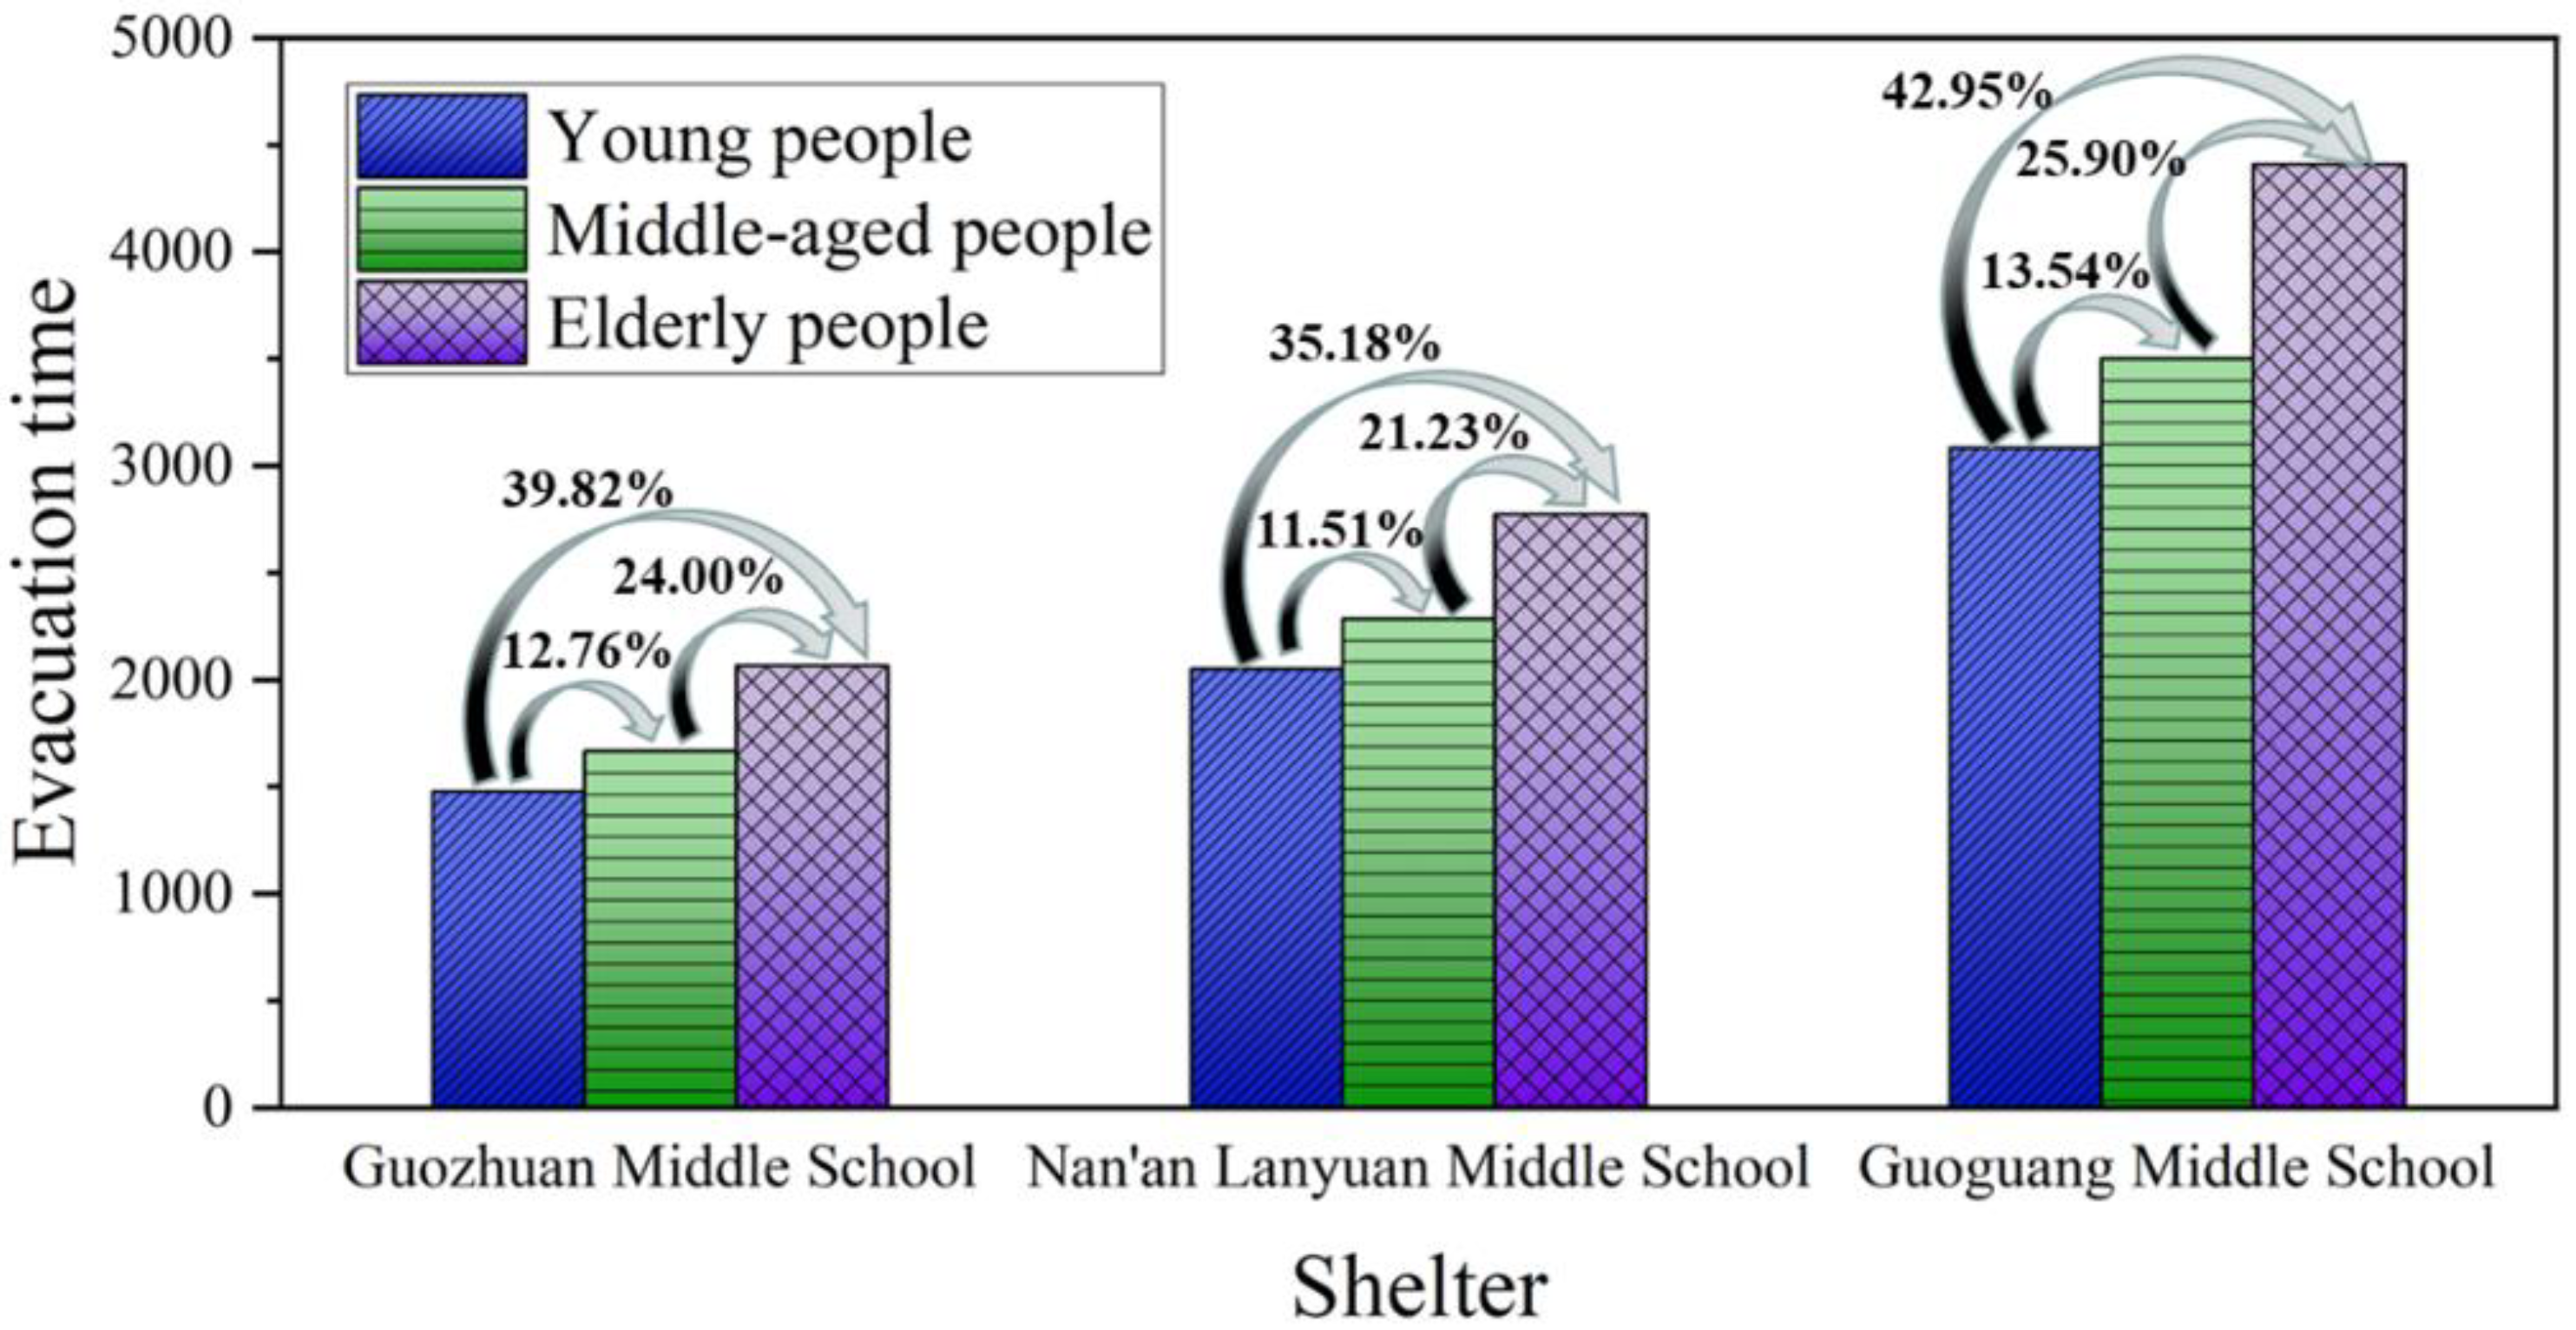
4.4. The Effect of Age on Evacuation Speed

For people of different ages, the young and middle-aged people can maintain a stable speed. For the elderly people, the walking speed decreases rapidly with the increase of age. According to the data analysis results [41], the age is divided into young people (20–40), middle-aged people (40–60), and elderly people (60–100) to study the influence of age on speed. According to the age and speed formula, the equation is:
y = 1.63 0.006 x ,   ( 20 < x < 99 )
where x is the age and y is the pedestrian speed. We took starting point one (Figure 12) as the starting point for evacuation and found that the shelters with the shortest average evacuation time were Guozhuan Middle School, Nan’an Lanyuan Middle School, and Guoguang Middle School. Therefore, this research first calculates the shortest evacuation time for young, middle-aged, and old people from starting point 1 to Guozhuan Middle School. Then, the evacuation time of different age groups to go to Lanyuan Middle School and Guoguang Middle School in sequence were calculated. The influence of age on pedestrian evacuation time is shown in the Figure 13.
It can be seen from the Figure 13 that age has a great impact on the evacuation time of pedestrians. Compared with young people, the evacuation time of middle-aged and old people increased by 12.60% and 39.32% on average. In addition, the evacuation time of old people increased by 23.71% on average compared with the middle-aged people. The reason is that the step frequency and length of people of different ages are quite different, and the elderly people are most affected, and the evacuation time is the longest. Therefore, the elderly people should be evacuated first.

4.5. Limitation and Outlook

The improved 3D Dijkstra’s algorithm is proved to be effective by verifying the effect of evacuation route under flood. In addition, since this algorithm is used for route analysis of possible flood inundation areas, this method is also applicable to evacuation route selection under possible inundation range caused by rainstorm or inland flood. Since the behavior of pedestrians during the evacuation from the actual urban road network is complicated, in future work, the real-time dynamic changes in pedestrian density and the sequential passage of pedestrians through narrow intersections will be considered in route planning, as well as the crowding behavior of pedestrians.

5. Conclusions

Our study proposes an optimal evacuation route planning based on improved 3D Dijkstra’s algorithm for pedestrian evacuation under different flood risks. The optimization effect of the algorithm is actually tested in Meishan Town to verify the practicability of the algorithm. The main conclusions are as follows:
(1)
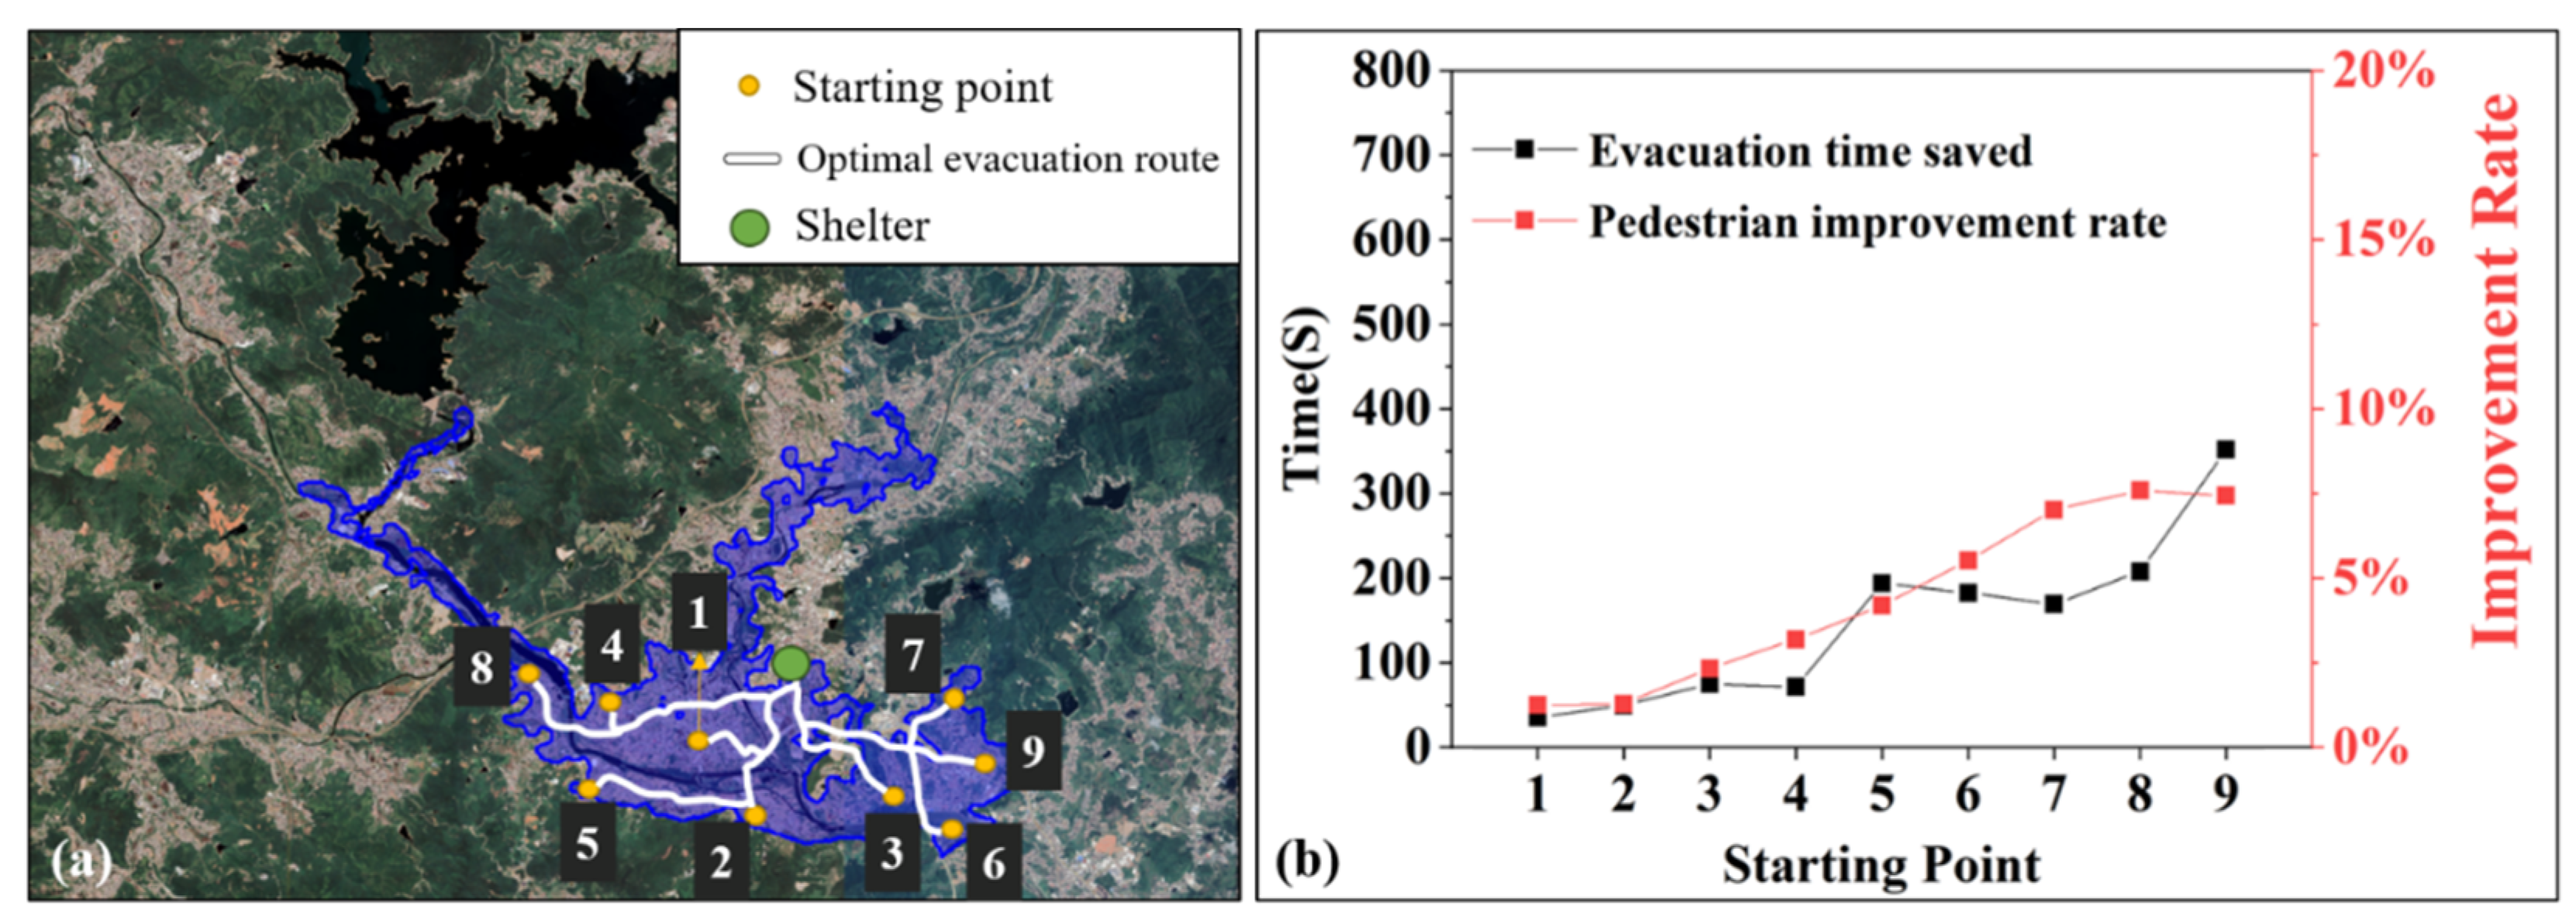
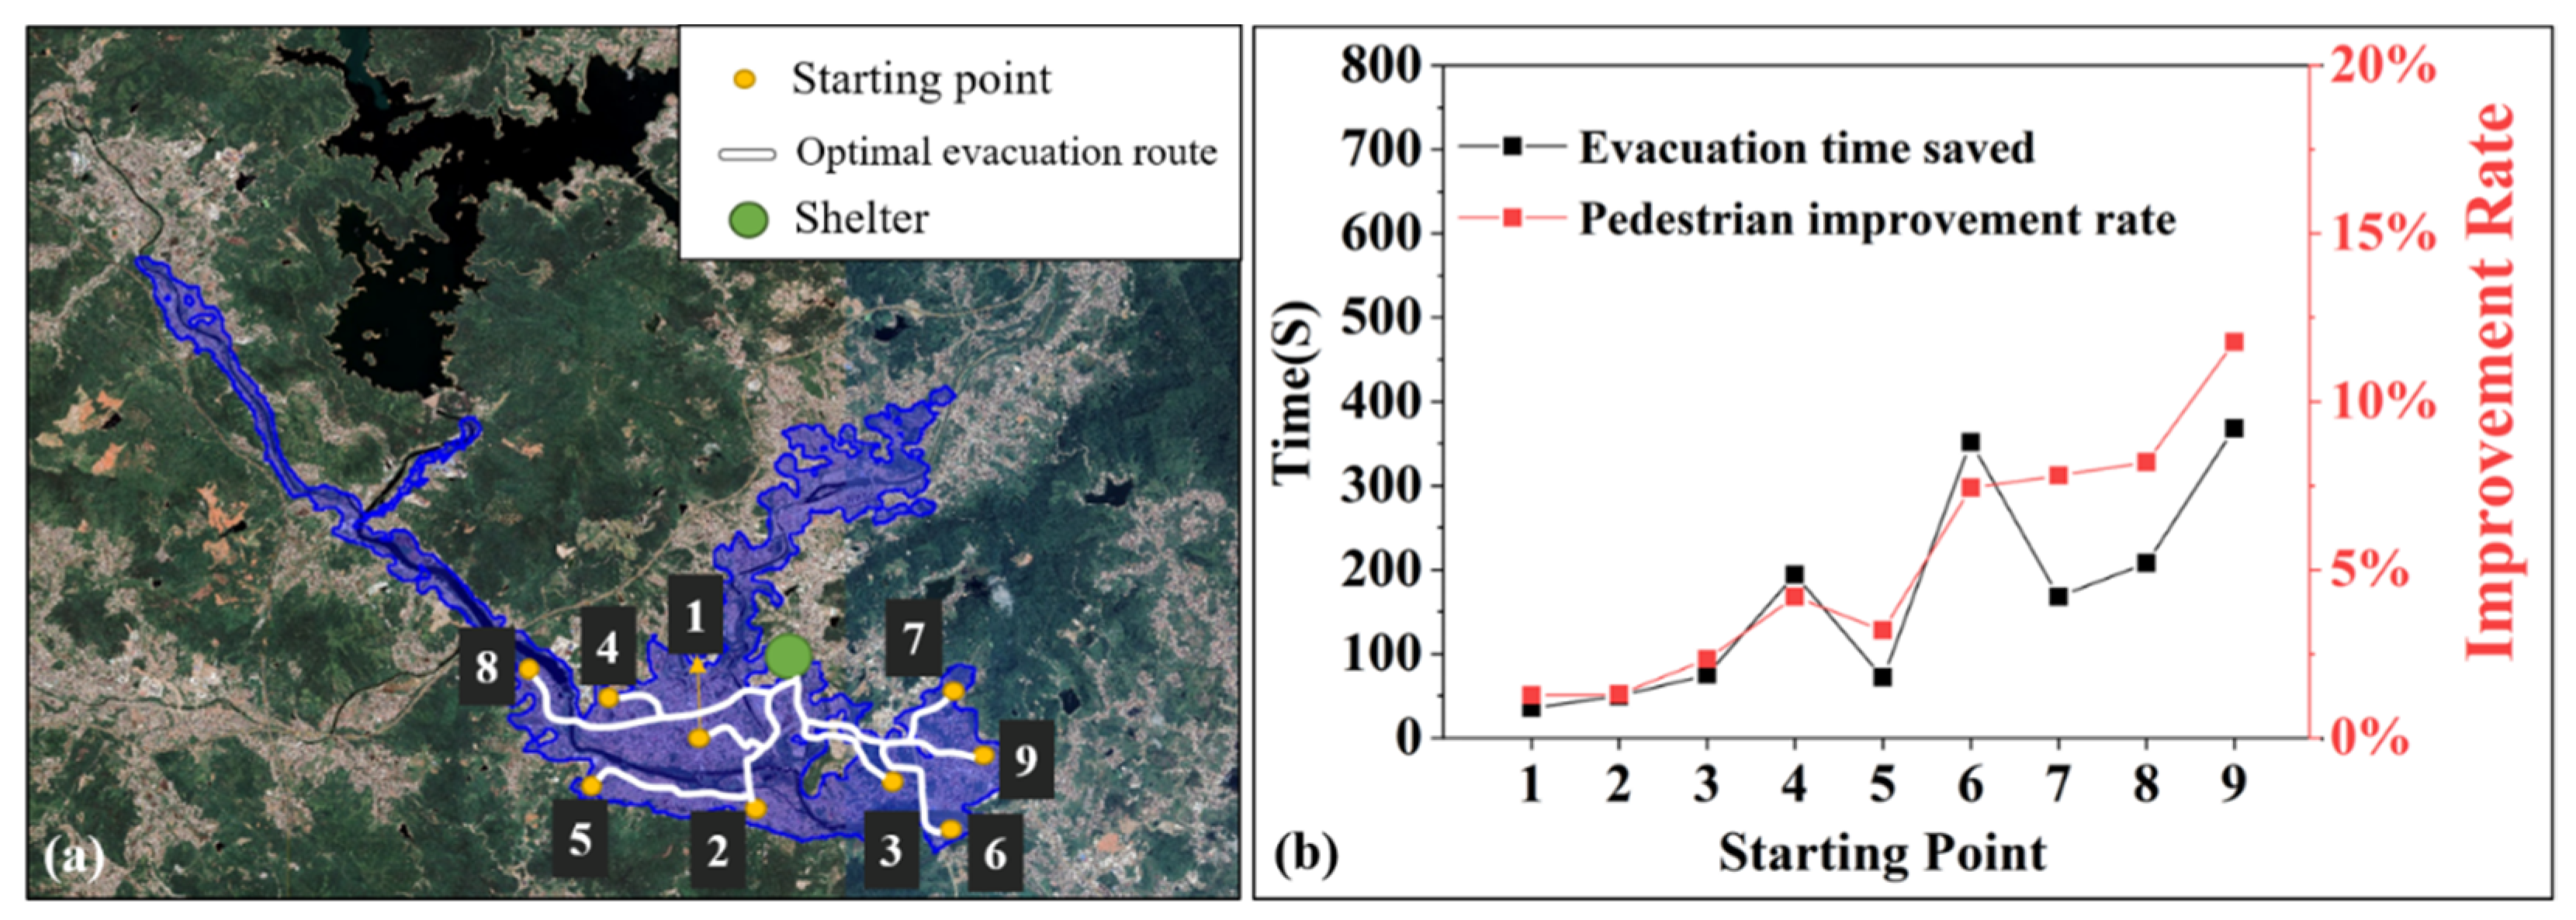
The improved 3D Dijkstra’s algorithm proposed in this study has a great potential in optimizing evacuation route selection, reducing evacuation time, and alleviating congestion. Experiments show that when the evacuation starting point of the inundated area is farther from the shelter, the evacuation efficiency will be improved after the optimized algorithm is used.
(2)
The method also can analyze the location of the existing shelters and propose a new reference for the selection of shelters. The study finds that when Guozhuan Middle School and Guoguang Middle School are selected for the establishment of shelters, and the evacuation time of pedestrians is the shortest, compared with the existing shelter, the evacuation time can be significantly reduced.
(3)
Through the proposal of this optimization method, an algorithm of the industrial application level is developed, which shortens the evacuation time of the crowd. It also provides scientific advice for the related work of road repair and government disaster prevention.

Author Contributions

Conceptualization, W.N., Y.Z. and Z.W.; methodology, W.N. and Y.Z.; software, Y.Z. and Z.W.; validation, W.N. and W.X.; formal analysis, Y.Z. and H.L.; investigation, W.N.; resources, W.N.; data curation, Q.L.; writing—original draft preparation, Y.Z.; writing—review and editing, W.N., Z.W. and R.W.; visualization, H.L.; supervision, Z.D. and Z.Z.; project administration, W.N.; funding acquisition, W.N. All authors have read and agreed to the published version of the manuscript.

Funding

This research was funded by the Major Science and Technology Projects of Anhui Province (No. 202003a0702002), and the National Key Research and Development Program of China (2021YFC3001304).

Institutional Review Board Statement

Not applicable.

Informed Consent Statement

Not applicable.

Data Availability Statement

Data cannot be made publicly available; readers should contact the corresponding authors for details.

Acknowledgments

We would like to thank the Quanzhou Science and Technology Bureau for providing data and our collaborator Pooya for carefully editing the manuscript. All individuals in this section have consented to the acknowledgement.

Conflicts of Interest

The authors declare that they have no known competing financial interest or personal relationships that could have appeared to influence the work reported in this paper.

References

  1. Roy, S.; Bose, A.; Singha, N.; Basak, D.; Chowdhury, I.R. Urban waterlogging risk as an undervalued environmental challenge: An Integrated MCDA-GIS based modeling approach. Environ. Chall. 2021, 4, 100194. [Google Scholar] [CrossRef]
  2. Salunkhe, S.S.; Rao, S.S.; Prabu, I.; Raghu Venkataraman, V.; Krishna Murthy, Y.V.N.; Sadolikar, C.; Deshpande, S. Flood Inundation Hazard Modelling Using CCHE2D Hydrodynamic Model and Geospatial Data for Embankment Breaching Scenario of Brahmaputra River in Assam. J. Indian Soc. Remote Sens. 2018, 46, 915–925. [Google Scholar] [CrossRef]
  3. Boudou, M.; Moatty, A.; Lang, M. 1-Analysis of Major Flood Events: Collapse of the Malpasset Dam, December 1959. In Floods; Vinet, F., Ed.; Elsevier: Amsterdam, The Netherlands, 2017; pp. 3–19. [Google Scholar] [CrossRef]
  4. Nugraheni, I.L.; Suyatna, A.; Setiawan, A.; Abdurrahman. Flood disaster mitigation modeling through participation community based on the land conversion and disaster resilience. Heliyon 2022, 8, e09889. [Google Scholar] [CrossRef]
  5. Jiang, Z.; Yang, S.; Liu, Z.; Xu, Y.; Xiong, Y.; Qi, S.; Pang, Q.; Xu, J.; Liu, F.; Xu, T. Coupling machine learning and weather forecast to predict farmland flood disaster: A case study in Yangtze River basin. Environ. Model. Softw. 2022, 155, 105436. [Google Scholar] [CrossRef]
  6. Lempérière, F. Dams and Floods. Engineering 2017, 3, 144–149. [Google Scholar] [CrossRef]
  7. Yu, S.; Zhang, Q.; Chen, Z.; Hao, J.; Wang, L.; Li, P.; Zhong, Q. Study of the Sheyuegou dam breach–Experience with the post-failure investigation and back analysis. Eng. Fail. Anal. 2021, 125, 105441. [Google Scholar] [CrossRef]
  8. Hallegatte, S. A Cost Effective Solution to Reduce Disaster Losses in Developing Countries: Hydro-Meteorological Services, Early Warning, and Evacuation (SSRN Scholarly Paper No. 2051341); Social Science Research Network: Rochester, NY, USA, 2021. [Google Scholar]
  9. Wu, J.; Huang, C.; Pang, M.; Wang, Z.; Yang, L.; FitzGerald, G.; Zhong, S. Planned sheltering as an adaptation strategy to climate change: Lessons learned from the severe flooding in Anhui Province of China in 2016. Sci. Total Environ. 2019, 694, 133586. [Google Scholar] [CrossRef]
  10. Mateo, C.M.; Oki, T. Filipinos’ Perception About Flood Warning Systems and Their Behavior Towards Early Evacuation. In Proceedings of the 9th International Symposium on Southeast Asian Water Environment, Bangkok, Tailand, 1–3 December 2011. [Google Scholar]
  11. Grumbly, S.M.; Frazier, T.G.; Peterson, A.G. Examining the Impact of Risk Perception on the Accuracy of Anisotropic, Least-Cost Path Distance Approaches for Estimating the Evacuation Potential for Near-Field Tsunamis. J. Geovis. Spat. Anal. 2019, 3, 3. [Google Scholar] [CrossRef]
  12. Hsiao, C.-C.; Sun, M.-C.; Chen, A.Y.; Hsu, Y.-T. Location problems for shelter-in-place deployment: A case study of vertical evacuation upon dam-break floods. Int. J. Disaster Risk Reduct. 2021, 57, 102048. [Google Scholar] [CrossRef]
  13. Coutinho-Rodrigues, J.; Tralhão, L.; Alçada-Almeida, L. Solving a location-routing problem with a multiobjective approach: The design of urban evacuation plans. J. Transp. Geogr. Spec. Sect. Rail Transit Syst. High Speed Rail 2012, 22, 206–218. [Google Scholar] [CrossRef]
  14. Aghabayk, K.; Parishad, N.; Shiwakoti, N. Investigation on the impact of walkways slope and pedestrians physical characteristics on pedestrians normal walking and jogging speeds. Saf. Sci. 2021, 133, 105012. [Google Scholar] [CrossRef]
  15. Ma, W.; Wang, Z.; Hu, Y. An experimental study of the effect of the inertness pedestrian on evacuation process. Presented at the 2021 2nd International Conference on Urban Engineering and Management Science (ICUEMS), Sanya, China, 29–31 January 2021; pp. 36–39. [Google Scholar] [CrossRef]
  16. Zacharias, J. Pedestrian dynamics on narrow pavements in high-density Hong Kong. J. Urban Manag. 2021, 10, 409–418. [Google Scholar] [CrossRef]
  17. Hougardy, S. The Floyd–Warshall algorithm on graphs with negative cycles. Inf. Process. Lett. 2010, 110, 279–281. [Google Scholar] [CrossRef]
  18. Zhang, J.; Meng, W.; Liu, Q.; Jiang, H.; Feng, Y.; Wang, G. Efficient vehicles path planning algorithm based on taxi GPS big data. Optik 2016, 127, 2579–2585. [Google Scholar] [CrossRef]
  19. Sun, Y.; Yu, X.; Bie, R.; Song, H. Discovering time-dependent shortest path on traffic graph for drivers towards green driving. J. Netw. Comput. Appl. 2017, 83, 204–212. [Google Scholar] [CrossRef]
  20. Dijkstra, E. A Note on Two Problems in Connexion With Graphs. Numer. Math. 1959, 1, 269–271. [Google Scholar] [CrossRef]
  21. Wang, H.; Mao, W.; Eriksson, L. A Three-Dimensional Dijkstra’s algorithm for multi-objective ship voyage optimization. Ocean. Eng. 2019, 186, 106131. [Google Scholar] [CrossRef]
  22. Takabatake, T.; Fujisawa, K.; Esteban, M.; Shibayama, T. Simulated effectiveness of a car evacuation from a tsunami. Int. J. Disaster Risk Reduct. 2020, 47, 101532. [Google Scholar] [CrossRef]
  23. Tresilian, J. Sensorimotor Control & Learning: An Introduction to the Behavioral Neuroscience of Action; Palgrave Macmillan: London, UK, 2013. [Google Scholar]
  24. Scarf, P. Route choice in mountain navigation, Naismith’s rule, and the equivalence of distance and climb. J. Sports Sci. 2007, 25, 719–726. [Google Scholar] [CrossRef]
  25. Li, X.; Xie, S.; Zeng, D.; Wang, Y. Efficient ℓ0-norm feature selection based on augmented and penalized minimization. Stat. Med. 2018, 37, 473–486. [Google Scholar] [CrossRef]
  26. Maynard, D.; Coull, B.A.; Gryparis, A.; Schwartz, J. Mortality Risk Associated with Short-Term Exposure to Traffic Particles and Sulfates. Environ. Health Perspect. 2007, 115, 751–755. [Google Scholar] [CrossRef] [PubMed]
  27. Van den Hove, A.; Verwaeren, J.; Van den Bossche, J.; Theunis, J.; De Baets, B. Development of a land use regression model for black carbon using mobile monitoring data and its application to pollution-avoiding routing. Environ. Res. 2020, 183, 108619. [Google Scholar] [CrossRef] [PubMed]
  28. Kang, D.-H.; Nam, D.-H.; Jeung, S.-J.; Kim, B.-S. Impact Assessment of Flood Damage in Urban Areas Using RCP 8. 5 Climate Change Scenarios and Building Inventory. Water 2021, 13, 756. [Google Scholar] [CrossRef]
  29. Yeo, K.D. A Study on Estimation Method of Expected Flood Damage Considering Local Characteristics. Master’s Thesis, Inha University, Incheon, Korea, 2003. [Google Scholar]
  30. Bernardini, G.; Quagliarini, E.; D’Orazio, M.; Brocchini, M. Towards the simulation of flood evacuation in urban scenarios: Experiments to estimate human motion speed in floodwaters. Saf. Sci. 2020, 123, 104563. [Google Scholar] [CrossRef]
  31. Cox, R.J.; Shand, T.D.; Blacka, M.J. Australian Rainfall and Runoff revision project 10: Appropriate safety criteria for people. Water Res. 2010, 978, 085825–089454. [Google Scholar]
  32. Ishigaki, T.; Kawanaka, R.; Onishi, Y.; Shimada, H.; Toda, K.; Baba, Y. Assessment of Safety on Evacuating Route During Underground Flooding. In Advances in Water Resources and Hydraulic Engineering; Zhang, C., Tang, H., Eds.; Springer: Berlin/Heidelberg, Germany, 2009; pp. 141–146. [Google Scholar] [CrossRef]
  33. Wang, M. China County Statistical Yearbook • 2020 (Township Volume); China Statistics Press: Beijing, China, 2020; Volume 03, p. 233. [Google Scholar]
  34. Liu, Y. “02·8” Flood Control Benefit of Shanmei Reservoir. Water Conserv. Sci. Technol. 2003, 1, 17–18. [Google Scholar]
  35. Wang, M. (Ed.) Editorial Committee of China County Statistical Yearbook 2021 (Township Volume); China county statistical yearbook; China Statistics Press: Beijing, China, 2021. [Google Scholar] [CrossRef]
  36. Li, Z.; Long, Z.; Lei, S.; Yang, L.; Zhang, W.; Zhang, T. Explicit expressions of the saturation flux density and thermal stability in Fe-based metallic glasses based on Lasso regression. Intermetallics 2021, 139, 107361. [Google Scholar] [CrossRef]
  37. Fan, D. Research on Pedestrian-Non-Motor Vehicle Sharing Road Safety and Efficiency; Chang’an University: Xi’an, China, 2017. [Google Scholar]
  38. Wang, J.; Yu, X.; Zong, R.; Lu, S. Evacuation route optimization under real-time toxic gas dispersion through CFD simulation and Dijkstra algorithm. J. Loss Prev. Process Ind. 2022, 76, 104733. [Google Scholar] [CrossRef]
  39. Wang, X.; Mohcine, C.; Chen, J.; Li, R.; Ma, J. 2022. Modeling boundedly rational route choice in crowd evacuation processes. Saf. Sci. 2022, 147, 105590. [Google Scholar] [CrossRef]
  40. Shatu, F.; Yigitcanlar, T.; Bunker, J. Shortest path distance vs. least directional change: Empirical testing of space syntax and geographic theories concerning pedestrian route choice behaviour. J. Transp. Geogr. 2019, 74, 37–52. [Google Scholar] [CrossRef]
  41. Bohannon, R.W.; Williams Andrews, A. Normal walking speed: A descriptive meta-analysis. Physiotherapy 2011, 97, 182–189. [Google Scholar] [CrossRef] [PubMed]
Figure 1. Research site and the urban inundated area under flood: (a) inundated area under once-in-20-year, (b) inundated area under once-in-50-year, (c) inundated area under once-in-100-year.
Sustainability 14 10250 g001
Figure 2. (a) Example of a time graph; the weight of an edge represents the true evacuation time. (b) Time storage matrix, the numbers in the figure are the time from the node V i to node V j .
Sustainability 14 10250 g002
Figure 3. Workflow of optimal evacuation route planning-based improved 3D Dijkstra’s algorithm.
Sustainability 14 10250 g003
Figure 4. Schematic diagram of road nodes.
Sustainability 14 10250 g004
Figure 5. Distribution map of available shelters.
Sustainability 14 10250 g005
Figure 6. Calculation results of evacuation time.
Sustainability 14 10250 g006
Figure 7. (a) Optimized route for the nine evacuation starting points under the once-in-20-year flood. (b) Evacuation time saved and improvement effect.
Sustainability 14 10250 g007
Figure 8. (a) Optimized route for the nine evacuation starting points under the once-in-50-year flood. (b) Evacuation time saved and improvement effect.
Sustainability 14 10250 g008
Figure 9. (a) Optimized route for the nine evacuation starting points under the once-in-100-year flood. (b) Evacuation time saved and improvement effect.
Sustainability 14 10250 g009
Figure 10. Best shelter for pedestrians in each area during evacuation.
Sustainability 14 10250 g010
Figure 11. The demonstration of the software after running.
Sustainability 14 10250 g011
Figure 12. The original and optimal evacuation route corresponding to starting point 1.
Sustainability 14 10250 g012
Figure 13. Time spent evacuating people of different ages to three shelters.
Sustainability 14 10250 g013
Table 1. Different route planning and time spent in the schematic diagram.
1 5 Time 5 1 Time
1 3 2 5 7 5 2 3 1 10
1 3 5 3 5 3 1 4
1 4 3 5 18 5 3 4 1 17
1 4 3 2 5 21 5 2 3 4 1 23
Table 2. Average evacuation time corresponding to each shelter.
SheltersDistance (m)Once-in-20-Year Flood (s)Once-in-50-Year Flood (s)Once-in-100-Year Flood (s)
(1) Guozhuan Middle School8582303.702359.65\
(2) Guoguang Middle School13392756.872736.742219.04
(3) Guoguang Second Middle School15402709.502784.832290.21
(4) Mingxin Village Shelter19043208.382760.39\
(5) Nan’an Lanyuan Middle School24903206.323098.07\
(6) Fengxi Primary School35603701.813011.77\
(7) Puzai Village Liutang Central Primary School35703534.103825.12\
(8) Shuikou Village Primary School42804788.124383.934263.94
(9) Xiaoziting Tourist Attraction49204904.574812.304698.14
Table 3. Average evacuation time spent by pedestrians walking to shelters and rate of improvement in time savings (once-in-50-year flood).
Shelters2D Time (s)3D Time (s)Improvement Rate (%)Saved Time (s)
(1) Guozhuan Middle School2397.872359.651.3238.22
(2) Guoguang Middle School2782.162736.741.3345.42
(3) Guoguang Second Middle School2823.672784.831.1038.84
(4) Mingxin Village Shelter2806.812760.391.5446.43
(5) Nan’an Lanyuan Middle School3141.973098.071.1443.90
(6) Fengxi Primary School3101.053011.771.8589.28
(7) Puzai Village Liutang Central Primary School3927.263825.122.07102.14
(8) Shuikou Village Primary School4535.114383.932.49151.18
(9) Xiaoziting Tourist Attraction5145.404812.305.80333.10
Publisher’s Note: MDPI stays neutral with regard to jurisdictional claims in published maps and institutional affiliations.

