Article

Development and Application of Models for Landslide Hazards in Northern Pakistan

1
Department of Civil Engineering, COMSATS University Islamabad, Abbottabad Campus, Tobe Camp University Road, Abbottabad 22060, Pakistan
2
Department of Environmental Sciences, COMSATS University Islamabad, Abbottabad Campus, Tobe Camp University Road, Abbottabad 22060, Pakistan
3
Department of Botany, University of Malakand, Chakdara Dir Lower 18800, Pakistan
4
Department of Earth and Environmental Sciences, Hazara University, Mansehra 21120, Pakistan
5
Research Centre, Future University, New Cairo 11853, Egypt
6
Department of Civil Engineering, University of Engineering and Technology, Peshawar 25120, Pakistan
7
Department of Mathematics, Sun Yat-sen University, Guangzhou 510275, China
*
Author to whom correspondence should be addressed.
Sustainability 2022, 14(16), 10194; https://doi.org/10.3390/su141610194
Submission received: 22 May 2022 / Revised: 7 August 2022 / Accepted: 9 August 2022 / Published: 17 August 2022
(This article belongs to the Topic Climate Change and Environmental Sustainability)

Abstract

:
In this paper, new models were investigated and developed for landslide hazards in Muzaffarabad District, located in the Azad Jammu and Kashmir region of Pakistan. The influential factors used in the landslide modelling were land use/landcover (LULC), elevation, slope, slope aspect, rainfall, drainage, road, surface roughness, and topographic index. The GIS-based Analytic Hierarchy Process (AHP) model was applied by utilizing the database of 35 active landslides and their pixels present in classes of all influential factors. The mean landslide hazard values, obtained from the mean landslide hazard analysis, were used as hazard weightages in the AHP model for development of a landslide hazard zone map. The highest mean hazard values for: (i) bare soil in LULC was 14.6%; (ii) 600–800 m in elevation was 6.89%; (iii) 30°–35° in slope was 6%; (iv) S and SW in slope aspect was 9.01%; (v) 1350–1405 mm/yr in rainfall was 9.03%; (vi) 40–80 m in buffered drainage was 12.83%; (vii) 40–80 m in buffered road was 12.48%; (viii) 60–138 in surface roughness index was 10.99%; (ix) −1.74–−1.25 in topographic position index was 13.07%. The percentages of very low, low, moderate, high, and very high landslide hazard zones were 1.48%, 11.80%, 39.36%, 37.36%, and 9.57% respectively. The co-efficient of the determination (r2) value of 0.96 indicated a strong relationship between the model development and validation. Thus, landslide hazard zone map models and methodology indicated a very high accuracy. This landslide hazard zone map could be utilized for the landslide damages’ reduction and the planning and development of road and building infrastructures in the study area. Additionally, this research could be replicated in other landslide prone areas of Pakistan for the minimizing the damages of landslides.

1. Introduction

Landslides are severe geological hazards common in mountainous regions [1]. They are defined as the moving mass of earth, rock, or debris down a slope under the influence of gravity. The occurrence of earth moving could be related to anthropogenic activities and natural factors. Landslides are considered one of the most devastating natural hazards and cause a significant loss of properties and human lives worldwide [2,3].
It is imperative to know the factors and processes that cause such a movement of earth materials, to accommodate the hazards and minimize the risk factors [4]. The natural or man-made factors controlling the landslide susceptibility are influencing factors. The influencing factors could be environmental and triggering factors [5]. The environmental factors could mainly affect the occurrence of landslides continuously and stably [6,7]. These include: (i) morphological characteristics, such as elevation, slope, and curvature; (ii) geological factors, such as lithology and faults: (iii) landcover, such as vegetation, roads, built-up areas; and (iv) hydrological characteristics, such as rivers, lakes and seepage.
In contrast, the triggering factors could have discontinuous and sudden effects on landslides’ occurrence [5,6,7,8]. Among them, the most common factors could be rainfall, snowfall, terrain, and earthquakes [9,10]. Snowmelt and rainfall during monsoon could erode the soil and cause the occurrence of landslides [11]. Other factors include volcanic activity, stream erosion, and a change in the groundwater levels. The anthropogenic factors, such as land degradation, road construction in sloppy terrain, and deforestation, further escalate the problem [12]. The poor planning and unsafe construction could also be the main reasons for the activation of landslides in the mountainous regions [13]. There are many problems which could be generated due to landslides, and these include: (i) loss of life; (ii) destruction of houses; (iii) damage to roads; (iv) loss of trees; (v) disastrous flooding; and (vi) changes in the topography of the earth’s surface.
Landslides are in fifth place of the many natural hazards and disasters that occur worldwide [13]. Approximately 9% of natural disasters are associated with landslides in the world. The landslides could be the reason for the deaths of about one thousand people every year [14]. This disaster not only impacts the social life of people, but also affects the economic activities of that region [15,16]. The largest landslide that ever occurred in history was during the volcanic eruption of Mount St. Helens, located in Skamania County, Washington, USA. One of the factors that could influence landslides is the high intensity of rainfall [17].
Pakistan is considered to be one of the natural disaster-prone countries in South Asia, and its northern areas are the most vulnerable to the occurrence of landslides, as compared to other parts of the region. In 2010, the country faced the largest landslide in Attabad village in the Gilgit-Baltistan region of Pakistan. It resulted in the deaths of 20 people, the destruction of 40 houses, and the evacuation of 1500 people. In addition to this destruction, 100 houses developed cracks three years after the occurrence of this landslide. The Hunza river was obstructed for five months due to this large landslide. As a result of the damming of Hunza River, five villages were flooded, which affected the lives of 25,000 people. In the Himalayan regions, landslides are a wide-range and re-occurring phenomenon [18].
In the Pakistani Himalayan region, the landslide occurrence, from a small scale to almost heavy land sliding, could be related to climate, slope, landcover, and lithology [19,20]. The damages caused by landslides vary from region to region. Such damages affect the livelihood of people, tourism in the area, and the economy of the region. Several studies indicated that among all of the landslide-susceptible areas, the Kashmir Himalaya is the world’s most terrible landslide-affected region [21]. This can be well described when an earthquake measuring a magnitude of 7.6 on the Richter scale struck Azad Jammu and Kashmir (AJK) and Khyber Pakhtunkhwa (KPK) Province in northern Pakistan on 8 October 2005. It triggered many landslides and affected more than 30,000 km2 areas, which resulted in more than 25,000 fatalities [22]. Due to this earthquake, a landslide occurred in the Haitian-Bala region of AJK, which destroyed three villages and many deaths occurred. The intense rainfall and snowmelt during the spring and the monsoon are also the communal triggers of landslides in Muzaffarabad District of AJK. The researchers paid attention to landslide prediction and monitoring across scientific communities. The zonation of landslide hazards is critical for predicting and analyzing landslides [22] and managing such disasters more effectively, particularly in the mountainous regions [23]. The landslide hazard zonation divides an area into various similar portions. It ranks them, based on the actual hazards caused by mass movement [24], and it is an essential step before planning and disaster mitigation [25].
A significant proportion of the damages caused by landslides could be reduced by the early detection and by enhancing the capacity of the rock fall [26]. The satellite-based observation techniques and geo-spatial technologies, such as Global Positioning System (GPS), Remote Sensing, and Geographic Information System (GIS), are helpful for identification, hazard analysis, disaster management, and successful mitigation of landslide hazards [12]. The remote sensing technique was more effective in monitoring the landslide hazard [27] and allowed for the coverage of large regions at a higher frequency [28]. The application of remote sensing in landslides and its contribution could be identified in many aspects, such as monitoring, analysis, detection, and mapping [29,30]. The applications of GPS were also successfully applied for landslides’ mapping [31]. The use of GIS in modelling the landslide hazard by incorporating different parameters was also attempted by many researchers [32,33,34,35,36,37,38,39].
Ref. [40] studied the landslide hazard using GIS, along with data from the climate, population, rainfall, and geology, based on 1448 landslide inventory data. A landslide zonation map was established, and a strong correlation was observed between rainfall and landslide hazard. Ref. [41], used two statistical and heuristic models for landslides in Europe with vegetation cover, soil moisture, lithology, and slope as the susceptible parameters by considering seismicity and rainfall as landslide-triggering factors. The results revealed that landslides’ occurrence was more frequent in countries with a total and relative area exposed to landslides.
Ref. [40] conducted a study to forecast the absence or presence of landslides by using the dependent and the independent parameters (i.e., slope gradation, elevation, aspect, road network). The findings of this study indicated that the road network plays a vital role in determining the distribution and occurrence of landslides. The study area was categorized into five classes of landslide susceptibility which were extremely low, very low, low, medium, and high. Based on these classifications, the results were evaluated, and maps were produced [42], conducted a study on landslide mitigation strategies for geothermal production sustainability and provided alternative mitigation strategies. The GIS with a weight and scoring technique was applied in this study. The results revealed that 57% of the study area was at medium risk. In another study, a landslide hazard zonation map was developed with the help of an information value model and GIS [13]. In this study, seven causative factors were considered, and those were: (i) land use; (ii) slope inclination; (iii) slope aspect; (iv) elevation; (v) intensity of rainfall; (vi) distance from main road; and (vii) distance from streams. After analyses of these factors, the results indicated that the landslides occurred only in the moderate, high, or very high hazard zones. In contrast, no landslides were found in the low or very low hazard zones. A study was conducted in Muzaffarabad District, AJK to identify the factors and the most vulnerable landslides [43]. Along with other influencing parameters (slope, geometry, and seismology), the spatial distribution of the landslides could be controlled by land cover [42]. The data were collected from field surveys and acquired from different agencies. The study results revealed that seasonal variations in rain and temperature, active earthquake zones, and weak geology were the physical factors responsible for landslides. Moreover, the human interventions in the sloppy areas were further intensifying the problems.
The study area is situated in the Himalayan mountainous region, where catastrophic landslides occur frequently and pose a severe threat to local living conditions. Previously, field survey-based studies were undertaken in northern Pakistan [44,45], but no GIS-based study, utilizing a modified AHP model, was accomplished. The current research will provide a spatial distribution and classification of the various levels of landslide hazard in the study area, where field-based access is difficult. The objectives of this study were to: (i) develop new models and methodology for the landslide hazard modelling; (ii) investigate the impact of influential factors on the landslide hazard occurrence; and (iii) apply models and methodology for the development of a landslide hazard zone map for Muzaffarabad District of AJK, located in Northern Pakistan.

2. Materials and Methods
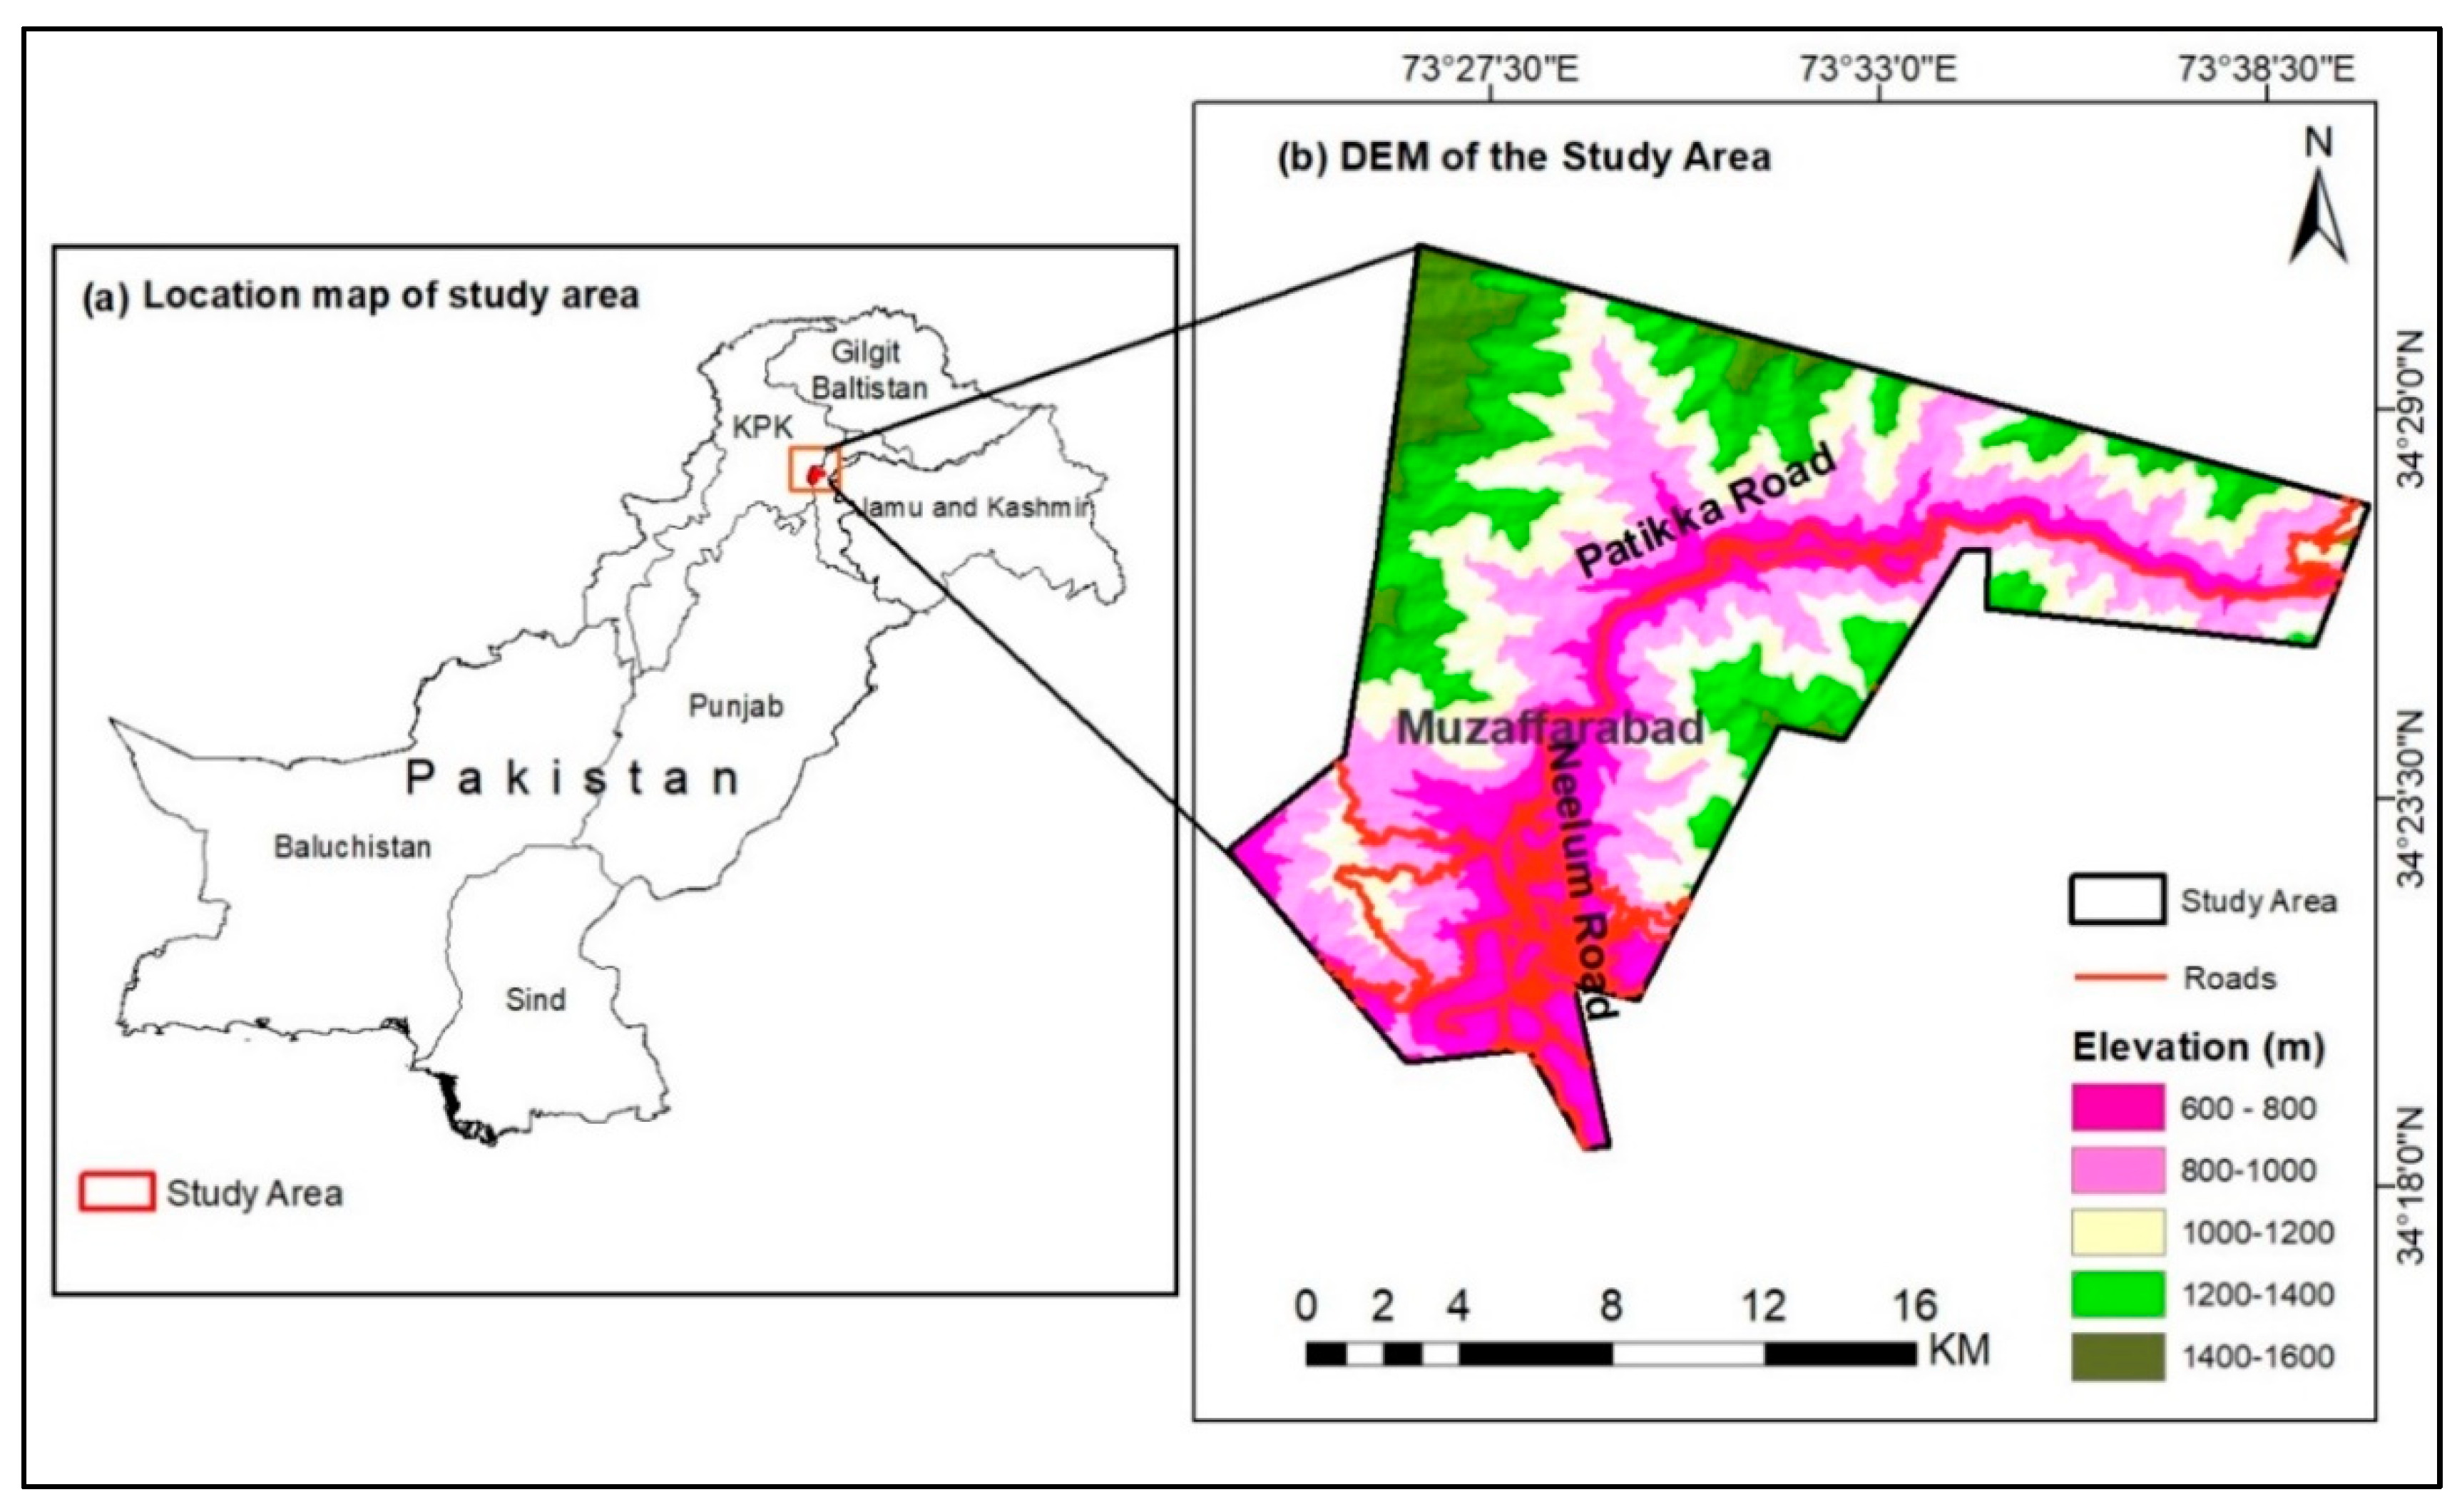
2.1. Study Area

The area selected for the present study is Muzaffarabad, the capital of Azad Jammu and Kashmir. It is on the northern side of Pakistan, as shown in Figure 1a. Figure 1b indicates the Digital Elevation Model (DEM) of the study area, with a range from 600 m to 1600 m. It is the second largest district of AJK, with a total area of 1642 km2. The total population of Muzaffarabad District is 650,000 according to the census of 2017 [46]. It lies between 34.37° latitude and 73.47° longitude and is located at an elevation of 739 m above mean sea level [46]. The city is situated at the confluence of two rivers, i.e., the Neelum and Jhelum rivers. The Neelum District is north of Muzaffarabad, whereas the Bagh District forms the southern boundary. The terrain was disfigured by folding and faulting generated by orogenic stresses. The rocks found in the area include sandstone, siltstone, claystone, and conglomerates. It consists of a convex bulging of cultivated land close to its trace; tilting of man-made features/structures; the formation of ponds on the footwall as the hanging wall uplifted along the Muzaffarabad thrust and blocked the flow of streams running across its traces. Many of the associated landslides are distributed along the path of the Muzaffarabad thrust in the study area. The monsoon is the dominant weather, which leads to rain-induced landslides. The mean annual temperature ranges between 3 °C to 16 °C in winters, and 23 °C to 35 °C in summers. The area’s average yearly precipitation is 1511 mm, and the relative humidity is around 73%. Three main rivers are flowing through Muzaffarabad, which are the Neelum, Jhelum, and Kunhar rivers. The Neelum river merges into the Jhelum at Domail.
Furthermore, some human-induced factors include improper drainage, the construction of roads on steep slopes, the immense increase in the built-up areas, and lack of land-use planning. Likewise, due to the non-availability of a channel system, the primary source of farming is dependent on rainwater. Agriculture, livestock, and non-formal employment are the primary sources of income. Almost 59% of the area is covered with forests, which include Deodar, Fir, Chir, and Blue Pine. Besides, Walnut, Maple, Oak, Ash, Poplar, and Willow are among the famous broad-leaved trees. The severity of the landslides varies from one region to another in the study area based on geological formation, environmental factors, climate, and human-induced problems. Due to this, the housing, transportation, and communication lines are damaged from time to time. Various organizations cater to the landslide hazard problems, but most lack the required skills to mitigate and manage the landslides’ disaster [46].

2.2. Development of Maps for Landslides and Influential Factors using GIS and Remote Sensing

The satellite data using Google Earth were processed and located the active landslides in the study area. Google Earth was used for the landslide mapping as an alternative to high-resolution satellite images [47]. A total of 54 existing landslides were identified and mapped using Google Earth. The 35 landslides were used for model development. The remaining 19 landslides were utilized for the model validation. High-resolution satellite images were used from Google Earth to locate and digitize the active landslides in the Muzaffarabad region. These landslides were verified with the help of a field survey by using GPS (Appendix A). The date of these Google Earth satellite images was 23 March 2019. The landslide map was then imported into GIS for further processing and enhancements. Nine different landslide influential factors were adopted for this study. These factors were: (i) LULC; (ii) elevation; (iii) slope; (iv) slope aspect; (v) rainfall; (vi) drainage; (vii) roads; (viii) surface roughness; and (ix) topographic index. The maps for these factors were prepared in remote sensing and GIS. The LULC map was obtained from the MODIS Land Cover-Product MCD12Q1 Version 6 data product, which was produced by the implementation of supervised classifications of the MODIS Terra and Aqua reflectance data from 2019. The post-processing of this product was also accomplished to enhance LULC classes further. The data of the Digital Elevation-Shuttle Radar Topography Mission (SRTM) 1 Arc-Second (30 m) Global were obtained from the USGS EROS archive in the format of Digital Terrain Elevation Data (DTED®). These data were imported and processed for elevation, slope, slope aspect, surface roughness index, and topographic index extraction. For the development of a rainfall map, the meteorological data were obtained from the Pakistan meteorological department (PMD), Islamabad. The yearly rainfall data were obtained from two weather stations in Balakot and the Muzaffarabad cities of Khyber Pakhtunkhwa and the AJK provinces of Pakistan. These data were used to produce a yearly rainfall map using the Inverse Distance Weighted interpolation technique in GIS. The drainage and road maps were obtained from Open Street Map, located at the website (https://www.openstreetmap.org, accessed on 22 February 2022). The drainage network indicates the major rivers and streams in the study area. Similarly, the road map indicates all of the major and secondary roads. First, the study area drainage road files were extracted, using the clipping tool option in ArcMap 10.5 software (ESRI, Redlands, CA, USA), then the buffer tool in ArcMap 10.5 software was used to create a 200-m buffer for both the drainage and road files of the study area.

2.3. Methodology for Landslide Hazard Zones

The landslide maps and their influential factors were developed, as discussed in Section 2.2. The landslide was overlaid on all of the significant factor maps to extract the number of landslides in all of the classes of influential factor maps. The numbers of landslides were normalized, using Equation (1):
    N o r m a l i z e d   L a n d s l i d e   ( L n ) = L a n d s l i d e s   i n   c l a s s   ( L c ) T o t a l   L a n d s l i d e s   ( L t )
The focal zonal statistics were obtained using the influencing factors and landslides to calculate the mean values of classes of influential factors and numbers of pixels for landslides. The normalized landslide pixels were obtained for each mean value of class using Equation (2):
N o r m a l i z e d   L a n d s l i d e   P i x e l s   ( P n ) = L p   H p
where L p = Number of pixels of landslides in mean class of influential factors.
H p = Highest numbers of pixels of landslides in mean class for whole class range of influential factors.
Landslide hazard ( L h ) for all classes of nine influential factors was calculated using Equation (3) in %:
L a n d s l i d e   h a z a r d   ( L h ) = [ P n L n 100 ]
where P n is normalized landslide pixels.
L n is normalized landslide.
The landslide hazard was applied to obtain the arithmetic mean of landslide hazard, as provided in Equation (4):
M e a n   L a n d s l i d e   h a z a r d   ( M L h ) = L h n
where L h is the landslide hazard as given in Equation (3); n is the total number of landslides in the study area
The mean landslide hazard values obtained, using Equation (4), were used as hazard weightages in the multi-criteria decision-making method called Analytic Hierarchy Process (AHP) model in GIS. A landslide hazard zone map was generated after applying the AHP model [48,49,50]. AHP is a multi-objective multi-criterion approach to decision-making, which allows the user to arrive at a scale instead of attaining a set of alternative solutions [51]. It helps the decision-makers discover the best suits for their objectives and understanding of the problem. This method is widely used in landslide susceptibility analysis. In the current study, the weight of the influencing factors (LULC, TPI, slope, elevation, etc.) was calculated, and then the influential factors were classified using the geometrical interval method in Arc Map 10.5 software. The weight of the influencing factors was ranked from 1 to 100. There were five landslide hazard zones on the landslide hazard zone map, which were: (i) very low; (ii) low; (iii) moderate; (iv) high; and (v) very high.

2.4. Validation of Models and Methodology

The spatial data of 35 landslides were used for model development, and the data for remaining 19 landslides were utilized for the model validation. The landslide hazard zone map, developed based on 35 landslides, was used in this validation. The landslides used for the model development and validation were overlaid on the landslide hazard zones to estimate the percentage of landslides in hazard zones. These percentages were used to determine the coefficient of determination.

3. Results

3.1. Area Coverage of Influential Factors

A total of 35 active landslides were identified, and nine different influential landslide factors were adopted for this study, including climatic factors (Figure 2) and morphology-related factors (Figure 3).
The LULC of the study area was classified into nine different classes which are: (i) evergreen needle leaf forest; (ii) mixed forest; (iii) woody savanna; (iv) bare soil; (v) grassland; (vi) wetland; (vii) cropland; (viii) built-up area; and (ix) water bodies (Figure 2). In the LULC map, 64.65% of the total area is covered by bare soil, and 3.02% is a built-up area. The areas covered by the classes of woody savanna, grassland, cropland, and mixed forest are 22.35%, 5.97%, 2.5%, and 0.71%, respectively. The elevation map was classified into five classes, which are: (i) 600–800 m; (ii) 800–1000 m; (iii) 1000–1200 m; (iv) 1200–1400 m; and (v) 1400–1600 m (Figure 3). The percentages of these classes are 8.83%, 14.36%, 18.87%, 18.97% and 38.95%, respectively. The classes of the slope are: (i) 0°–10°; (ii) 10°–20°; (iii) 20°–30°; (iv) 30°–40°; (v) 40°–50°; (vi) 50°–67.5°. The highest percentage area (30.52%) is covered by the slope class of 30°–40°. A total of 11.22% of the area is covered by 40°–50°, while the remaining classes, i.e., 0°–10°, 10°–20°, 20°–30°, and 50°–67.5° covered areas of 8.92%, 18.41%, 30.07%, and 0.84%, respectively. The classes of slope aspect are: (i) North (N) and Northeast (NE); (ii) East (E); (iii) Southeast (SE); (iv) South (S) and Southwest (SW); and (v) West (W) and Northwest (NW). The percentages of these classes are 19.32%, 10.12%, 15.51%, 29.01% and 26.01%, respectively. The classes of surface roughness index classes are: (i) 0–15; (ii) 15–30; (iii) 30–45; (iv) 45–60; (v) 60–138. The percentages of these classes are 9.21%, 19.91%, 31.10%, 26.6%, and 13.02%, respectively. The classes of topographic position index are: (i) −32.75–−5.5; (ii) −5.49–−1.79; (iii) −1.74–−1.25; (iv) 1.25–4.75; (v) 4.75–31. The percentages of these classes are 6.55%, 22.74%, 36.98%, 25.56%, and 8.15%, respectively. The classes of rainfall map are: (i) 1300–1400 mm/yr.; (ii) 1400–1500 mm/yr.; (iii) 1500–1600 mm/yr.; (iv) 1600–1700 mm/yr., and (v) 1700–1773 mm/yr (Figure 3). The percentages of these classes are 0.006%, 15.15%, 43.75%, 25.45%, and 16.21%, respectively. The buffer tool in GIS was used for both the drainage and road to create five classes, which are: (i) 0–40 m; (ii) 40–80 m; (iii) 80–120 m; (iv) 120–160 m; and (v) 160–200 m (Figure 2).

3.2. Landslide Relationship with Classes of Influential Factors and Hazards of Classes

Table 1 and Figure 2 and Figure 3 present the: (i) presence of landslides in all of the classes of influential factors (LS); (ii) percentages of landslides in all of the classes of influential factors (%); (iii) Mean Landslide Hazard (MH) calculated based on the methodology as explained in Section 2.2. The relationships of landslides for all of these aspects are discussed below.

3.2.1. Landslide Relationship with LULC Area and Hazards of Classes

As per our findings, the LULC showed that 91.43% of the landslides occurred in bare soil. The mean landslide hazard was also highest, i.e., 14.15%, for this class. The percentages of landslides were 2.86%, 2.86%, and 2.86% in the built-up areas, woody savanna, and grassland. The mean hazard for each of these classes was 2.86%. There were no landslides in the evergreen Forest, mixed forest, wetland, cropland, and water bodies. Similarly, the mean hazard was also zero in all of these classes of LULC.

3.2.2. Landslide Relationship with Elevation and Hazards of Classes

The elevation classes are presented in Figure 3. In the landslide relationship with elevation, 8.57% of landslides occurred in the elevation class of 600–800 m, while 42.86% of the landslides occurred in the elevation class of 800–1000 m. The mean hazard values for both classes were 6.89% and 4.87%, correspondingly. The rest of the classes, which are 1000–1200 m, 1200–1400 m, and 1400–1600 m, showed the percentages of landslide occurrence as 17.14%, 20.00%, and 11.43%, respectively, as shown in Table 1. Based on our modelling technique, the mean landslide hazard values for these elevation classes were 6.46%, 6.65%, and 5.20%, respectively.

3.2.3. Landslide Relationship with Slope and Hazards of Classes

The slope classes are displayed in Figure 3. The study area shows a considerable variation in topography, from steep to gentle slopes and flat to highland regions. Based on the natural features, the study area was divided into six classes. The landslide occurrence for the slope inclination was highest (i.e., 40%) for 35°–40°. The percentage of landslide occurrence was also high (i.e., 37.14%) for 30°–35°. The mean landslide hazard was most elevated (i.e., 6%) for 30°–35°, and it was 4.57% for 35°–40°. The percentages for 20°–25°, 25°–30°, and 40°–50° were 8.57%, 2.86%, and 8.57%, correspondingly. The mean landslide hazards for these classes were 4.82%, 2.86%, and 4.42%, respectively.

3.2.4. Landslide Relationship with Slope Aspect and Hazards of Classes

The slope aspect classes are given in Figure 3. The landslide relationship with the slope aspect is revealed in Table 1. The class “S and SW” exhibited the highest occurrence of landslides, at 31.43%. The mean landslide hazard was also the highest (i.e., 9.01%) for this class. The class “SE” also showed a higher occurrence of landslides at 28.57%, with a mean hazard of 5.98%. The percentages for “N and NE”, “W and NW”, and “E” classes were 17.14%, 14.29%, and 8.57%, respectively. The mean hazards for these classes were 4.59%, 4.57%, and 5.40%, correspondingly.

3.2.5. Landslide Relationship with Rainfall and Hazards of Classes

The rainfall classes are presented in Figure 3. According to our findings (Table 1), the landslide occurrence was highest, i.e., 42.86% for the rainfall of 1350–1405 mm/year. Similarly, this class’s mean landslide hazard value was also the highest (i.e., 9.03%). The percentage of landslide occurrence for 1405–1460 mm/year, 1460–1515 mm/year, 1515–1570 mm/year and 1570–1625 mm/year were 11.43%, 8.57%, 5.71%, 2.86%, respectively. The mean landslide hazard values for these classes were 3.73%, 1.52%, 4.13%, and 1.28%, correspondingly.

3.2.6. Landslide Relationship with Buffered Drainage and Hazards of Classes

The drainage network of Muzaffarabad District, AJK, is given in Figure 3. The percentage for the landslide occurrence for 40–80 m was highest, i.e., 25.71%. This class’s mean landslide hazard value was also the highest (i.e., 12.48%). The buffered drainage for 80–120 m also showed a high percentage (i.e., 22.86%) for landslide occurrence. The mean landslide hazard for this class was also high (i.e., 8.74%). The rest of the two classes, which are 120–160 m and 160–200 m, showed percentages of landslide occurrence of 8.57% and 11.43%, respectively. The mean hazard values for these classes were 10% and 6.11% individually.

3.2.7. Landslide Relationship with Buffered Road and Hazards of Classes

The percentage value for the landslide occurrence was highest (i.e., 25.71%) for the buffered road class 40–80 m. The corresponding mean hazard for this class was 12.48%, which was also higher than all of the other courses. The percentage of landslide occurrence for 80–120 m was also high (i.e., 22.86%), and the mean landslide hazard value was 8.74%. The percentages for 0–40 m, 120–160 m, and 160–200 m were 8.57%, 8.57%, and 11.43%, and the mean landslide hazard values were 5.31%, 10%, and 6.11%, respectively.

3.2.8. Landslide Relationship with Surface Roughness Index and Hazards of Classes

The surface roughness index classes are given in Figure 3. For the surface roughness index, the percentage of landslide occurrence for the class 45–60 m was highest, i.e., 51.43%. The mean hazard for this class was also very high (i.e., 10.73%). The percentages for classes 30–45 m and 60–138 m were 25.71% and 22.86%, and the mean hazards were 7.56% and 10.99%, respectively.

3.2.9. Landslide Relationship with Topographic Index and Hazards of Classes

The topographic index was also determined in this study. The area was divided into five main classes, as shown in Figure 3. The percentage of landslide occurrence for the class “−1.74–−1.25 m” was the highest, i.e., 65.71%. The mean landslide hazard was also the highest (i.e.,13.07%) for this class. The percentages of landslide occurrence for other classes (“−32.75–−5.5”, “−5.49–−1.79”, 1.25–4.75, and 4.75–31) were 0%, 17.14%, 14.29%, and 2.86%, correspondingly. The mean landslide hazard values were 0%, 10.28%, 6.90%, and 2.86% for all of these classes.

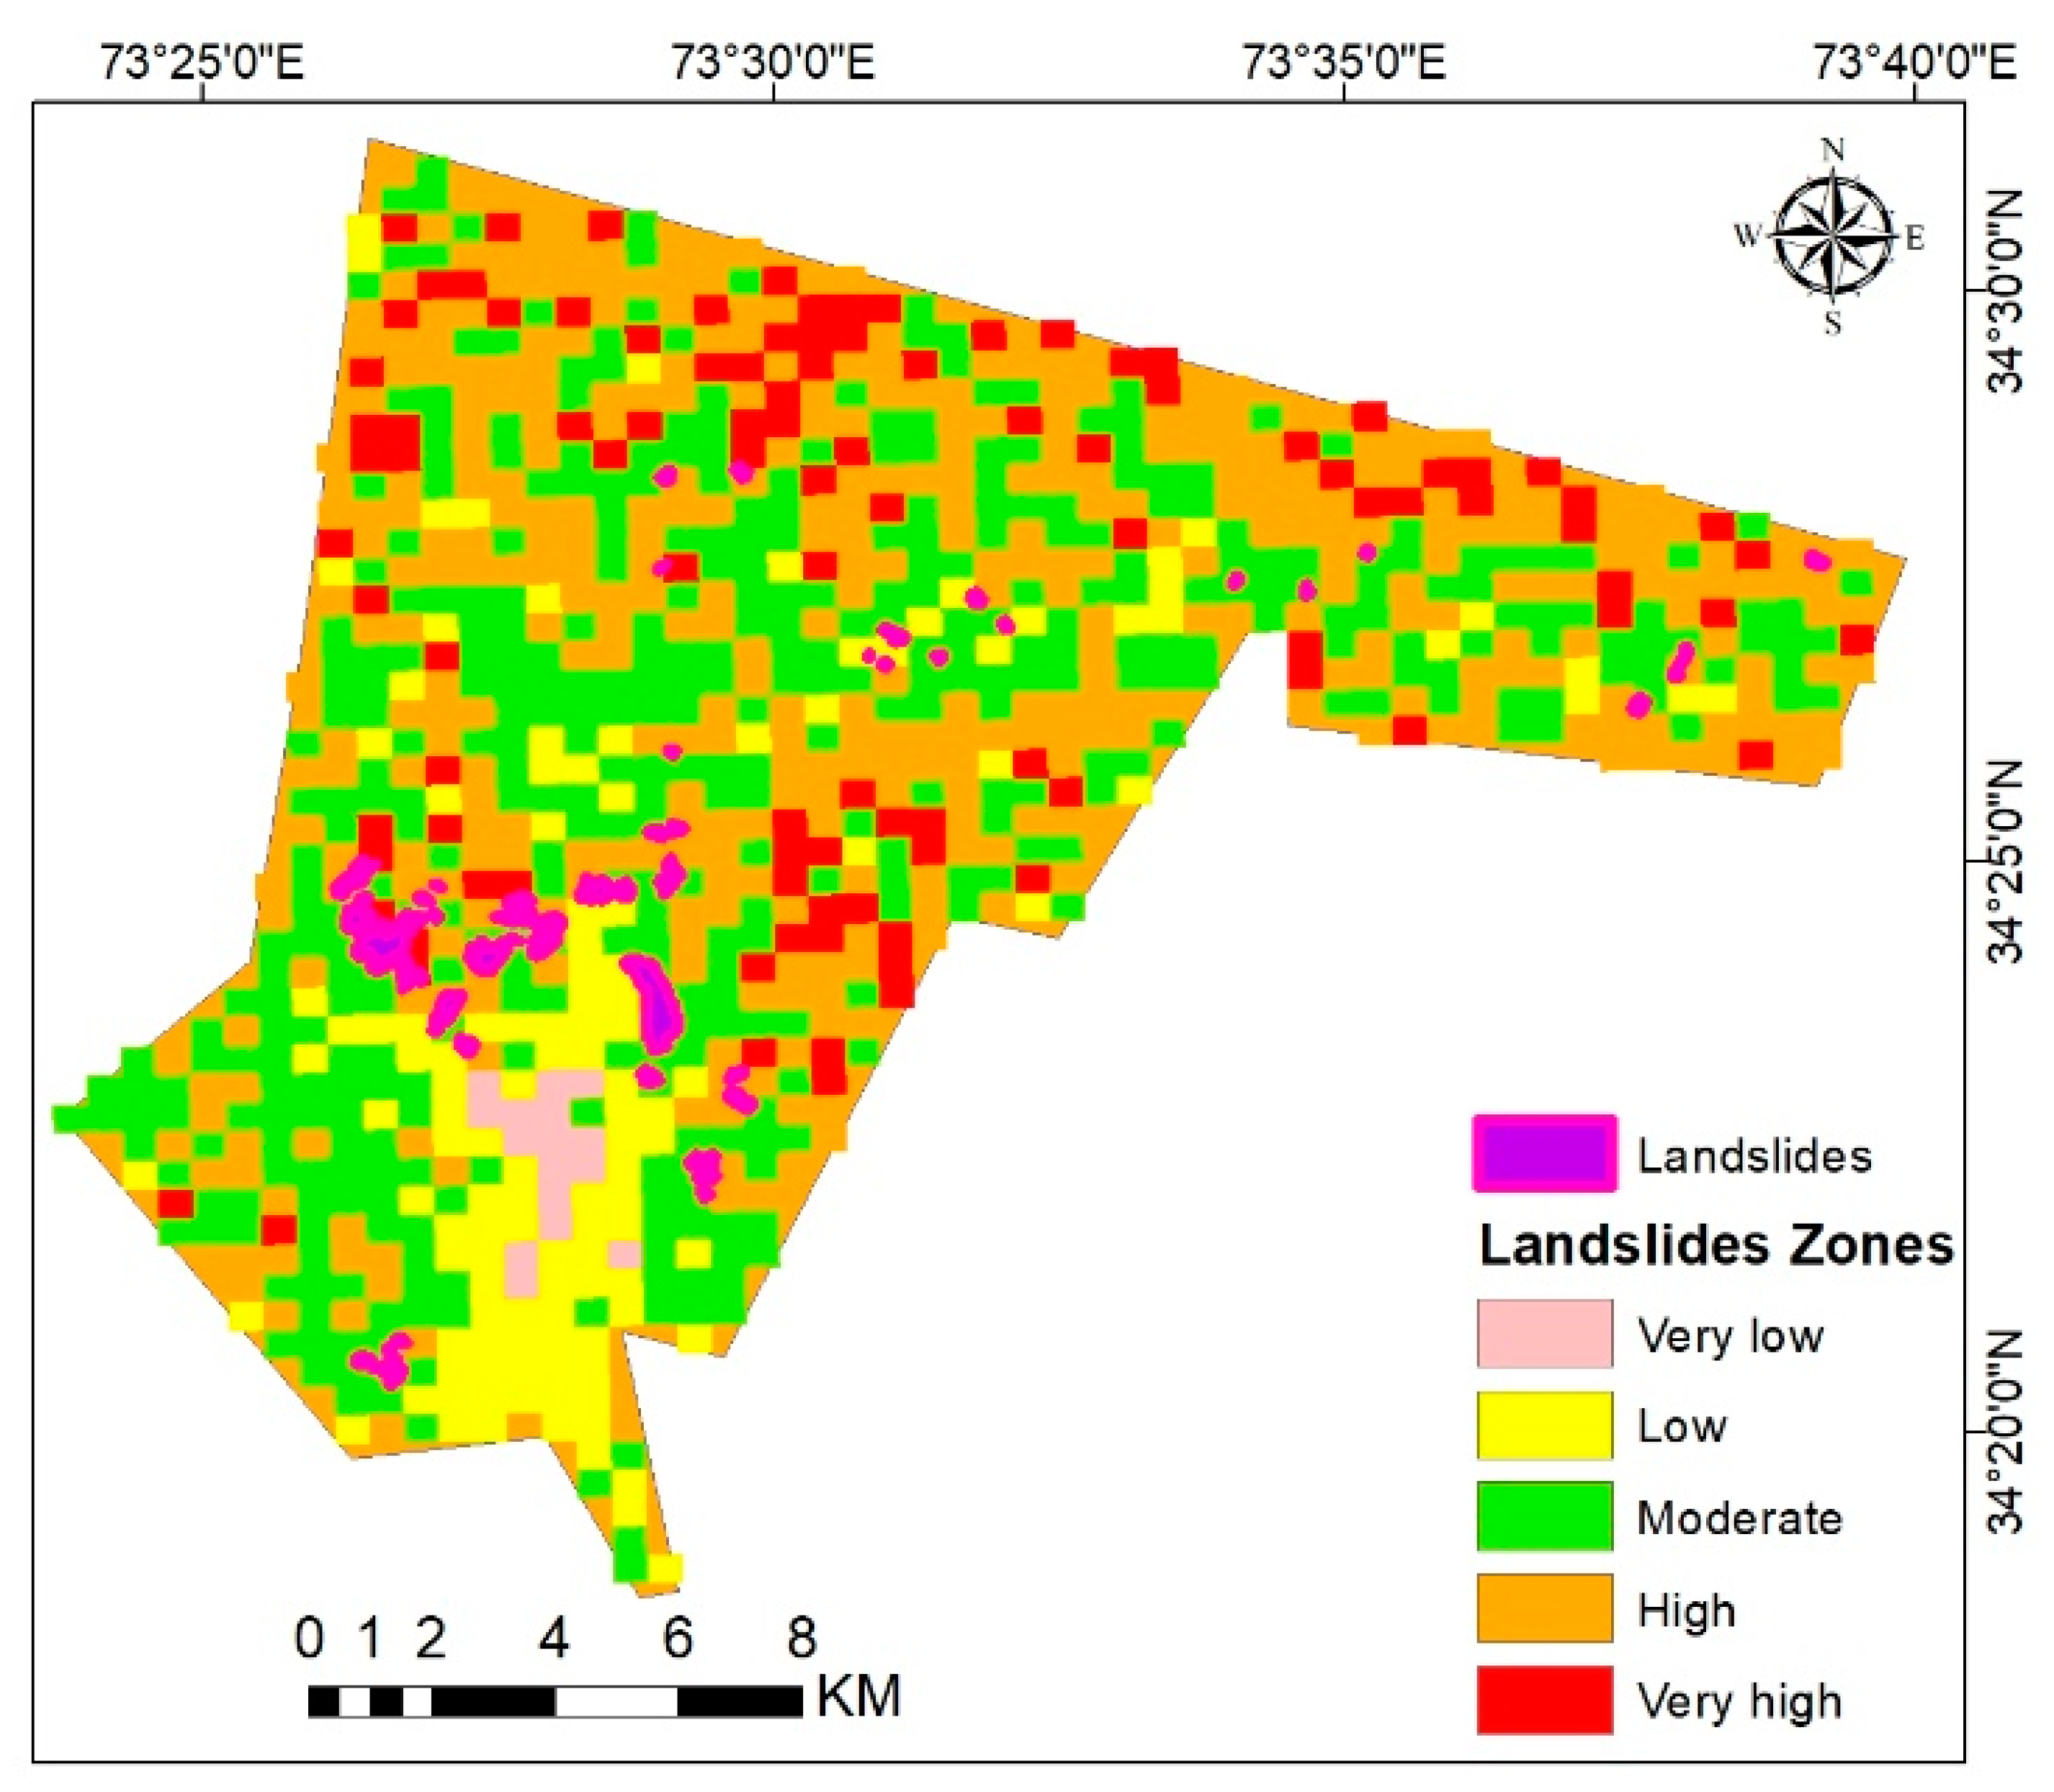
3.3. Landslide Hazard Zone Map and Hazards of Classes

The normalized landslides ( L n ) were obtained using Equation (1) by utilizing the database of the numbers of landslides for all of the classes of influential factors, as provided in Table 1. The normalized landslide pixels ( P n ) were attained using Equation (2) by applying the database of the: (i) numbers of pixels of landslides in the mean class of influential factors ( L p ) and (ii) highest numbers of pixels of landslides in the mean classes for whole class range of influential factors ( H p ) . The landslide hazard ( L h ) was obtained on the basis of the product of normalized landslide pixels ( P n ) and normalized landslides ( L n ) , as provided in Equation (3). The values of the mean landslide hazard ( M Lh ) were obtained for all of the classes of influential factors, using Equation (4) and these are provided in Table 1. The mean hazards for all of the influential factors are discussed in sub-sections (i.e., Section 3.2.1, Section 3.2.2, Section 3.2.3, Section 3.2.4, Section 3.2.5, Section 3.2.6, Section 3.2.7, Section 3.2.8 and Section 3.2.9) under Section 3.2. These hazard values were used as weightages in the multi-criteria decision-making method of the Analytic Hierarchy Process (AHP) model in GIS. Finally, a landslide hazard zone map was produced by using the AHP model and it is presented in Figure 4. The landslides’ hazard zone map was segmented into five hazard zones which are: (i) very low; (ii) low; (iii) moderate; (iv) high; and (v) very high. The percentages of these landslide hazard zones are 1.48%, 11.80%, 39.36%, 37.36%, and 9.57%, respectively. The moderate landslide hazard zone was the dominant hazard zone class in this landslide hazard zone map. The percentage of the high landslide hazard zone was also higher as compared to the percentages of the other hazard zones. The accumulated of moderate, high, and very high landslide hazard zones are 86.29% for Muzaffarabad District. It indicates the higher vulnerability of this study area towards landslides’ hazards.
The methodology was validated by overlaying the database of 35 landslides and 19 landslides on the landslide hazard zone map. In the case of 35 landslides, the percentages of these landslides in very low, low, moderate, high, and very high hazard zones were 0.00%, 2.86%, 17.14%, 31.43%, and 48.57%, respectively. These percentages were 0.00%, 5.26%, 15.79%, 31.58%, and 47.37%, respectively, for these hazard zones in the case of 19 landslides. The percentages for both of the cases were plotted in Figure 5, and the coefficient of determination (r2) was 0.96, which revealed a strong relationship between the model development and validation. This relationship also proves the highest accuracy of the landslide hazard zone methodology and the landslide hazard zone map produced for the study area.

4. Discussion

4.1. Influential Factors and Highest Percentage of Landslide Occurrence

The above section presented the relationship between landslide occurrence and different influential factors. Among all of the elevation classes, the maximum landslide occurrence (i.e., 42.86%) was observed for the elevations of 800–1000 m. A similar percentage of landslide events was found for the rainfall class of 1350–1405 mm/year. In the study area, the rainfall is not evenly distributed, and the precipitation occurs in the monsoon and winter seasons. The rainfall and seasonal variation were the most influential factors causing landslide hazards [9]. The snowmelt and rainfall during monsoon erode the soil, triggering many landslides to continue by increasing the pore water pressure in unconsolidated sediments [11,52].
Furthermore, the rainwater’s slow and steady movement into the soft rock, which does not have a strong bond with the bedrock, consequently causes failure, and the chances of landslides are increased [44]. Additionally, 91.43% of landslide occurrence was found in the bare soil. This could be attributed to the fact that human activities, such as flattening the land, cutting, excavating for hillside roads, and foundation construction might further increase landslides [41].
Regarding the slope classes, landslide occurrence was highest in the slope class of 35°–40°, and it was found to be 40%. Concerning the slope aspect, the dominant class was S and SW, with 31.43% of the landslide occurrence. For the surface roughness index, the prevailing class was 45–60, with 51.43% of the landslide occurrence. In the case of the topographic position index, the highest percentage of 65.71% was for class −1.74–−1.25. The artificial excavation practices played a vital role in landslides in the study region, as there was insufficient flat land for construction and agricultural activities. The hydrologic conditions of the slopes could be affected because of the changes in landcover, and ultimately the slopes become unstable [52]. The weak rocks and soils could be more vulnerable to landslides, while the vegetative cover could enhance the slope stability [52]. A previous study was conducted to obtain the relationship between landslide failures and slope classes, and it was revealed that most of the failures were observed in the slopes ranging from 23° to 35° [53]. This study concluded that the slope inclination of a high slope might not mean increased chances of landslides’ occurrence.
Concerning the distance from the main road (buffered roads), 25.71% of the landslides’ occurrence was observed for the class 40–80 m. Similarly, the highest landslides’ occurrence (i.e., 22.86%) was found for the 40–80 min case of buffered drainage. It means that, as the distance from the drainage decreases, the risk of the landslides increases. The study area is situated at the confluence of two rivers, the Neelum and Jhelum Rivers. The water levels could rise in the streams and rivers due to monsoon rainfall during summer. The flowing water could erode materials from the surrounding areas due to its high velocity, which ultimately could increase the landslide hazard. The relationship of streams and drains with the landslide hazard occurrence was considered in many studies [25,54,55]. The landslide hazard was studied using GIS along the CPEC route, taking several influential factors into account, including lithology, seismicity, rainfall intensity, faults, elevation, slope angle, aspect, curvature, land cover, and hydrology [52]. Based on these factors, a landslide susceptibility map was developed and concluded that active faults, slope gradient, seismicity, and lithology could significantly influence the landslides’ occurrence.

4.2. Built-Up Area Occurrence in Hazard Zones

The built-up area was overlaid onto the landslide hazard zones, and it was found that 0% lay in a very high hazard zone, 4.25% in a high hazard zone, 11.25%, 44.52%, and 39.96% occurred in moderate hazard, low hazard, and very low hazard zones, respectively. Almost 15.5% of the total area lies inside the high and moderate hazard zones. Landslides could be induced by artificial and natural forces, with man-made influences outweighing natural ones in severity [56,57]. In Italy, population growth and the expansion of urban built-up areas compelled people to build homes near landslide hazard zones [56]. The morphology of the hillslopes could be altered by the urban development, resulting in the remobilization of the terrain and the reactivation of historical landslides. Another study revealed that 50% of the built-up areas lie within the high susceptibility zone [52,58]. This situation needs adequate planning and mitigation strategies. The landslides could be triggered anytime in such zones, and furthermore, the people living in these areas are the most vulnerable to landslide hazards. Government organizations and agencies should adopt strategies to cater to the landslide hazards and provide safety to those people living in the hazard zones.

4.3. Bare Soil Occurrence in Hazard Zones

For the bare soil, 9.43% of the bare soil area lies in a very high hazard zone, 36.47% lies in the high hazard zone, 41.25%, 12.44%, and 0.40% of the bare soil areas are in the moderate, low, and very low hazard zones. Barren land is this type of land, with a flat topography and less, or scarce, vegetation. In our present analysis, most of the bare soil could occur in the very high (9.43%), high (36.47%), and moderate (41.25%) hazard zones. This type of bare soil would not be suitable for future construction without proper planning and mitigation measures.

5. Conclusions

In this study, a new integrated approach was utilized for landslide hazard modelling, which included GIS modelling, GIS analysis, remote sensing-based image analysis, focal zonal statistics, mathematical normalization modelling, mathematical hazard modelling, and Analytic Hierarchy Process modelling with validation. On this basis, the mean hazards for all of the classes of all of the influential factors were attained and used for producing the final landslide hazard zone map. The results indicated that the highest mean hazards were found in the classes of bare soil, topographic position index, buffered drainage, and buffered road. The mean hazard was also high for the classes of slope aspect and rainfall.
The study area was found most vulnerable and susceptible to landslide occurrence. Based on our findings, both human and physical factors could be responsible for the landslide occurrence. The steep and irregular slopes, heavy rainfall, and barren soil were significant physical factors. In contrast, improper drainage networks and the construction of roads and infrastructures at steep slopes and higher elevations could be human-induced factors. The Muzaffarabad region is located near the active Bagh–Balakot fault line, which burst out during the 2005 earthquake and prompted many landslides. Besides this, seasonal monsoon rainfall could be another prominent factor responsible for landslide hazards. Moreover, improper land-use planning, with the construction of ill-planned road networks and built-up areas, could be important for causing the loss of lives and infrastructure due to landslide hazards. Applying the landslide hazard zone map onto the built-up area indicated that 4.25% of this class is in a high hazard zone, and 11.25% of the sites lie in the moderate hazard zone.
This reveals the risk to inhabitants of the constructed areas for possible future damage due to the disaster of landslides. The presence of 45.9% of barren land in the high and very high hazard zone could be a potential risk for infrastructure construction in the study area. The landslide hazard zone map could be considered to be a valuable technique to assess the most vulnerable landslide zones in such a landslide-prone area. The usefulness and accuracy of the landslide hazard zone map could be further enhanced by considering additional influential factors, such as earthquakes, geology, soil, climatic changes, etc. Various government departments could utilize the landslide hazard zone map produced in this paper in the study area, which includes District Disaster Management Authority, Planning and Development Department, Communication and Works Department, and Civil Defense Department. Future studies should incorporate geology, morphology, and geomorphology for a more in-depth understanding of landslides from an epidemiological angle in the study area.

Author Contributions

Data curation and writing—review and editing, T.A.A.; formal analysis, S.U.; methodology, W.U.; software and validation, R.U.; investigation and resources, S.U. and M.F.J.; writing—original draft preparation, R.U.S.; writing—review and editing, W.U.; visualization, R.U. and R.U.S.; supervision, T.A.A.; project administration, funding acquisition, A.M., A.K. and A.D. All authors have read and agreed to the published version of the manuscript.

Funding

This research received no external funding.

Institutional Review Board Statement

Not applicable.

Informed Consent Statement

Not applicable.

Data Availability Statement

All the data used in the research are presented in the manuscript.

Acknowledgments

All the authors thank editors and anonymous reviewers for their constructive comments and suggestions for improving the quality of this paper.

Conflicts of Interest

The authors declare no conflict of interest regarding the processing and possible publication of the manuscript.

Appendix A

Table A1. GPS-based field validation survey for landslide hazard modelling.
SNXYElevation
134.4273.52083
234.4473.511098
334.4577.571146
434.473.511519
534.4973.491530
634.3773.481373
734.3373.451439
834.3973.451436
934.473.451531
1034.4773.51226
1134.4973.471364
1234.4473.571520
1334.473.451269
1434.3373.441246
1534.3873.461710
1634.4473.511226
1734.6173.441139

References

  1. Van Westen, C.J. The modelling of landslide hazards using GIS. Surv. Geophy. 2000, 21, 241–255. [Google Scholar] [CrossRef]
  2. Zhuo, L.; Dai, Q.; Han, D.; Chen, N.; Zhao, B.; Berti, M. Evaluation of Remotely Sensed Soil Moisture for Landslide Hazard Assessment. IEEE J. Sel. Top. Appl. Earth Obs. Remote Sens. 2019, 12, 162–173. [Google Scholar] [CrossRef]
  3. El Bcharia, F.; Theilen-Willigeb, B.; Malek, H.A. Landslide hazard zonation assessment using GIS analysis at the coastal area of Safi (Morocco). In Proceedings of the 29th International Cartographic Conference, Tokyo, Japan, 10 July 2019; p. 2. [Google Scholar]
  4. Zhang, H.; Zhang, G.; Jia, Q. Integration of Analytical Hierarchy Process and Landslide Susceptibility Index Based Landslide Susceptibility Assessment of the Pearl River Delta Area, China. IEEE J. Sel. Top. Appl. Earth Obs. Remote Sens. 2019, 12, 4239–4251. [Google Scholar] [CrossRef]
  5. Soeters, R.; Van Westen, C. Slope instability recognition, analysis and zonation. Landslides Investig. Mitigat. 1996, 247, 129–177. [Google Scholar]
  6. Marsala, V.; Galli, A.; Paglia, G.; Miccadei, E. Landslide Susceptibility Assessment of Mauritius Island (Indian Ocean). Geosciences 2019, 9, 493. [Google Scholar] [CrossRef]
  7. Slam, B.; Maqsoom, A.; Khalil, U.; Ghorbanzadeh, O.; Blaschke, T.; Farooq, D.; Tufail, R.F.; Suhail, S.A.; Ghamisi, P. Evaluation of Different Landslide Susceptibility Models for a Local Scale in the Chitral District, Northern Pakistan. Sensors 2022, 22, 3107. [Google Scholar] [CrossRef]
  8. Mind’je, R.; Li, L.; Nsengiyumva, J.B.; Mupenzi, C.; Nyesheja, E.M.; Kayumba, P.M.; Gasirabo, A.; Hakorimana, E. Landslide susceptibility and influencing factors analysis in Rwanda. Environ. Dev. Sustain. 2020, 22, 7985–8012. [Google Scholar] [CrossRef]
  9. Zhu, A.X.; Wang, R.; Qiao, J.; Qin, C.Z.; Chen, Y.; Liu, J.; Zhu, T. An expert knowledge-based approach to landslide susceptibility mapping using GIS and fuzzy logic. Geomorphology 2014, 214, 128–138. [Google Scholar] [CrossRef]
  10. Crosta, G.B. Introduction to the special issue on rainfall-triggered landslides and debris flows. Eng. Geol. 2004, 3, 191–192. [Google Scholar] [CrossRef]
  11. Dai, F.; Lee, C.; Ngai, Y.Y. Landslide risk assessment and management: An overview. Eng. Geol. 2002, 64, 65–87. [Google Scholar] [CrossRef]
  12. Owen, L.A.; Kamp, U.; Khattak, G.A.; Harp, E.L.; Keefer, D.K.; Bauer, M.A. Landslides triggered by the 8 October 2005 Kashmir earthquake. Geomorphology 2008, 94, 1–9. [Google Scholar] [CrossRef]
  13. Akbar, T.A.; Ha, S.R. Landslide hazard zoning along Himalayan Kaghan Valley of Pakistan—By integration of GPS, GIS, and remote sensing technology. Landslides 2011, 8, 527–540. [Google Scholar] [CrossRef]
  14. Skrzypczak, I.W.; Kokoszka, W.; Kogut, J. The impact of landslides on local infrastructure and the environment. In Proceedings of the International Conference on Environmental Engineering ICEE, Kobe, Japan, 12–18 November 2017; Vilnius Gediminas Technical University: Vilnius, Lithuania, 2017; pp. 27–28. [Google Scholar]
  15. Lee, S.; Pradhan, B. Landslide hazard mapping at Selangor, Malaysia using frequency ratio and logistic regression models. Landslides 2007, 4, 33–41. [Google Scholar] [CrossRef]
  16. Winter, M.G.; Shearer, B.; Palmer, D.; Peeling, D.; Harmer, C.; Sharpe, J. The economic impact of landslides and floods on the road network. Procedia Engine 2016, 143, 1425–1434. [Google Scholar] [CrossRef]
  17. Erawati, I.; Hadmoko, D.S. Assessment of Economic Vulnerability and Community Resilience in Lanslide Prone Areas after a Landslide Event. Ph.D. Dissertation, Universitas Gadjah Mada, Yogyakarta, Indonesia, 2013. [Google Scholar]
  18. Dahal, R.K.; Hasegawa, S.; Nonomura, A.; Yamanaka, M.; Dhakal, S. DEM-based deterministic landslide hazard analysis in the Lesser Himalaya of Nepal. Georisk 2008, 2, 161–178. [Google Scholar] [CrossRef]
  19. Gattinoni, P. Parametrical landslide modelling for the hydrogeological susceptibility assessment: From the Crati Valley to the Cavallerizzo landslide (Southern Italy). Nat. Hazards 2009, 50, 161–178. [Google Scholar] [CrossRef]
  20. Grøneng, G.; Christiansen, H.H.; Nilsen, B.; Blikra, L.H. Meteorological effects on seasonal displacements of the Åknes rockslide, western Norway. Landslides 2011, 8, 1–15. [Google Scholar] [CrossRef]
  21. Khattak, G.A.; Owen, L.A.; Kamp, U.; Harp, E.L. Evolution of earthquake-triggered landslides in the Kashmir Himalaya, northern Pakistan. Geomorphology 2010, 115, 102–108. [Google Scholar] [CrossRef]
  22. Godschalk, D.R.; Brody, S.; Burby, R. Public participation in natural hazard mitigation policy formation: Challenges for comprehensive planning. J. Environ. Plan. Manag. 2003, 46, 733–754. [Google Scholar] [CrossRef]
  23. Saha, A.K.; Gupta, R.P.; Sarkar, I.; Arora, M.K.; Csaplovics, E. An approach for GIS-based statistical landslide susceptibility zonation—With a case study in the Himalayas. Landslides 2005, 2, 61–69. [Google Scholar] [CrossRef]
  24. Bera, A.; Mukhopadhyay, B.P.; Das, D. Landslide hazard zonation mapping using multi-criteria analysis with the help of GIS techniques: A case study from Eastern Himalayas, Namchi, South Sikkim. Nat. Hazards 2019, 96, 935–959. [Google Scholar] [CrossRef]
  25. Kanwal, S.; Atif, S.; Shafiq, M. GIS based landslide susceptibility mapping of northern areas of Pakistan, a case study of Shigar and Shyok Basins. Geo. Nat. Hazards Risk 2017, 8, 348–366. [Google Scholar] [CrossRef]
  26. Karantanellis, E.; Marinos, V.; Vassilakis, E. 3D hazard analysis and object-based characterization of landslide motion mechanism using UAV imagery. In Proceedings of the International Archives of the Photogrammetry, Remote Sensing and Spatial Information Sciences, Enschede, The Netherlands, 10–14 June 2019; pp. 425–430. [Google Scholar]
  27. Scaioni, M.; Longoni, L.; Melillo, V.; Papini, M. Remote sensing for landslide investigations: An overview of recent achievements and perspectives. Remote Sens. 2014, 6, 9600–9652. [Google Scholar] [CrossRef]
  28. Zhao, W.; Li, A.; Nan, X.; Zhang, Z.; Lei, G. Post-earthquake landslides mapping from Landsat-8 data for the 2015 Nepal earthquake using a pixel-based change detection method. IEEE J. Sel. Top. Appl. Earth Obs. Remote Sens. 2017, 10, 1758–1768. [Google Scholar] [CrossRef]
  29. Giordan, D.; Manconi, A.; Remondino, F.; Nex, F. Use of unmanned aerial vehicles in monitoring application and management of natural hazards. Geo. Nat. Hazards Risk 2017, 8, 1–4. [Google Scholar] [CrossRef]
  30. Lv, Z.Y.; Shi, W.; Zhang, X.; Benediktsson, J.A. Landslide inventory mapping from bitemporal high-resolution remote sensing images using change detection and multiscale segmentation. IEEE J. Sel. Top. Appl. Earth Obs. Remote Sens. 2018, 11, 1520–1532. [Google Scholar] [CrossRef]
  31. Peyret, M.; Djamour, Y.; Rizza, M.; Ritz, J.F.; Hurtrez, J.E.; Goudarzi, M.A.; Uri, F. Monitoring of the large slow Kahrod landslide in Alborz Mountain range (Iran) by GPS and SAR interferometry. Eng. Geol. 2008, 100, 131–141. [Google Scholar] [CrossRef]
  32. Avtar, R.; Singh, G.; Verma, R.L.; Sawada, H.; Singh, C.K.; Mukherjee, S. Landslide susceptibility zonation study using remote sensing and GIS technology in the Ken-Betwa River Link area, India. Bull. Eng. Geol. Environ. 2011, 70, 595–606. [Google Scholar] [CrossRef]
  33. Devkota, K.C.; Regmi, A.D.; Pourghasemi, H.R.; Yoshida, K.; Pradhan, B.; Ryu, I.C.; Althuwaynee, O.F. Landslide susceptibility mapping using certainty factor, index of entropy and logistic regression models in GIS and their comparison at Mugling–Narayanghat road section in Nepal Himalaya. Nat. Hazards 2013, 65, 135–165. [Google Scholar] [CrossRef]
  34. Ahmed, B. Landslide susceptibility mapping using multi-criteria evaluation techniques in Chittagong Metropolitan Area, Bangladesh. Landslides 2015, 12, 1077–1095. [Google Scholar] [CrossRef]
  35. Cárdenas, N.Y.; Mera, E.E. Landslide susceptibility analysis using remote sensing and GIS in the western Ecuadorian Andes. Nat. Hazards 2016, 81, 1829–1859. [Google Scholar] [CrossRef]
  36. Stanley, T.; Kirschbaum, D.B. A heuristic approach to global landslide susceptibility mapping. Nat. Hazards 2017, 87, 145–164. [Google Scholar] [CrossRef] [PubMed]
  37. Mahdadi, F.; Boumezbeur, A.; Hadji, R.; Kanungo, D.P.; Zahri, F. GIS-based landslide susceptibility assessment using statistical models: A case study from Souk Ahras province, NE Algeria. Arab. J. Geosci. 2018, 11, 476. [Google Scholar] [CrossRef]
  38. Chau, K.T.; Sze, Y.L.; Fung, M.K.; Wong, W.Y.; Fong, E.L.; Chan, L.C.P. Landslide hazard analysis for Hong Kong using landslide inventory and GIS. Comput. Geosci. 2004, 30, 429–443. [Google Scholar] [CrossRef]
  39. Jaedicke, C.; Van Den Eeckhaut, M.; Nadim, F.; Hervás, J.; Kalsnes, B.; Vangelsten, B.V.; Smebye, B. Identification of landslide hazard and risk ‘hotspots’ in Europe. Bull. Eng. Geol. Environ. 2014, 73, 325–339. [Google Scholar] [CrossRef]
  40. Ayalew, L.; Yamagishi, H. The application of GIS-based logistic regression for landslide susceptibility mapping in the Kakuda-Yahiko Mountains Central Japan. Geomorphology 2005, 65, 15–31. [Google Scholar] [CrossRef]
  41. Kumalasari, H.; Koestoer, R.; Hasibuan, H. Disaster Risk Mitigation of Landslide for Sustainability of Geothermal Production in Bandung Regency, West Java Province, Indonesia. In Proceedings of the 2nd International Conference on Environmental Resources Management in Global Region (ICERM 2018), Yogyakarta, Indonesia, 22–23 October 2018; Volume 256. [Google Scholar]
  42. Rahman, A.U.; Khan, A.N.; Collins, A.E. Analysis of landslide causes and associated damages in the Kashmir Himalayas of Pakistan. Nat. Hazards 2014, 71, 803–821. [Google Scholar] [CrossRef]
  43. Malek, Z.; Zumpano, V.; Schröter, D.; Glade, T.; Balteanu, D.; Micu, M. Scenarios of land cover change and landslide susceptibility: An example from the Buzau Subcarpathians, Romania. Eng. Geol. Soc. Territ. 2015, 5, 743–746. [Google Scholar]
  44. Batool, M.; Ahmad, S.R.; Asif, M. An assessment of landslide hazards in Muzaffarabad-Azad Jammu & Kashmir using geospatial techniques. Pak. Geogr. Rev. 2021, 76, 164–173. [Google Scholar]
  45. Zeeshan, M.; Mirza, K. Landslide detection and susceptibility mapping using geological and remote sensing data: A case study of azad kashmir, nw sub-himalayas. Acta Geodyn. Et Geromaterialia 2021, 18, 29–45. [Google Scholar] [CrossRef]
  46. Ali, S.; Biermanns, P.; Haider, R.; Reicherter, K. Landslide susceptibility mapping by using a geographic information system (GIS) along the China–Pakistan Economic Corridor (Karakoram Highway), Pakistan. Nat. Hazards Earth Syst. Sci. 2019, 19, 999–1022. [Google Scholar] [CrossRef]
  47. Lindsay, E.; Frauenfelder, R.; Rüther, D.; Nava, L.; Rubensdotter, L.; Strout, J.; Nordal, S. Multi-Temporal Satellite Image Composites in Google Earth Engine for Improved Landslide Visibility: A Case Study of a Glacial Landscape. Remote Sens. 2022, 14, 2301. [Google Scholar] [CrossRef]
  48. El Jazouli, A.; Barakat, A.; Khellouk, R. GIS-multicriteria evaluation using AHP for landslide susceptibility mapping in Oum Er Rbia high basin (Morocco). Geoenviron. Disasters 2019, 6, 1–12. [Google Scholar] [CrossRef]
  49. Barredo, J.A.; Benavides, J.; Hervás, J.; Van Westen, C.J. Comparing heuristic landslide hazard assessment techniques using GIS in the Tirajana basin, gran Canaria Island, Spain. Int. J. Appl. Earth Obs. Geoinf. 2019, 2, 9–23. [Google Scholar] [CrossRef]
  50. Kamp, U.; Growley, B.J.; Khattak, G.A.; Owen, L.A. GIS-based landslide susceptibility mapping for the 2005 Kashmir earthquake region. Geomorphology 2008, 101, 631–642. [Google Scholar] [CrossRef]
  51. Saaty, T.L. A scaling method for priorities in hierarchical structures. J. Math. Psychol. 1980, 15, 234–281. [Google Scholar] [CrossRef]
  52. Yamagishi, H.; Bahndari, N.P.; Doshida, S.; Yamazaki, F. GIS analyses of shallow and deep-seated landslides in Japan. Int. Arch. Photogram. Remote Sens. Spat. Inf. Sci. 2010, 38, 298–303. [Google Scholar]
  53. Basharat, M.; Shah, H.R.; Hameed, N. Landslide susceptibility mapping using GIS and weighted overlay method: A case study from NW Himalayas Pakistan. Arab. J. Geosci. 2016, 9, 292. [Google Scholar] [CrossRef]
  54. Wang, Q.; Li, W.; Chen, W.; Bai, H. GIS-based assessment of landslide susceptibility using certainty factor and index of entropy models for the Qianyang County of Baoji city, China. J. Earth Syst. Sci. 2015, 124, 1399–1415. [Google Scholar] [CrossRef]
  55. Wu, C.; Qiao, J. Relationship between landslides and lithology in the Three Gorges Reservoir area based on GIS and information value model. Front. For. Chin. 2009, 4, 165–170. [Google Scholar] [CrossRef]
  56. Reichenbach, P.; Mondini, A.; Rossi, M. The influence of land use change on landslide susceptibility zonation: The Briga catchment test site (Messina, Italy). Environ. Manag. 2014, 54, 1372–1384. [Google Scholar] [CrossRef] [PubMed]
  57. Di Martire, D.; De Rosa, M.; Pesce, V.; Santangelo, M.A.; Calcaterra, D. Landslide hazard and land management in high-density urban areas of Campania region, Italy. Nat. Hazards Earth Syst. Sci. 2012, 12, 905–926. [Google Scholar] [CrossRef]
  58. Rybár, J. Increasing impact of anthropogenic activities upon natural slope stability. In Proceedings of the International Symposium on Engineering Geology and the Environment, Athens, Greece, 23 June 1997; pp. 23–27. [Google Scholar]
Figure 1. (a) Location of study area in Pakistan; (b) DEM of study area.
Sustainability 14 10194 g001
Figure 2. Influencing factors in the study area related to climate and LULC types.
Sustainability 14 10194 g002
Figure 3. Influencing factors in the study area related to morphology.
Sustainability 14 10194 g003
Figure 4. Landslide hazard zones of Muzaffarabad District, AJK using AHP model.
Sustainability 14 10194 g004
Figure 5. Percentage of landslide occurrence in hazard zones.
Sustainability 14 10194 g005
Table 1. Landslide (LS) relationship with different influential factors and mean hazards (MH) obtained on the basis of new models.
ClassLSArea (%)MH (%)
LULC
Bare Soil3291.4314.16
Built-up12.862.86
Woody Savanna12.862.86
Grassland12.862.86
EGN Forest00.000.00
Mixed Forest00.000.00
Wet Land00.000.00
Crop Land00.000.00
Water Bodies00.000.00
Elevation (m)
600–80038.576.89
800–10001542.864.87
1000–1200617.146.46
1200–1400720.006.65
1400–1600411.435.20
Slope (°)
20–2538.574.82
25–3012.862.86
30–351337.146.00
35–401440.004.57
40–5038.574.42
Slope Aspect (°)
N and NE617.144.59
E38.575.40
SE1028.575.98
S and SW1131.439.01
W and NW514.294.57
Rainfall (mm/yr.)
1350–14051542.869.03
1405–1460411.433.73
1460–151538.571.52
1515–157025.714.13
1570–162512.861.28
Buffered drainage (m)
0–4000.000.00
40–80822.8612.83
80–120514.295.45
120–160720.0011.54
160–200411.438.85
Buffered road (m)
0–4038.575.31
40–80925.7112.48
80–120822.868.74
120–16038.5710.00
160–200411.436.11
Surface roughness index
0–1500.000.00
15–3000.000.00
30–45925.717.56
45–601851.4310.73
60–138822.8610.99
Topographic position index
−32.75–−5.500.000.00
−5.49–−1.79617.1410.28
−1.74–−1.252365.7113.07
1.25–4.75514.296.90
4.75–3112.862.86
Publisher’s Note: MDPI stays neutral with regard to jurisdictional claims in published maps and institutional affiliations.

