Article

A Multi-Objective Demand/Generation Scheduling Model-Based Microgrid Energy Management System

1
Electrical Engineering Department, University of Basrah, Basrah 61001, Iraq
2
Department of Electrical Engineering, College of Engineering, Northern Border University, Arar 73222, Saudi Arabia
3
National Engineering School of Gabès, Processes, Energy, Environment and Electrical Systems, University of Gabès, LR18ES34, Gabes 6072, Tunisia
*
Authors to whom correspondence should be addressed.
Sustainability 2022, 14(16), 10158; https://doi.org/10.3390/su141610158
Submission received: 25 July 2022 / Revised: 10 August 2022 / Accepted: 12 August 2022 / Published: 16 August 2022

Abstract

:
In recent years, microgrids (MGs) have been developed to improve the overall management of the power network. This paper examines how a smart MG’s generation and demand sides are managed to improve the MG’s performance in order to minimize operating costs and emissions. A binary orientation search algorithm (BOSA)-based optimal demand side management (DSM) program using the load-shifting technique has been proposed, resulting in significant electricity cost savings. The proposed optimal DSM-based energy management strategy considers the MG’s economic and environmental indices to be the key objective functions. Single-objective particle swarm optimization (SOPSO) and multi-objective particle swarm optimization (MOPSO) were adopted in order to optimize MG performance in the presence of renewable energy resources (RERs) with a randomized natural behavior. A PSO algorithm was adopted due to the nonlinearity and complexity of the proposed problem. In addition, fuzzy-based mechanisms and a nonlinear sorting system were used to discover the optimal compromise given the collection of Pareto-front space solutions. To test the proposed method in a more realistic setting, the stochastic behavior of renewable units was also factored in. The simulation findings indicate that the proposed BOSA algorithm-based DSM had the lowest peak demand (88.4 kWh) compared to unscheduled demand (105 kWh); additionally, the operating costs were reduced by 23%, from 660 USD to 508 USD, and the emissions decreased from 840 kg to 725 kg, saving 13.7%.

1. Introduction

1.1. Motivation

Stability and proper management of power system networks are crucial for societies and countries. Optimal power network operation significantly affects economic performance and consumer satisfaction [1]. Smart microgrids (SMGs) facilitate two-way communication between producers and consumers. Consequently, to encourage consumers to control their demand, various costs of electrical energy may have to be applied in what is known as a DSM program, which improves the load profile of consumers [2]. Three DSM categories—environmentally motivated type, market-driven type, and network-driven type—are commonly used, according to the literature. The environmental-driven DSM focuses primarily on environmental and social standards, such as greenhouse gas emission reduction. The network-driven type seeks to maintain system reliability, while the market-driven type seeks to save money for providers and customers [3]. Smart pricing tools for the DSM implementation process include dynamic pricing policies such as time of use (ToU) pricing, off-peak low pricing, critical peak pricing, real-time pricing, and day ahead pricing. In this study, customers’ electricity consumption is influenced by a real-time price (RTP)-based DSM program.
The economics of MGs and environmentally friendly electricity generation can benefit greatly from the inclusion of locally distributed units [4]. In MG, distributed generation units such as wind turbines (WTs) and solar photovoltaic (PV) panels, as well as diesel generators (DGs), microturbines (MTs), and fuel cells (FCs), are among the most useful technologies. Despite the fact that distributed generation units, especially renewable ones, improve the MG’s performance and environmental parameters, the instability of renewable units reduces the stability of the produced power from local sources. Renewable units, such as solar panels and wind turbines, are highly dependent on weather, making these units unstable. Such events in power production have an impact not only on energy availability, but also on the overall stability of the power grid. Because wind and solar resources are unpredictable, a solar-wind energy system is limited in its ability to operate without the addition of backup power sources such as batteries. Because of this, MGs also include electrical storage systems. MGs’ excess electrical energy can be stored in the electrical storage batteries and used later [5]. As a result, the MG’s reliance on the upstream network is reduced by local energy sources such as distributed generators and electrical storage systems. The operational schedule of local energy resources, of course, has a significant impact on their performance and the MG’s efficiency. The distribution of load demand on a number of distributed generators can be as cost-effective as possible through a process known as economic dispatch, which decides the starting and stopping of each distributed generator. Dynamic economic and emission dispatch (DEED) is a critical optimization problem in the control and operation of power systems. Economic dispatch selects which generators to use to meet electricity demand. It resembles clearing the electricity market. The utility creates an overall marginal cost (supply) curve. The economic operation of a power system is investigated by estimating the penalty factor of the nodes of generation using an approximation of the active power losses. By simultaneously minimizing emission and operation costs, the DEED problem provides online generating schedules over a certain predicted load demand period [6,7,8].

1.2. Literature Review

Our research focused on the three previously mentioned issues: (1) DEED, (2) DSM, and (3) a multi-objective energy management system. To solve the DEED problem, many optimization techniques have been proposed in the literature. For DEED problems, the authors of [9] proposed the enhanced genetic algorithm (E-GA) and enhanced differential evolutionary (E-DE) algorithms. The DEED problem was solved using a combination of GA and DE in [10], with different generating unit combinations such as hydrothermal, solar–thermal, and wind–thermal. The authors of [11] proposed an enhanced PSO-based DEED problem with wind uncertainties. In [12,13,14], a multi-agent consensus-based distributed energy management system is proposed. This system takes into account the impact of packet losses in order to eliminate real power mismatch and lower the cost of electricity bills. The issues of the multi-objective optimizer and load shifting-based DSM for cost reduction were not presented. The authors of [15] created a hybrid planning model of DGs and distribution automation (DA) to improve economic, reliability, and operation indices. The objective function minimizes operation, investment, energy loss, and reliability costs. This paper used a stochastic programming approach based on a hybrid simulation called Monte Carlo and simultaneous backward approach to model the uncertainty parameters, such as load, energy price, and network equipment availability. The authors of [16] presented a two-layer energy management model in a smart distribution network that considers flexi-renewable virtual power plants. This model contains market price, load, maximum renewable energy source power, and flexible source demand uncertainties, which are modeled using stochastic programming. The model includes a bi-level optimization model solved by Benders decomposition for a fast solution.
The DSM is the second problem associated with MG energy management. DSM is also regarded as an optimization problem. The DSM program should be used with a number of controllable or shiftable devices, each with its own set consumption pattern. As a result, many meta-heuristic and evolutionary optimization algorithms are preferred for dealing with such complexities [17]. The authors of [18,19,20,21] only studied an optimal DSM program based on load shifting to reduce the cost of electricity bills. The issues regarding the multi-objective optimizer and economic dispatch were not addressed in these studies.
Nowadays, the emphasis is primarily on the optimization of DEED and DSM in combination. A GA-based DED and DSM combination for efficient energy management in a microgrid environment was proposed in [22]. The authors of [23] proposed a novel model of the DED problem in regional grids that included DR. The authors of [24,25] proposed the DEED problem and a time-of-use dynamic price-based DSM (not optimal program) combination model with high wind penetration. The primary goal of the literature’s DEED and DSM combination models was to demonstrate the effects of DSM on the supply side. Some researchers have studied MGs and DSM in recent years. The authors of [26] proposed a cloud-based multi-agent framework for MG DED and monitoring. This paper adopted an optimal DSM-based time-of-use pricing model. Multi-objective optimization and costs of operation and emission issues for multi-DGs were not applied. In other research, the simultaneous minimization of residential peak load and electricity cost has been presented [27]. On the basis of the time-of-use program, the distribution system’s DR program has been evaluated. The issue under consideration has been modeled as multi-objective mixed-integer linear programming. The authors of [28] solved the energy management of a MG connected to the utility power system under probabilistic and deterministic conditions, taking into account the variations of load demand, photovoltaic (PV), and wind turbine (WT) systems. Using an equilibrium optimizer (EO) algorithm, the problem of energy management is solved for a multi-objective function that includes cost minimization, stability improvement, and voltage profile improvement. The authors of [29] solved the issue of energy management within the microgrid by combining customer-oriented with utility-oriented DSM strategies. In light of this, a stochastic energy management framework has been developed in order to implement and evaluate the flexible load-shaping DSM strategy with price-based and incentive-based demand response programs (DRPs) in existing non- dispatchable energy resources. Pedro Faria et al. [30] used the PSO algorithm to minimize the operational cost of distributed energy resources by taking network constraints and demand response into account. In [31], a probabilistic model was adopted to search for multi-objective operation for a smart distribution network with renewable resources (wind and solar). For predicting changes in wind speed and solar radiation, the PDF Rayleigh and beta PDFs PDF were employed. Modeling the creation of solar and wind power at the same time were not taken into account. Despite this, pollutants such as SO2 and NOx are not taken into account when using the three-constraint method to solve problems. ESS and controllable DGs are not included in the MG configuration proposed in [32], which has four objectives of reducing customer peak load, load curve, costs, and emissions fluctuations while including renewable energy and electric vehicles. An economic model for power dispatch to minimize the operating costs in an AC–DC hybrid MG was presented in [33]. This strategy considered the unpredictability of load demand as well as renewable resources. The method of Hong’s two-point estimate was utilized in order to model the uncertainties. The PSO and fuzzy logic systems were used in conjunction with one another to solve the economic dispatch problem. In [34], a genetic algorithm was used for power dispatching in a grid-connected MG in order to minimize the operating costs of PV, WT, FC, and MT systems. An optimal DSM program was not adopted in these studies in order to reduce operation and emission costs as much as possible. Table 1 summarizes the prior research that has been applied to DEED, DSM, and multi-objective function optimization strategies.

1.3. Contributions

According to the previous studies, it is possible to assert that the optimal DSM-based multi-objective supply management optimization of a smart MG that considers randomized natural behavior of RERs is the one that has received the least attention. Because of this, multi-objective management systems were researched and investigated in a MG as part of this research. The following are some novel aspects of this study:
  • This study proposed BOSA-based DSM of a SMG with a MOPSO-based DEED to improve economic and environmental issues. DSM improves the MG load pattern by adopting real-time pricing. MG operators can meet system demand with optimal management of WT, PV panel, DG, MT, and FC energy storage systems, and upstream networks.
  • With the stochastic nature of the renewable resources units, a multi-objective supplier/consumer management system for a SMG based on PDFs has been presented to model the behavior of solar and wind systems, as well as a hybrid wind and solar system, in an effort to achieve the best possible results despite the uncertainty of the situation.
  • The proposed optimal DSM is based on real-time dynamic pricing and the first-ever application of the BOSA optimization algorithm, which employs the load-shifting technique.
  • Using a combination of the optimal DSM program, a multi-objective particle swarm optimizer with the Pareto criterion and fuzzy mechanism based nonlinear sorting was used to find the best MG management program.
  • By utilizing algorithms for optimizing usage of the MG sources and loads, an economic dispatch can be achieved with optimally lower operation costs and pollution outcomes.

1.4. Paper Organization

The remaining sections are organized as follows: Section 2 describes the problem statement. Distribution energy resources and stochastic modeling are demonstrated in Section 3. Section 4 describes the proposed optimal DSM program. The proposed multi-objective optimization model is described in Section 5. The adopted smart MG system is illustrated in Section 6. In Section 7, the BOSA-based MOPSO algorithm is discussed. Results and discussion are covered in Section 8. In Section 9, the main conclusion is presented.

2. Problem Statement

Within the scope of this investigation, a probabilistic model is suggested for demand/generation energy management in SMGs in order to reduce emissions and operational costs. Firstly, a BOSA-based optimal DSM program is proposed to minimize the peak energy consumption using the load-shifting technique by managing the electricity demand of various consumers. The main focus is on reducing peak to average energy consumption by running select appliances when grid stress is low. To that end, all customer loads are first classified as shiftable and non-shiftable. Because shiftable loads play an important role in lowering the peak-to-average ratio, we proposed load-shifting technique in our strategy to optimize the load profile. Due to the inherently unpredictable nature of the wind and solar energies, it is impossible to accurately predict their output and they are always attributed with planning errors due to uncertainty for the following day. Consequently, a PDF is used to model the operation of the solar, wind, and hybrid solar–wind power systems in an effort to achieve the optimal possible results despite the inherent uncertainty in these systems, so as to increase conformity between planning and reality. DEED is one of the most important optimization problems in controlling and operating power systems. DEED recommends a model that uses a MOPSO based on non-dominated sorting and a fuzzy optimization tool to minimize the emissions and operation costs. This model is used to create generating schedules for a predicted load demand period. Additionally, a new price-based DSM program is proposed as a way to solve the dilemma of the high peak unscheduled load profile, to save electricity, and reduce the cost. The section that follows is devoted to modeling and introducing the objective functions.

3. Distribution Energy Resources

In this study, the MG has renewable energy resources such as PV panels and WTs, and nonrenewable ones such as DGs, MTs, and FCs. The adopted grid-connected MG also uses ESS. A DG generates electricity by using a diesel engine and an electric generator. The output power can be adjusted in response to network demand. The MT has the unique ability to simultaneously generate both electricity and heat. A distributed generation unit can generate electricity based on the amount of load it must support. In a FC, the chemical energy of a fuel is converted into electrical energy. Using an ESS, electrical energy can be converted to a form that can be stored and used again at a later time. ESS can help mitigate the effects of renewable energy’s inconsistency when it is used in conjunction with a MG.

3.1. Renewable Units Stochastic Modeling

The adoption of renewable energy units such as solar panels and WTs can have a significant impact on environmental issues. One of the drawbacks of WTs and PV panels is their stochastic behavior. For this reason, the stochastic behavior of renewable units is modelled by the PDF. First, the modeling of renewable units is explained, and then the stochastic parameter generation method is described.

3.1.1. PV Panel

The energy generated by a PV panel is proportional to the solar irradiance. The variation of solar radiation can be modeled using the beta PDF. The probability function of solar irradiance is mathematically represented by Equation (1) [35,36]. This equation is valid if 0 x 1 ,   α 0 ,   β 0 .
f x = C . x α 1 1 x β 1 = 1 0 1 u α 1 1 u β 1 d u x α 1 1 x β 1
f x = Γ α + β Γ α Γ β x α 1 1 x β 1
The mean ( μ ) and variance ( σ 2 ) can be used to express the and β and α parameters as follows,
β = 1 μ μ 1 + μ σ 2 1
α = μ μ 1 + μ σ 2 1
where the gamma function is denoted by Γ   ; C is constant; α and β are beta PDF parameters. The parameter x represents solar irradiance, while f x represents the probability of solar irradiance according to the beta function. The active power produced by the photovoltaic panel can be calculated using Equation (4) [37]. Here, A and λ represent the panel’s surface area and efficiency, respectively.
P p v x = A . λ . x
As a result, when Equation (1) is used, the PDF ( f p v P p v ) for the output power of P p v can be written as follows:
f p v P p v = Γ α + β Γ α Γ β A . λ . x α 1 1 A . λ . x β 1         i f   P p v 0 , P p v s

3.1.2. Wind Turbine

In general, the Rayleigh distribution PDF is given by:
f x = x e x 2 / 2 b 2 b 2
where b is the distribution’s scale parameter. The CDF is defined as [38]:
F x = 1 e x 2 2 b 2
where the wind speed is ( x = V w ), x 0 , , and b is the scale parameter.
Wind turbine output is modeled using the Rayleigh distribution based on the behavior of wind speed [39]. The Rayleigh distribution is a subtype of the Weibull distribution with a shape index of 2.
If V d is a site’s average wind speed, then the scale parameter:
V d = b π 2 = 1.253 b
b = 1 π 2 V d
As a result, by substituting α in PDF and CDF, the WT system’s Rayleigh model will be achieved as a function of the average wind speed, as shown in (10) and (11).
f V V w = 2 π V w V d 2 e π / 4 V w / V d 2 2  
F V V w = 1 e π 4 V w V d 2  
The output power of a specific WT system can be defined as follows [40]:
P w V w = P W R                       V R V w V c o                     P W R V w V c i   V R V c i                 V R V w V c i     0                           V R V w V c i     a n d   V w V c o  
In this equation,   V w , V c i , V R , and V c o represent the wind, cut-in, rated, and cut-out speeds of the WT, while P W R represents its power output. The wind turbine adopted in this study is of the type AIR403 [41], with P W R = 15 kW, V c i = 3.5 m/s, V c o = 18 m/s, and V R = 17.5 m/s.
In this paper, the PDF f P P w for the output power of a WT system can be obtained by applying the transformation theorem as follows [42]:
f p w   P w = 1 F V V c o F V V c i                                                                                                   P w = 0 V R V c i P R π 2 V d 2 V c i + V R V c i P w P R e V c i + V R V c i P w P R 2 π V d 2                           0 < P w < P R F V V c o F V V R                                                                                                                 P R = P w            
Power generation by hybrid WT–solar PV system ( P h ) equals the sum of the power output from the WT system and the PV system.
P h = P w + P p v
Assuming that P w and   P p v are performance-independent according to Equations (4) and (12), a random variable’s density function P h is defined as the convolution of density functions P w and P p v [43]:
f ( P h ) = f p w ( P w ) f p v ( P p v )

4. The Proposed DSM Program

DSM techniques modify customer demand patterns to change the load curve shape in order to minimize the peak consumption [44]. DSM focuses on energy-saving technologies and financial incentives rather than expanding the transmission and distribution grid or generation capacity. Peak periods of the distribution system’s load profile can be rescheduled using an appropriate objective and DSM methodology to eliminate system instabilities caused by high load demand. Six DSM techniques alter the load profile curve. Peak-clipping, valley-filling, load-shifting, load shape flexibility, load growth, and load conservation [45,46]. Figure 1 shows DSM strategies.
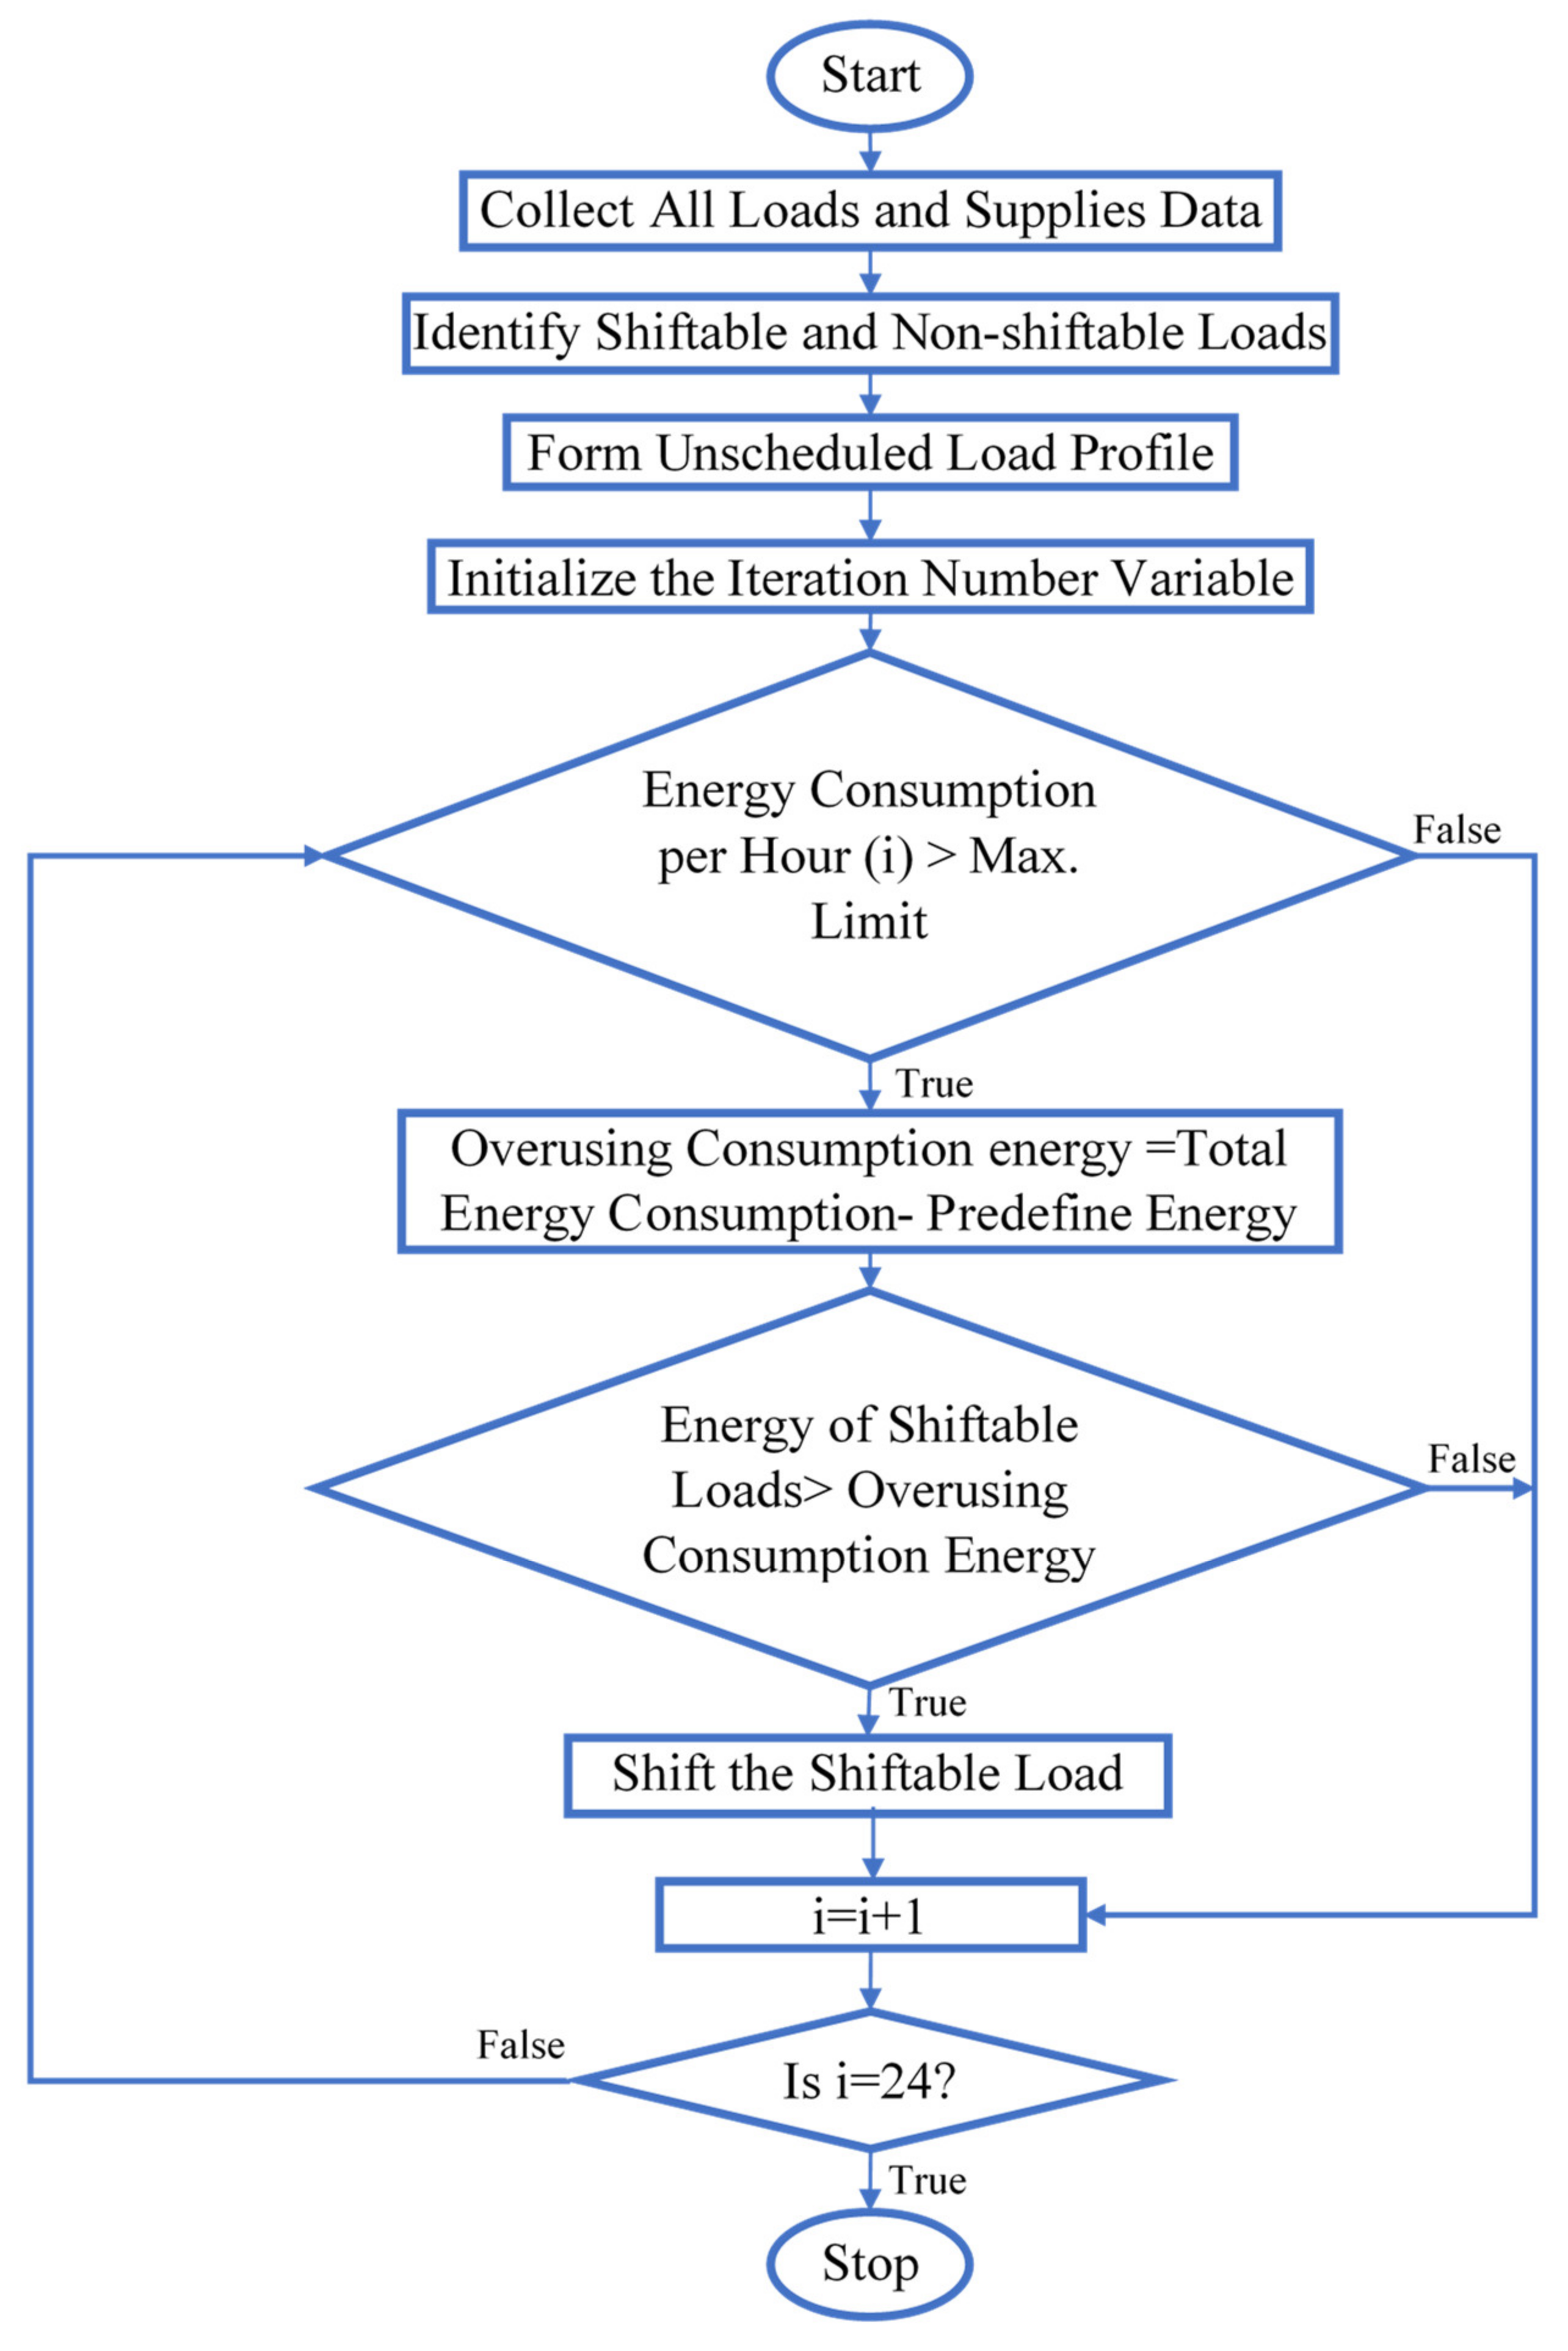
Peak clipping involves removing peaks above a certain consumption point to reduce peak demand. Valley filling collects energy storage devices to redistribute loads during off-peak hours [47]. Load shifting shifts on-peak loads to off-peak periods, reducing peak energy demand. Strategic conservation objectives can improve load profiles by reducing customer demand over a daily time. Strategic load growth helps people respond quickly to high demand. Load shape affects SMG reliability [48]. Individuals can participate in the load control strategy, called flexible loads in SMG management. In this paper, a load-shifting technique based optimal DSM using BOSA is proposed to minimize the peak energy consumption. The optimal load reduction profile is applied as an input to the single objective or multi-objective PSO algorithm for DEED purposes. Figure 2 shows the optimal DSM strategy flowchart. In the first step, a survey is conducted to collect load information. After classifying the loads, a load profile comprising both shiftable and non-shiftable loads was generated. With the aid of the load curve, the consumption of peak load and PAR were analyzed. In addition, the durations of on-peak and off-peak hours were determined using the load profile curve. Hourly consumption limits were compared to the pre-determined hourly consumption limit. Depending on the types of appliances that were in use at the time, the excess energy consumption was reduced through load shifting. Load shifting is implemented if shiftable loads were in operation at the time. This entire procedure was observed for 24 h.

4.1. DSM Objective Function

The desired purpose is to reduce the PAR of total energy usage by electrical service providers. The proposed DSM program based on load shifting schedules each of the system’s shiftable loads such that the energy consumption curve is as near as feasible to the ideal energy consumption curve. In addition, time slots and shiftable loads are considered movable components. Our objective is to reduce the user’s power price while decreasing the PAR to increase the grid’s efficiency. The statement of the minimization problem is as follows:
M i n i m i z e :     t = 1 24 n = 1 N m = 1 M X n , m , t E n , m P R t
S u b j e c t   t o :         P M a x t t = 1 24 n = 1 N m = 1 M X n , m , t E n , m
M n = 24 l n
where t represents the time slots, n represents the number of appliances, m represents the appliance type, P R t represents the price of electricity at time slot t , X represents the ON/OFF state of the device, E represents the energy consumption, and P M a x t represents the maximum power. Maximum allowable delay of the appliance m is denoted by M n , and the appliance’s duration of operation is l n . This illustrates that the total energy consumption of N appliances of M kinds during time slot t is equal to or less than the maximum permitted power for decreasing the peak-to-average ratio.

4.2. Constraints

During the process of load scheduling, constraints must be addressed. For instance, the total number of shiftable appliances should surpass the number of loads moved in an hour. Otherwise, we must rein down excessive demand. In addition, there is time-shift restriction for shiftable loads; we may postpone or advance it within the allowed range. Equation (19) states that the number of shiftable appliances at the time step t cannot be fewer than the number of shifted appliances, since DSM can only plan load shiftability. Finally, we impose a time constraint on the shifting of controlled loads
S n , m , t t = 1 24 H n , m , t                                   T t T
where S represents the shifted appliances, H represents the shiftable appliances, and T represents the maximum time shift.
At all times, the user’s power consumption must be less to or equal to the maximum power consumption. This is demonstrated using Equation (20):
P D e m a n d t P m a x D e m a n d t                                     t 0 , 24
where P D e m a n d t is the power demand at hour t -th of the day and P m a x D e m a n d t represents the authorized maximum power demand limit.
To achieve the load duration criteria, all controllable and non-controllable loads are scheduled for the whole 24 h of the day. The load duration is the anticipated operating time for the device type:
S u b j e c t   t o   t = 1 24 m = 1 M X m , t = d m
where d m represents the operating hours number associated with the load type “ m ”.
Demand for shifted and scheduled loads should be equal to the total daily demand for loads before scheduling:
S u b j e c t   t o   t = 1 24 m = 1 M B m , t = t = 1 24 m = 1 M A m , t
where B m , t is the total daily demand for the m -th type of load shifting before the t -th hour and A m , t is the total daily demand for the m -th type of load shifting after the t -th hour.
The load shifting-based distributed scheduling mechanism addresses the appliances in each time slot cumulatively and generates a full pattern as a result of solving the minimization problem.

4.3. Binary Orientation Search Optimization Algorithm

The BOSA presented in (2019) simulates orientation game rules. Players follow the referee’s instructions in this game. The players’ initial or starting positions are shown in Equation (23) [49]
X i = x i 1 ,   , x i d ,   , x i n
where x i d represents the position of player i of d -dimension, and n is the number of variables.
In each iteration, the referee is the player with the highest value of the fitness function, as described in Equation (24) [49].
Referee = M a x i m i z a t i o n   p r o b l e m : l o c a t i o n   o f   max f   M i n i m i z a t i o n   p r o b l e m : l o c a t i o n   o f   min f
The letter f denotes the value of the fitness function.
The direction in which the referee’s hand moves does not always correspond to the direction wherein the referee moves. The referee’s hand is the only consideration for players. To simulate the direction, Equations (25) and (26) are used [49]:
P i = 0.8 + 0.2 t T
O r i e n t a t i o n i d = s i g n Referee d P l a y e r i d                             f o r       r a n d < P i         s i g n Referee d P l a y e r i d                                       e l s e                  
At t iteration, and maximum iteration T .
While each player must move in the referee’s direction, some may not be able to. Equations (27) and (28) model this problem.
e r r o r = 0.2 1 t T
x i d = x i d + r a n d O r i e n t a t i o n i d x h o d                                     f o r       r a n d < e r r o r   x l o d + r a n d x h o d x l o d                                           e l s e                                
where x h o d   and   x l o d represent the upper and lower limit.
Particle positions in discrete space are represented by the numbers zero and one for each of the two dimensions. Changing an agent’s value from zero to one or from one to zero corresponds to its movement in any dimension. As a result, a probability function is used to calculate the player’s displacement in each dimension, and the player’s position is then updated as a result. Probability functions in the BOSA are restricted to the intervals [0–1]. In Equation (29) [49], the probability function S ( d X j , d   t ) is shown.
S ( d X j , d   t ) = tanh d X j , d   t
The new position of every player is simulated in accordance with the probability function (30).
X j , d   t + 1 = c o m p l e m e n t X j , d   t                     f o r     r a n d < S ( d X j , d   t )         X j , d   t                                                       e l s e                                                
A description of the various steps involved in the BOSA is provided as follows
BOSA Algorithm Steps
  • Step 1: the system space will be defined, and the initial values will be selected.
  • Step 2 is the initial positioning of the players.
  • Step 3 is the evaluation of the players.
  • In Step 4, the referee will decide which way each player should face.
  • Step 5: Maintaining an up-to-date position for the referee.
  • In Step 6, the probability function for displacement is computed, which is the final step.
  • Step 7 involves bringing the status of the player up to date.
  • Step 8: repeat Steps 3–7 indefinitely or until the stop condition is satisfied, whichever comes first.
In this study, generation demand-side management is subjected to a multi-objective MG problem. Reducing daily MG operation cost and pollutant production are the main objectives. These indices are optimized with production–consumption power balance and energy storage system constraints. Mathematical explanations of objective functions and constraints follow.

5. Multi-Objective Optimization Model

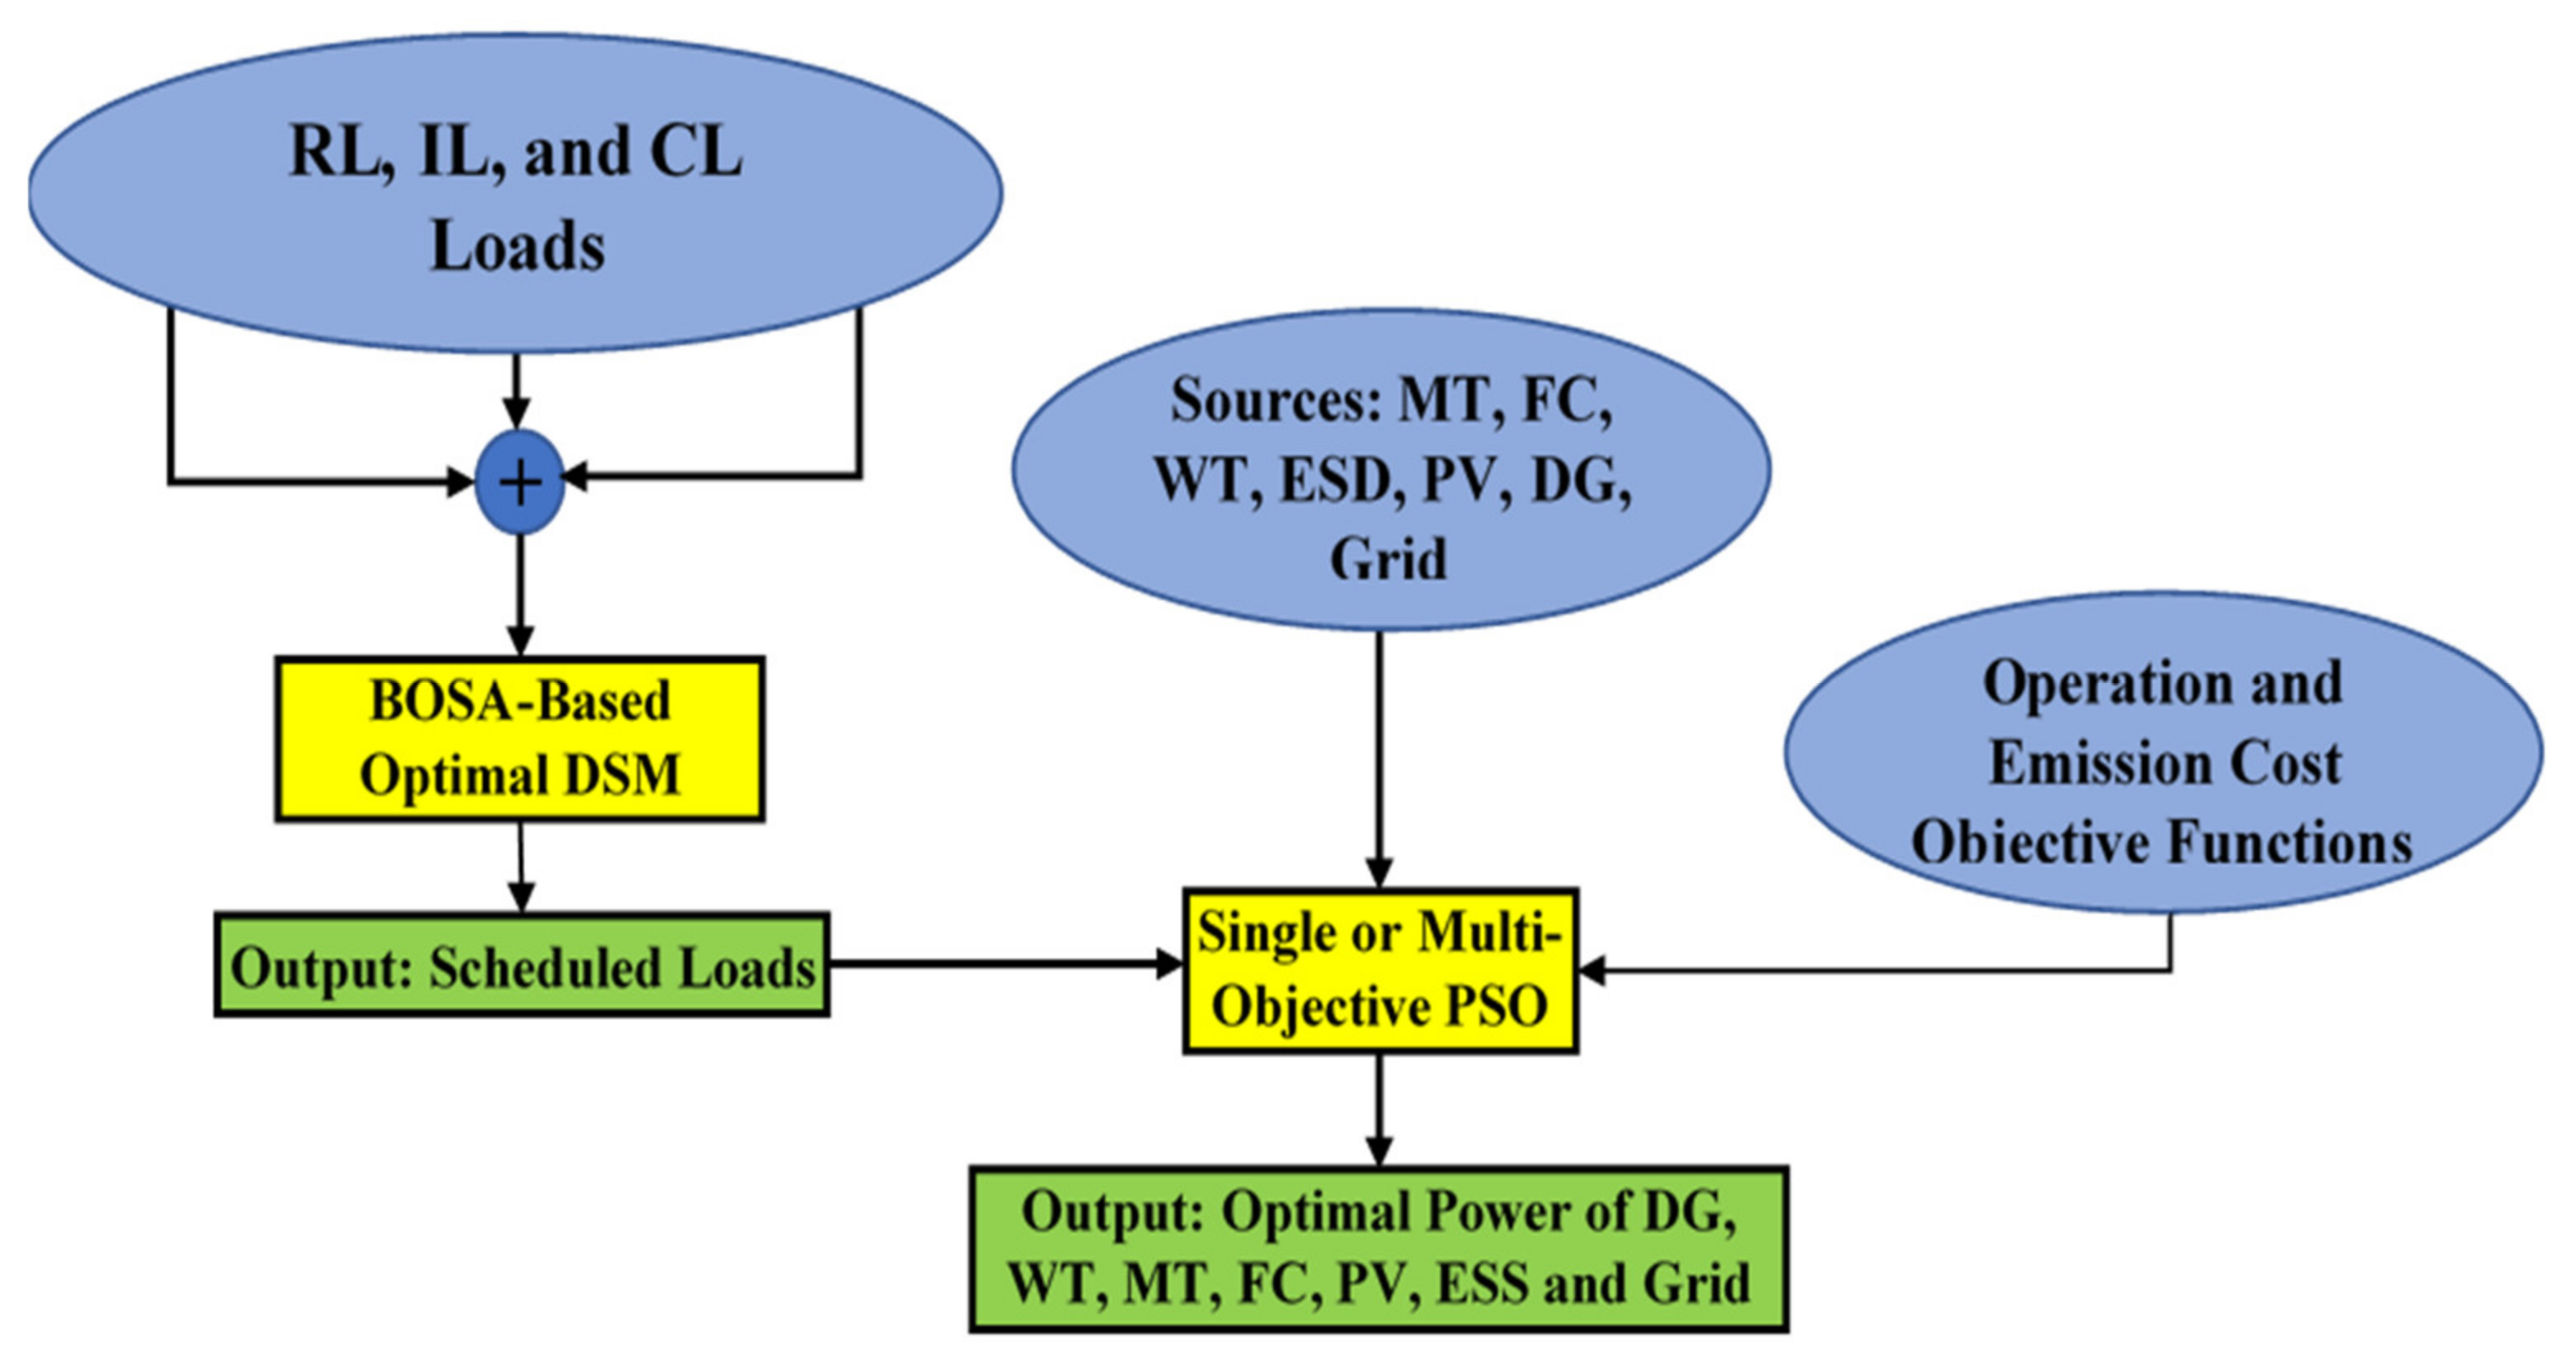
A stochastic programming model with multiple objectives will be utilized to investigate the effects of existing renewable generation resources, such as wind and solar photovoltaics, on operation costs and pollution emissions. In this study, residential (RL), industrial (IL), and commercial (CL) demand are considered responsive with or without adopting the optimal DSM program. Figure 3 illustrates the proposed optimization model.
The startup and fixed running costs of distribution generators, the non-spinning and spinning backup costs supplied by distribution generators, and the power purchased/sold from/to the main grid are all considered as operational costs. Uncertain operational costs are determined by realizing and considering the probability of scenario P r s c during the t -th period and s c -th scenario, which are a combination of possible outcomes. Here, the operation function is the cost of running distributed generation units, and the costs related with the expected energy not served (EENS) and the value of lost load (VOLL) for consumers are all included in the operational cost function.
M i n   f A X = t = 1 T F c o s t t = F S t + s c = 1 S C P r s c × F U , s c t
where F S t and F U ,   s c t denote certain and uncertain operational cost functions, respectively, P r s c denotes the probability of occurrence of scenario s c . The definitions of the certain and uncertain operational cost functions can be found using Equations (32) and (33), respectively.
F S t = t = 1 T { i = 1 N D G P i t O P i t S T i t + S U S i t S T i t S T i t 1 + R C i D G t + P E S S t O P E S S t S T E S S t                                                                                   + S U S E S S t S T E S S t S T E S S t 1 + S T B t P G B t O P G B t S T S t P G S t O P G S t   }
F U , s c t = t = 1 T i = 1 N D G C i , s c D G t + C s c E S S t + E E N S s c t × V L L t
where P i t and O P i t represent the total output power and the price that was being offered for the i -th unit during the t -th period; S T i t is a binary representation of the on mode and off mode of the i -th unit during the t -th period, P E S S t and O P E S S t denote the total output power and the price that was being offered for the E S S unit during the t -th period; S T E S S t is a binary representation of the on mode and off mode of the E S S during the t -th period, S U S i t and S U S E S S t are a representation of the costs associated with running and shutting down the i -th and ESS unit during the t -th period; R C i D G t is the reserve costs of the i -th DG during the t -th period. P G B t and P G S t are the amounts of power exchanged with the utility in period t . O P G B t and O P G S t represent the offered price for open market power with utility during the t -th period; C i , s c D G t and C s c E S S t represents the running cost of the i -th DG unit and ESS in the s c -th scenario during the t -th period; and E E N S s t and V L L t represent the EENS in the s c -th scenario at the t -th period and value of lost load. In Equation (33), X T = X 1 ,   X 2 ,   . ,   X T is the state vector of the variables, which includes the active power produced by each DG, the power used in the battery’s charge and discharge, and the real power exchanged with the upstream grid.
The quantity of pollution generated by DG units as well as the grid at the energy purchase time are both included in the pollution emissions function. The pollutants include carbon dioxide (CO2), sulfur dioxide (SO2), and nitrogen oxides (NOx), and the mathematical representation model of the pollution emission function can be obtained as follows:
M i n   f B X = t = 1 T F E m i s s i o n t = t = 1 T E m D G t + E m G r i d t
The following formula can be used to calculate the average emissions generated by renewable DG units:
E m D G t = i = 1 N D G ( E C O 2 D G i + E S O 2 D G i + E N O x D G i ) × P i D G t + ( E C O 2 E S S + E S O 2 E S S + E N O x E S S ) × P E S S t
where P i D G t is the active power of i -th DG, E C O 2 D G i ,   E S O 2 D G i , and E N O x D G i denote the amount of CO2, SO2, and NOx pollution resulting from the i -th DG, respectively, and kg/MWh is the unit of measurement. Similarly, the grid pollution can be expressed as follows:
E m i G r i d t = ( E C O 2 G r i d i + E S O 2 G r i d i + E N O x G r i d i ) × P G r i d t
where P G r i d t represents the grid power which has maximum and minimum value (±30 kW), E C O 2 D G i , E S O 2 D G i , and E N O x D G i denote the amount of CO2, SO2, and NOx pollution resulting from the main grid which are assumed as 950 kg/MWh, 0.5 kg/MWh, and 2.1 kg/MWh.
The following constraints are assumed to govern the operation of a typical smart MG.

5.1. Power Balance Constraint

In each interval and scenario, the total amount of electricity made by DGs and utility purchases must match the total amount of demand loads.
i = 1 N D G P i D G t + P E S S t + P G r i d t = l = 1 N L P l O p t i m a l . D e m a n d t
where P l O p t i m a l . D e m a n d t denotes the total optimal demand power.

5.2. DG Power Constraints

Each unit’s maximum and minimum power output is constrained and can be stated as follows:
P i , m i n D G t P i D G t P i , m a x D G t  
P m i n E S S t P E S S t P m a x E S S t
P m i n G r i d t P G r i d t P m a x G r i d t
where P i , m i n D G t , P m i n E S S t , and P m i n G r i d t represent the minimum active power of the i-th DG, the ESS, and the utility, respectively, during period t . The maximum active power units for the period t are P i , m a x D G t , P m a x E S S t , and P m a x G r i d t .

5.3. Battery Constraints

For each interval of time, a battery’s charging and discharging limitations and equations can be expressed in the following forms [50]:
W E S S t = W E S S t 1 + η c h P c h t I c h 1 η d i s c h P d i s c h t I d i s c h t
W E S S , m i n W E S S t W E S S , m a x
P c h t P c h , m a x t ;   P d i s c h t P d i s c h , m a x
where the quantities W E S S t and W E S S t 1 each represent the amount of energy that is stored in the battery at time t and time t 1 , respectively; W E S S , m i n and W E S S , m a x are the lowest and highest amounts of energy that can be stored in the battery, respectively. P c h , m a x / P d i s c h , m a x is the maximum battery charge/discharge power. P c h / P d i s c h refers to the maximum charge/discharge allowed over a given time period. During charging and discharging, η c h / η d i s c h is the battery’s efficiency, I c h t and I d i s c h t are the charge and discharge states of the battery.

6. Proposed Smart MG System

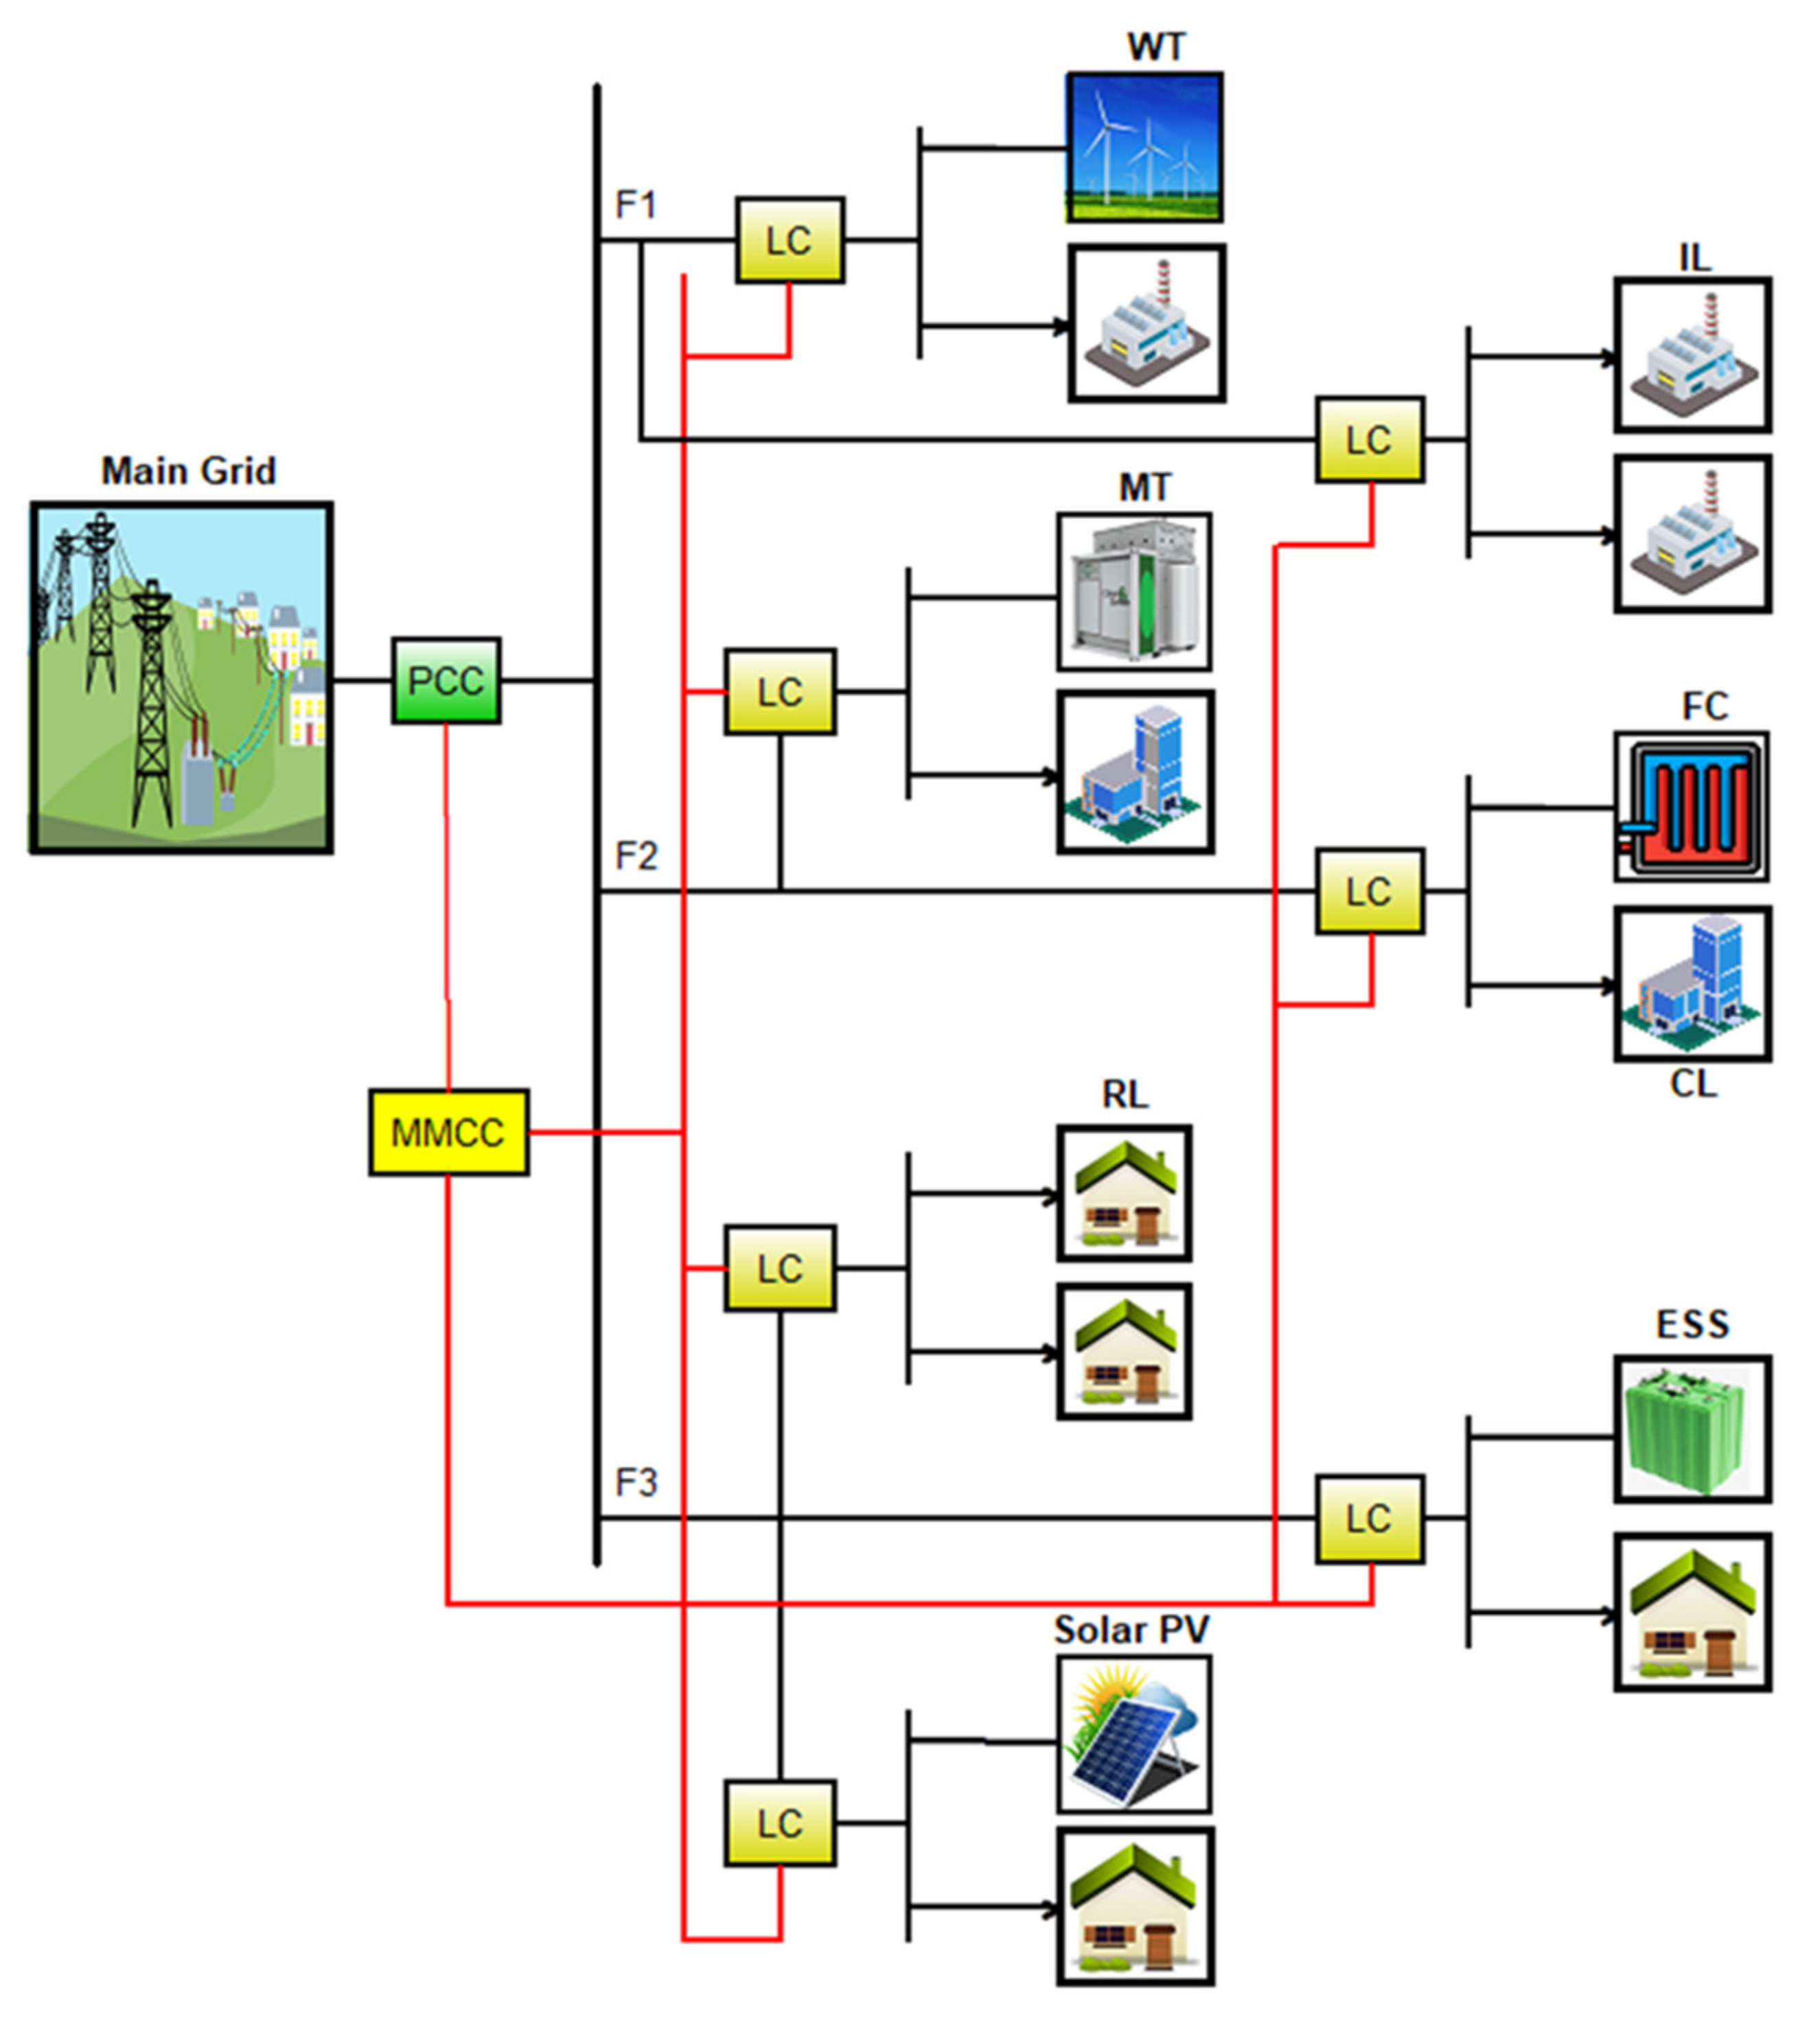
Typically, a MG consists of distribution generators, energy reserves, and loads that can be operated independently or in tandem with the area’s primary electrical grid [51,52,53,54]. The development of MGs is an aspect of the concept of smart grids; given the benefits of MGs, such as reduced energy costs and enhanced security and system reliability [55,56,57,58,59], it is evident that MGs and smart grids share common goals [60,61]. Moreover, the development of green technologies and the implementation of DSM programs in MGs are contingent on the adoption of smart grid technologies. As seen in Figure 4, a connected grid of residential, commercial, and industrial consumers makes up the SMG under study, in addition to power-generating resources including MTs, DGs, WTs, PV panels, FCs, and an ESS (nickel–metal hydride (NiMH) battery). NiMH batteries have a significantly longer lifespan than lead-acid batteries as well as a significantly higher power and energy density than lead-acid batteries. In addition to not posing any danger, their power output is unaffected by the amount of charge that is currently present in the battery. With the utility, this SMG has the ability to exchange energy. The startup and shutdown costs, DG price offers, the amount of greenhouse gas emissions produced by DGs, as well as the minimum and maximum power generation, are all included in Table 2 (modified from table in [50,62]). Table 3 shows the adopted appliance loads and their attributes.

7. BOSA-Based MOPSO Algorithm

Inequalities and equality constraints must be optimized simultaneously in multi-objective optimization problems because they involve multiple competing objective functions.
M i n   F X = f 1 X , f 2 X , , f n X T
S u b j e c t   t o               g i X < 0                 i = 0 , 1 , 2 , N u e q h i X = 0                 i = 0 , 1 , 2 , N e q
where F X is a vector that contains the objective functions and X is a vector that contains optimization variables, f i X is the objective function that corresponds to the i -th optimization variable, g i X and h i X are limitations of equality and inequality, and n represents the number of the objective functions that are being considered.
Each pair of solutions in multi-objective optimization can have two distinct relationships with one another: either one solution could dominate the other or no solution can dominate the other.
  j   1 , 2 , , n ,       f j X 1 f j X 2
  k   1 , 2 , , n ,       f k X 1 f k X 2
It is possible to use the particle swarm optimization (PSO) algorithm to solve multi-objective problems, and this solution is referred to as multi-objective swarm particle optimization (MOPSO). This is accomplished by applying the concepts of Pareto optimality while utilizing the fundamental principles of PSO. A repository is used to save different solutions when using the MOPSO algorithm. A repository is an external memory in which dominated solutions are stored. This algorithm begins its execution by first working with a collection of random particles. During a series of repeated steps, all of the population particles are compared with one another, and the positions of the particles that dominate the comparison are recorded in the repository. Using the following equation, the new velocity and position of the i -th particle in the d m -th dimension and the t + 1 repetition are calculated and updated. See [63,64] for more details.
v i d m t + 1 = w × v i d m t + c 1 r a n d 1 × p b e s t i d m t x i d m t + c 2 r a n d 2 × g b e s t i d m t x i d m t
x i d m t + 1 = x i d m t + v i d m t + 1
The proposed optimal DSM-based MOPSO system applied to the investigated problem can be executed according to the steps outlined below.
  • The required input data are collected at the start of the program, and include: MG structure, utility, and DG operating characteristics PV and WT forecasted output power for every time period under consideration, offering of the real-time price for DGs and utility, the daily demand curve, and pollutant emission coefficients.
  • Set the values for all BOSA parameters.
  • Randomize a population to minimize DSM objective (Equation (16)).
  • For each population within the iteration range, Equations (29) and (30) are used to update positions.
  • Check all the constraints for each population.
  • Initial population of MOPSO, an initial population, is considered based on the problem’s limitations and the following relationship:
    X 0 = X 1 , X 2 , , X N T
    where X is regarded as the decision variable vector, which consists of the unit’s output generation power, the power exchange with the main grid, the amount of load reduction, and the on/off modes in the day ahead vision, which are stated as follows:
    X = P g , U g 1 × 2 n T  
    P g = P d g 1 ,   P d g 2 , ,   P d g N d g , P E S S 1 ,   P E S S 2 , ,   P E S S N E S S ,   P g r i d ,   P l o a d
    U g = U d g 1 ,   U d g 2 , ,   U d g N d g , U E S S 1 ,   U E S S 2 , ,   U E S S N E S S ,   U g r i d , U l o a d
    n = N d g + N E S S + 2
    where n represents the number of decision variables, N d g and N E S S represent the total number of generation units and storage units, respectively, and T represents the total number of periods, P d g 1 , P d g 2 , , ( P E S S 1 , P E S S 2 , ) , P g r i d ,   P l o a d are the vectors of the active power that includes all DGs and storage units; utility grid power and load active power; and U g is the state vector that indicates whether all units are ON or OFF during period t.
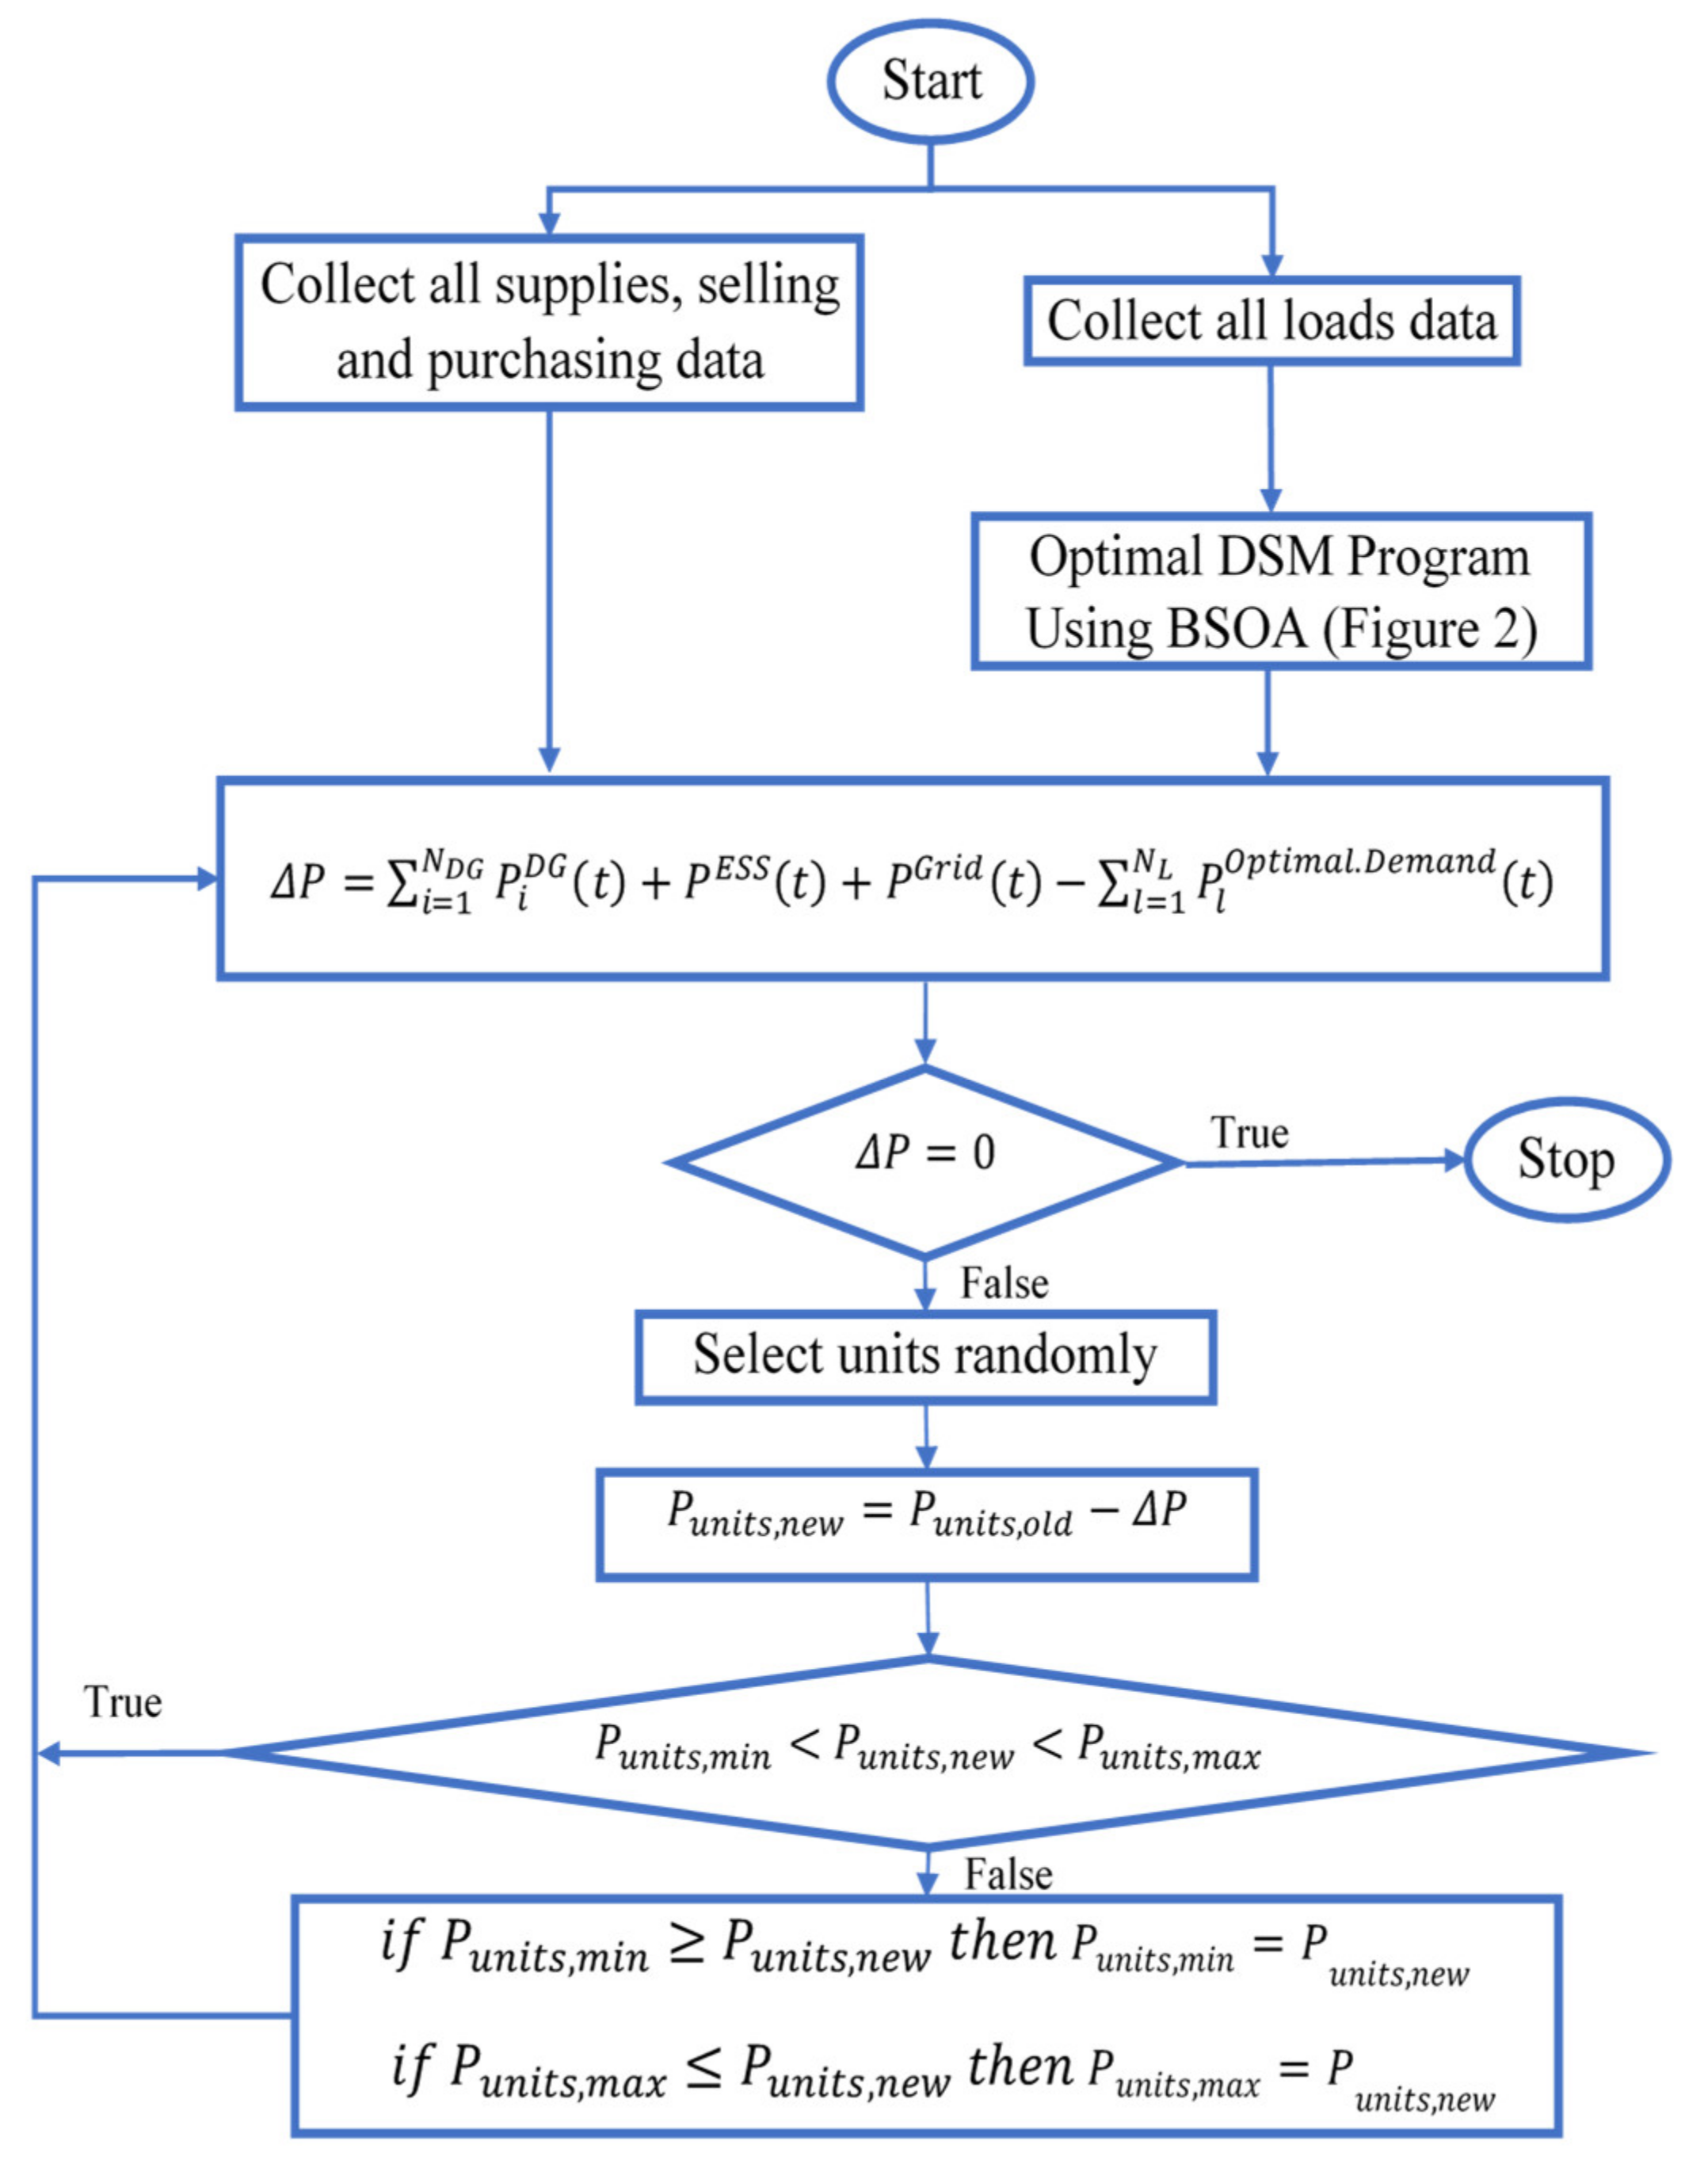
  • For each of the generated populations, the power dispatch algorithm is implemented as shown in Figure 5, and the fitness is calculated using (33) or (36).
  • Defining non-dominant solutions.
  • Creating a repository for non-dominated solutions.
  • Choosing the best non-dominated solution particle as the leader: the best particle is chosen as the leader by apportioning the search area into equal sections, allocating probability distributions to each part of the identified search space, and finally using the roulette wheel to select the best particle as the leader.
  • Each particle’s new velocity and position are calculated using (48) and (49).
  • Modifying the optimal position of every particle:To update each particle’s optimal position, the new position of the particle is compared to the position of the particle before.
  • Adding the repository’s current non-dominated solutions.
  • The dominated solutions are being removed from the repository.
  • Excessive members will be omitted if the number of individuals in the repository exceeds the pre-specified capacity.
  • The optimization process will end if the maximum number of repetitions is reached; otherwise, return to Step 10.
  • Choosing the best interactive solution: The membership function-based fuzzy logic can be used to select the optimal solution from the optimal Pareto responses. Here, i k is the objective function’s optimality amount in optimal Pareto response k , which is calculated as follows:
    i k = 1                                                                           f i m i n f i   f i m a x f i f i m a x f i m i n                                                         f i m i n > f i > f i m a x         0                                                                             f i f i m a x
    where f i m a x and f i m i n are the objective function’s upper and lower limits, respectively. In the method which is being proposed, these values are figured out by using the results of optimizing each objective function. i k is between 0 and 1, and a value of 0 indicates that the solution does not meet the designer’s objectives, while i k = 1 indicates that the solution meets the designer’s objectives.

8. Results and Discussion

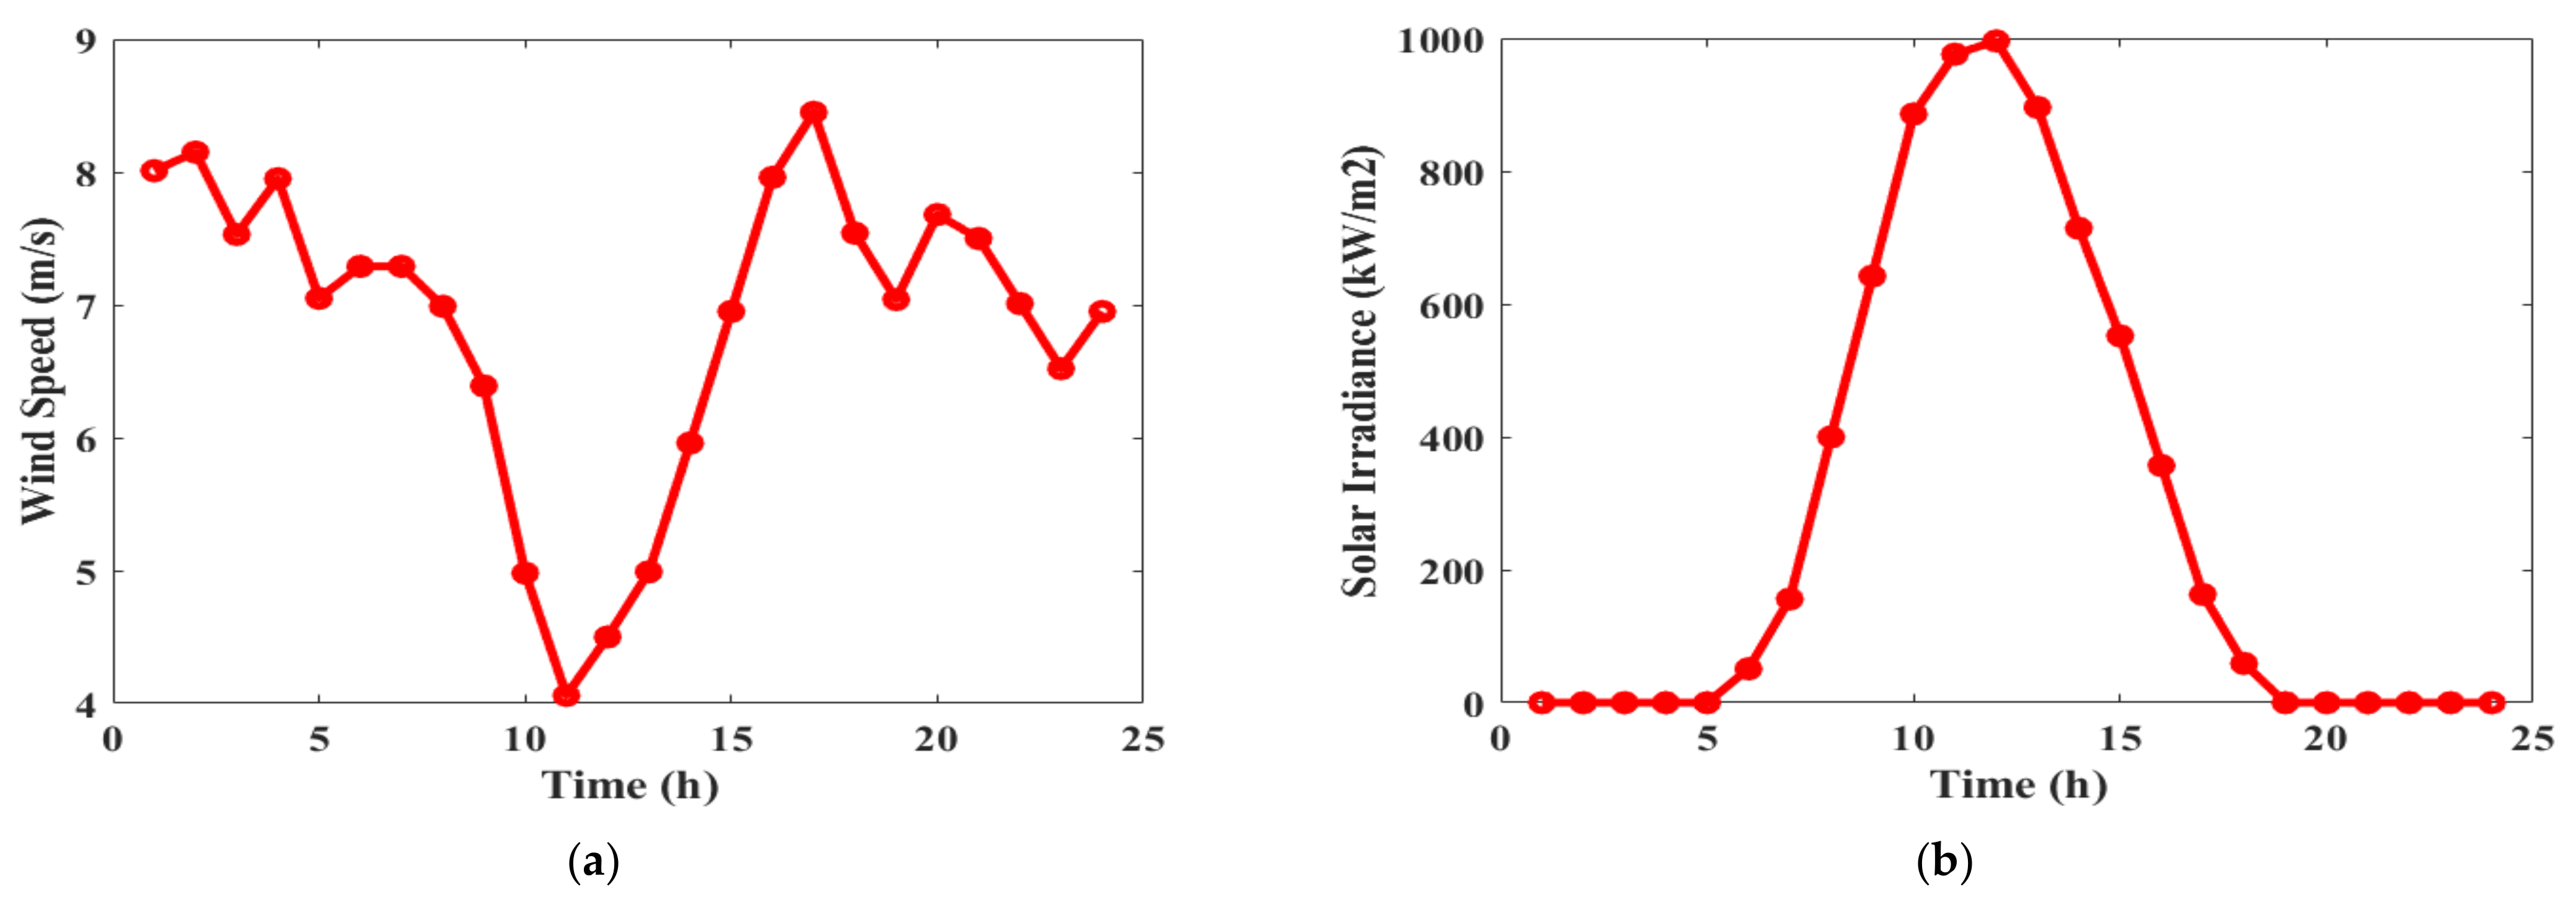
Figure 6a depicts hourly data of the wind speed obtained from the forecast of the weather. The solar PV under consideration is a 25 kW SOLAREX MSX [65]; Figure 6b depicts the average adopted hourly solar irradiance. In a typical system with a 30 kWh battery, the minimum and maximum charges are 10% and 100% of the battery’s total capacity, respectively, with a discharge and charge efficiency of 94% [66,67].
In this paper, the MG connected to the main grid (shown in Figure 4) was used as the test system. Three feeders (F1, F2, and F3), corresponding to medium residential, industrial, and commercial consumers were considered in this system, with the maximum electricity demand assumed to be 40%, 40%, and 20% of the total load energy in the system per time period, respectively.
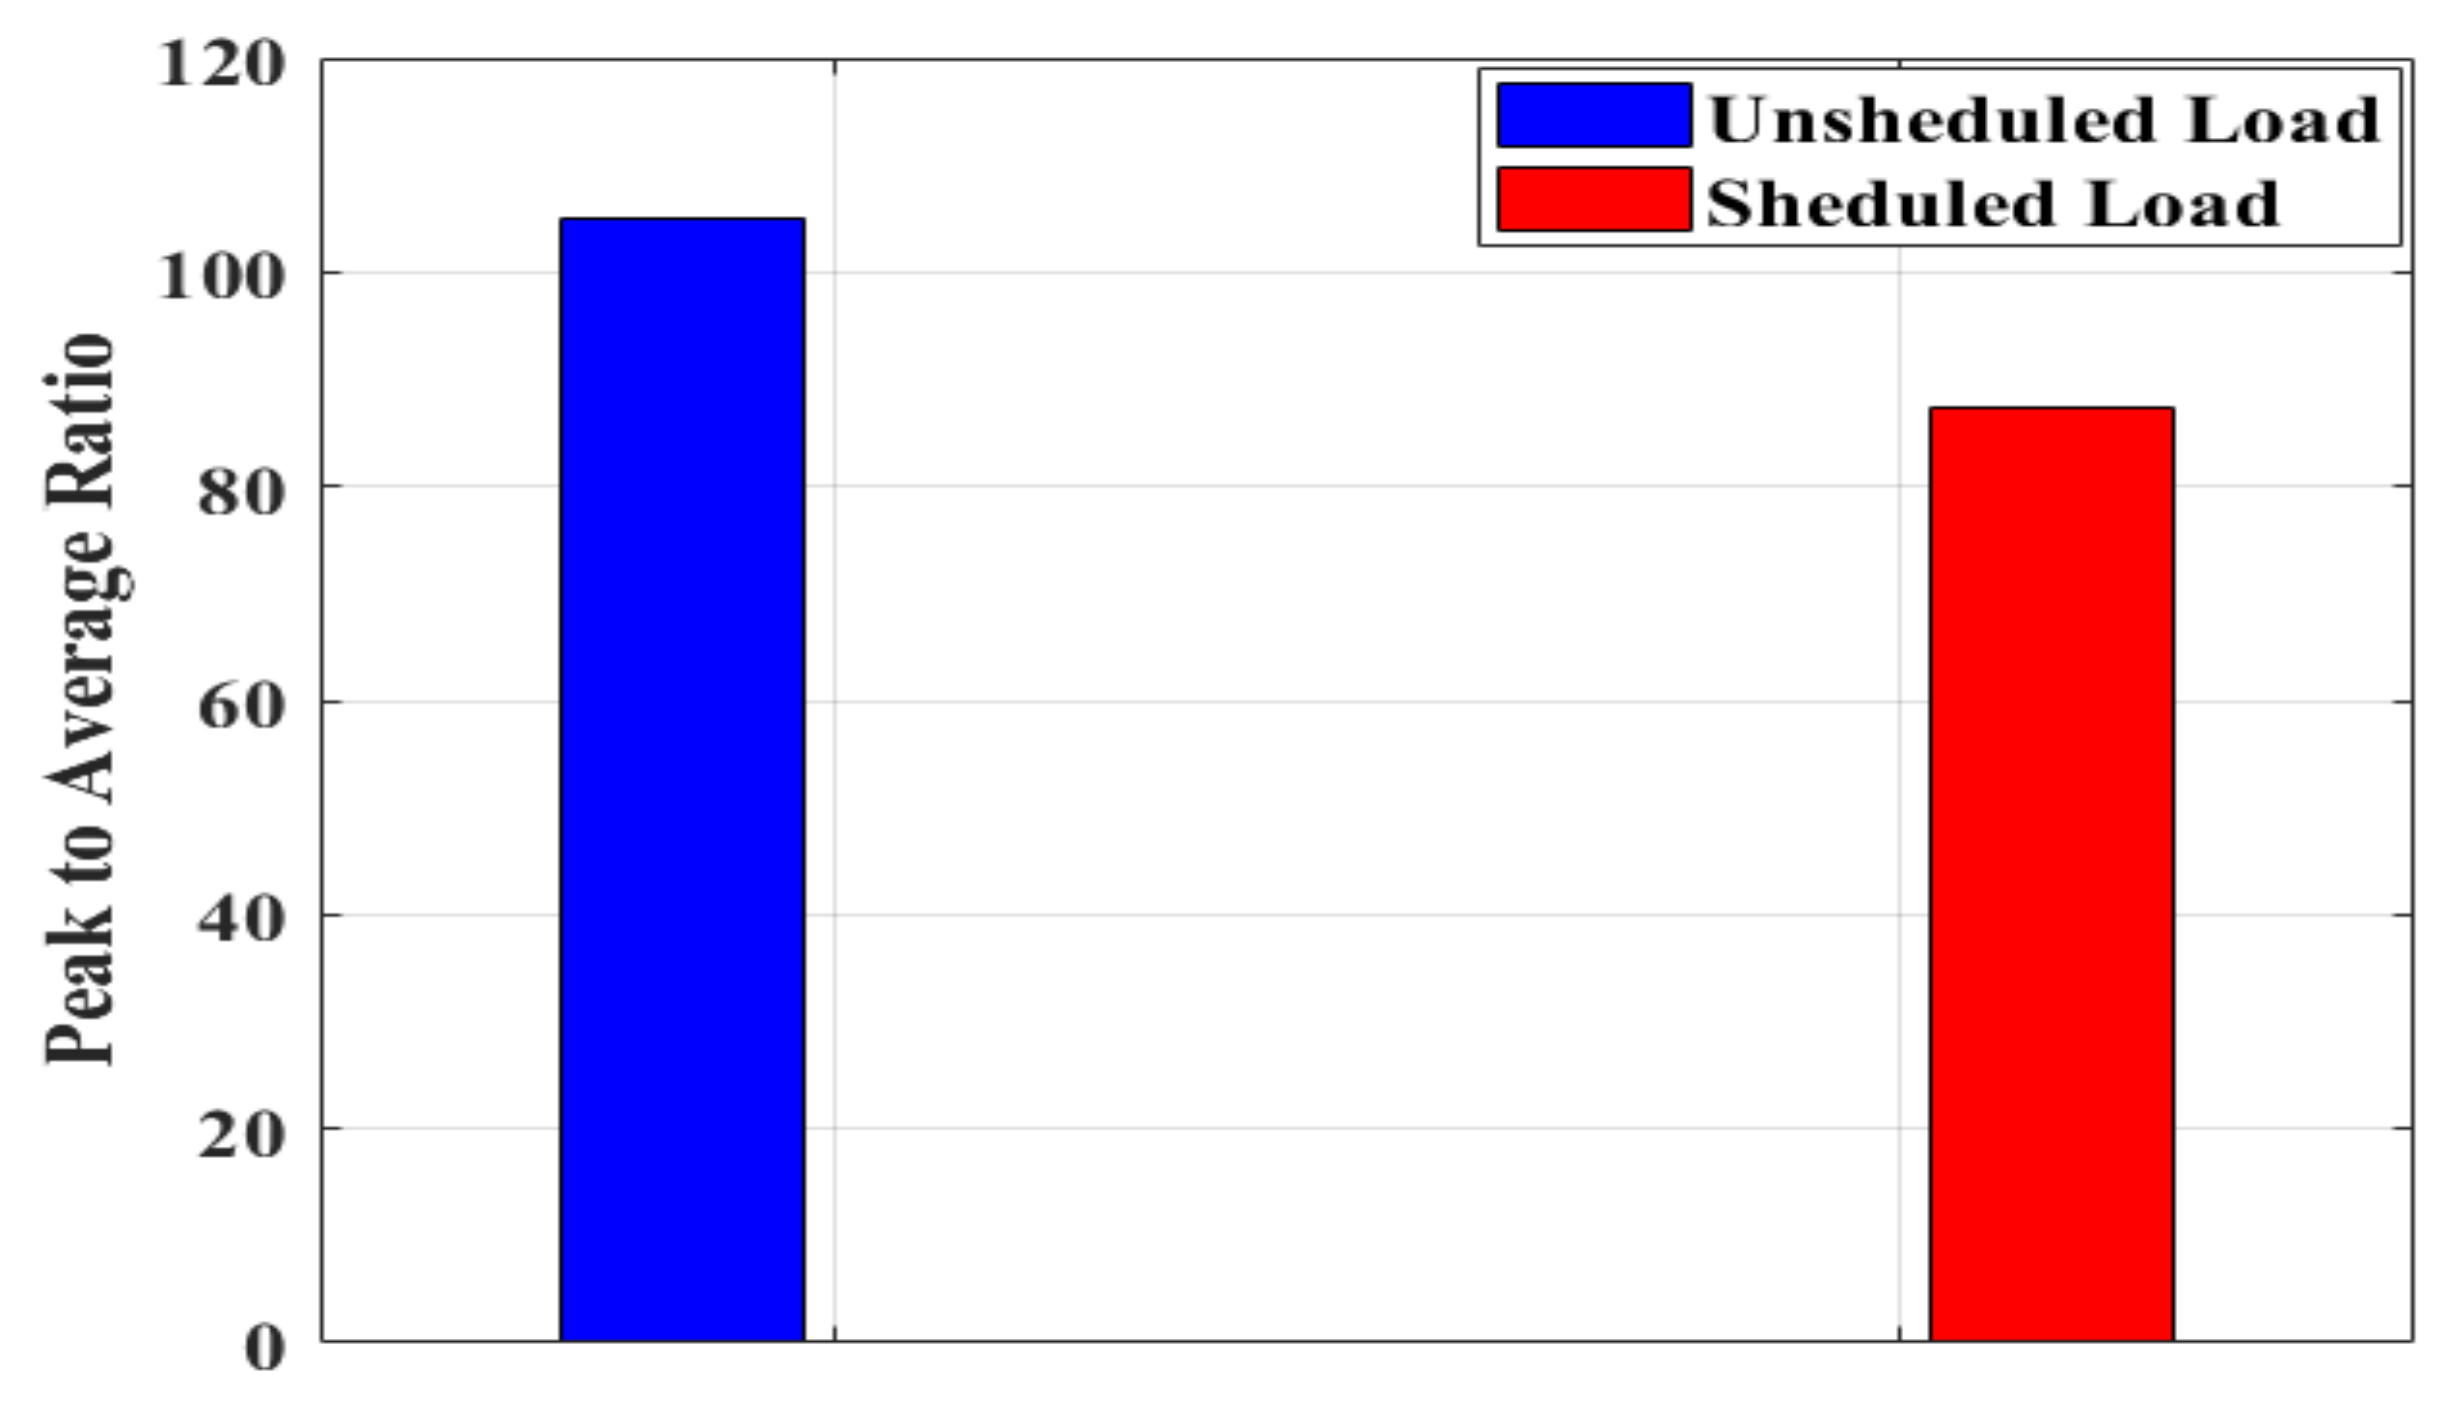
Figure 7 shows the daily schedule and unscheduled system load demand curve. It illustrates the simulation results of the proposed DSM program for one day (24 h) when the DSM based on the BOSA algorithm is adopted for optimal shifting the controllable (shiftable) loads from on-peak to off-peak hours. Users schedule their peak loads during periods of low electricity costs, resulting in a reduced electric bill. As depicted in Figure 8, proper load scheduling can significantly reduce a user’s daily electricity bill. The peak demand value is up to 88.4 kWh using the proposed algorithm-based DSM, which is the lowest in comparison to unscheduled programming (105 kWh). Additionally, the adopted algorithm achieves cost savings (up to 15.7% savings).
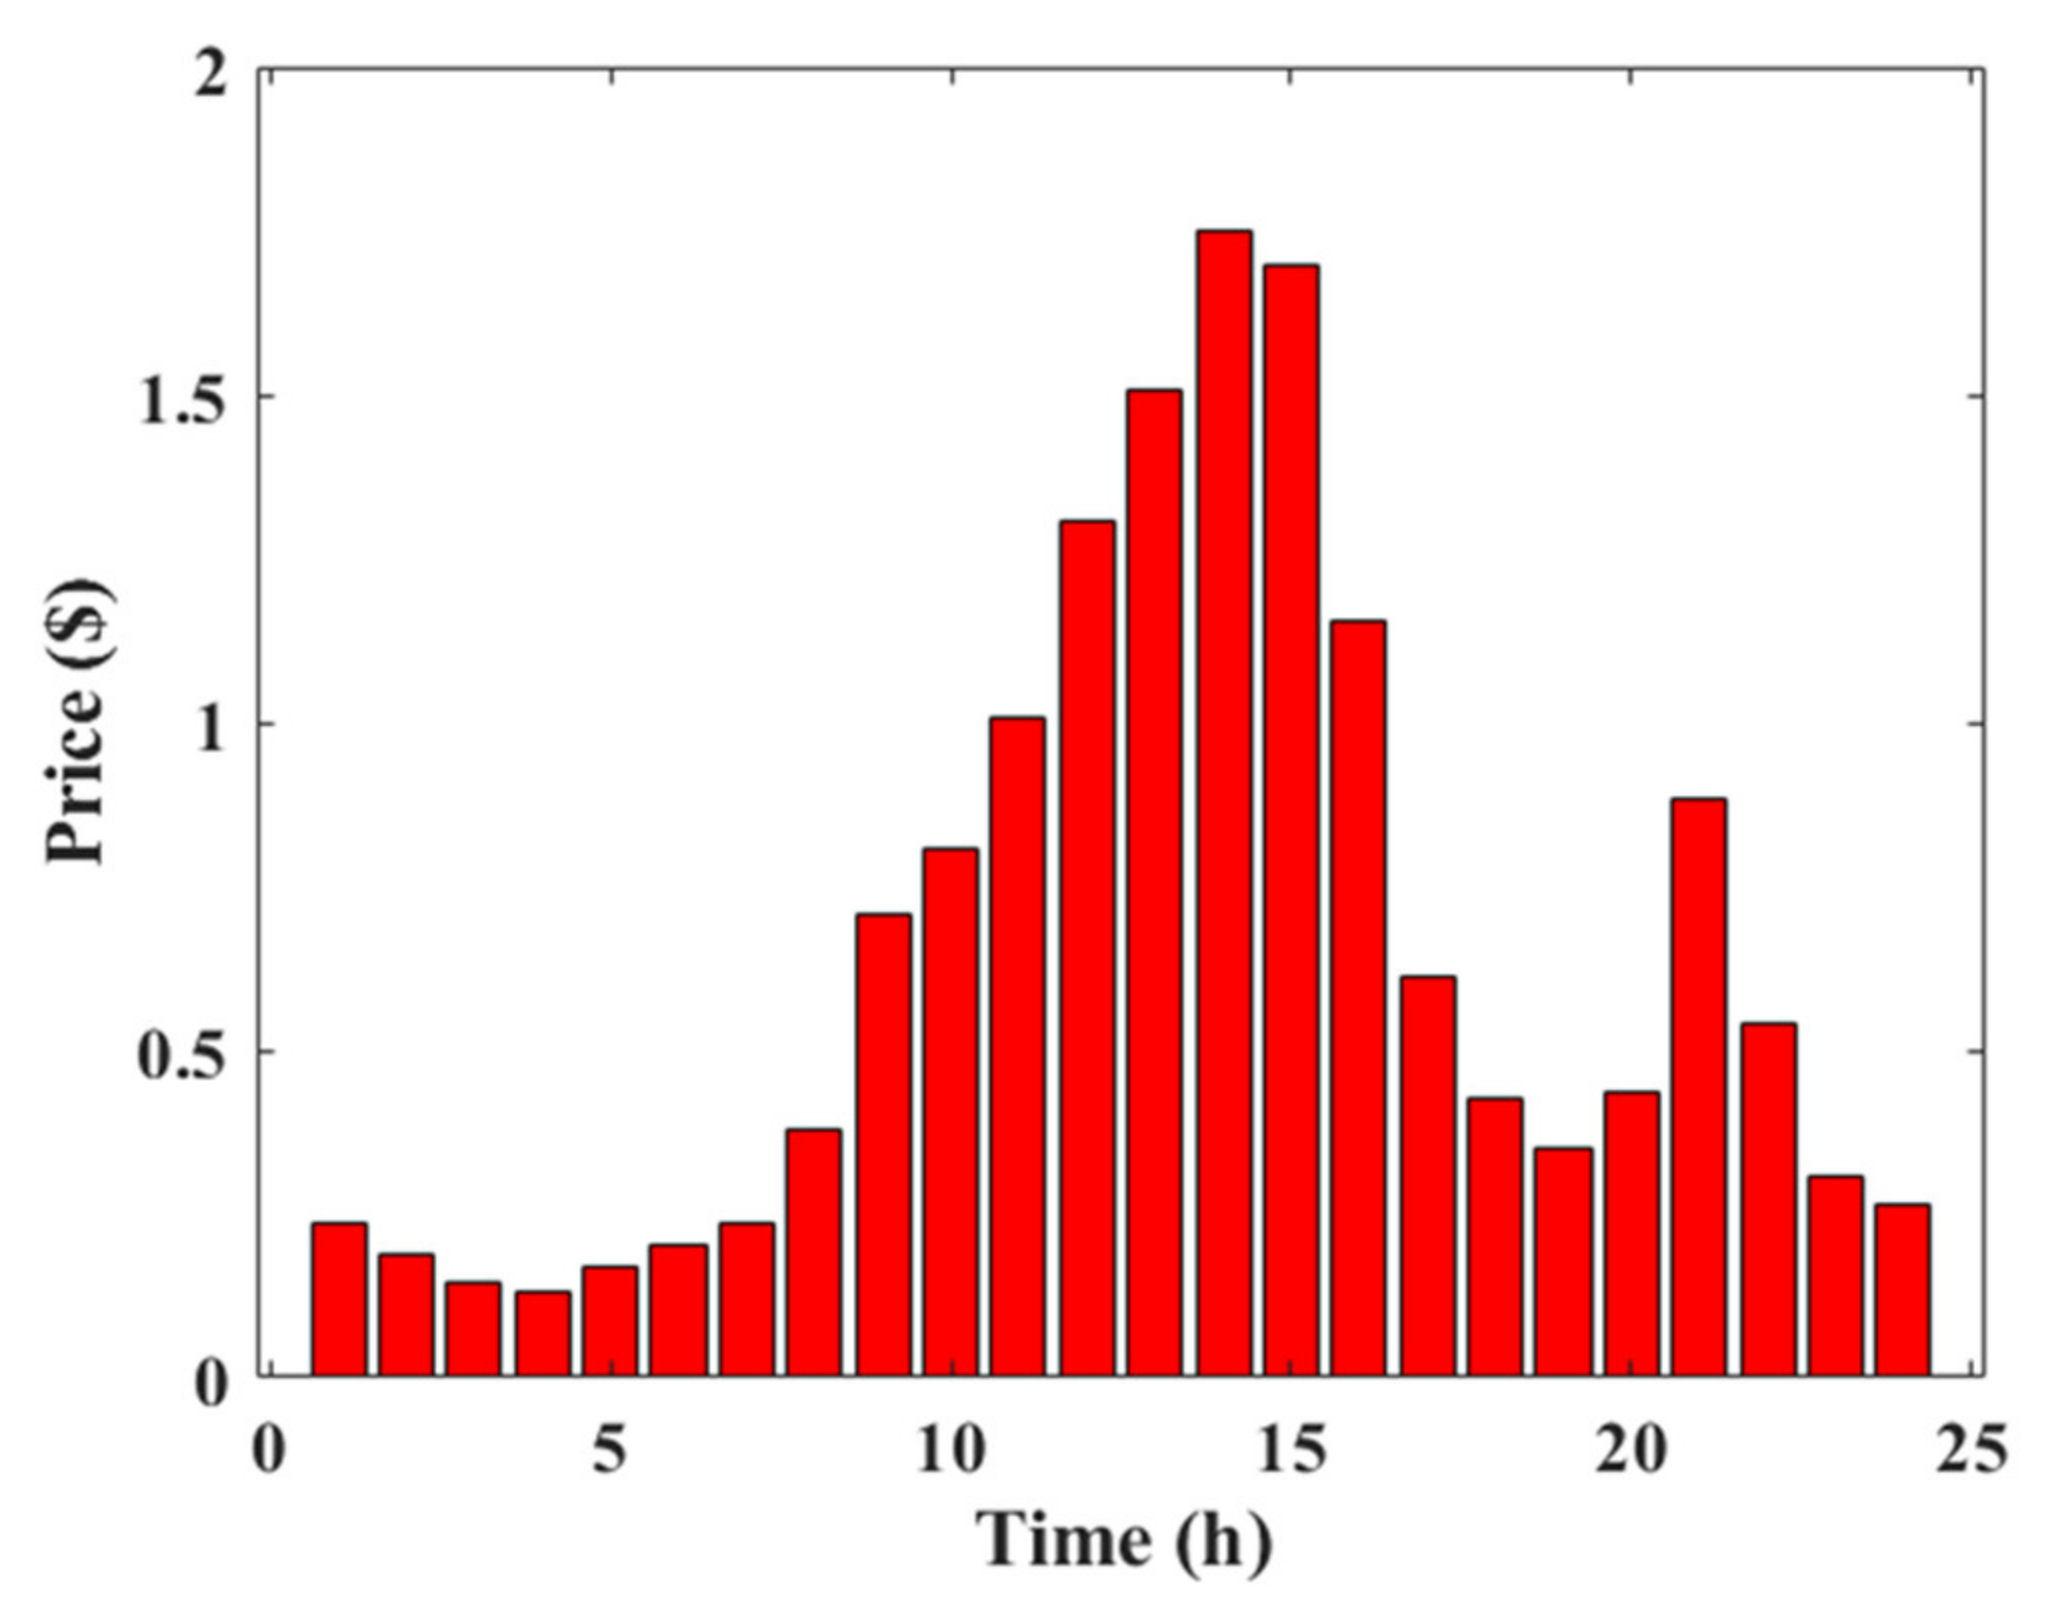
The peak-to-average (PAR) is lowered, which assists in maintaining a healthy equilibrium between the supply and demand of electricity. When it comes to the reduction of PAR, we have placed a higher priority on interruptible appliances. When compared to the non-scheduled load curve, the BOSA technique brings the PAR down to almost 84.3%, as shown in Figure 8. This reduces the electricity cost compared to unscheduled usage. The adopted real-time dynamic price profile is shown in Figure 9.
Operational costs and pollution emissions were analyzed in order to determine the impact of planning for energy levels, reserves, and optimal DSM on operational costs and environmental impacts, as well as the uncertainty caused by wind and solar resources. The problem was considered under six distinct cases:
  • Case #1: single-objective (emission function optimization only) without DSM.
  • Case #2: single-objective (emission function optimization only) with DSM.
  • Case #3: single-objective (considering operation cost function) without DSM.
  • Case #4: single-objective (considering operation cost function) with DSM.
  • Case #5: multi-objective (emission and operation cost functions) optimization without DSM.
  • Case #6: multi-objective (emission and operation cost functions) optimization with DSM.

8.1. Cases #1 and #2: Emission Function Optimization Only without and with DSM

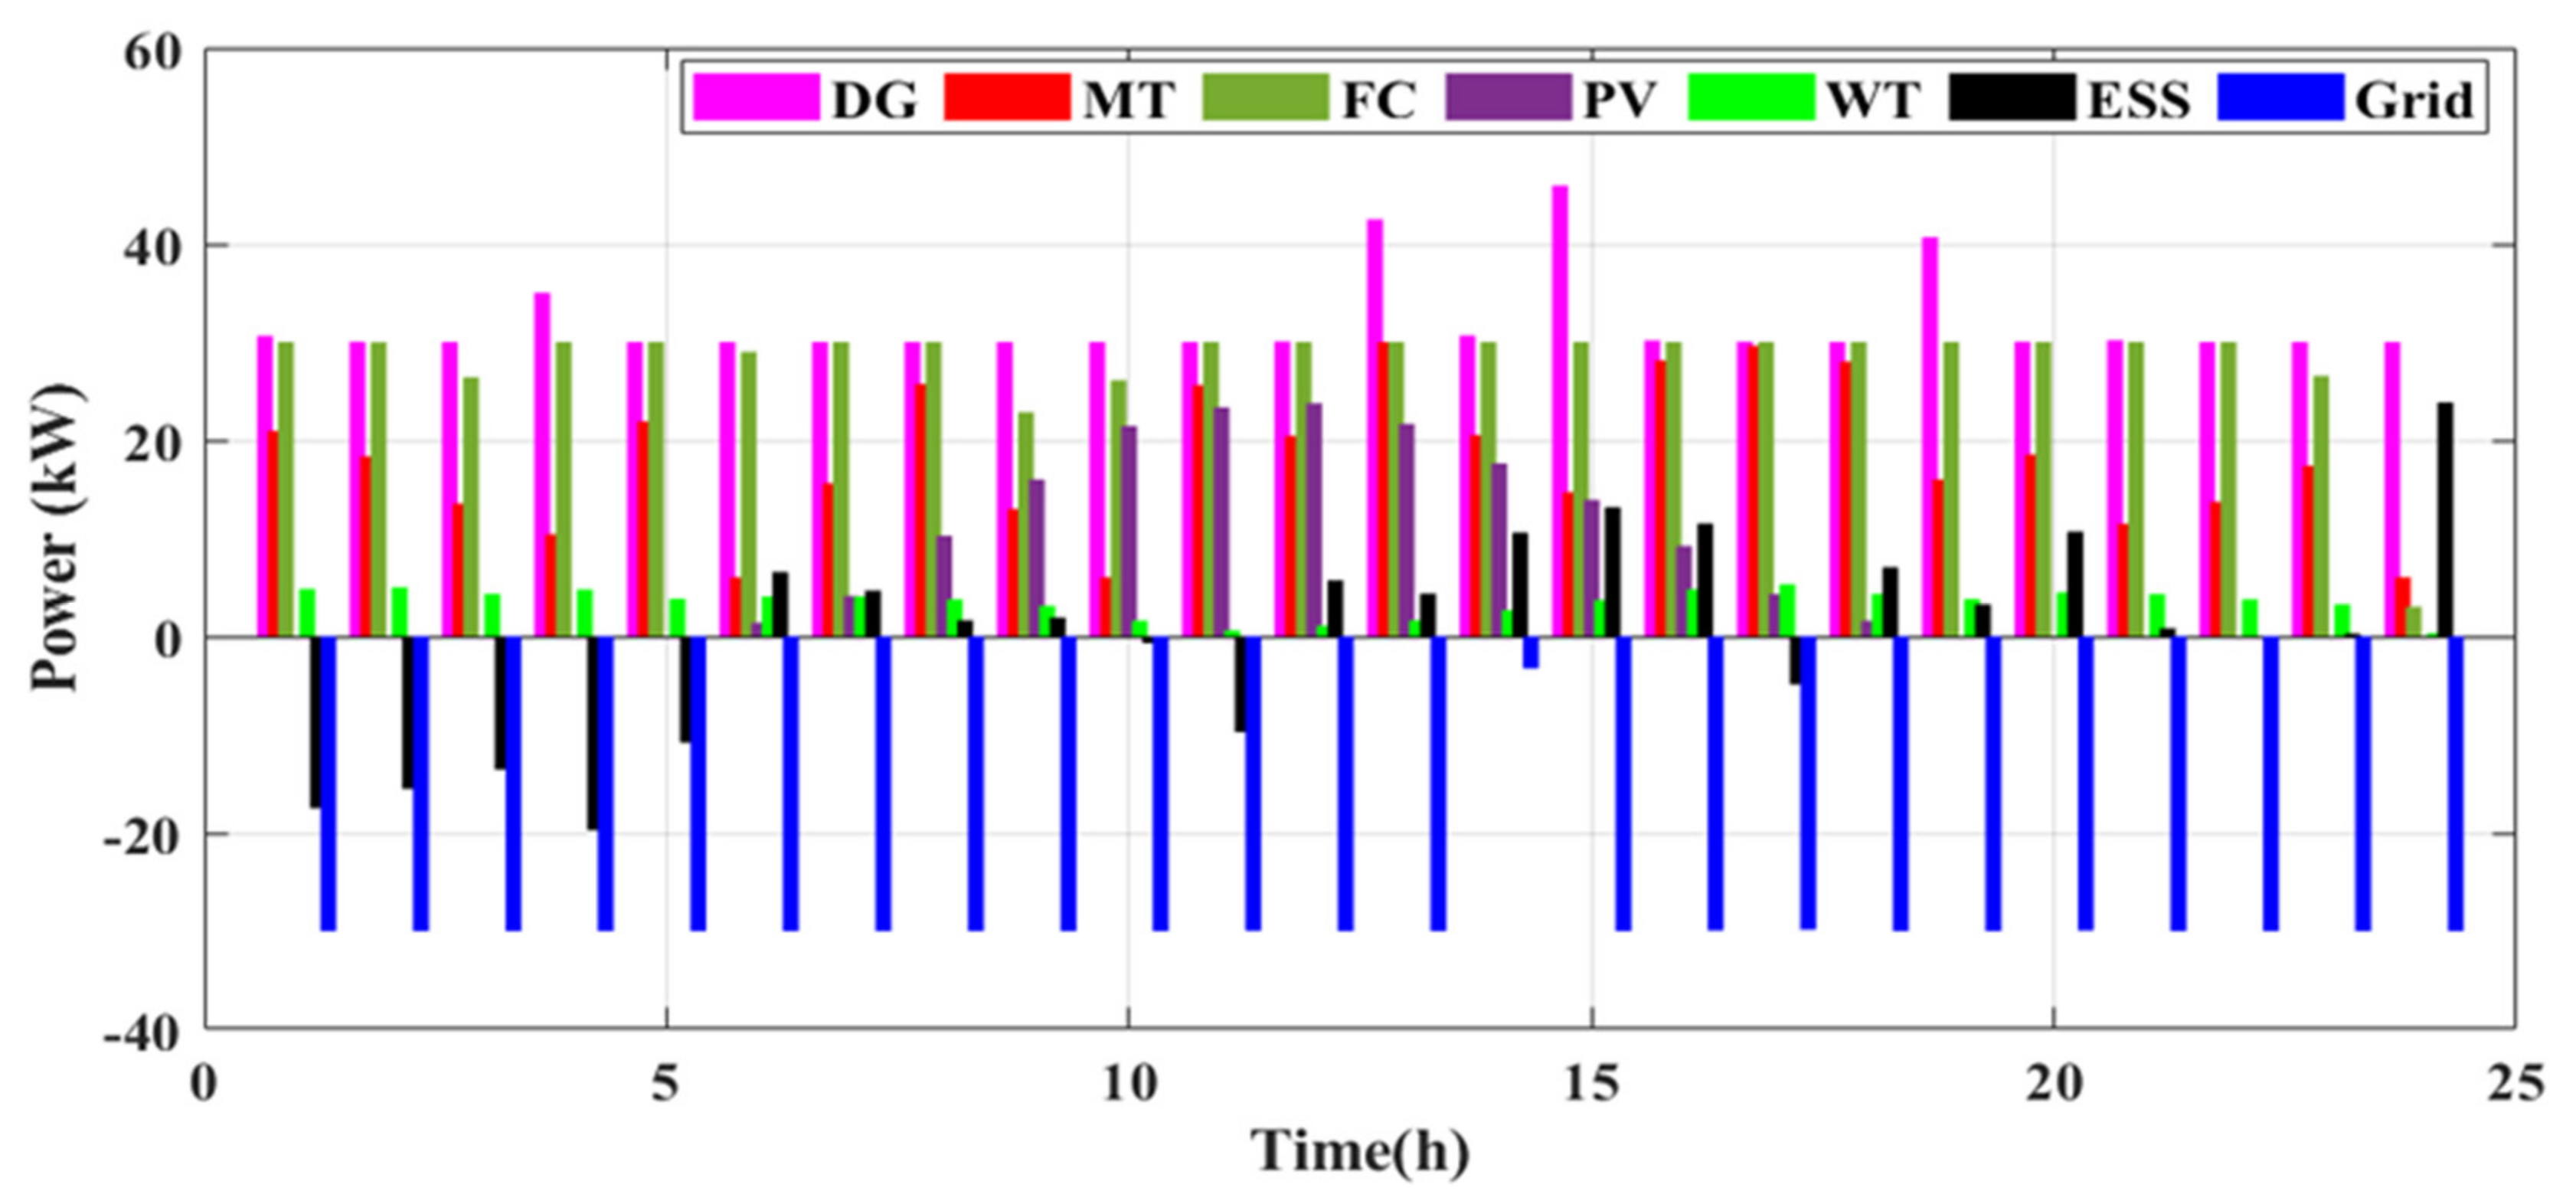
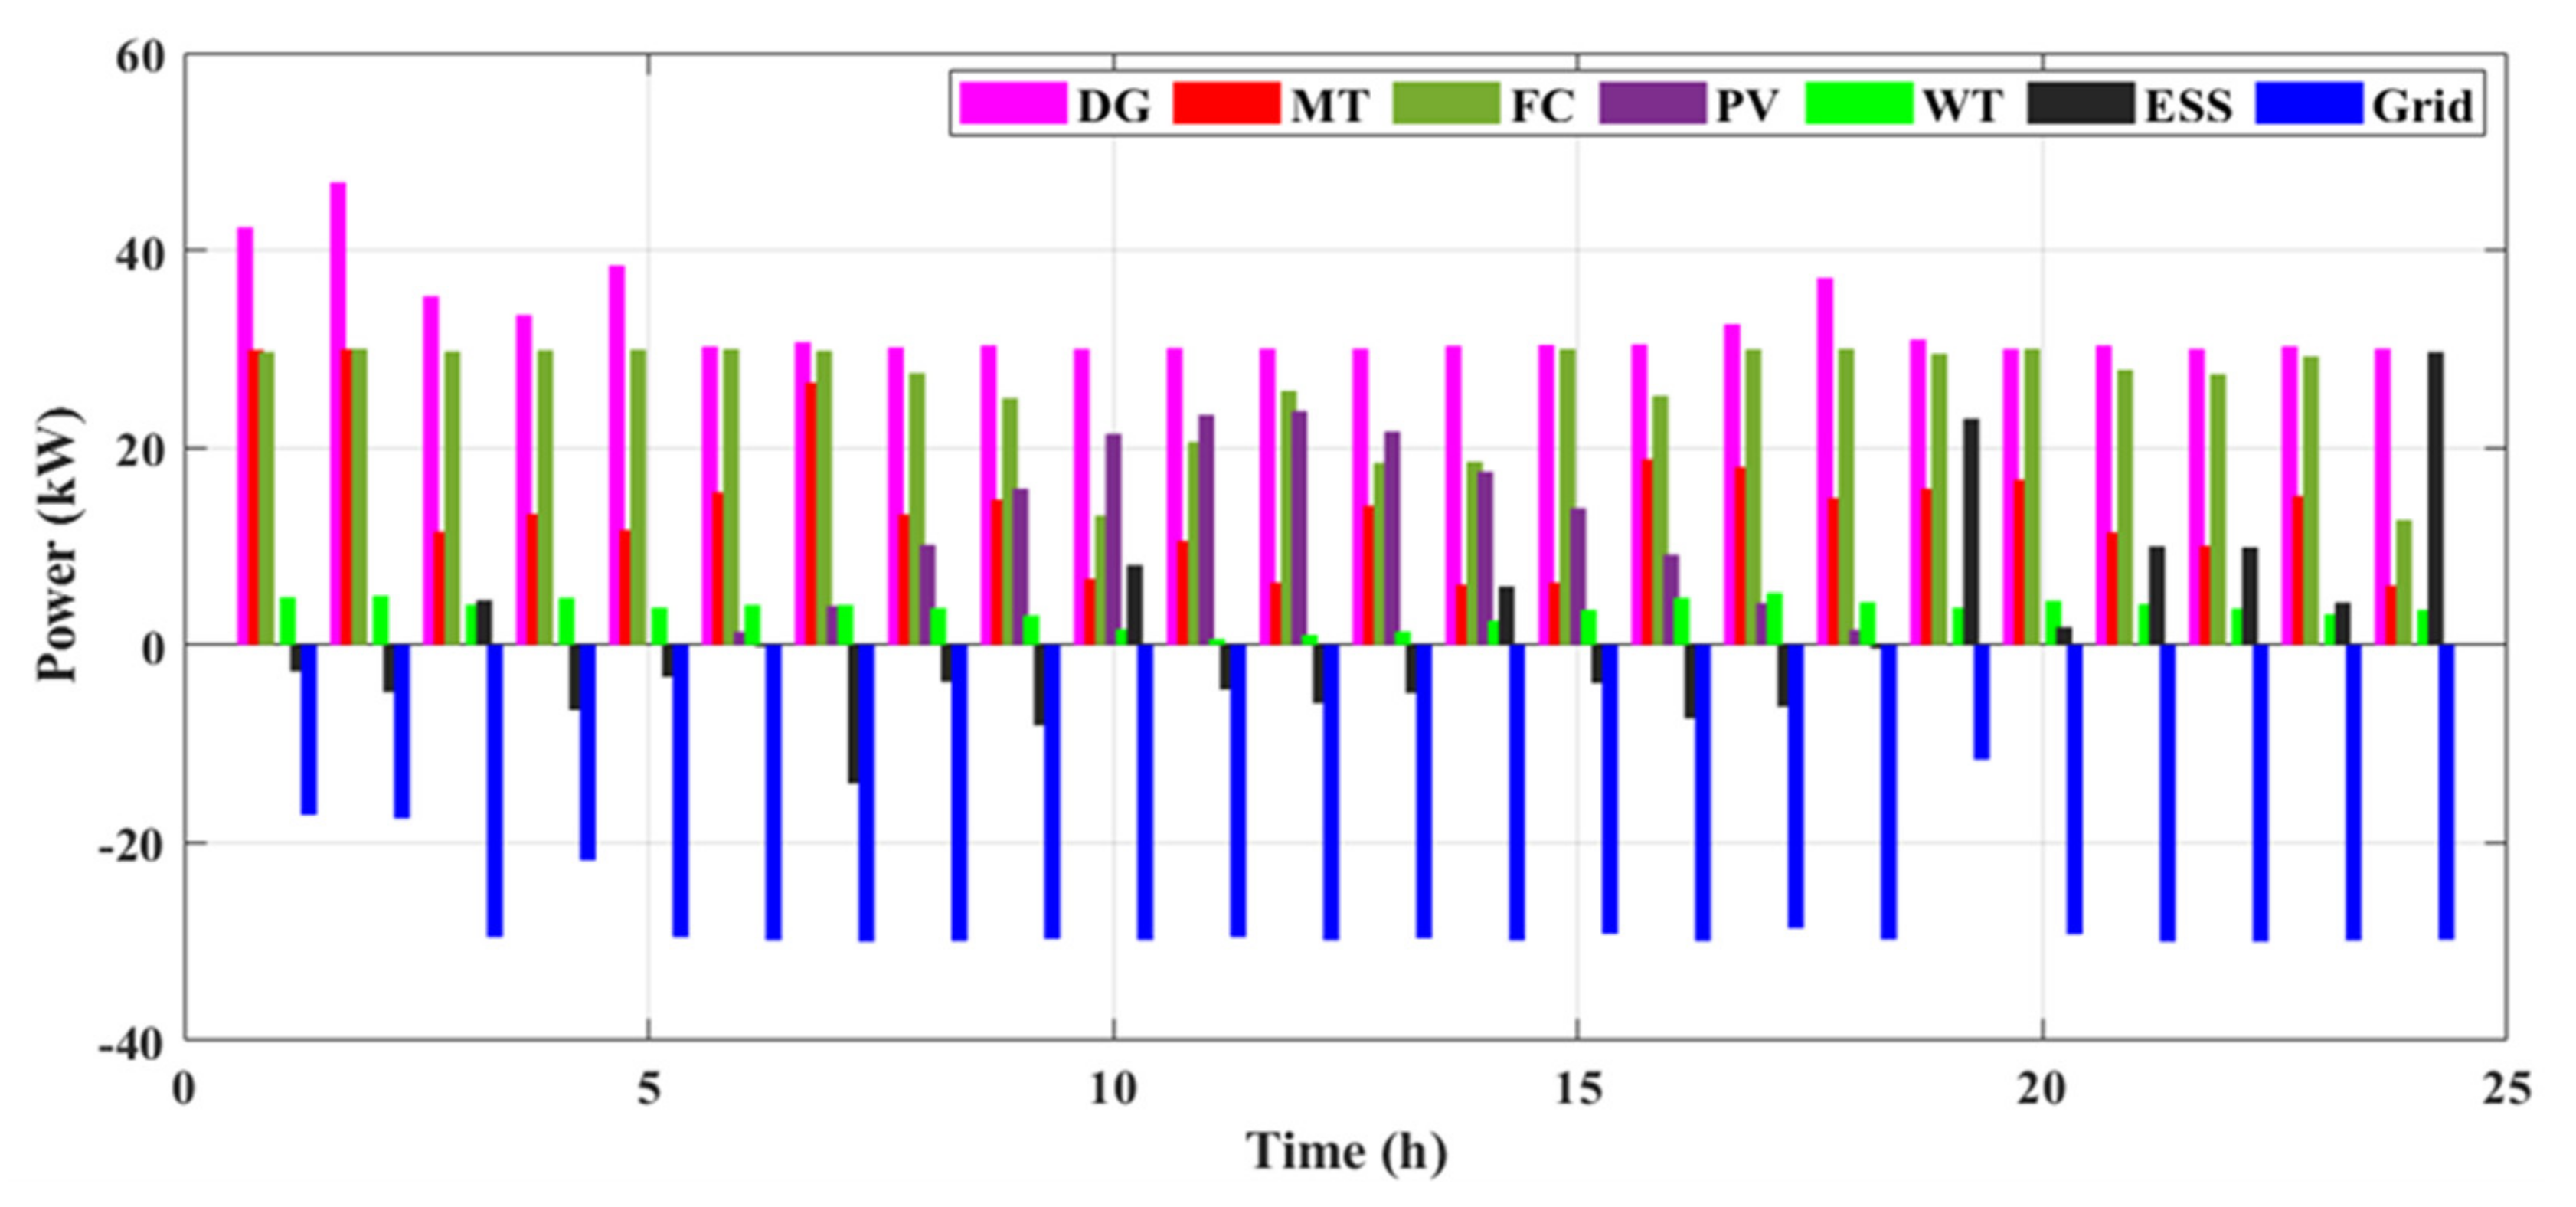
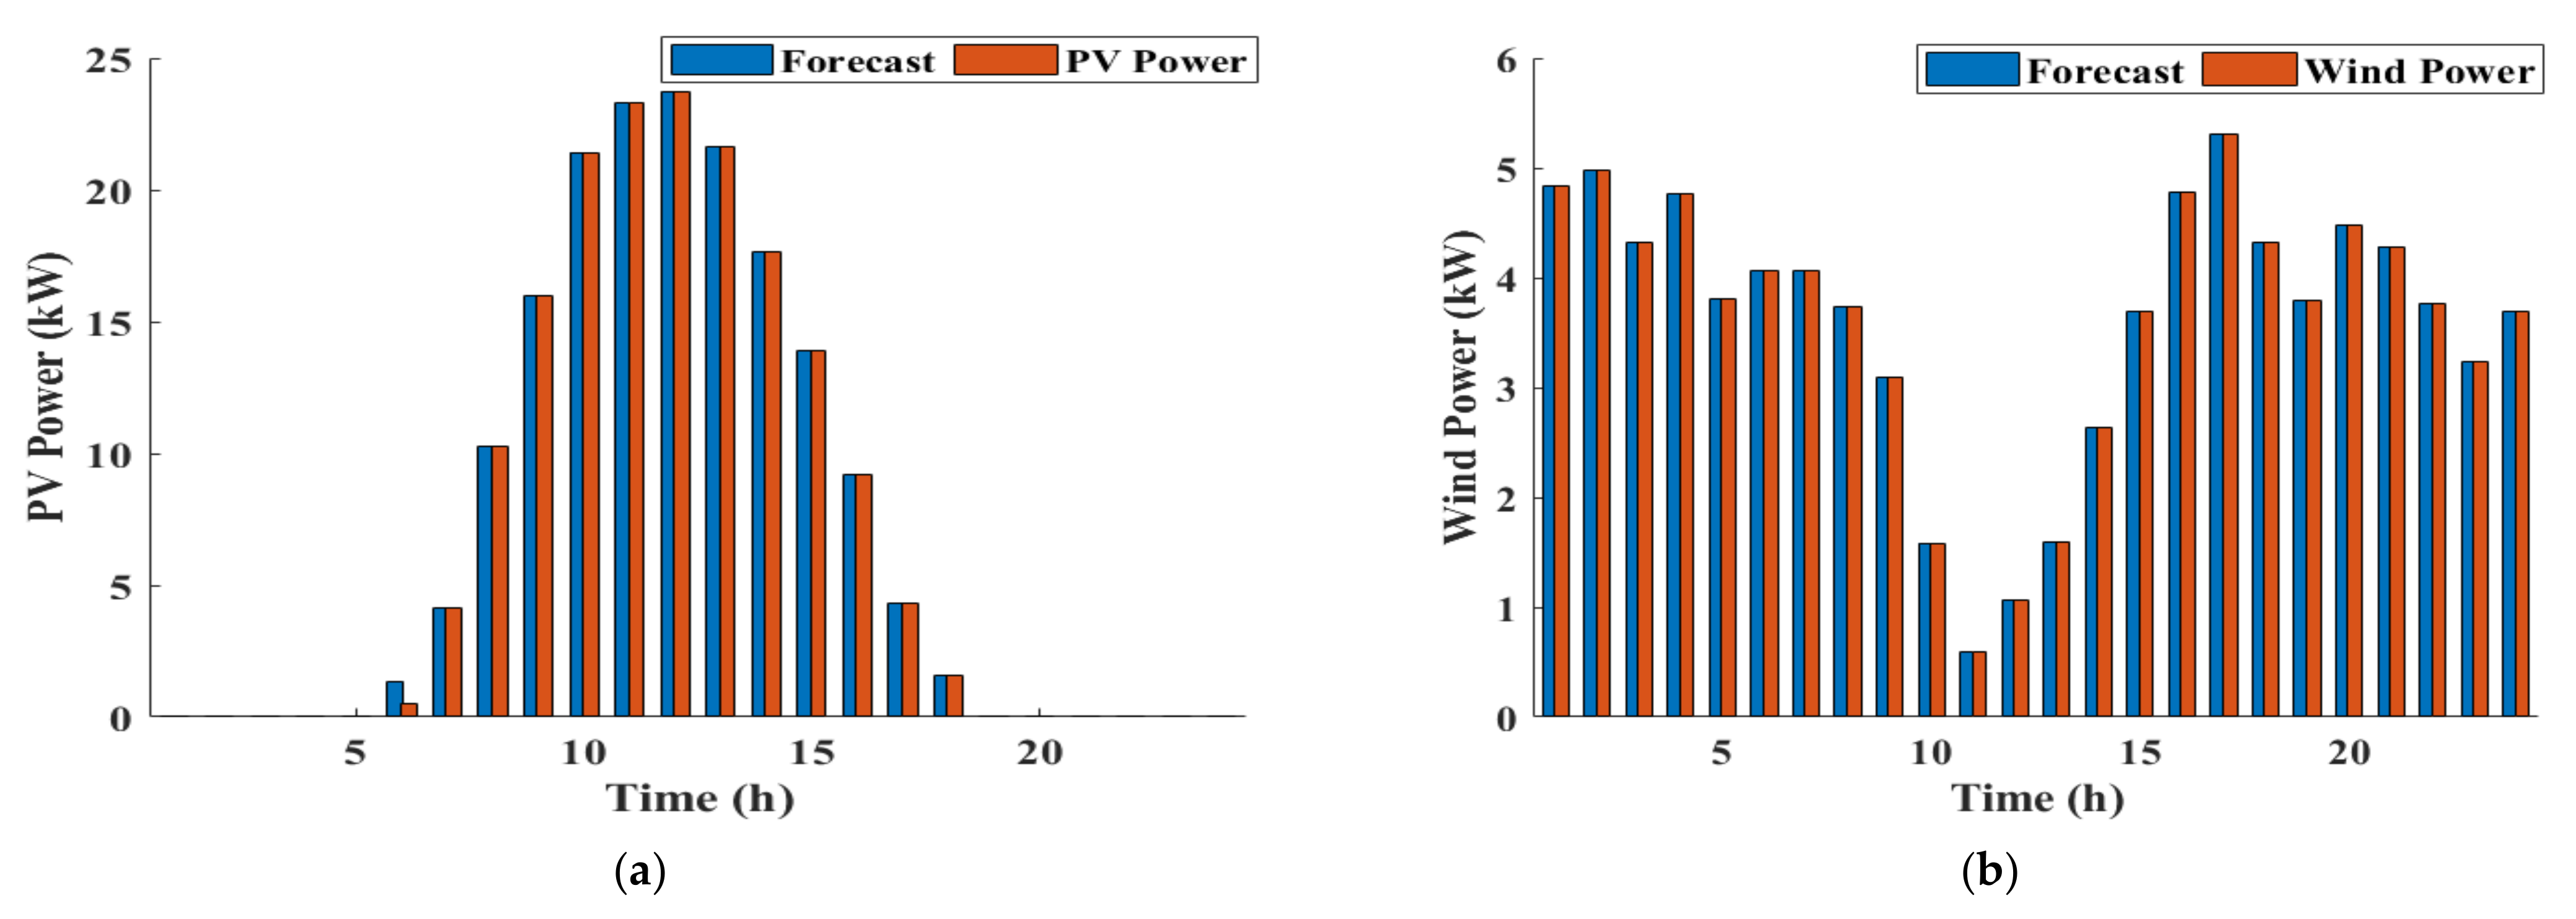
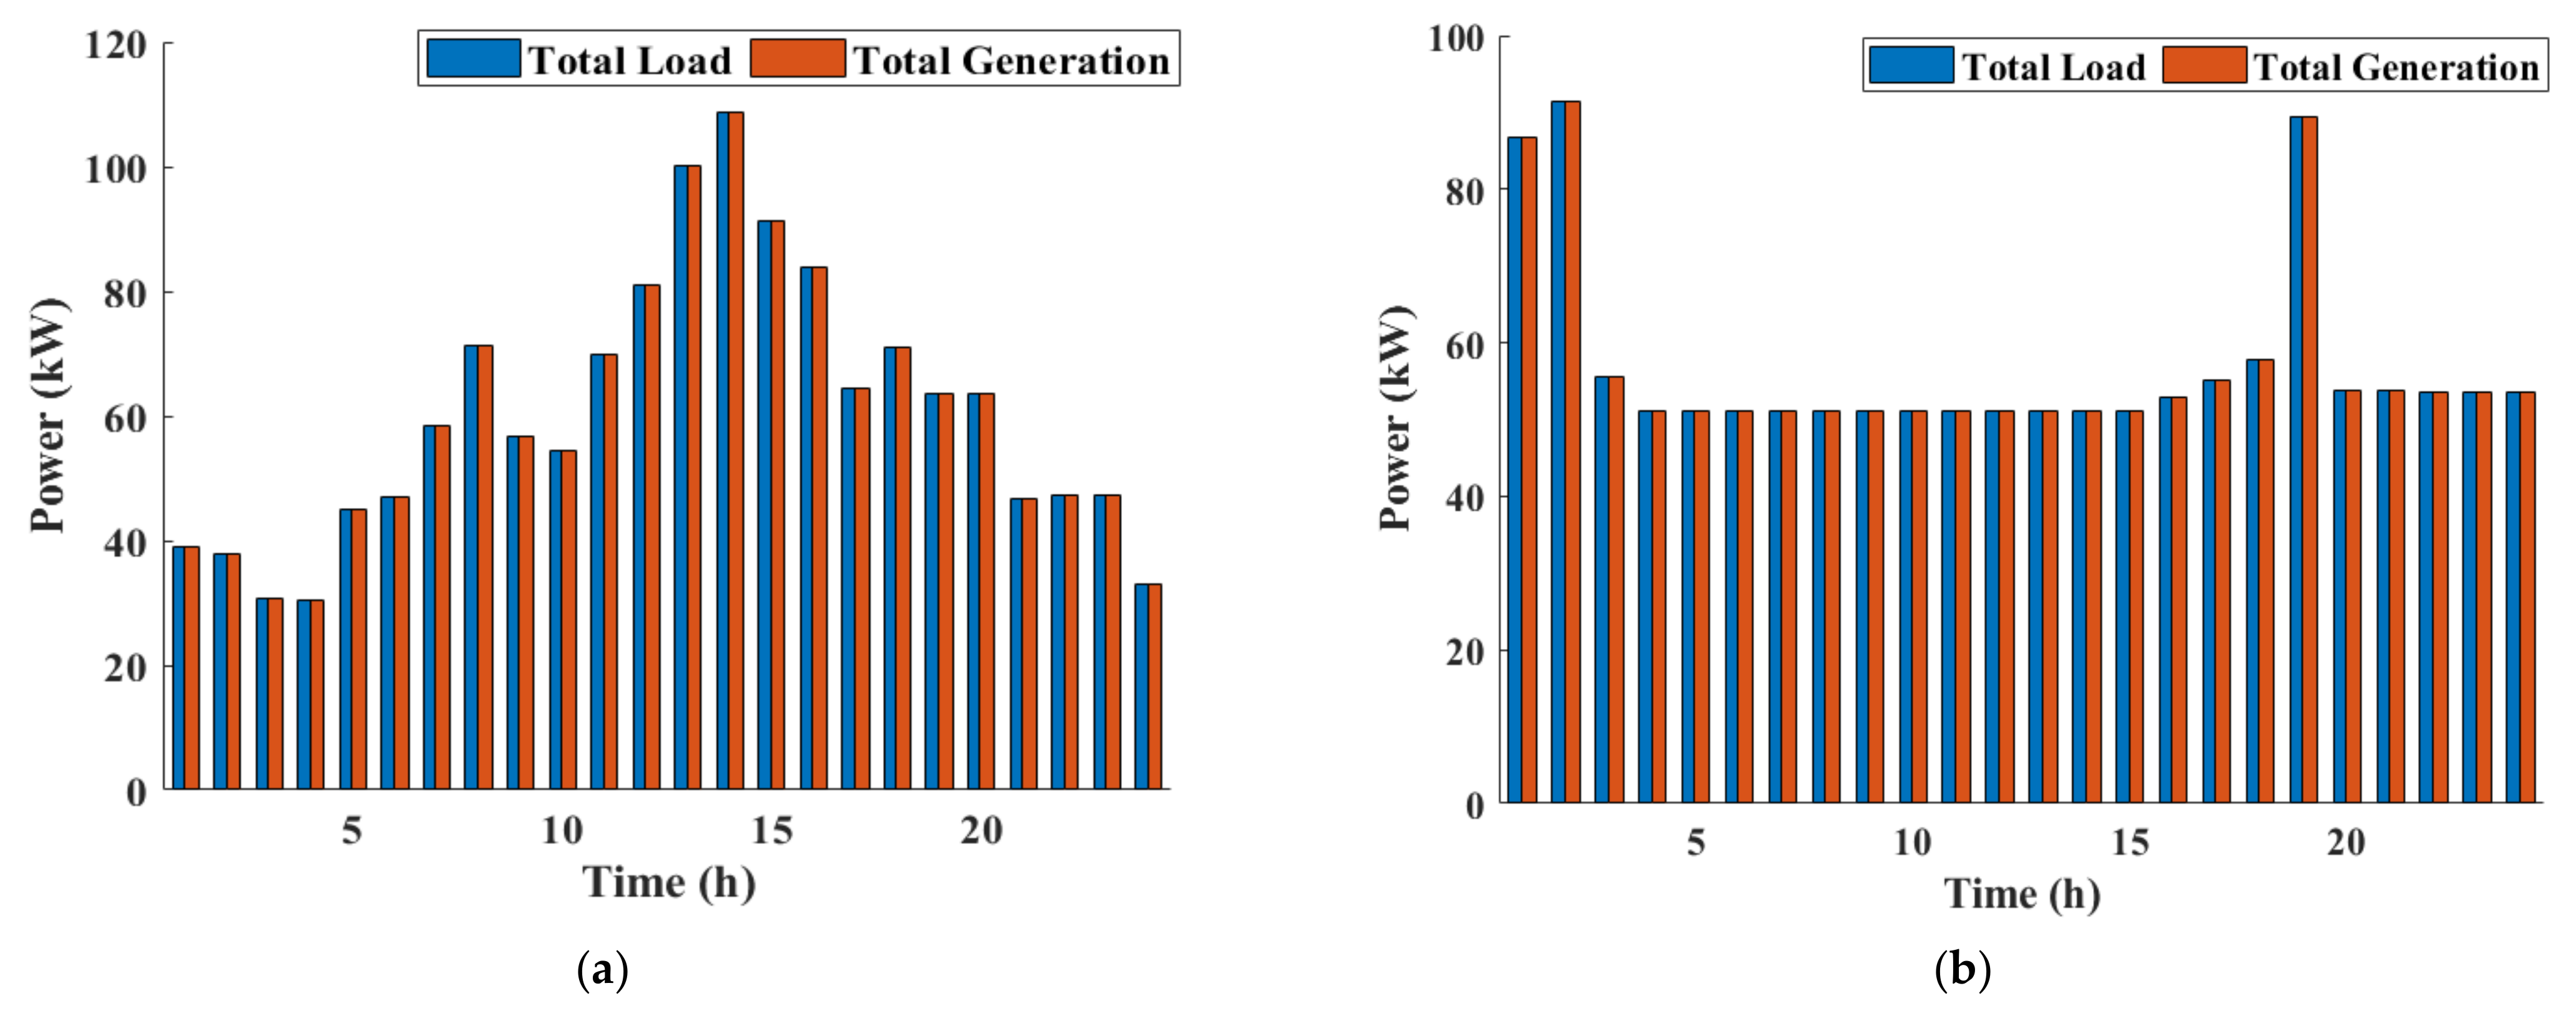
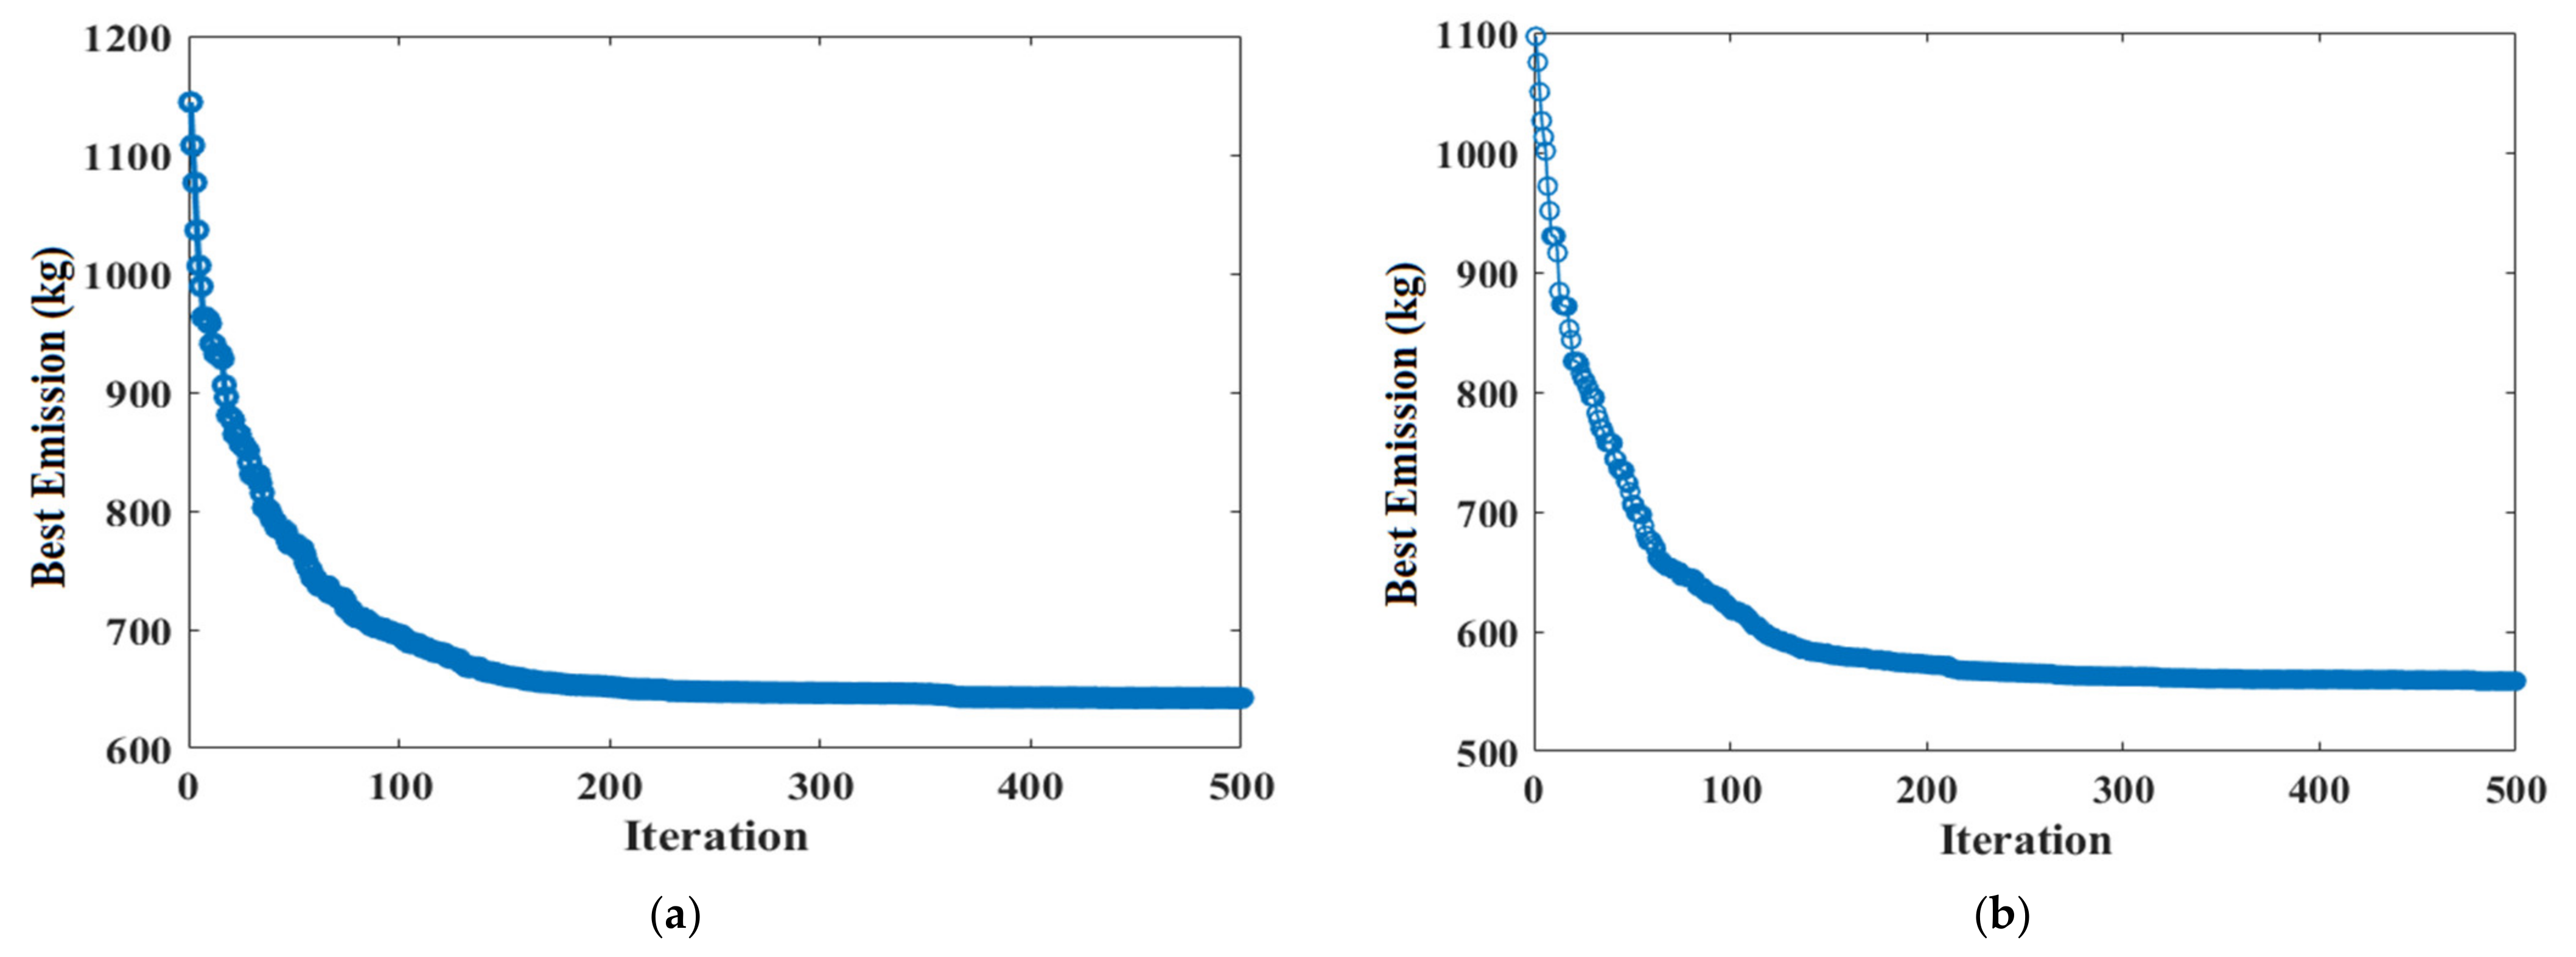
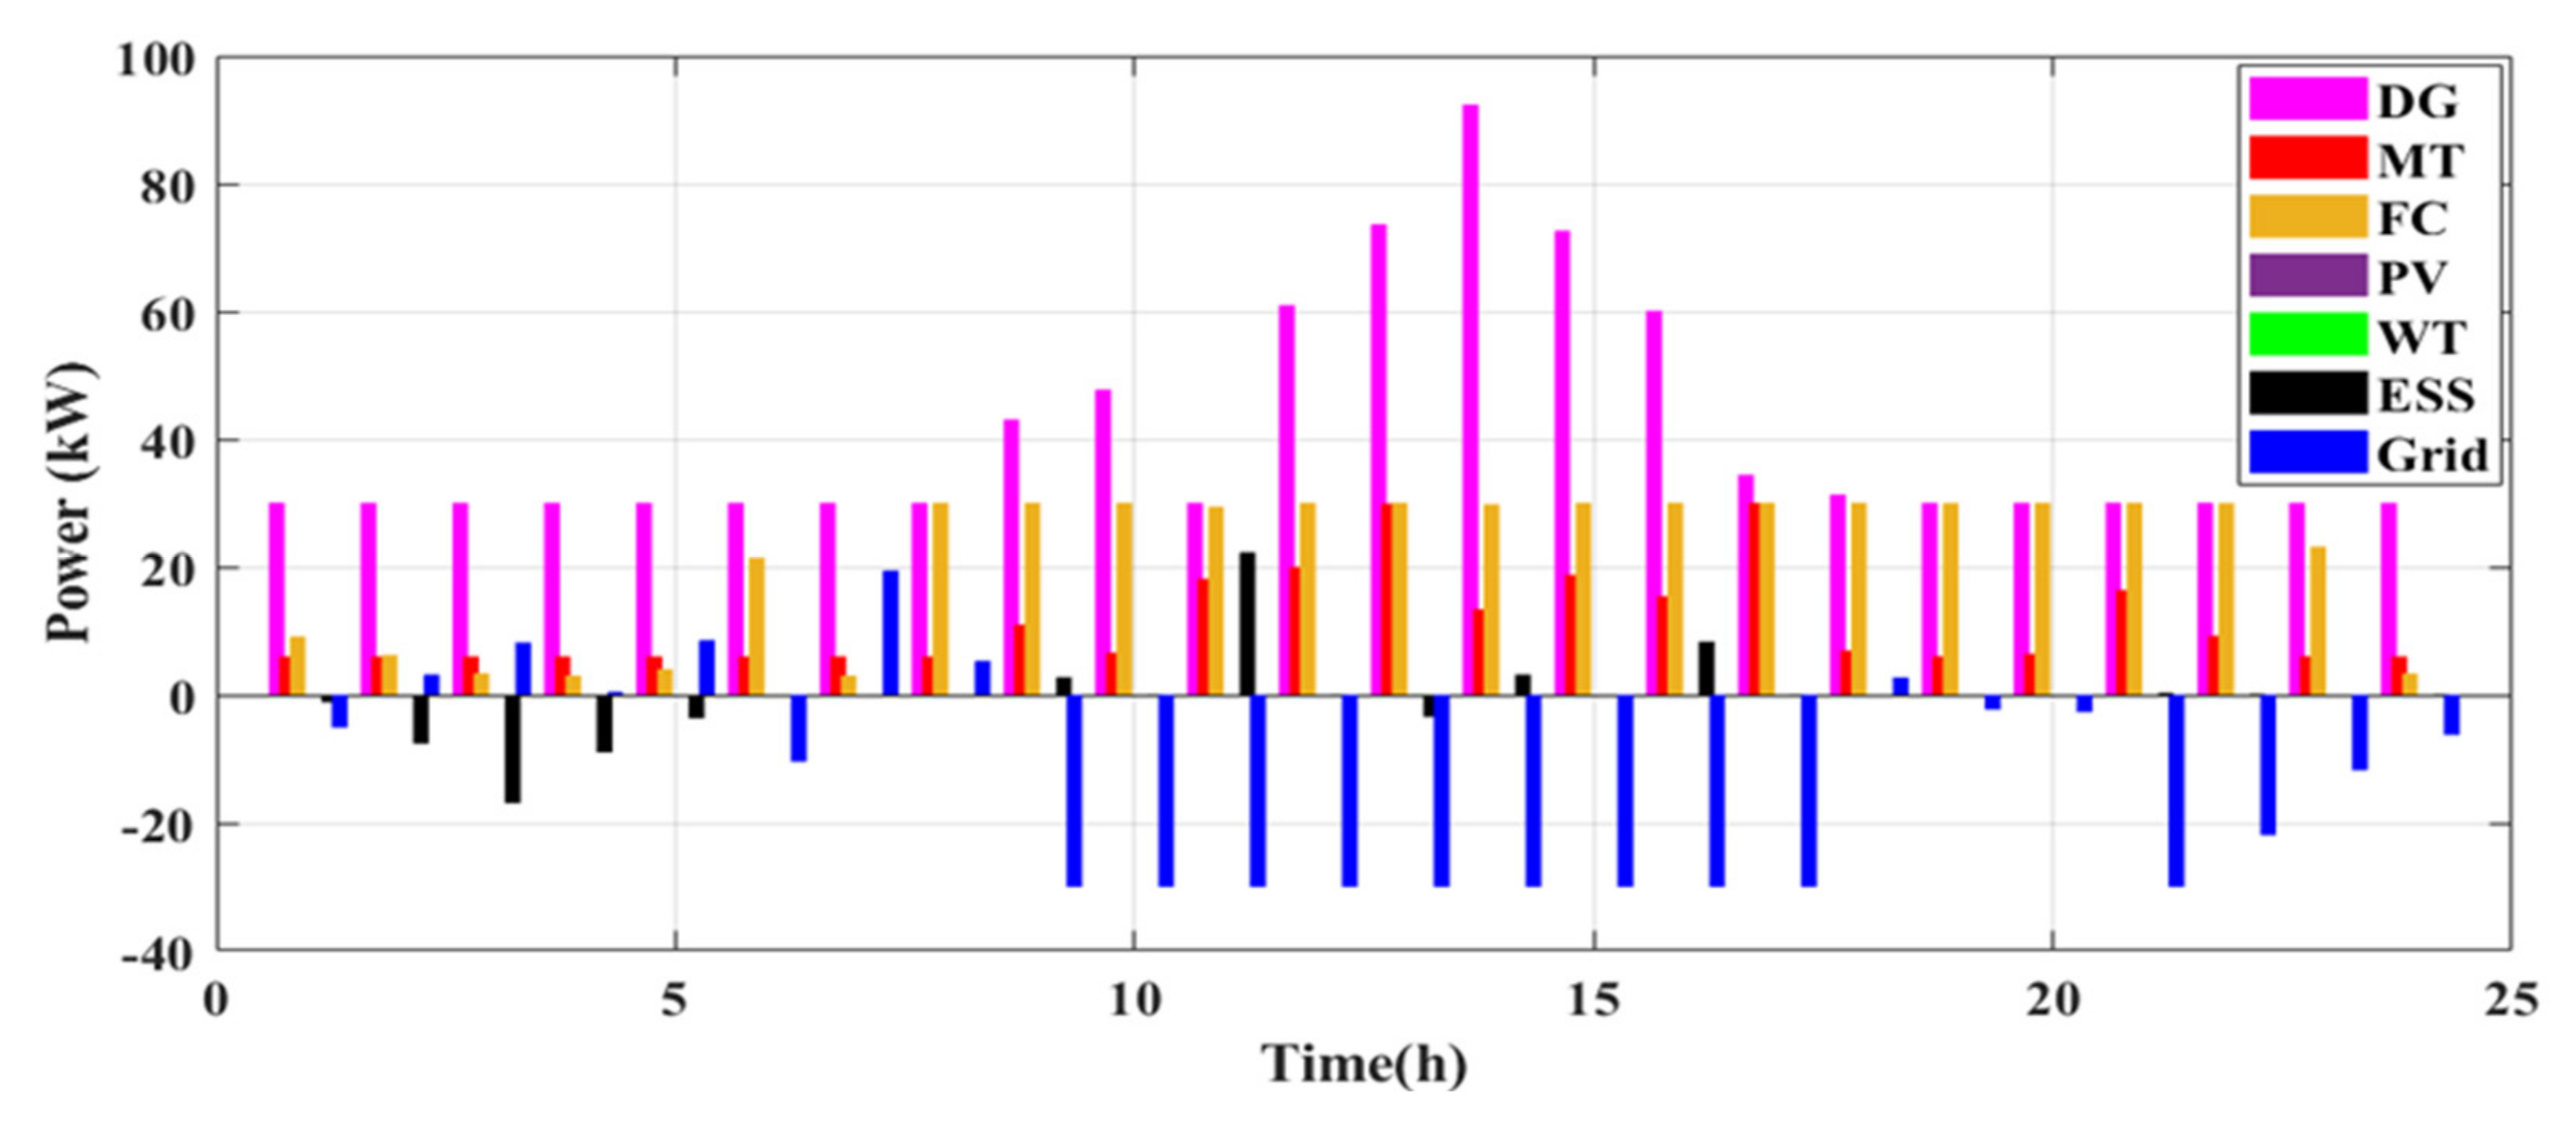
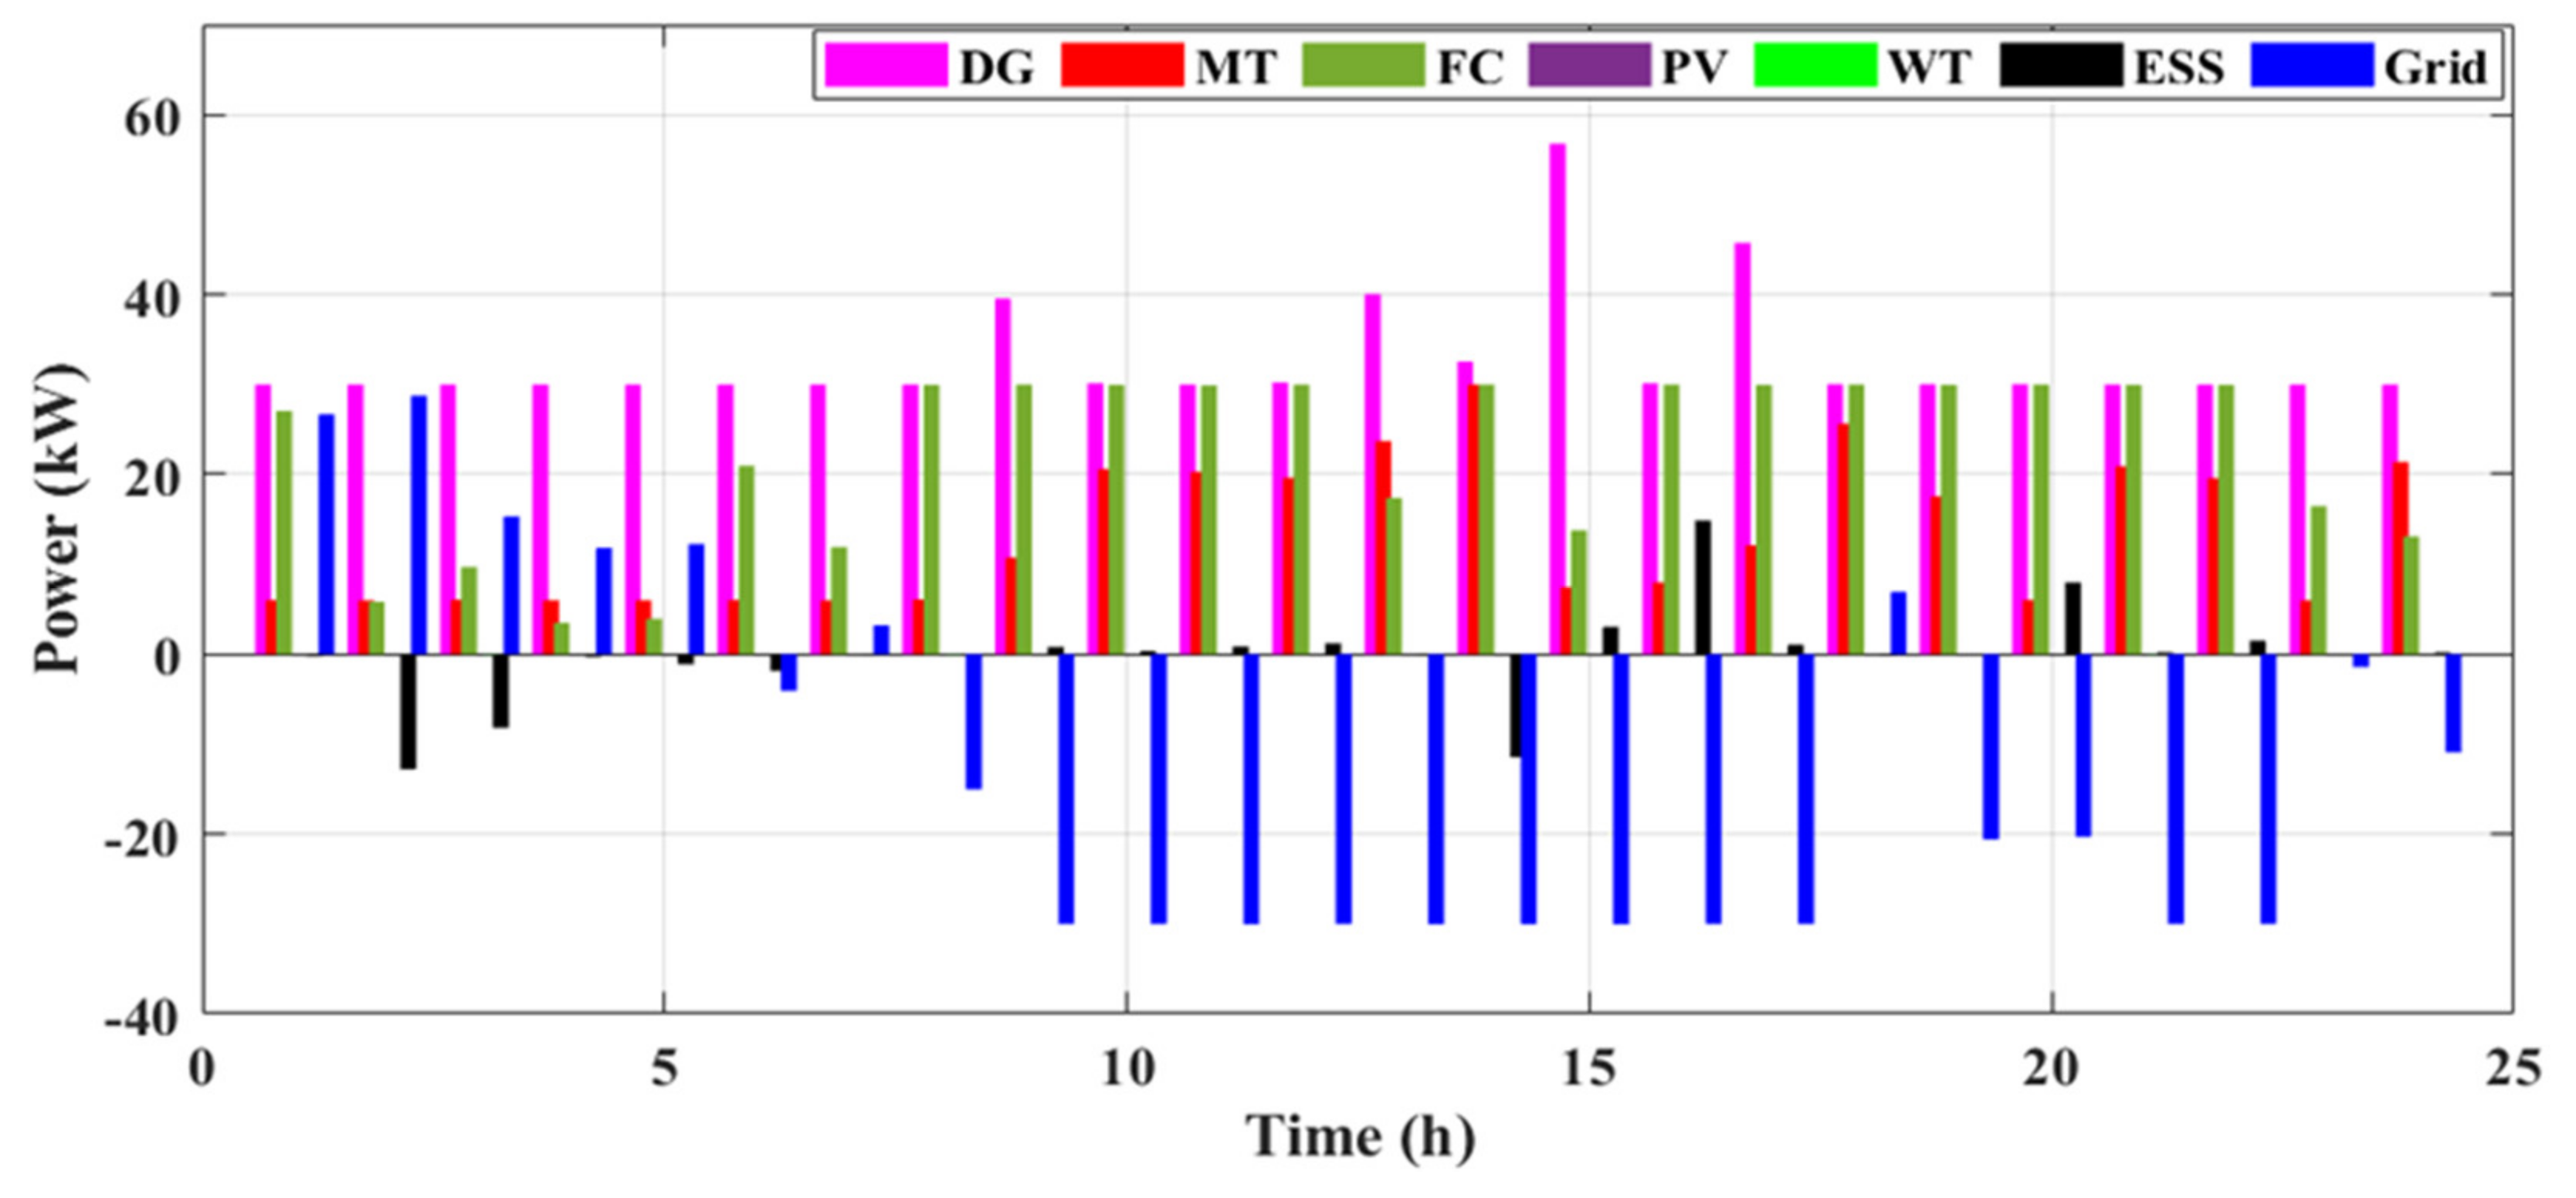
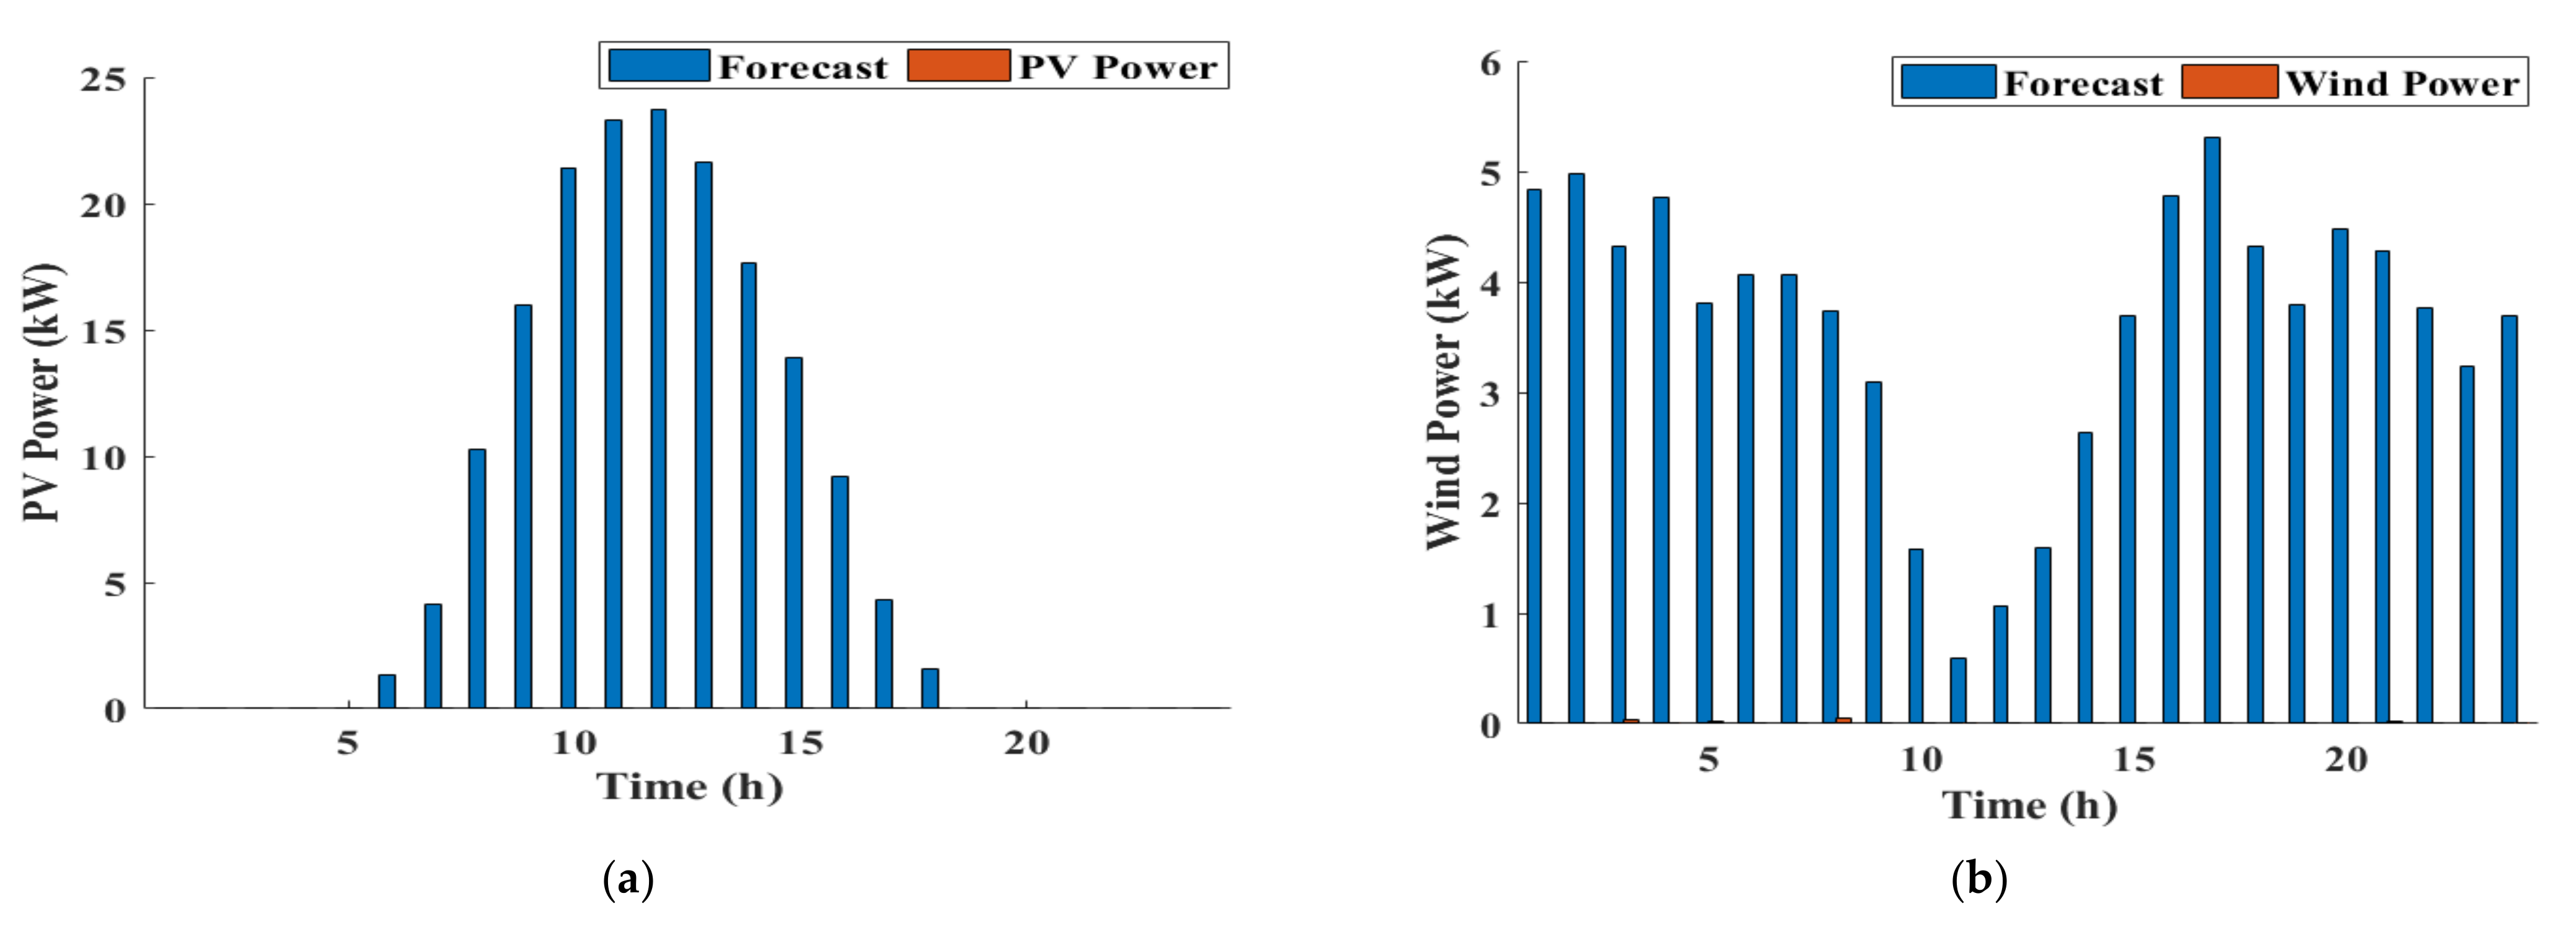
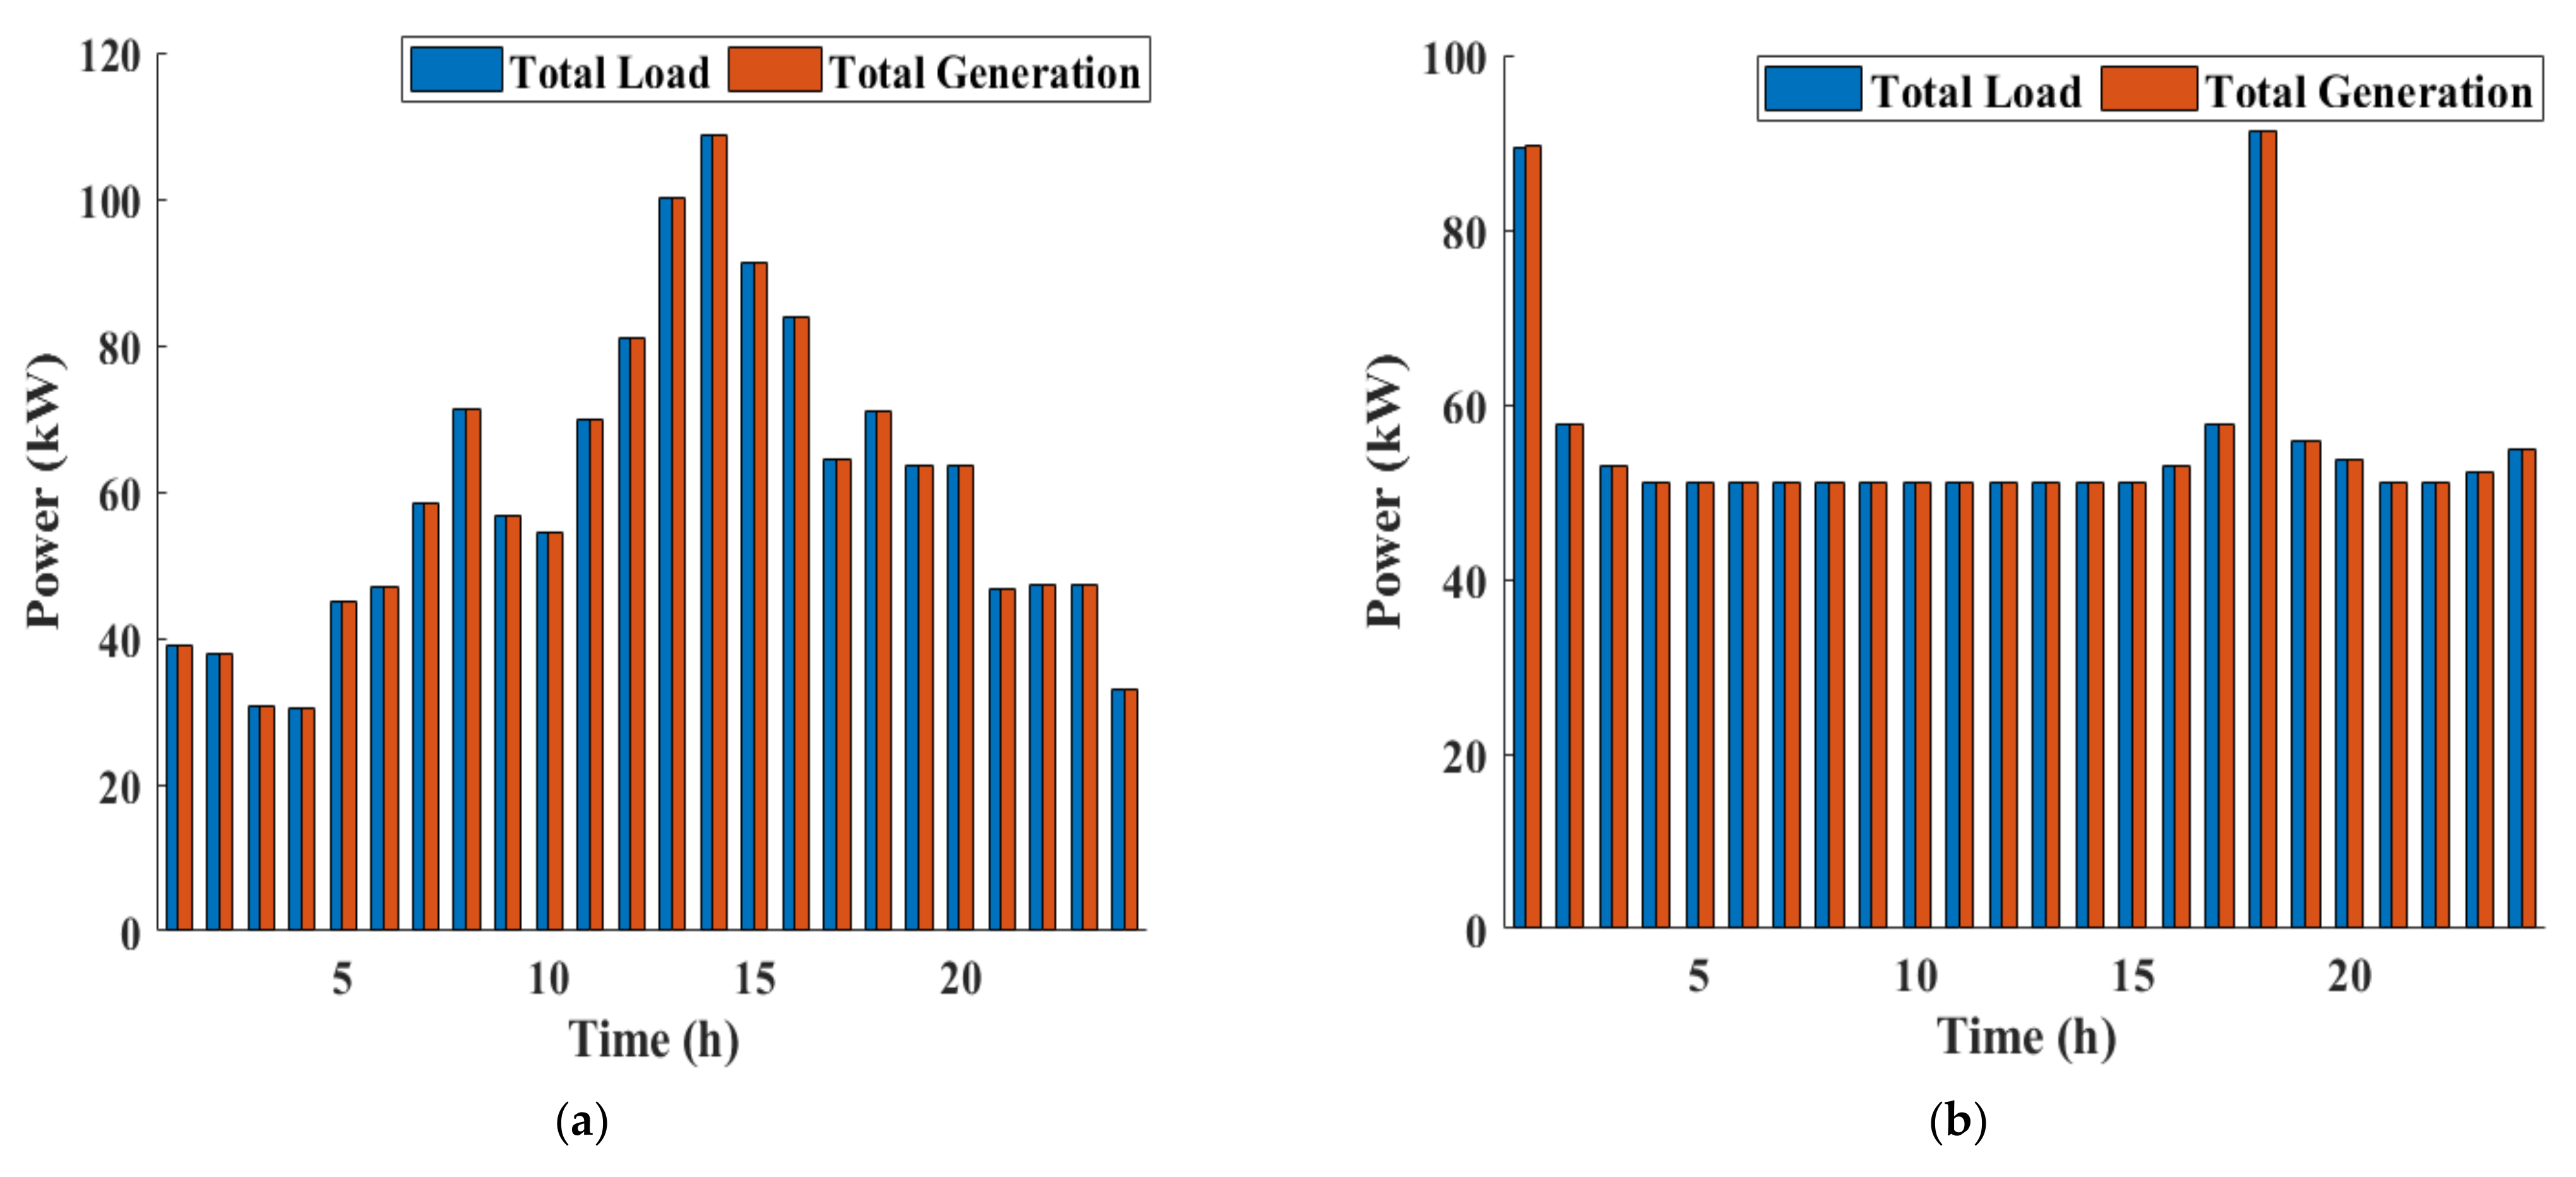
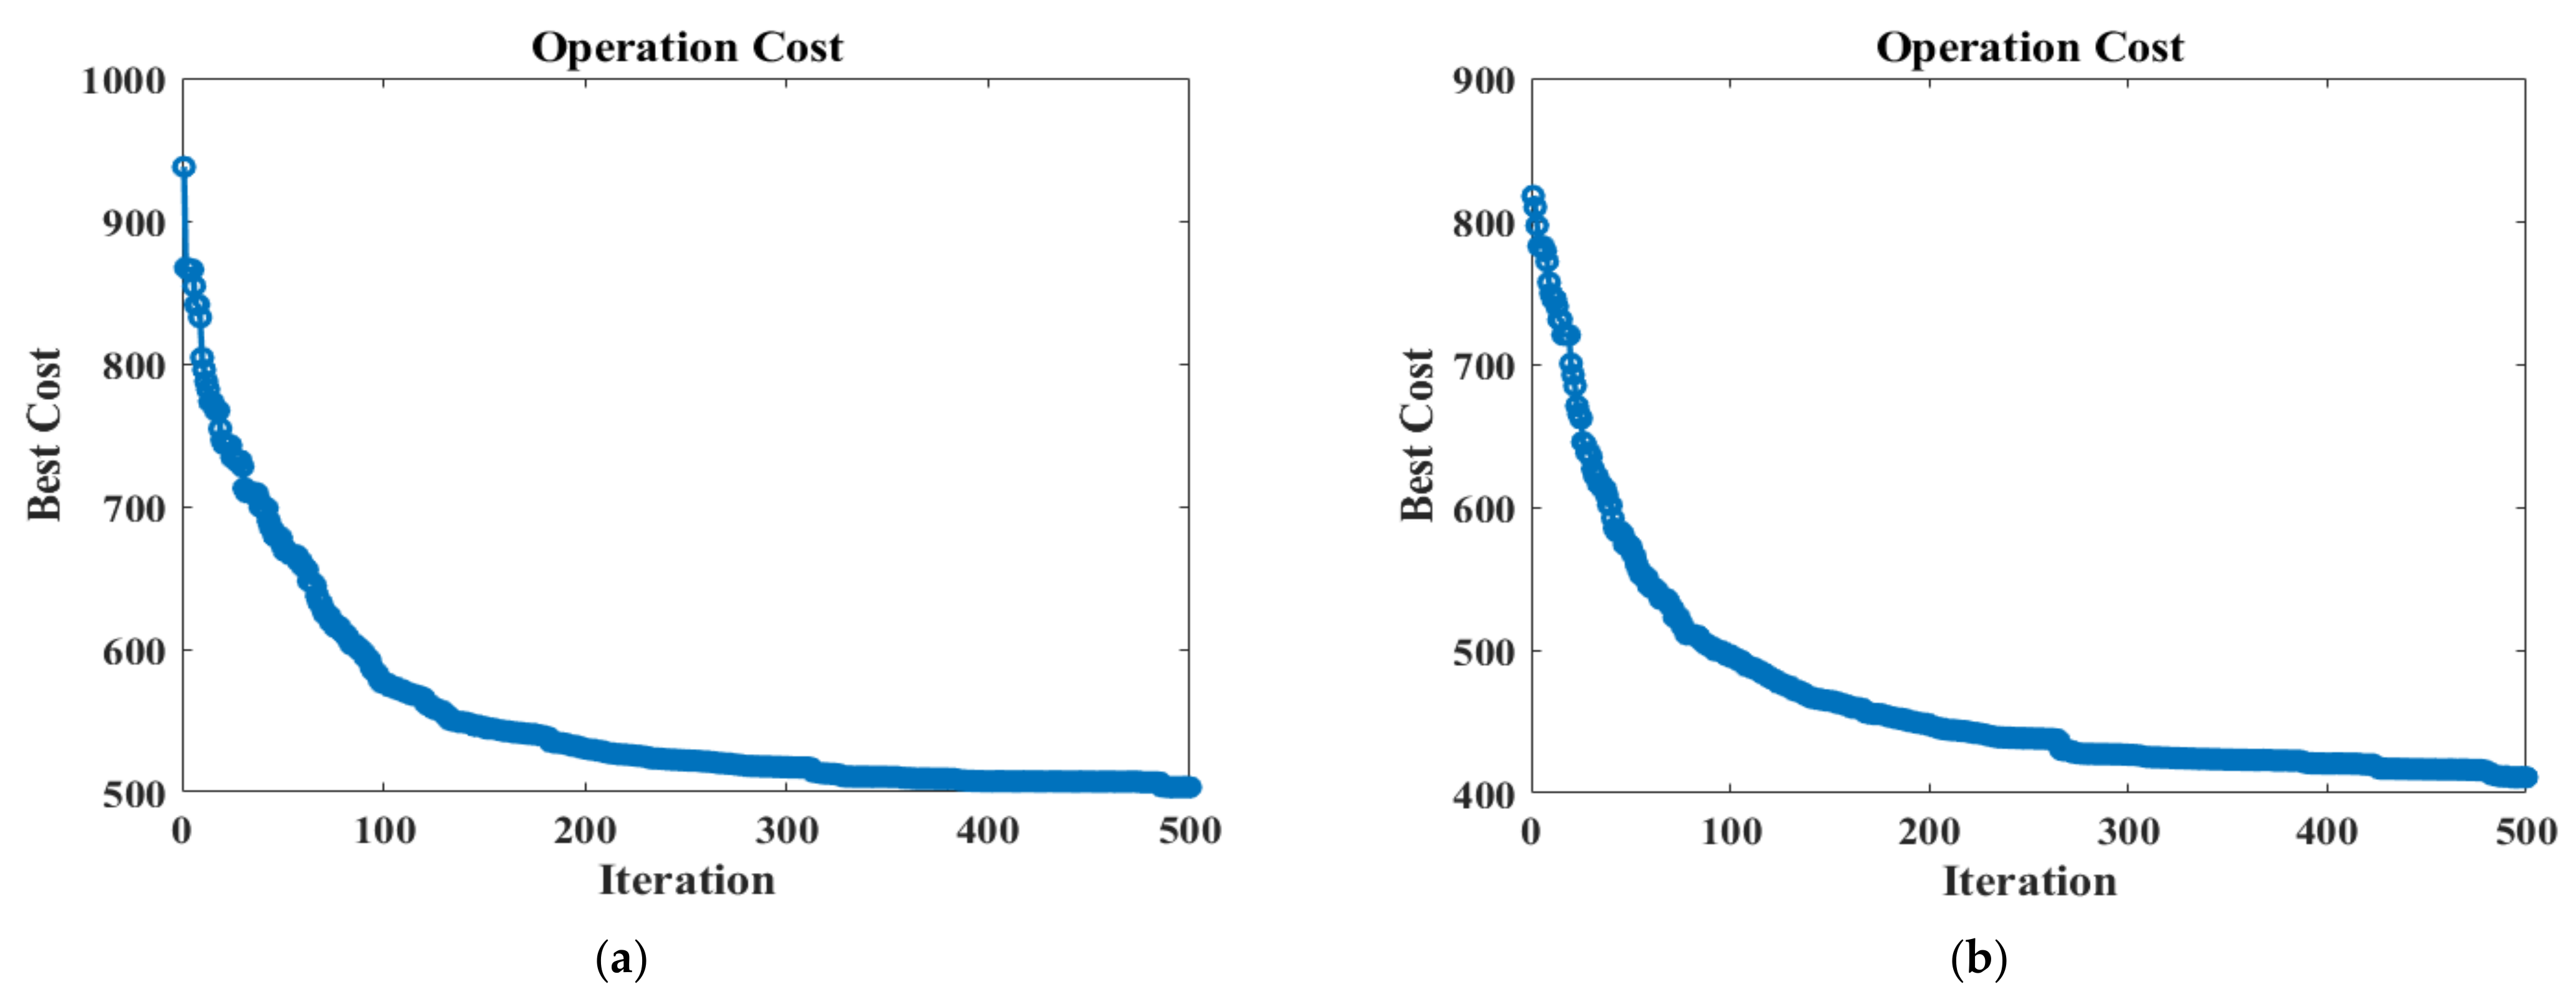
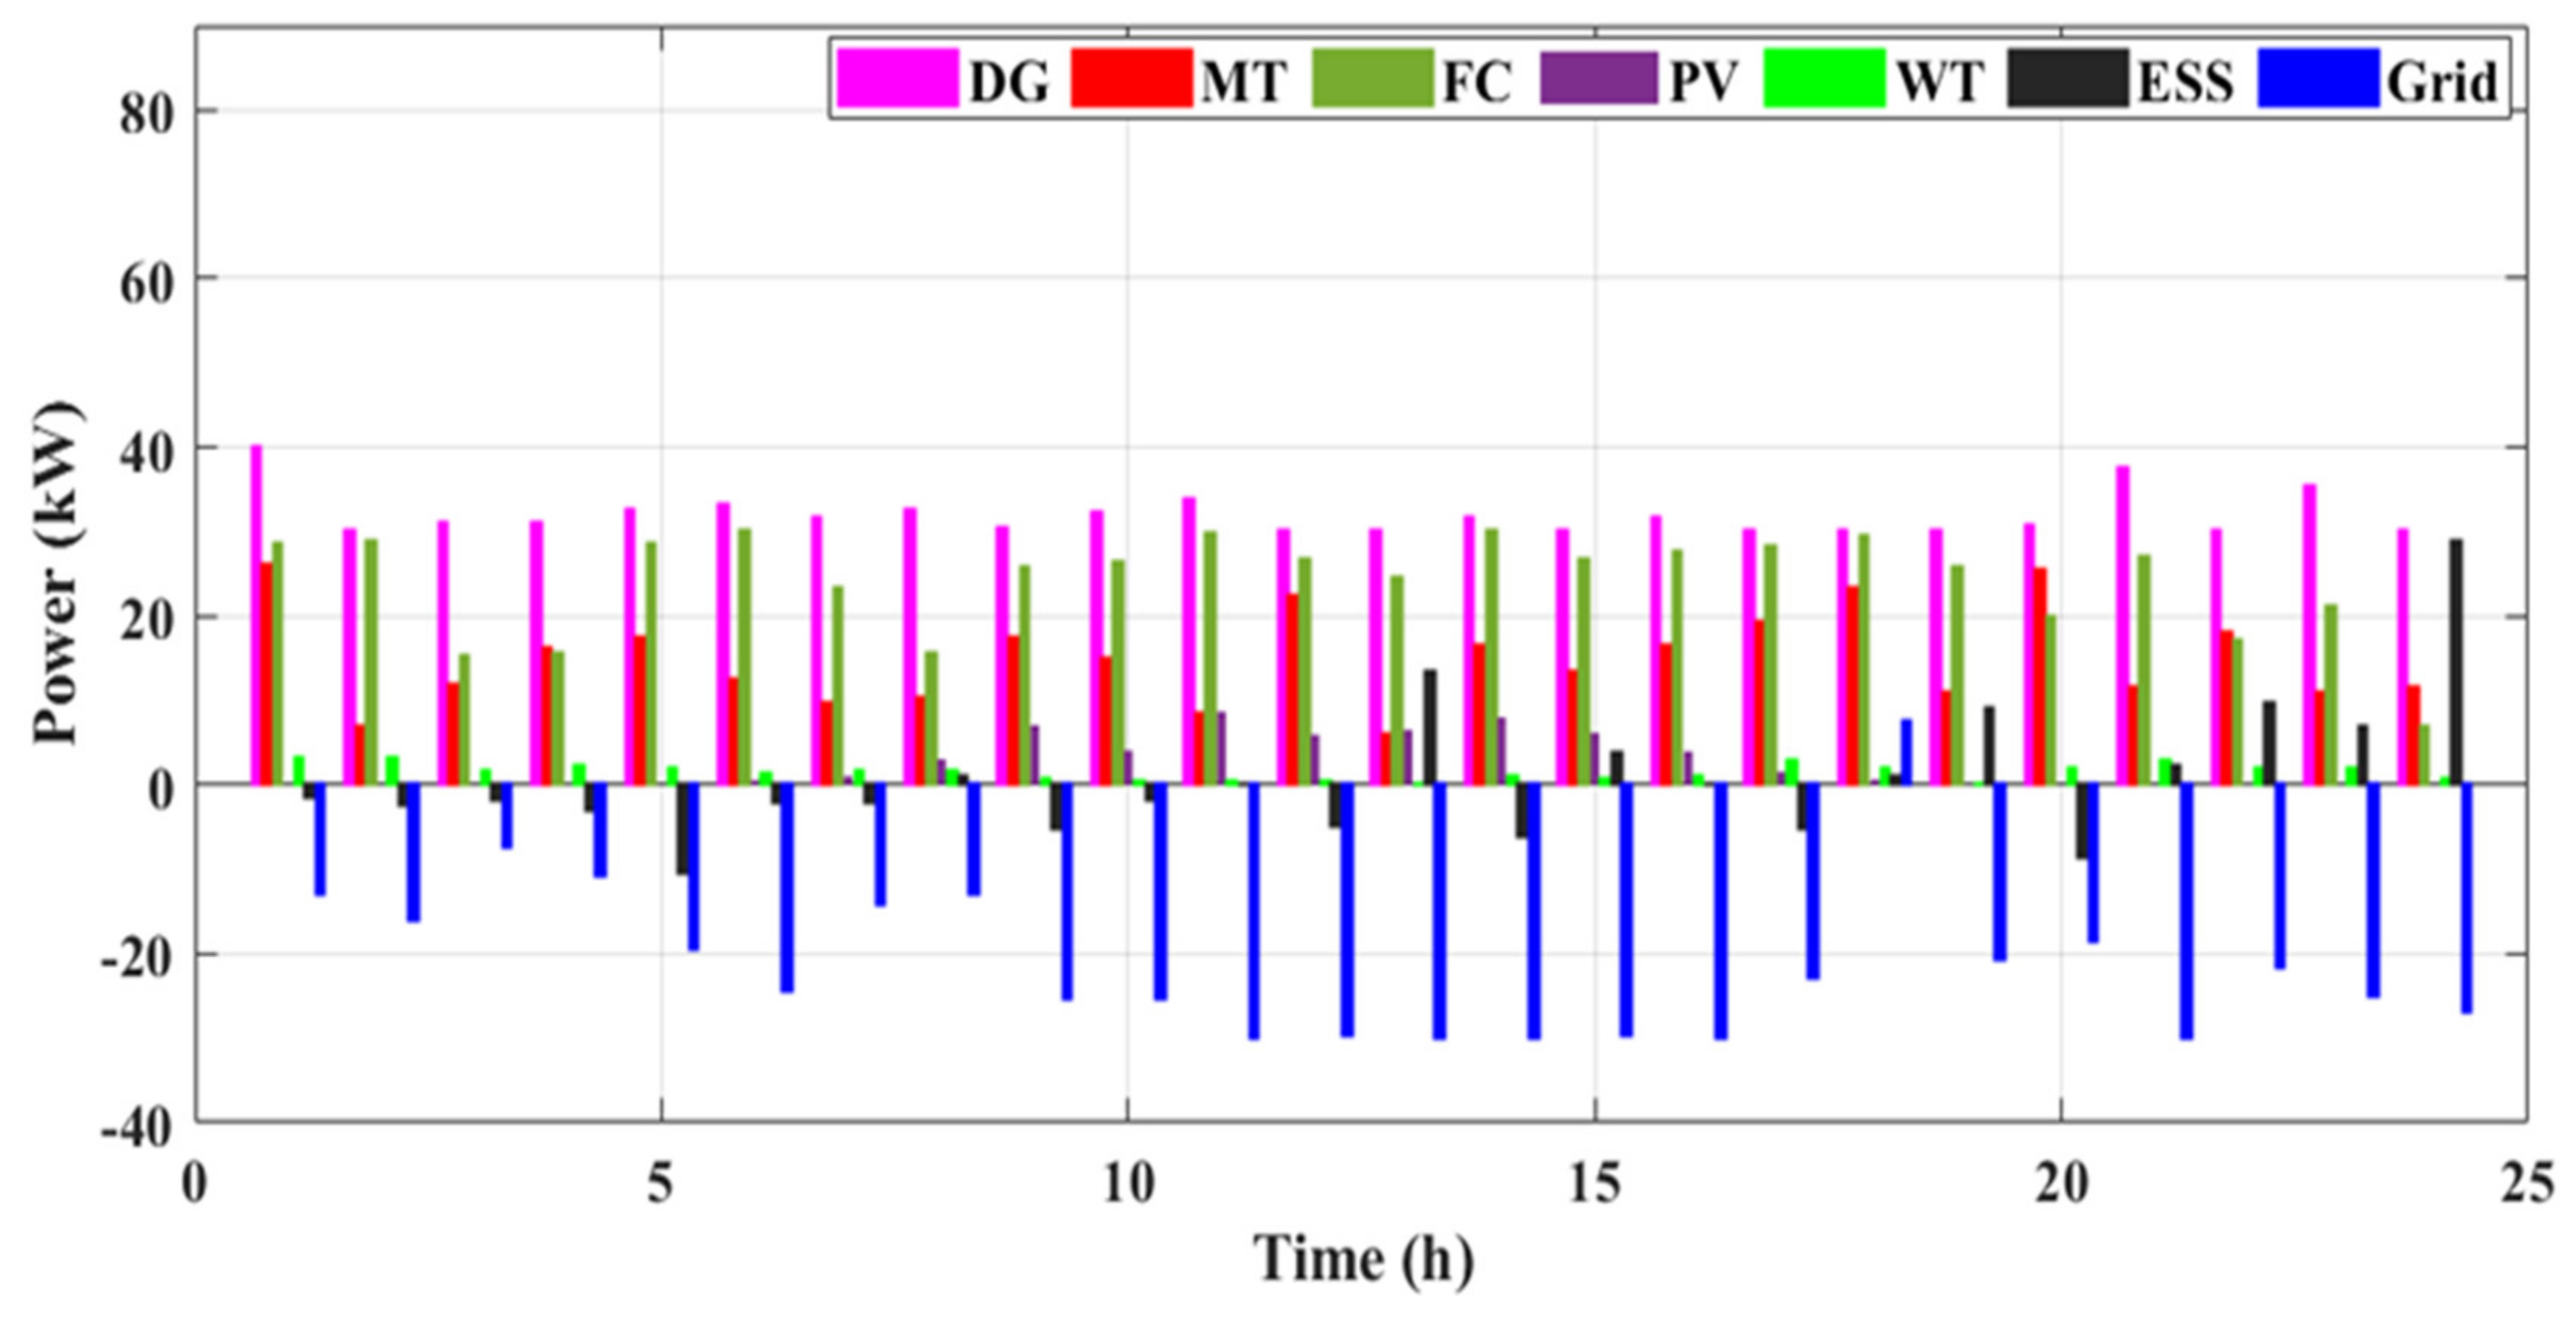
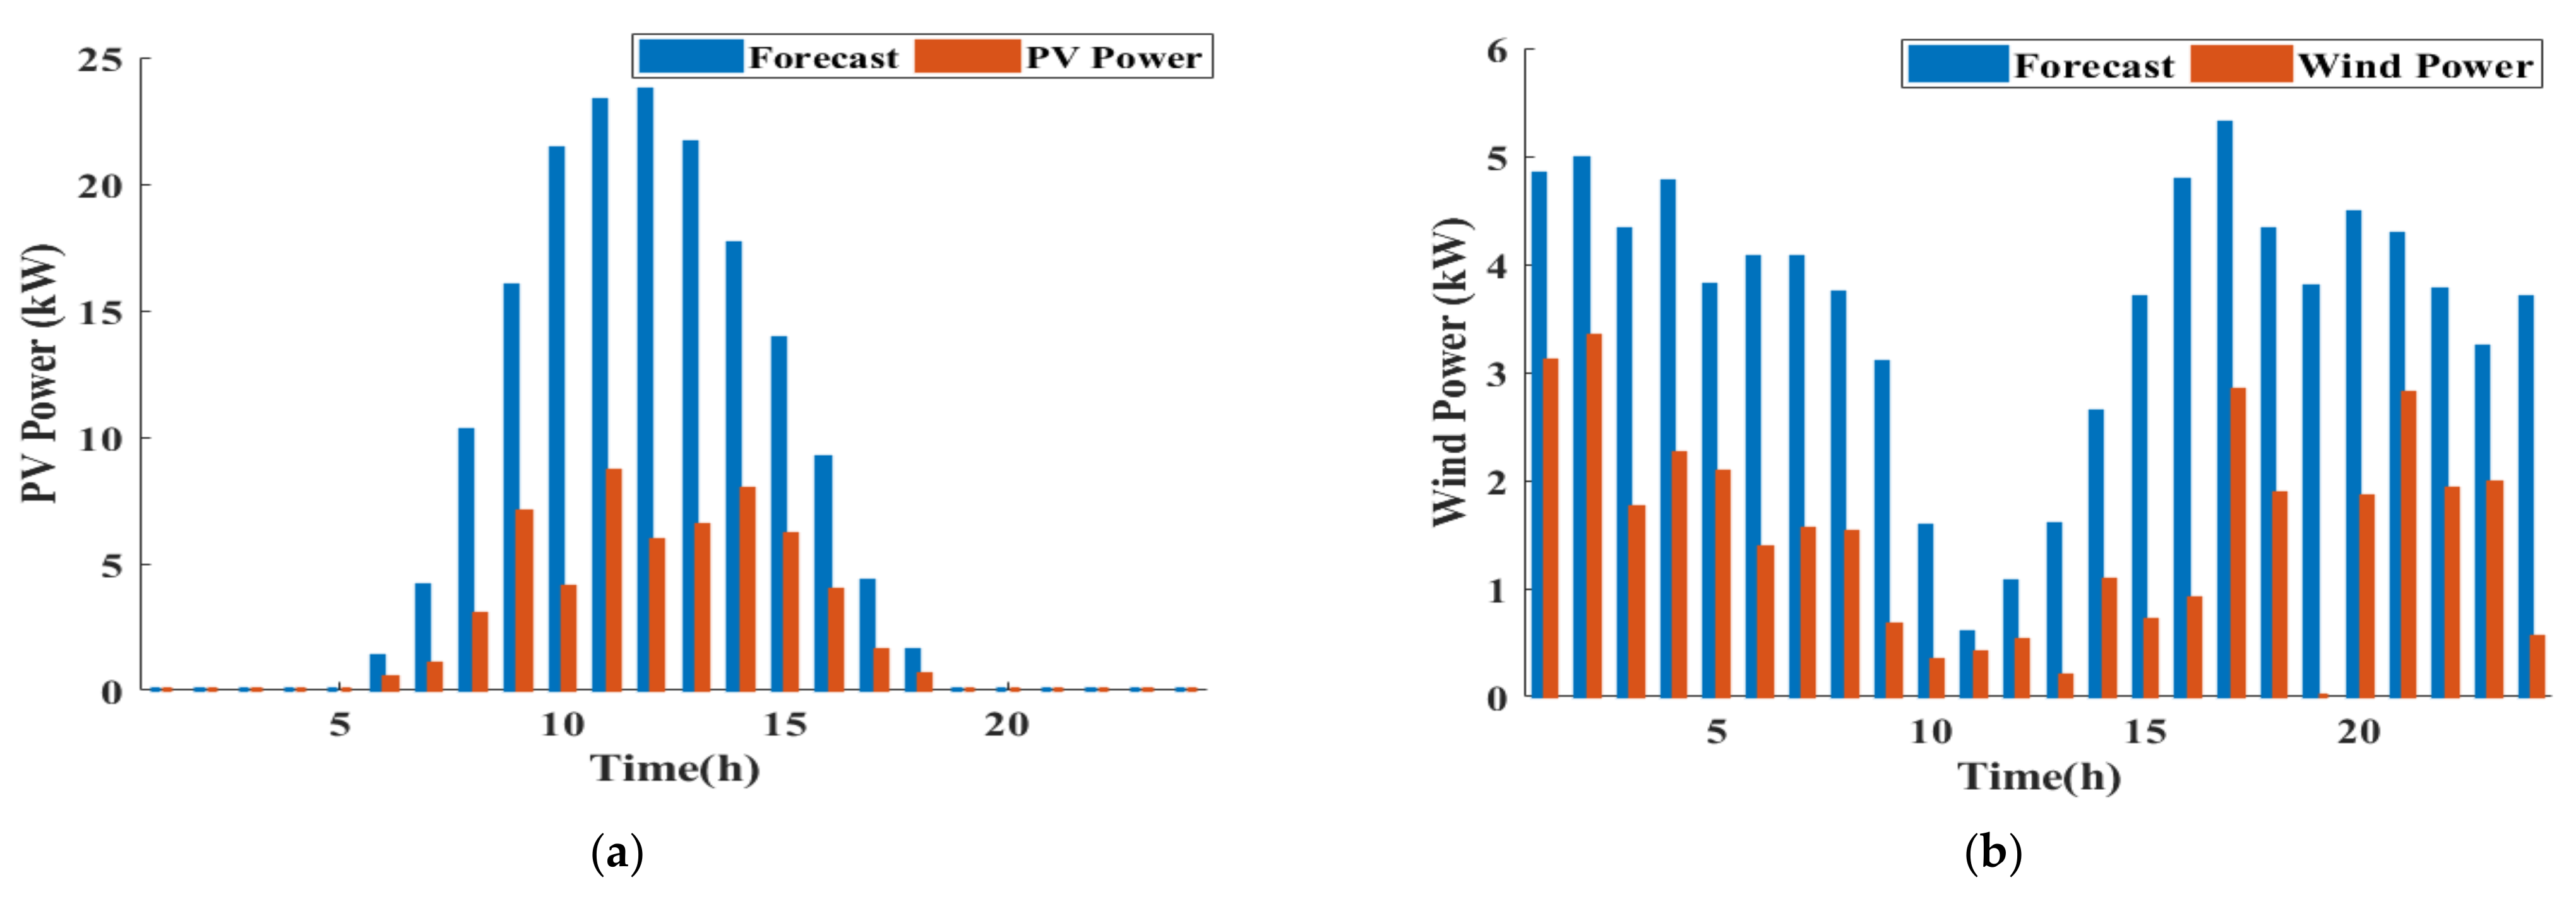
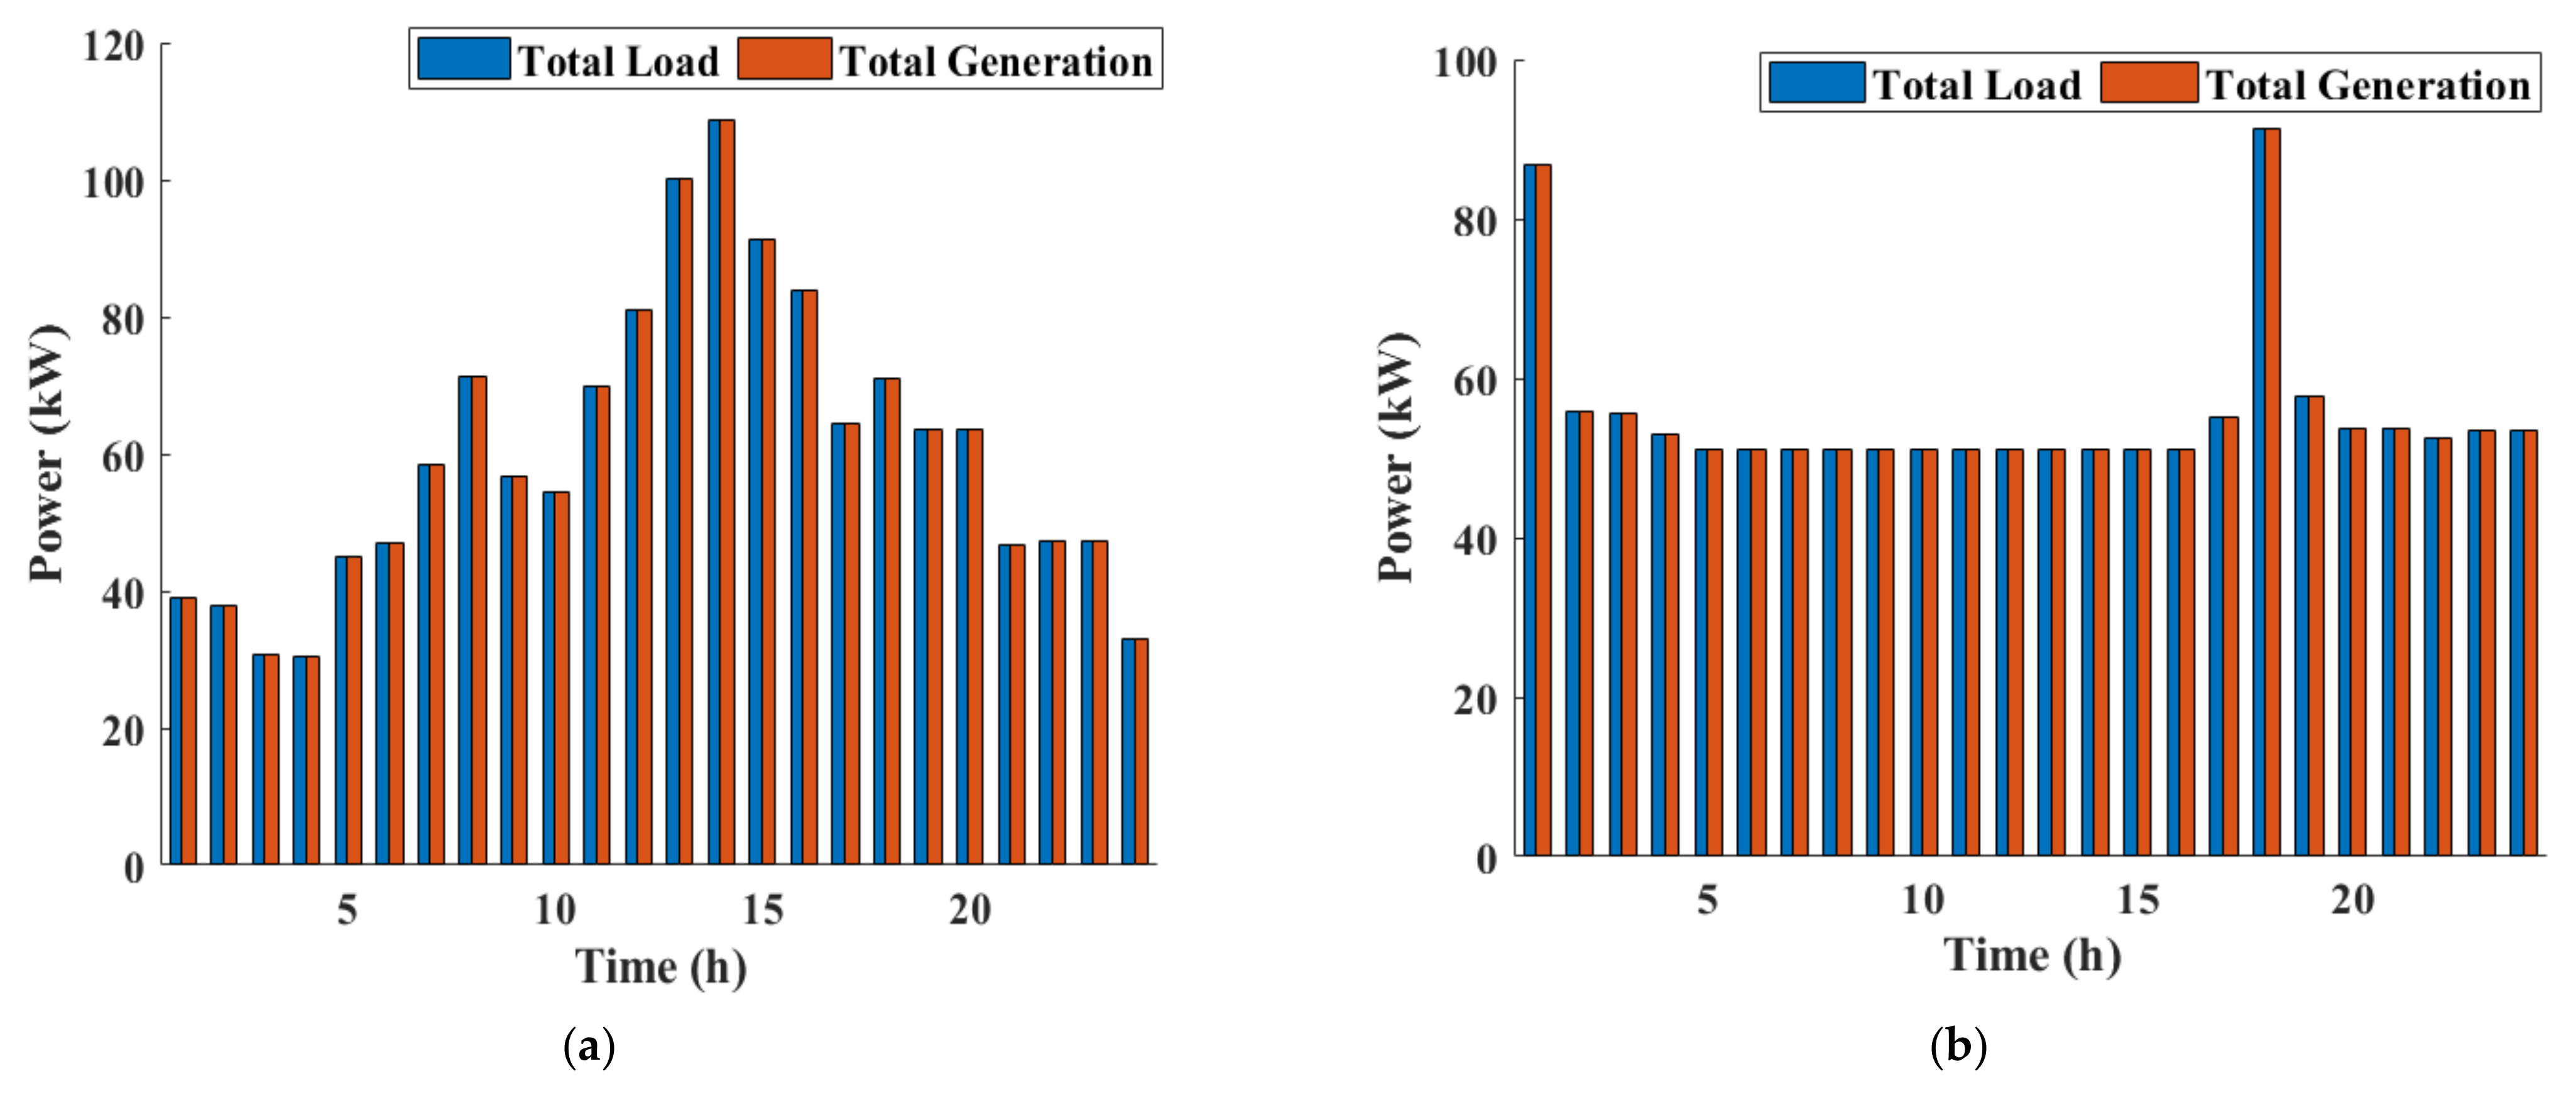
This section investigated the results of minimizing pollution emissions with and without the DSM. Figure 10 and Figure 11 illustrate the optimal power allocation of the generation units in these two cases, respectively. Figure 10 and Figure 11 reveal that the power production by the WTs and solar PV panels was not considerably different from the predicted amounts presented in Figure 12, which may be related to the fact that these forms of power generation are pollution-free. The data suggested that the utility purchased from the MG for the majority of working periods due to its high level of pollution emissions. In addition, when pollutant emissions were minimized, the DSM had a considerable effect in covering the uncertainties related to wind and solar energy production. As shown in Figure 13a, the power dispatch algorithm has addressed the supply–demand mismatch; however, Case #1 has not resulted in decreased emission because the DSM is not used to minimize power generating requirements. The daily supply–demand power with DSM program implementation based on BOSA is depicted in Figure 13b. It is obvious that the peak-to-average ratio of the load demand has decreased, consequently reducing the necessary generation power, cost, and emissions as indicated in Figure 14. Implementing the DSM program resulted in a 13% reduction in pollutant emissions. The convergence characteristics of the proposed algorithm are shown in Figure 14a,b without and with adoption of DSM, respectively.

8.2. Cases #3 and #4: Operation Cost Function Optimization Only without and with DSM

In these cases, operating cost minimization results were analyzed without and with DSM. Figure 15 illustrates the optimal power generation allocation of the unit without DSM. The simulation’s results, which pertain to the case without an optimal DSM program, indicate that charging of the battery started in the earliest hours of the day, when the price has dropped, while the utility purchased electricity from the MG during the peak times of demand, when the price became highest, so that the power consumption could be met by the offering of the price from the distributed generation resources. When there were DSM available in the system (Figure 16), almost the same situation existed. The power generated by the PVs and WTs, especially with adoption of DSM, are depicted in Figure 17a and b respectively. However, because the price of WT and PV resources offered is higher than the price of other generation resources, they cannot gain a great deal of attention when determining the optimal operational cost. As depicted in Figure 17, their power generation is very low or even zero in these cases. As shown in Figure 18a, the supply–demand mismatch has been adjusted by the proposed power dispatch algorithm, but Case#3 has not resulted in lower operating costs due to the fact that the DSM is not adopted to reduce power generation requirements. Figure 18b shows the daily supply–demand power with DSM program adoption based on BOSA. It is evident that the peak-to-average ratio of the load demand is reduced in this case (Case #4), thereby reducing the required generation power and system operation costs as depicted in Figure 19.

8.3. Cases #5 and #6: Emission and Operation Cost Functions Optimization without and with DSM

In these particular cases, the outcomes of minimizing two incompatible functions, namely, pollutant emissions and operating costs, were analyzed, both without and with the optimal DSM program. The optimal power allocation was performed for the simultaneous reduction of operational costs and emissions. Most of the time, the utility purchases power from the SMG as shown in Figure 20 (without DSM) and Figure 21 (with adopting DSM) due to the utility’s high pollution levels. Figure 22a,b illustrates the power generation by the WTs and solar PVs takes into consideration the reduction of the operating cost and pollutant emission functions, as well as the simultaneous reduction of the pollutant emission and operating cost functions when DSM was available. As wind and solar power are typically pollution-free, their maximum power generation is achieved when the pollution emission function is considered. These resources, at the same time, do not receive much consideration when it comes to the optimal operational cost because their prices are higher than those of other power generation resources. As a result, in these cases, the energy extracted from WTs and solar PVs results in the lowest operating costs and emissions. The supply–demand mismatch has been fixed by the power dispatch algorithm, but Case #5 has not led to less pollution or lower operating costs overall due to DSM not being adopted to decrease the generation requirements, as shown in Figure 23a. Due to the load demand reduction in Case #6, the supply–demand power mismatch has been resolved by the power dispatch algorithm with lower generation requirements, which has resulted in decreased emissions and lower overall costs of operation (as shown in Figure 23b).
According to Figure 24, since operational cost and emissions cost objectives are opposite, traveling from curve initial points to Pareto path endpoints corresponds to a change in operation behavior from low cost and high pollution to high cost and low pollution, with fuzzy mechanisms determining the optimal operation point. Figure 24a shows that without DSM, the optimal operating point cannot be improved to reduce operational costs and pollution emissions. In the case with DSM programs (Figure 24b), they help to improve the optimal operation point, lowering operational costs and pollution emissions by 21% and 7.2%, respectively.

8.4. Time Testing Results

These tests are presented to demonstrate the time required to execute the proposed system operation for six adopted scenarios. The elapsed time of the proposed DSM and single-objective or multi-objective optimization algorithms is showed in Table 4. The optimal DSM algorithm is implemented with a maximum iteration number of 300, a population size of 10, maximum limit of 100, and a maximum shift time of 4. The PSO is executed with a maximum iteration number of 500 and a swarm size of 10.

9. Conclusions

This paper proposed a multi-objective DEED combined model with BOSA-based DSM to stay ahead of DSM’s utility, generation, and energy consumption reduction benefits. The proposed BOSA-based DSM program adopts a load-shifting program to obtain day-ahead optimal load appliances scheduling. The problems associated with MG operation were addressed by managing the energy according to the analysis of the total operating costs of the MG and the associated pollutant emissions with/without applying optimal DSM based on BOSA. The consumer side has the potential to play an active role in energy production and consumption management. Consumers could participate in RTP-based DSM for consumption management. RTP was implemented to incentivize consumers to better regulate their electricity consumption. In addition, a probabilistic programming technique was employed to model the stochastic behavior of wind and solar cell power generation. The fuzzy-based MOPSO method was used to solve and optimize the DEED proposed model. Simulation results demonstrated that if consumers participate in DSM, it is possible to reduce operational costs and emissions. Among the cases studied, the best results were found when BOSA-based DSM was used to look at operating costs and pollutant emissions at the same time. Additionally, simulation results demonstrated that considering the pollution function as the primary objective made the operational costs increase, so DSM programs were utilized for minimizing the operation cost and vice versa for considering the operation cost as a single objective. This model also demonstrated that if consumers collaborate in DSM, in addition to compensating for production shortages due to the unpredictability of wind and solar power, this results in a decrease in operating costs and system-wide pollution simultaneously. The results show that, when compared to unscheduled peak demand (which was 105 kWh), the proposed BOSA algorithm-based DSM had the lowest peak demand (88.4 kWh). Additionally, operating costs dropped from660 USD to 508USD, a 23% decrease, and emissions dropped from 840 kg to 725 kg, a 13.7% reduction.

Author Contributions

Authors: A.M.J.: original draft, software, methodology, and validation; B.H.J.: supervisor, formal analysis; research resources; investigation; editing; and writing; B.H.J.: validation, H.K. and A.F.; visualization, A.F. and H.K.; project administration, A.F. and H.K.; funding acquisition, H.K. and A.F. All authors have read and agreed to the published version of the manuscript.

Funding

This research was funded by Deputyship for Research & Innovation, Ministry of Education, in Saudi Arabia, project number IF_2020_NBU_451.

Institutional Review Board Statement

Not applicable.

Informed Consent Statement

Not applicable.

Data Availability Statement

Not applicable.

Acknowledgments

The authors extend their appreciation to the Deputyship for Research & Innovation, Ministry of Education, in Saudi Arabia, for funding this research work through project number IF_2020_NBU_451. The authors gratefully thank the Prince Faisal bin Khalid bin Sultan Research Chair in Renewable Energy Studies and Applications (PFCRE) at Northern Border University for their support and assistance.

Conflicts of Interest

The authors declare no conflict of interest.

References

  1. Behrangrad, M. A review of demand side management business models in the electricity market. Renew. Sustain. Energy Rev. 2015, 47, 270–283. [Google Scholar] [CrossRef]
  2. Yan, X.; Ozturk, Y.; Hu, Z.; Song, Y. A review on price-driven residential demand response. Renew. Sustain. Rev. 2018, 96, 411–419. [Google Scholar] [CrossRef]
  3. Aghaei, J.; Alizadeh, M.; Abdollahi, A.; Barani, M. Allocation of demand response resources: Towards an effective contribution to power system voltage stability. IET Gener. Transm. Distrib. 2016, 10, 4169–4177. [Google Scholar] [CrossRef]
  4. Aghajani, S.; Kalantar, M. Operational scheduling of electric vehicles parking lot integrated with renewable generation based on bilevel programming approach. Energy 2017, 139, 422–432. [Google Scholar] [CrossRef]
  5. Akbaria, H.; Browne, M.C.; Ortega, A.; Huang, M.J.; Hewitt, N.J.; Norton, B.; McCormack, S.J. Efficient energy storage technologies for photovoltaic systems. Sol. Energy 2019, 192, 144–168. [Google Scholar] [CrossRef]
  6. Aydin, D.; Ozyon, S.; Yasar, C.; Liao, T. Artificial bee colony algorithm with dynamic population size to combined economic and emission dispatch problem. Int. J. Electr. Power Energy Syst. 2014, 54, 144–153. [Google Scholar] [CrossRef]
  7. Rajan, A.; Malakar, T. Optimum economic and emission dispatch using exchange market algorithm. Int. J. Electr. Power Energy Syst. 2016, 82, 545–560. [Google Scholar] [CrossRef]
  8. Nanjundappan, D.; Nanjundappan, D. Hybrid weighted probabilistic neural network and biogeography based optimization for dynamic economic dispatch of integrated multiple-fuel and wind power plants. Int. J. Electr. Power Energy Syst. 2016, 77, 385–394. [Google Scholar] [CrossRef]
  9. Zaman, M.; Elsayed, S.M.; Ray, T.; Sarker, R.A. Evolutionary algorithms for dynamic economic dispatch problems. IEEE Trans. Power Syst. 2016, 31, 1486–1495. [Google Scholar] [CrossRef]
  10. Zaman, F.; Elsayed, S.M.; Ray, T.; Sarker, R.A. Configuring two-algorithm-based evolutionary approach for solving dynamic economic dispatch problems. Eng. Appl. Artif. Intell. 2016, 53, 105–125. [Google Scholar] [CrossRef]
  11. Aghaei, J.; Niknam, T.; Azizipanah-Abarghooee, R.; Arroyo, J.M. Scenario-based dynamic economic emission dispatch considering load and wind power uncertainties. Int. J. Electr. Power Energy Syst. 2013, 47, 351–367. [Google Scholar] [CrossRef]
  12. Duan, J.; Chow, M. Robust Consensus-based Distributed Energy Management for Microgrids with Packet Losses Tolerance. IEEE Transactions Smart Grid 2019, 11, 281–290. [Google Scholar] [CrossRef]
  13. Tajalli, S.; Mardaneh, M.; Taherian-Fard, E.; Izadian, A.; Kavousi-Fard, A.; Dabbaghjamanesh, M.; Niknam, T. DoS-Resilient Distributed Optimal Scheduling in a Fog Supporting IIoT-Based Smart Microgrid. IEEE Trans. Ind. Appl. 2020, 56, 2968–2977. [Google Scholar] [CrossRef]
  14. Bilal, N.; Jasim, B.H.; Sedhom, B.E.; Guerrero, J.M. Consensus Algorithm-based Coalition Game Theory for Demand Management Scheme in Smart Microgrid. Sustain. Cities Soc. 2021, 74, 103248. [Google Scholar] [CrossRef]
  15. Pirouzi, S.; Zaghian, M.; Aghaei, J.; Chabok, H.; Abbasi, M.; Norouzi, M.; Shafie-Khah, M.; Catalão, J.P. Hybrid planning of distributed generation and distribution automation to improve reliability and operation indices. Electr. Power Energy Syst. 2022, 135, 107540. [Google Scholar] [CrossRef]
  16. Asl, S.A.F.; Bagherzadeh, L.; Pirouzi, S.; Norouzi, M.; Lehtonen, M. A new two-layer model for energy management in the smart distribution network containing flexi-renewable virtual power plant. Electr. Power Syst. Res. 2021, 194, 107085. [Google Scholar] [CrossRef]
  17. Logenthiran, T.; Srinivasan, D.; Shun, T.Z. Demand side management in smart grid using heuristic optimization. IEEE Trans. Smart Grid 2012, 3, 1244–1252. [Google Scholar] [CrossRef]
  18. Nadeem, J.; Ullah, I.; Akbar, M.; Iqbal, Z.; Khan, F.A.; Alrajeh, N.; Alabed, M.S. An Intelligent Load Management System With Renewable Energy Integration for Smart Homes. IEEE Access 2017, 5, 13587–13600. [Google Scholar] [CrossRef]
  19. Banala, V.; Sankaramurthy, P.; Chokkalingam, B.; Mihet-Popa, L. Managing the Demand in a Micro Grid Based on Load Shifting with Controllable Devices Using Hybrid WFS2ACSO Technique. Energies 2022, 15, 790. [Google Scholar]
  20. Sharma, A.; Saxena, A. A demand side management control strategy using Whale optimization algorithm. SN Appl. Sci. 2019, 1, 703–714. [Google Scholar] [CrossRef]
  21. Kumar, K.; Saravanan, B. Day ahead scheduling of generation and storage in a micro grid considering demand Side management. J. Energy Storage 2019, 21, 78–86. [Google Scholar] [CrossRef]
  22. Arif, A.; Javed, F.; Arshad, N. Integrating renewables economic dispatch with demand side management in micro-grids: A genetic algorithm-based approach. Energy Effic. 2014, 7, 271–284. [Google Scholar] [CrossRef]
  23. Chung, H.M.; Su, C.L.; Wen, C.K. Dispatch of generation and demand side response in regional grids. In Proceedings of the 2015 IEEE 15th International Conference on Environment and Electrical Engineering (EEEIC) IEEE, Rome, Italy, 10–13 June 2015; pp. 482–486. [Google Scholar] [CrossRef]
  24. Alham, M.; Elshahed, M.; Ibrahim, D.K.; El Zahab, E.E.D. A dynamic economic emission dispatch considering wind power uncertainty incorporating energy storage system and demand side management. Renew. Energy 2016, 96, 800–811. [Google Scholar] [CrossRef]
  25. Alham, M.; Elshahed, M.; Ibrahim, D.K.; El Zahab, E.E.D. Optimal operation of power system incorporating wind energy with demand side management. Ain Shams Eng. J. 2015, 8, 1–7. [Google Scholar] [CrossRef]
  26. Bilal, N.; Jasim, B.; Rahman, Z.-A.; Siano, P. A Novel Robust Smart Energy Management and Demand Reduction for Smart Homes Based on Internet of Energy. Sensors 2021, 21, 4756. [Google Scholar] [CrossRef]
  27. Shakouri, H.; Kazemi, A. Multi-objective cost-load optimization for demand side management of a residential area in smart grids. Sustain. Cities Soc. 2017, 32, 171–180. [Google Scholar] [CrossRef]
  28. Deyaa, A.; Ebeed, M.; Ali, A.; Alghamdi, A.; Kamel, S. Multi-Objective Energy Management of a Micro-Grid Considering Stochastic Nature of Load and Renewable Energy Resources. Electronics 2021, 10, 403. [Google Scholar] [CrossRef]
  29. Seshu, R.; Raghav, L.P.; Raju, D.K.; Singh, A.R. Impact of multiple demand side management programs on the optimal operation of grid-connected microgrids. Appl. Energy 2021, 301, 117466. [Google Scholar] [CrossRef]
  30. Faria, P.; Soares, J.; Vale, Z.; Morais, H.; Sousa, T. Modified particle swarm optimization applied to integrated demand response and DG resources scheduling. IEEE Trans. Smart Grid 2013, 4, 606–616. [Google Scholar] [CrossRef]
  31. Zakariazadeh, A.; Jadid, S.; Siano, P. Stochastic multi-objective operational planning of smart distribution systems considering demand response programs. Electr. Power Syst. Res. 2014, 111, 156–168. [Google Scholar] [CrossRef]
  32. Zheng, Y.; Li, S.; Tan, R. Distributed model predictive control for onconnected microgrid power management. IEEE Trans. Control. Syst. Technol. 2018, 26, 1028–1039. [Google Scholar] [CrossRef]
  33. Maulik, A.; Das, D. Optimal power dispatch considering load and renewable generation uncertainties in an AC-DC hybrid microgrid. IET Gener. Transm. Distrib. 2019, 13, 1164–1176. [Google Scholar] [CrossRef]
  34. Yng, L.; Fan, X.; Cai, Z.; Bing, Y. Optimal active power dispatching of microgrid and DistributionNetwork based on model predictive control. Tsinghua Sci. Technol. 2018, 23, 266–276. [Google Scholar] [CrossRef]
  35. Atwa, Y.; El-Saadany, E.F.; Salama, M.M.A.; Seethapathy, R. Optimal renewable resources mix for distribution system energy loss minimization.,IEEE Transactions on. Power Syst. 2010, 25, 360–370. [Google Scholar] [CrossRef]
  36. Ettoumi, F.Y.; Mefti, A.; Adane, A.; Bouroubi, M. Statistical analysis of solar measurements in Algeria using beta distributions. Renew Energy 2002, 26, 47–67. [Google Scholar] [CrossRef]
  37. Deshmukh, M.; Deshmukh, S. Modeling of hybrid renewable energy systems. Renew. Sustain. Energy Rev. 2008, 12, 235–249. [Google Scholar] [CrossRef]
  38. Athanasios, P.; Pillai, S. Probability, Random Variables and Stochastic Processes, 4th ed.; McGraw-Hill: New York, NY, USA, 2002; p. 852. [Google Scholar]
  39. Rahimi, E.; Rabiee, A.; Aghaei, J.; Muttaqi, K.M.; Nezhad, A.E. On the management of wind power intermittency. Renew. Sustain. Energy Rev. 2013, 28, 643–653. [Google Scholar] [CrossRef]
  40. Gen, B. Reliability and Cost/Worth Evaluation of Generating Systems Utilizing wind and Solar Energy. Ph.D. Thesis, University of Saskatchewan, Saskatoon, SK, Canada, 2005. [Google Scholar]
  41. Owner’s Manual of the AIR403 Wind Turbine Made by Southwest Wind Power Inc. Available online: www.nooutage.com/pdf/swwp_air403_landman.pdf (accessed on 16 May 2022).
  42. Abouzahr, I.; Ramakumar, R. An approach to assess the performance of utilityinteractive wind electric conversion systems. Energy Conversion. IEEE Trans. 1991, 6, 627–638. [Google Scholar]
  43. Tina, G.; Gagliano, S.; Raiti, S. Hybrid solar/wind power system probabilistic modelling for long-term performance assessment. Sol. Energy 2006, 80, 578–588. [Google Scholar] [CrossRef]
  44. Awais, M.; Javaid, N.; Shaheen, N.; Iqbal, Z.; Rehman, G.; Muhammad, K.; Ahmad, I. An Efficient Genetic Algorithm Based Demand Side Management Scheme for Smart Grid. In Proceedings of the 2015 18th International Conference on Network-Based Information Systems, Taipei, Taiwan, 2–4 September 2015. [Google Scholar]
  45. Kothari, D. Modern Power System Analysis; Tata McGraw-Hill: New Delhi, India, 2003. [Google Scholar]
  46. Alessandro, A.; De Pascale, G.; Detti, P.; Vicino, A. Load Sceduling for Household Energy Consumption Optimization. IEEE Trans. Smart Grid 2013, 4, 2364–2373. [Google Scholar]
  47. Shengan, S.; Manisa, P.; Saifur, R. Demand Response as a Load Shaping Tool in an Intelligent Grid With Electric Vehicles. IEEE Trans. Smart Grid 2011, 2, 624–631. [Google Scholar]
  48. Yi, P.; Dong, X.; Iwayemi, A.; Zhou, C.; Li, S. Real-time Oppertunistic Scheduling for Residential Demand Response. IEEE Trans. Smart Grid 2018, 4, 227–234. [Google Scholar] [CrossRef]
  49. Mohammad, D.; Montazeri, Z.; Malik, O.P.; Dhiman, G.; Kumar, V. BOSA: Binary Orientation Search Algorithm. Int. J. Innov. Technol. Explor. Eng. (IJITEE) 2019, 9, 5306–5310. [Google Scholar]
  50. Amjad, A.; Seifi, A.; Niknam, T.; Pahlavani, M.R.A. Multi-objective operation management of a renewable MG (micro-grid) with back-up micro-turbine/fuel cell/battery hybrid power source. Energy 2011, 36, 6490–6507. [Google Scholar] [CrossRef]
  51. Ali, M.; Basil, H. Grid-Forming and Grid-Following Based Microgrid Inverters Control. Iraqi J. Electr. Electron. Eng. 2022, 18, 111–131. [Google Scholar] [CrossRef]
  52. Kiani, H.; Hesami, K.; Azarhooshang, A.; Pirouzi, S.; Safaee, S. Adaptive robust operation of the active distribution network including renewable and flexible sources. Sustain. Energy Grids Netw. 2021, 26, 100476. [Google Scholar] [CrossRef]
  53. Aghaei, J.; Bozorgavari, S.A.; Pirouzi, S.; Farahmand, H.; Korpås, M. Flexibility Planning of Distributed Battery Energy Storage Systems in Smart Distribution Networks. Iran. J. Sci. Technol. Trans. Electr. Eng. 2019, 44, 1105–1121. [Google Scholar] [CrossRef]
  54. Bilal, N.; Jasim, B.H.; Sedhom, B.E. Distributed secondary consensus fault tolerant control method for voltage and frequency restoration and power sharing control in multi-agent microgrid. Int. J. Electr. Power Energy Syst. 2021, 133, 107251. [Google Scholar]
  55. Mahmoudi, C.; Flah, A.; Sbita, L. An Overview of Electric Vehicle Concept and Power Management Strategies. In Proceedings of the International Conference on Electrical Sciences and Technologies in Maghreb (CISTEM), Tunis, Tunisia, 3–6 November 2014. [Google Scholar] [CrossRef]
  56. Mahmoudi, C.; Flah, A. A Novel Energy Optimization Approach for Electrical Vehicles in a Smart City. Energies 2019, 12, 929. [Google Scholar] [CrossRef]
  57. Mohamed, A.; Awwad, E.M.; El-Sherbeeny, A.M.; Nasr, E.A.; Ali, Z.M. Optimal scheduling of reconfigurable grids considering dynamic line rating constraint. IET Gener. Transm. Distrib. 2020, 14, 1862–1871. [Google Scholar] [CrossRef]
  58. Mohamed, A. A relaxed consensus plus innovation based effective negotiation approach for energy cooperation between smart grid and microgrid. Energy 2022, 252, 123996. [Google Scholar] [CrossRef]
  59. Mohamed, A.; Almalaq, A.; Abdullah, H.M.; Alnowibet, K.A.; Alrasheedi, A.F.; Zaindin, M.S.A. A distributed stochastic energy management framework based-fuzzy-PDMM for smart grids considering wind park and energy storage systems. IEEE Access 2021, 9, 46674–46685. [Google Scholar] [CrossRef]
  60. Bilal, N.; Jasim, B.H.; Issa, W.; Anvari-Moghaddam, A.; Blaabjerg, F. A New Robust Control Strategy for Parallel Operated Inverters in Green Energy Applications. Energies 2020, 13, 3480. [Google Scholar] [CrossRef]
  61. Alhasnawi, B.; Jasim, B.; Siano, P.; Guerrero, J. A Novel Real-Time Electricity Scheduling for Home Energy Management System Using the Internet of Energy. Energies 2021, 14, 3191. [Google Scholar] [CrossRef]
  62. Sonam, P.; Swarnkar, A.; Niazi, K.R.; Gupta, N. Multiobjective optimal sizing of battery energy storage in grid-connected microgrid. J. Eng. 2019, 18, 5280–5283. [Google Scholar] [CrossRef]
  63. Coello, C.A.; Lechuga, M.S. MOPSO: A proposal for multiple objective particle swarm optimization. In Proceedings of the 2002 Congress on Evolutionary Computation. CEC’02, Honolulu, HI, USA, 12–17 May 2002. [Google Scholar]
  64. Kraiem, H.; Flah, A.; Mohamed, N.; Alowaidi, M.; Bajaj, M.; Mishra, S.; Sharma, M.K.; Sharma, S.K. Increasing Electric Vehicle Autonomy Using a Photovoltaic System Controlled by Particle Swarm Optimization. IEEE Access 2021, 9, 72040–72054. [Google Scholar] [CrossRef]
  65. The Solar Power Group Company. Available online: https://thesolarpowergroup.com.au (accessed on 8 April 2022).
  66. Chen, C.; Duan, S.; Cai, T.; Liu, B.; Hu, G. Smart energy management system for optimal microgrid economic operation. IET Renew. Power Gener. 2011, 5, 258–267. [Google Scholar] [CrossRef]
  67. Clement-Nyns, K.; Haesen, E.; Driesen, J. The impact of charging plug-in hybrid electric vehicles on a residential distribution grid. IEEE Trans. Power Syst. 2010, 25, 371–380. [Google Scholar] [CrossRef]
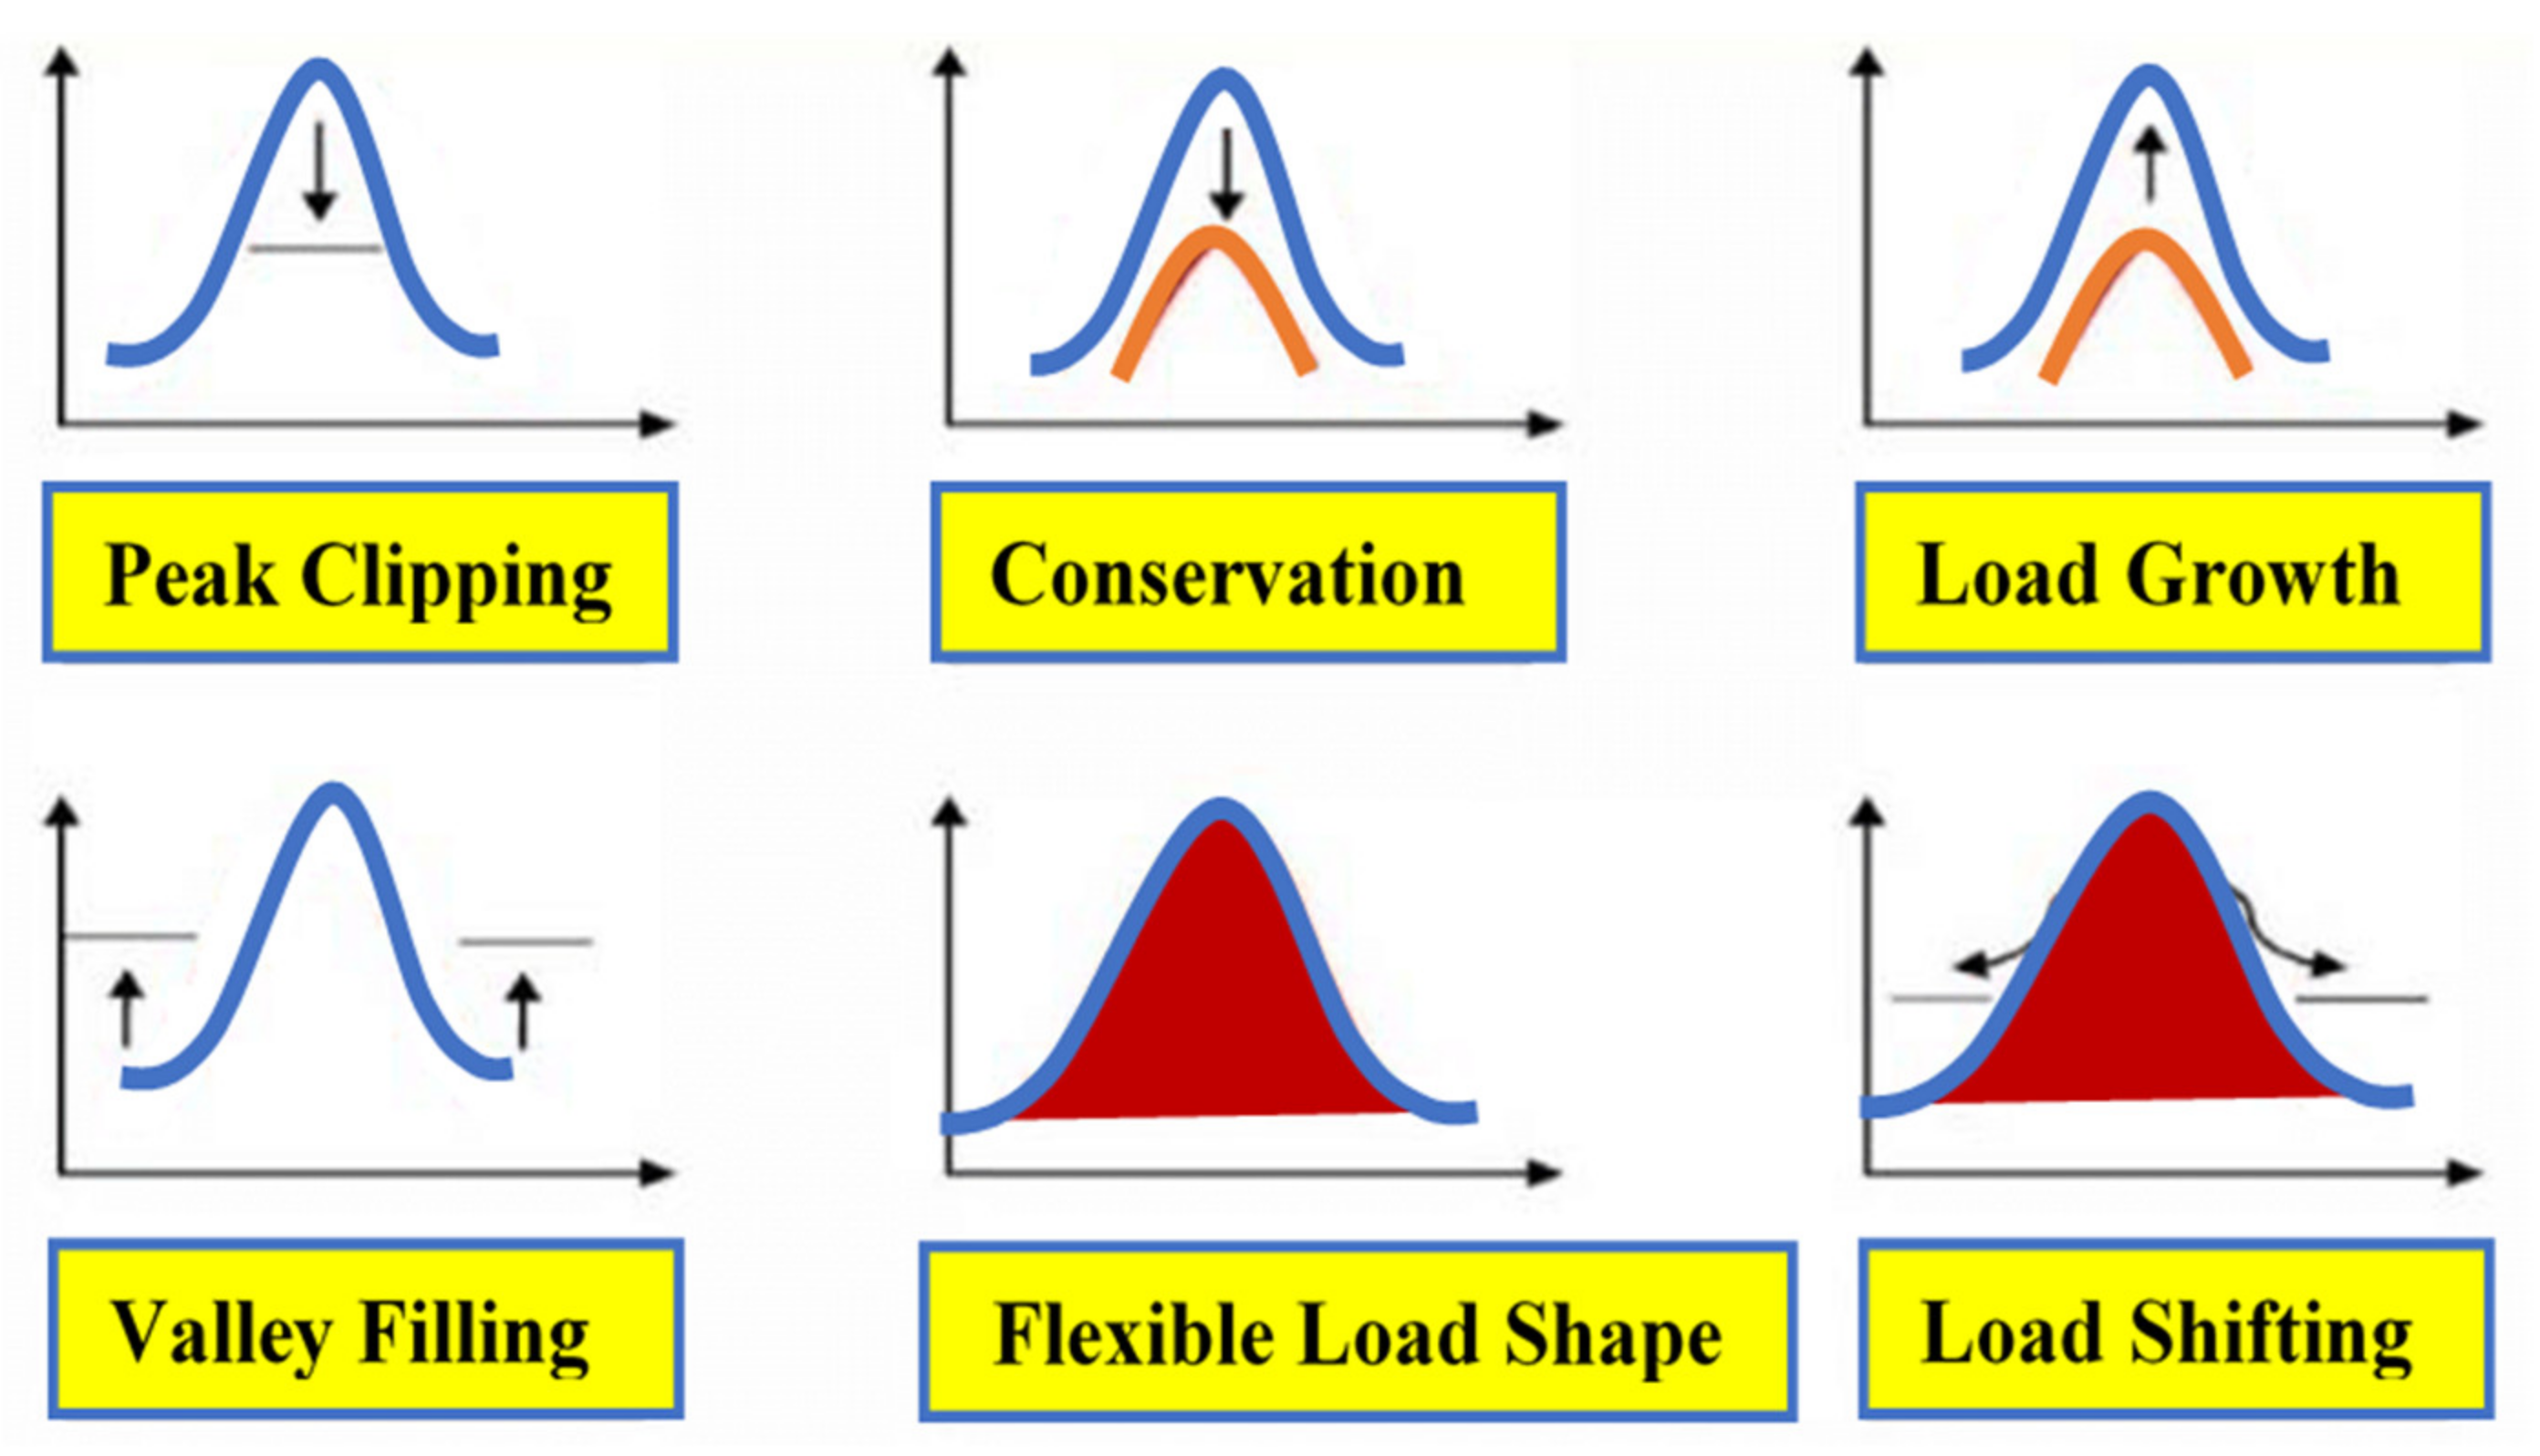
Figure 1. DSM techniques.
Sustainability 14 10158 g001
Figure 2. The flowchart of optimal DSM strategy.
Sustainability 14 10158 g002
Figure 3. Proposed multi-objective optimization model configuration.
Sustainability 14 10158 g003
Figure 4. The proposed SMG schematic configuration.
Sustainability 14 10158 g004
Figure 5. Power dispatch algorithm.
Sustainability 14 10158 g005
Figure 6. Hourly adopted (a) wind speed and (b) solar irradiance.
Sustainability 14 10158 g006
Figure 7. The daily schedule and unscheduled load demand curve.
Sustainability 14 10158 g007
Figure 8. The schedule and non-schedule PAR.
Sustainability 14 10158 g008
Figure 9. The adopted real-time dynamic price.
Sustainability 14 10158 g009
Figure 10. The optimal power allocation of the generation units in Case #1.
Sustainability 14 10158 g010
Figure 11. The optimal power allocation of the generation units in Case #2.
Sustainability 14 10158 g011
Figure 12. (a) PV and (b) WT power generation using DSM (Case #2).
Sustainability 14 10158 g012
Figure 13. Supply–demand balance of Cases #1 and #2 (a) without DSM and (b) with DSM.
Sustainability 14 10158 g013
Figure 14. Convergence characteristic of the proposed algorithm (a) without DSM and (b) with DSM.
Sustainability 14 10158 g014
Figure 15. The optimal power distribution of the generating units in Case #3.
Sustainability 14 10158 g015
Figure 16. The optimal power distribution of the generating units in Case #4.
Sustainability 14 10158 g016
Figure 17. Power generation adopting DSM (a) PV and (b) WT (Case #4).
Sustainability 14 10158 g017
Figure 18. Generation–demand balance of Cases #3 and #4 (a) without using DSM and (b) with DSM.
Sustainability 14 10158 g018
Figure 19. Convergence characteristic of the proposed algorithm (a) without DSM and (b) with DSM.
Sustainability 14 10158 g019
Figure 20. The optimal power distribution of the generating units in Case #5.
Sustainability 14 10158 g020
Figure 21. The optimal power distribution of the generating units in Case #6.
Sustainability 14 10158 g021
Figure 22. (a) Solar PV and (b) WT power generation adopting DSM (Case #6).
Sustainability 14 10158 g022
Figure 23. Supply–demand balance of Cases #5 and #6 (a) without using DSM and (b) with DSM.
Sustainability 14 10158 g023
Figure 24. Convergence characteristic of the proposed algorithm (a) without DSM and (b) with DSM.
Sustainability 14 10158 g024
Table 1. Summary of previous research studies.
Ref.Resolved Problem(s)Limitations
[9,10,11,12,13,14,15,16]DEEDDemand-side scheduling was not optimized, and optimal multi-objective energy management was not applied.
[18,19,20,21]DSMDEED and multi-objective energy management were not applied.
[22,23,24,25,26,27,28,29,30,31,32,33,34]DSM and DEEDIn [24,25], the optimal DSM is not used.
In [26,32,34], multi-objective optimization functions are not employed.
The authors of [22,23,27,28,29,31,33] proposed multi-objective optimization with DR only, and load appliances scheduling based on intelligent DSM with a load-shifting program was not implemented.
Table 2. Bids and DG source emissions coefficients.
Unit TypeBid
USD/kWh)
SU/SD
(USD)
CO2
(kg/MWh)
SO2
(kg/MWh)
NOx
(kg/MWh)
Pmin
(kW)
Pmax
(kW)
DG0.5860.158900.00450.2330300
MT0.4570.967500.00360.1630
FC0.2941.654600.0030.0075330
PV0.70000025
WT0.650000015
ESS0.380100.00020.001−3030
Table 3. Numerous appliances and their attributes.
Appliance NumberAppliance TypeOperating TimeIL Rated Power (kW)CL Rated Power (kW)RL Rated Power (kW)
1Nonshiftable12 AM–12 PM 442
2Shiftable7–9 AM, 11 AM–14 PM & 18 PM–22 PM0.60.60.3
3Shiftable7 AM–12 PM, 15 PM–20 PM 0.40.40.2
4Shiftable1 AM–10 AM, 15 PM–24 PM4.84.82.4
5Shiftable7 AM–9 AM, 11 AM–14 PM, 18 PM–22 PM0.60.60.3
6Shiftable8 AM–18 PM0.40.40.2
7Shiftable10 AM–15 PM, 18 PM–22 PM0.40.40.3
8Nonshiftable12 AM–12 PM221
9Nonshiftable12 AM–12 PM1.61.60.8
Table 4. The elapsed time of the proposed optimization algorithms.
Operational Condition of MGCase No.BOSA
(Elapsed Time)
MOPSO
(Elapsed Time)
BOSA + MOPSO
(Elapsed Time)
Optimal DEED without DSM#1-43.99 s43.99 s
#3-36.92 s36.92 s
#5-63.41 s63.41 s
Optimal DEED with DSM#23.77 s44.29 s49.06 s
#43.59 s37.26 s40.97 s
#63.7 s63.72 s67.85 s
Publisher’s Note: MDPI stays neutral with regard to jurisdictional claims in published maps and institutional affiliations.