Article

“I Am Here to Fly, but Better Get the Environment Right!” Passenger Response to Airport Servicescape

by
Collins Opoku Antwi
1,
Jun Ren
1,
Wenyu Zhang
1,2,*,
Wilberforce Owusu-Ansah
3,
Michael Osei Aboagye
4,
Emmanuel Affum-Osei
3 and
Richard Adu Agyapong
5
1
Department of Psychology, Zhejiang Normal University, Jinhua 321004, China
2
School of Business, Xingzhi College, Zhejiang Normal University, Jinhua 321004, China
3
School of Business, Kwame Nkrumah University of Science and Technology (KNUST), Kumasi AK-039, Ghana
4
Department of Interdisciplinary Studies (DIS), Appiah-Minka University of Skills Training and Entrepreneurial Development, Kumasi AK-039, Ghana
5
School of Business, University of Cape Coast (UCC), Cape Coast CC-191, Ghana
*
Author to whom correspondence should be addressed.
Sustainability 2022, 14(16), 10114; https://doi.org/10.3390/su141610114
Submission received: 2 June 2022 / Revised: 1 August 2022 / Accepted: 7 August 2022 / Published: 15 August 2022
(This article belongs to the Special Issue Aviation Management and Air Transport Industry II)

Abstract

:
This study deploys environmental and positive psychology models to develop and test the influence of substantive and communicative staging of airport servicescape (i.e., SSoS and CSoS) on passengers’ emotional and subsequent behavioral responses. Furthermore, we examined the extent to which the strength of these associations is contingent upon passengers’ travel frequency (passengers’ familiarity with airport facilities and processes). The study’s sample (n = 387) was drawn from passengers departing from Shanghai Hongqiao International Airport (SHA). The results indicate that airport servicescape robustly engenders passengers’ positive emotion and satisfaction (with SSoS having more potent effects), facilitating intentions to repurchase, recommend, pay more, and partly, spend more. The interaction effects demonstrate that while pleasant CSoS induces higher satisfaction in frequent flyers, pleasing SSoS generates higher satisfaction in infrequent flyers. In addition, positive emotion appears more vital in predicting infrequent passengers’ behavioral intentions to repeat purchase, recommend, and pay more. Passenger satisfaction seems relevant for different passengers regarding their familiarity levels depending on the kind of behavioral response under consideration. Thus, satisfied frequent travelers are more inclined to repeat purchase and pay more; however, satisfied infrequent travelers are more likely to recommend and spend more at airport terminals. The summary, interpretation, and implication of the results conclude the study.

1. Introduction

The global economy is increasingly service-oriented. Service environment is seen as a source of sustainable differentiation strategy [1,2,3,4]. This stream of research traces its roots and most of its theoretical groundings to environmental psychology, mainly the works of Mehrabian and Russell [5,6]. Informed by these works, Bitner [7] propounded the servicescape (described as “the manmade, physical surroundings as opposed to the natural or social environment”). Following this, enormous inquiries into the relations between the substantively staged physical service environment and relevant marketing goals have been explored. Nonetheless, Bitner’s [7] servicescape definition limits what elements in a service environment constitute its servicescape: only the manmade physical surroundings!
To conceptualize a comprehensive servicescape that expands its relational benefits in a postmodern experience economy [8,9], Arnould et al. [9] defined servicescape as “more or less consciously designed places, calculated to produce commercially significant actions”. With this, an increasing number of studies have rigorously explored the effects of both substantive staging (SS, i.e., the physical creation of contrived environments) and communicative staging (CS, i.e., the ways in which the environment is presented and interpreted) of servicescape [9] on firms’ competitiveness [3,9,10,11]. Yet, Bitner’s [7] concern for the scant scientific research on a servicescape as a competitive resource and its impact on consumers—in marketing in particular—is still legitimate today. As Dedeoglu et al. [11] and J.Y. Park et al. [10] consistently noted, inquiries into the combined effects of the substantive and communicative staging of servicescape (SSoS and CSoS) on consumer responses are even fewer. Moreover, elements of a servicescape appear contingent, on the whole, upon the nature of the service industry [7,9]. Given the rapid evolution of the airport service setting, a comprehensive evaluation will provide invaluable information on service offerings that pleasure the customer (in this case, the traveler) to support the recent airport commercialization agenda.
Nonetheless, an investigation into the airport service environment—typically a substantively staged servicescape and a non-traditional one—has been paltry [12,13,14,15]. Furthermore, extant studies have limited their scope of inquiries to SSoS [14] despite evidence suggesting that CSoS dominates the influence of SSoS on consumers [16]. Staff ineffectiveness, poor facilities, and information flow at airports are some of the triggers of passenger dissatisfaction [15,17]. The current study contributes to the airport servicescape literature by assessing the blended influence of airport CSoS and SSoS on passengers’ emotional and behavioral responses. This research is timely considering that passengers spend a considerable amount of time at airports post-9/11 for safety reasons, and the time for arriving at airports to go through check-in and take-off has only lengthened during COVID-19 [18], affecting efficiency [19] and passenger demand [20,21,22]. The passenger, therefore, spends ample time interacting with both the physical and human elements along all service touchpoints. To ensure a memorable experience, insight into the intricate workings of SSoS and CSoS and passenger response relations is urgent.
Additionally, we employed travel frequency (defined here as the number of times a person travels by air, in which case an airport is used) as a moderating variable. We believe travel frequency, serving as an indicator of passenger purchase history or prior experience, will moderate these relations as frequency begets familiarity. The frequency of encounters has been used as a proxy for familiarity [23]. Consumer familiarity (defined as “the number of purchase-related experiences that have been accumulated by the consumer” [24] (p. 411), has been discovered to relate negatively with positive affect [10]. This discovery is—on the one hand—consistent with the suggestion by Bitner [7] and Arnould et al. [9] that complexity, which stems from low familiarity, heightens emotional response. Frequent exposure to the same or similar stimuli tones down complexity, diminishes uncertainty and novelty, and eliminates conflict via familiarity [25]. On the other hand, this view of familiarity contradicts Söderlund’s [23] findings of a positive relation between familiarity and post-purchase responses. Interestingly, the explanation offered to support the two contradictory views has been the same: that familiarity creates an elaborate cognitive structure [24,26] for post-consumption evaluation and behavior [23]. We explore these views on pre-purchase familiarity and post-purchase responses further at the airport setting by examining the moderation mechanism of traveler prior experience (i.e., familiarity measured with travel frequency) in the direct relations.
In sum, the express objectives of this study were to first assess the effect of airport servicescapes (i.e., SSoS and CSoS) on passengers’ internal reactions (i.e., positive emotion and satisfaction). Second, we examined the influence of passengers’ internal reactions on their external responses (i.e., behavioral loyalty intentions to repeat purchase, recommend, pay more, and spend more). Third, we explored the moderating effects of passengers’ travel frequency in these relations. By achieving these objectives, our study makes three key contributions to the extant literature. First, we demonstrate the utility of separating substantive and communicative servicescape at the airport terminal, thereby strengthening the theoretical meaningfulness of such separation in service research. Second, we reveal the utility of positive emotions in travelers’ behavioral responses to the airport servicescape. Last, we show how sensitive passengers’ emotional and behavioral responses to the airport servicescape are to travel frequency (i.e., airport purchase history or familiarity with airport). The Stimuli–Organism–Response (SOR) framework of Mehrabian and Russell [6]—demonstrated to be highly productive in service research [27,28]—serves as the theoretical foundation for these assessments. We complement this framework with the broaden-and-build theory of positive emotions [29,30]. The rest of the paper is organized as follows: Section 2 reviews the relevant literature, Section 3 details the theoretical framework and develops the research hypotheses, Section 4 reports the methods employed, Section 5 presents the results, and Section 6 captures the results summary, outlines the theoretical and practical implications, delineates the limitations, and recommends areas worth further exploration.

2. Literature Review

2.1. Airport Servicescape

The context of service delivery in the postmodernist era of experience consumption has become a powerful resource. This resource is forged as a strategic tool for the attainment of organizational goals. This development has been ascribed to the notion that service consumers, for the most part, are co-creators of service experience or value. The value co-creation perspective is powerfully driven home with the assertion that “…the consumer is in the factory” [7] (p. 57), where production and consumption are inseparable. Bitner [7] then put forward the concept of a “servicescape” to represent the physical service setting. Others have expanded this idea of a servicescape to include the social environment [31,32]. Customers are said to holistically respond to the elements of the service setting [8]. Therefore, premised on the extant conceptualization of a servicescape [7,9], we present the airport servicescape as a composite of the substantive and communicative staging of the airport service environment.

2.1.1. The Substantive Staging of the Airport Servicescape (SSoS)

The physical setting of service delivery has been found to directly influence consumers’ affective states, which mold their behavioral responses across service industries in the consumer and organizational behavior, retailing, and marketing literature [11,13,32]. Given the presence of immateriality and its attendant absence of ownership and possession—typical of most experiential products including educational, legal, administrative, travel, and tourism services—substantive staging (SS) builds beliefs, facilitates understanding, and impacts the subsequent evaluation of service firms [33]. A pleasant physical service environment, therefore, has been demonstrated to be evocative of consumers’ high service quality inferences, positive image, desirable emotions, and satisfying and even delightful and exciting sensations among consumers, effectuating loyalty intentions, and favorable purchasing and stay behaviors [11,34]. Retail stores, hotels, restaurants, and resorts, in particular, have benefitted immensely from these research outputs. However, due to service industries’ diverse nature, physical elements or clues that compose service settings are not uniform across service industries. Based on this rich service diversity, the disunity in measurement scales, as witnessed by Jeon and Kim [35], is not surprising, or perhaps, even expected. The assessment of the servicescape of these diverse service industries is necessary for sustainable development [36].
The operationalization of the SS has been fashioned substantially in earlier works on consumer–physical service environment interaction, particularly the seminal paper of Bitner [7]. The author’s conceptual work on servicescape generally outlines the components of the physical service settings and the elements subsumed in them. The three-componential framework consisted of the following: ambient conditions (i.e., sensory elements in the service environment including temperature, color, lighting, sound, smell); spatial layout and functionality (i.e., spatial arrangement of items, their relationships, and their ease of use where service delivery is either facilitated or hindered); and signs, symbols, and artifacts (i.e., features of the service setting devised to produce cues about service providers and service facilities to the consumer). Later attempts led to the development of some industry-specific variants, such as Dinescape (consists of ambient conditions, space or facilities, and signs, symbols, and artifacts) [37] and Festivalscape (consists of facility aesthetics, lighting, ambiance, layout, table setting, and service staff) [38]. These variants evolved to reflect the unique features of particular service industry settings.
Cognizant of the absence of research on the strategic instrumentality of the substantively staged airport service environment, Moon et al. [39], with insights from Wu and Weber [40] and Wakefield and Blodgett’s [41] studies, developed the components of airports’ physical service setting. These consisted of layout accessibility (i.e., arrangement of furnishings, equipment, service areas, and passageways [7]), facility ambiance and aesthetics (i.e., the interior and architectural designs that enhance the attractiveness of the physical environment [42]), functionality (i.e., the ability of arranged machinery, equipment, and furnishings to facilitate the accomplishment of goals [7]), and cleanliness (i.e., the sense of neatness, tidiness, or orderliness in an establishment [43]). Ali et al. [12] reasoned that Moon’s [39] conception of airports’ physical environment was limiting. The authors pointed out that Moon et al. [39] did not capture such critical elements as signage, baggage trolleys, retail and dining options, crowding, internet and Wi-Fi connectivity, power sockets, and elevators. Given this limitation, Ali et al. [12] sought to improve Moon et al.’s [39] original four-component operationalization by adding attributes that have been omitted. Thus, Ali et al. [12] included signage and electronic equipment in layout accessibility and functionality, respectively.
Because passengers require different facilities at different stages of travel [44], Park and Park [13] proposed amusement, functionality, cleanliness, convenience, attractiveness, and pleasantness to evaluate airport transfer servicescape. In Wiredja’s [45] passenger-centered model, the substantively staged airport servicescape consists of two main components: main facilities (i.e., service attributes such as Wi-Fi and chargers, trolley, signage or wayfinding, inter-terminal connection, information query, user-friendly restrooms, aerobridge, and a waiting area before boarding), and value addition (i.e., service attributes such as airport access, retail space, and other facilities such as ATMs). Essentially, elements of Wiredja’s [45] classification of the airport’s physical service environment encompass the four components developed by Moon et al. [39] and the improvements by Ali et al. [12].

2.1.2. The Communicative Staging of the Airport Servicescape (CSoS)

Earlier studies on servicescape development paid brief or no attention to social elements. The SS, as a result, has cardinally been the focus of research in marketing science. Academics are slowly—but increasingly—realizing the relevance of CS as a component of service settings [9,31,32]. Considering that CS deals with the presentation and interpretation of SS, meaning-making is at the heart of CS for service delivery. To construct meaning invariably requires an active participatory engagement between service providers and customers. Arnould et al. [9], for example, examined a wilderness servicescape, cardinally a natural environment. The authors established some markedly distinct qualities of this servicescape from those in prior studies, including that site preservation supersedes customers’ desires; the site forms the foreground and not the background; managers exercise little control over the site’s substantive staging. A crucial discovery was that the quality of communicative staging—presentation and interpretation of the site—enhances the experiential value of a wilderness servicescape, and that this communication is well-planned and synchronizes with the actual maneuvering through the physical servicescape.
The CS and SS of a servicescape work in synergy to influence customer experience. Inquiries into this synergy, as expected, are tilted towards traditional service industries, such as hotels and restaurants. There is, therefore, the need to extend these inquiries to not-so-traditional service settings. In this regard, evaluating the joint contribution of SS and CS at the airport service setting would be a useful way forward. Other customers’ influence informs the need for customer homogeneity (similarity in appearance and behavior) [32]. The satisfaction of being in one’s comfort zone induces loyal behaviors. Some of these behaviors, such as word of mouth (WoM), reinforce customer homogeneity. Advertising and service personnel training are targeted at this end accordingly. However, the pan-cultural character of consumers of international airports disincentivizes the utility of this kind of segmenting measure. Instead, the employees’ pleasing appearance, effective, helpful, and courteous behaviors, and the staging of local culture that evoke customers’ loyalty behaviors are within airport management’s control.
In this study, CS focuses on social interaction between the passengers and airport staff and the cultural elements that articulate the local or national identity. On interpersonal aspects, research shows that social encounters are important to experiential consumption [46,47]. The recent deployment of language help staff who speak the native language of core passenger segments at hub airports is a classic case of communicative staging. Language support is vital because customers’ emotional fulfillment lie—to a great extent—with non-financial burdens embedded in service delivery [48]. At airports, passengers’ emotional disquiet may arise from unpleasant sounds, high or cold temperatures, congestion, and rude and ineffective staff. More so, the existence of faithful patrons of first-class and business tickets and lounges at airports, who experience the best of airport staff, is emblematic of emotional supremacy in service evaluation. Consequently, airport staff courtesy, helpfulness, and efficiency greatly influence service evaluation and emotional and behavioral responses [49]. These indicators capture Wiredja’s [45] helpfulness and communication dimension of Airport Indicators of Passenger Experience (AIPEX).
Cultural elements exert a significant effect on memorable service experiences and constitute a fundamental component of the CS of a servicescape. For example, traditional dresses worn by airport staff and the decoration of airport terminals with cultural motifs present the national identity of the host country [12,50]. Culture is an essential pull factor that draws traffic to a destination. Some tourists cite the desire to experience a new culture as their travel motivation [51]. Therefore, bringing local culture to airport terminals is demonstrated to be critical to passenger satisfaction and a salient generator of intention to visit or revisit the host city or country, leading to airport reuse [44]. These studies justify new investments geared towards the creation of quasi-destination at airports as a commercialization strategy. An assessment of how passengers respond to staff and local culture investments at airports as a form of CS is therefore relevant and timely.

3. Research Framework and Hypotheses Formulation

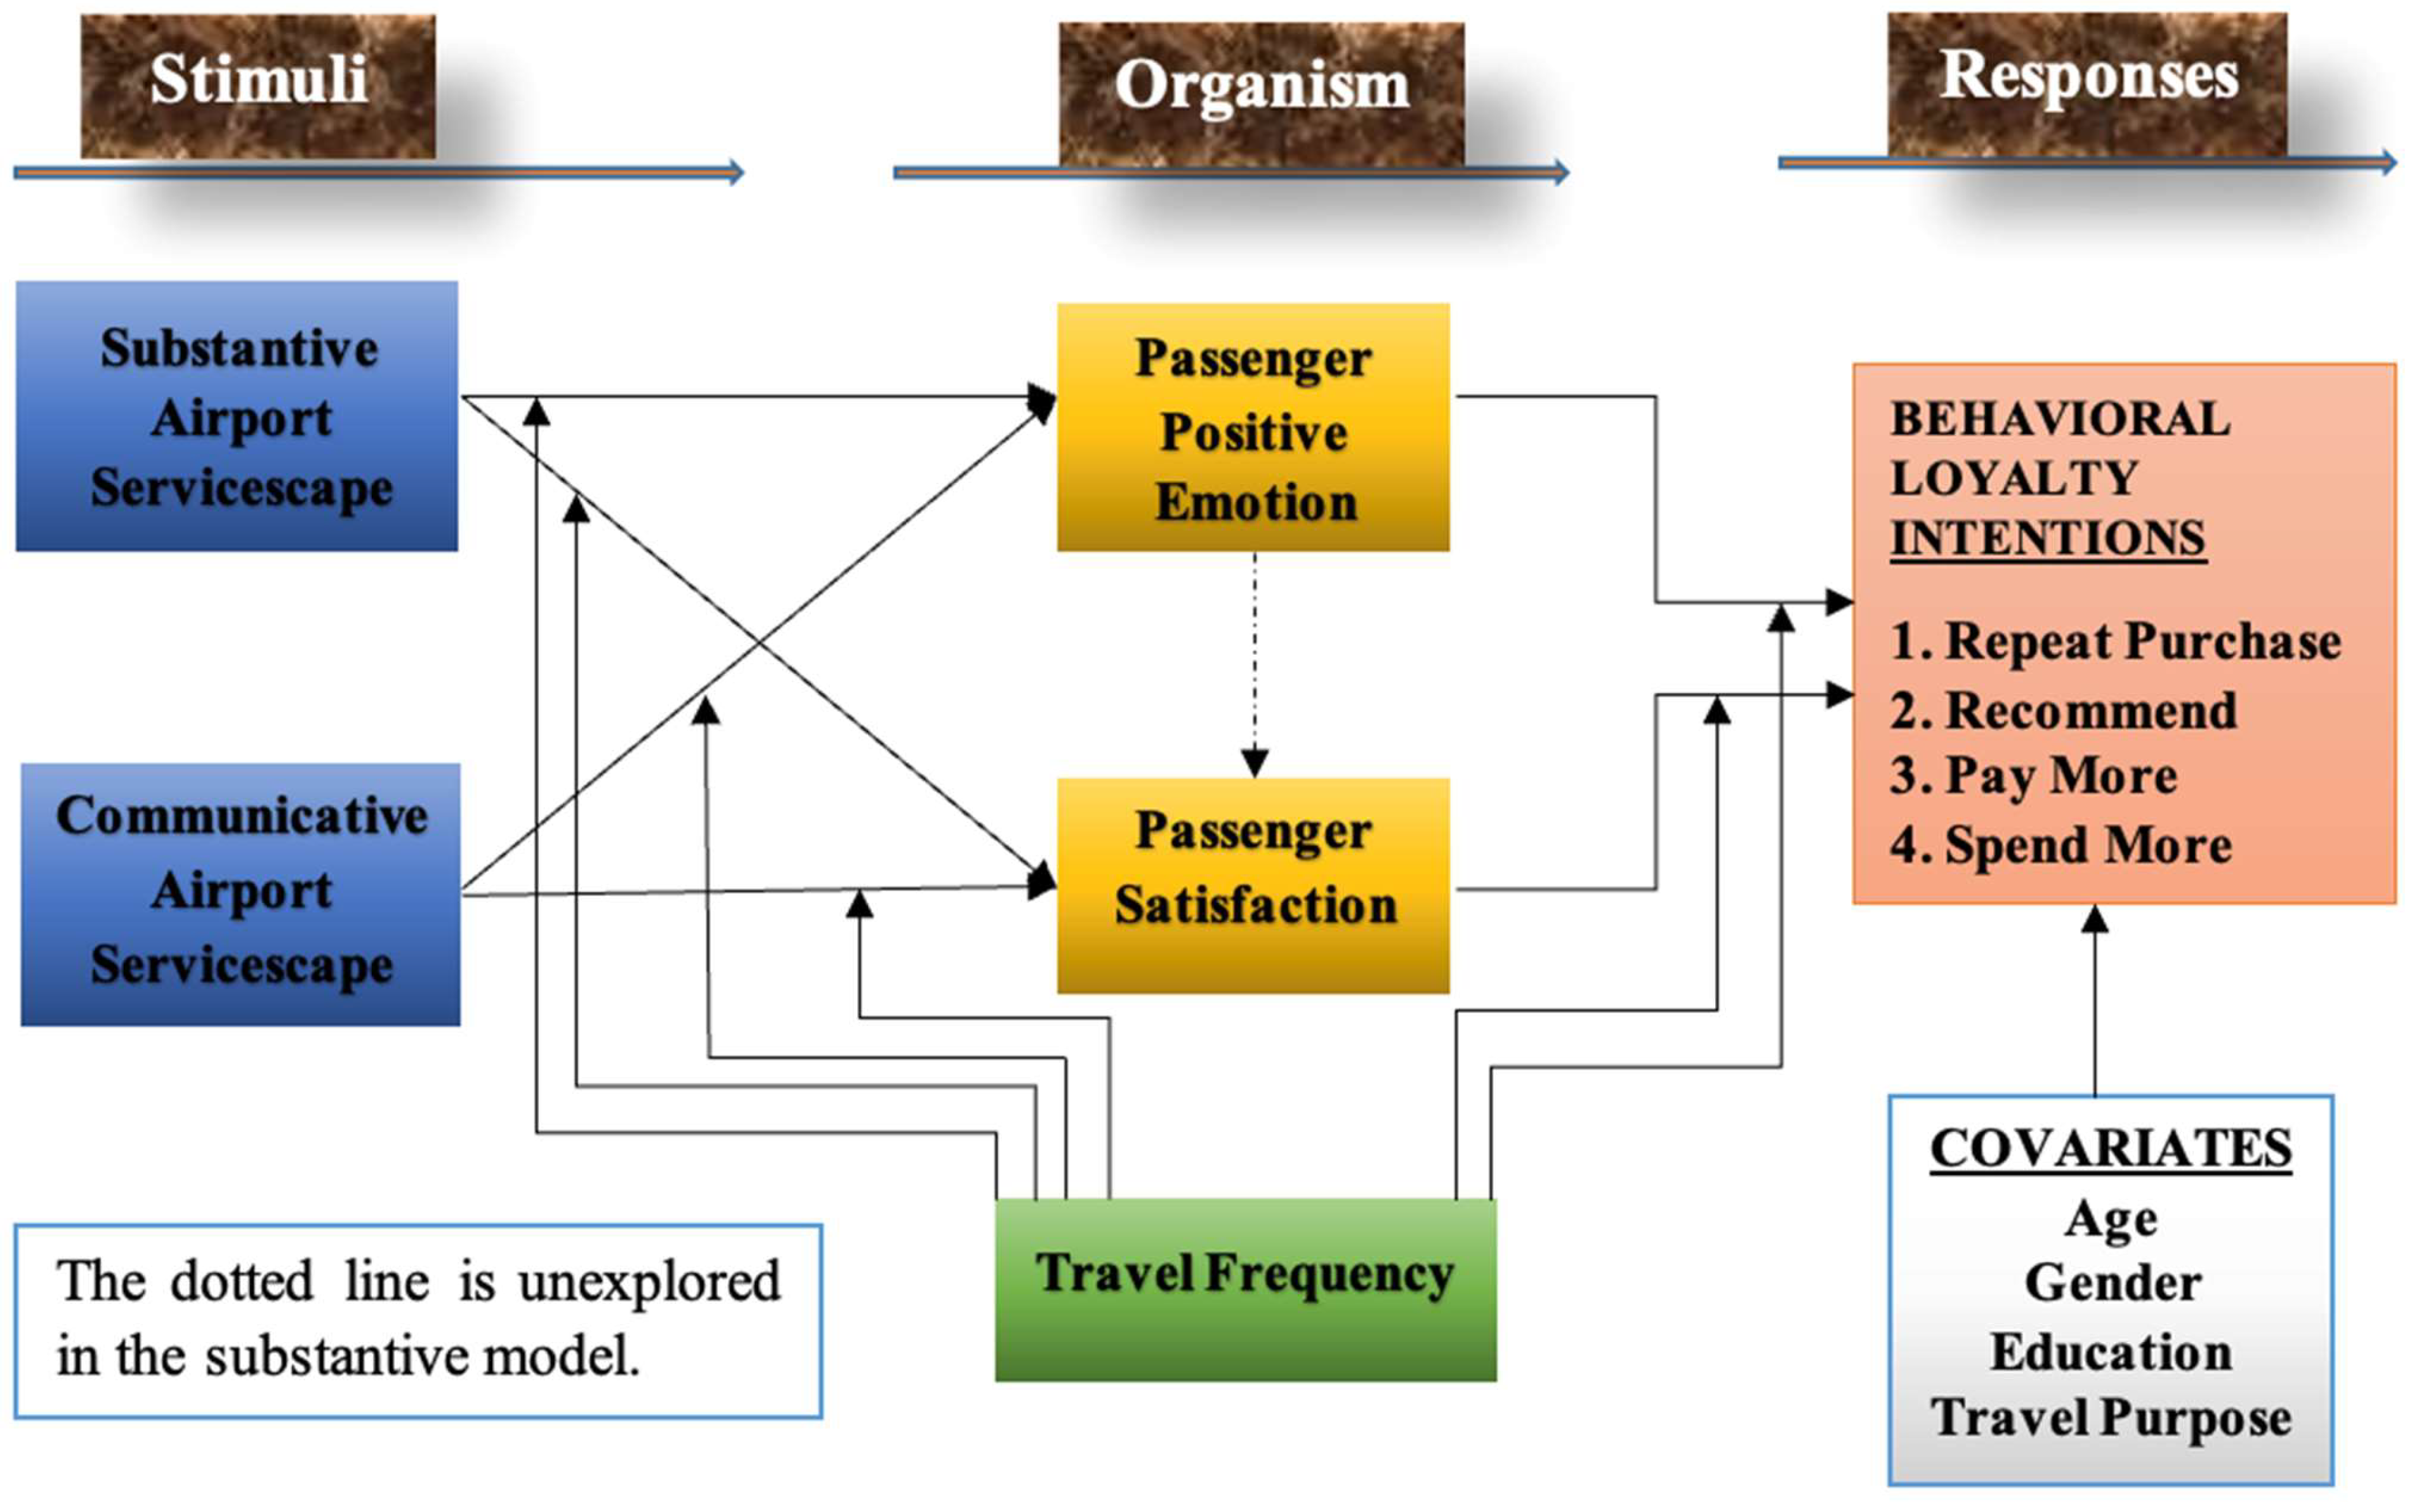
3.1. Theoretical Framework: Stimuli–Organism–Response (SOR)

The central tenet of the SOR framework [5] asserts that environments serve as stimuli (S) which influence organisms (O) and elicit a binary response (R) of approach or avoidance behaviors. Chang [52] reasoned that this framework essentially specifies the relations between marketing variables (e.g., emotion, satisfaction, and loyalty) in response to interactive marketing activities (e.g., employee training and engagement). Eroglu, Machleit, and Davis [53] referred to Stimuli as those environmental elements that condition the individual’s internal states via stimulation. Modeling consumer behavioral responses within the SOR framework in marketing and consumer research, Bagozzi [54] espoused that these stimuli are external to the consumer. Given the productive nature of this framework in explaining intervening mechanisms within the complex environment-behavior modeling across contexts, it has been widely applied in consumer behavior research. In this study, we put forward that airport servicescape (i.e., SSoS and CSoS) act as the stimulus that is external to passengers and engender their affective feelings towards the airport. Bagozzi [54] sees Organism in the framework as the internal processes and structures intervening between stimuli that are external to consumers and their final actions, reactions, or responses emitted. These intervening variables, as he observed, include perceptual, physiological, feeling, and thinking activities. Originally, pleasure, arousal, and dominance (PAD) constituted the affective and cognitive states that transmitted the stimuli’s influences on individuals’ responses. In the current study, passengers’ emotional response to and satisfaction with an airport represent the intervening affect and cognitive states that passengers develop towards the airport as internal responses to the airport servicescape (i.e., the stimulus). Approach or avoidance behaviors become the outcome termed Response. In the present study, we concentrate on passenger approach behaviors towards the airport, and estimate these behaviors with passengers’ behavioral loyalty intentions to repeat purchase, recommend, pay more, and spend more.
In sum, this study—within the ambit of the SOR framework—examined the influence of airport servicescape (SSoS and CsoS) on passengers’ internal responses (i.e., emotional response and satisfaction) and the subsequent effect on their external responses (behavioral loyalty intentions). Additionally, it assessed the moderation effect of passengers’ travel frequency on the relations between the airport servicescape and passengers’ internal responses and between passengers’ internal and external responses (Figure 1).

3.2. Research Hypotheses

3.2.1. The Effects of Airport Servicescape (i.e., SSoS and CSoS) on Passengers’ Positive Emotion and Satisfaction

The affective and evaluative nature of consumption experiences suggests that the influence of firms or destinations’ servicescape on customers’ affect and satisfaction is tenable. Physical elements in a service setting produce consumers’ affective states. Similarly, the affect-eliciting effects of the social aspects of the service environment have been demonstrated empirically. Specifically, service environments’ physical and social elements serve customers’ affective response formation in traditional service settings, such as hotels and restaurants [10,11]. Dedeoglu et al. [11] found that both SS and CS possess emotional value for hotel guests in Turkey. It is noteworthy that CS held a greater value for guests than SS. A similar finding was observed among hotel guests in Spain [11] but, this time, SS revealed a more substantial effect on guests’ positive affect than CS. However, only the effect of SS on airport passengers’ emotional response has been assessed [12,13,39]. The absence of a social component in the analyses of an airport servicescape’s effect on travelers’ emotions is limiting and needs to be addressed. Though the lighting, smell, and temperature in the airport service environment, for example, can evoke strong feelings of disgust, disappointment, or delight, it is also true that the airport staff can alleviate travelers’ stress with helpfulness and communication. The cultural presence, in addition, may elicit positive emotions (seen as the positive feelings that unfold over a relatively short time span [29]) in the traveler. With these considerations, we make the argument that both SSoS and CSoS impact passengers’ emotions. For instance, walking through an airport terminal that is clean, pleasant, and warm to catch a flight can be pleasurable, and more so if the service personnel are respectful, responsive, and empathetic. To this effect, we explore the following hypotheses:
H1a. 
Substantive staging of an airport servicescape (SSoS) has a positive effect on passengers’ positive emotion.
H1b. 
Communicative staging of an airport servicescape (CSoS) has a positive effect on passengers’ positive emotion.
Regarding satisfaction mainly as a result of service interaction or as a service-generating process called interactive marketing function [55], Hanks and Line’s [32] analysis of how a communicative or social servicescape engenders restaurant customers’ satisfaction is a much needed contribution. Like others, Hanks and Line’s [32] analysis leaves out essential elements that are gaining enormous significance in service evaluation, e.g., the cultural flavor of the locale or the restaurant or hotel theme. Moon et al. [39], Ali et al. [12], and K. Park and Park [13] found that the physical environment of airports generates passenger satisfaction. J.-W. Park and Ryu’s [56] study is the first attempt at modeling both some physical and social elements at the airport terminal. However, none of the dimensions of the social servicescape had a significant influence on passenger affective and cognitive satisfaction. Methods for data collection may account for this result. It is unclear from the study whether data was collected after the passenger had gone through airport processing, such as check-in and security. Additionally, the authors operationalized CSoS while ignoring airport-specific studies and using traditional service indicators, such as those of a hotel. However, an airport terminal is markedly different from a hotel or a restaurant servicescape. Therefore, this study adds to the extant literature on the airport servicescape by examining the contributions of both SSoS and CSoS to passenger satisfaction using airport-specific dimensions. This joint assessment will elucidate the subtle effects of utilizing relevant airport servicescape operationalization. We, therefore, hypothesize that:
H2a. 
Substantive staging of an airport servicescape (SSoS) has a positive effect on passenger satisfaction.
H2b. 
Communicative staging of an airport servicescape (CSoS) has a positive effect on passenger satisfaction.

3.2.2. Interrelations between Positive Emotion, Satisfaction, and Behavioral Intentions

The individual–environment interaction generates an emotion or affect in the individual as a direct response to the environment. Russell and Pratt [57] (pp. 311–312) define affect as “emotion expressed in language, and affective quality of a molar physical environment (or more simply expressed, a place), as the emotion-inducing quality that persons verbally attribute to the place.” An affective response can be negative or positive. Positive affect has been referred to as positive emotion [10,58]. The broaden-and-build theory of positive emotions by Fredrickson [29,30] holds that positive emotions broaden people’s thought-action repertoire (i.e., their scope of attention, cognition, and action) and nurture their creative ideas and actions, as well as social bonds. These, in turn, facilitate the development of their resources—which may be physical, intellectual, social, and/or psychological—for future uses. A favorable airport affect, that is, the pleasant feeling (i.e., positive emotion) passengers have towards an airport, can therefore be instructive in passengers’ perceptual and behavioral judgments. The broaden-and-build effects of positive emotion align with Lazarus’ [59] thesis that, though cognition induces emotions, emotions become contributory in later cognitive evaluations. From this train of thought, the outcomes in the marketing literature on affect and emotion being a function of product or service performance and an antecedent of satisfaction and behavioral responses are theoretically sustainable. This theoretical link has been demonstrated empirically in the hotel service setting [11,60]. Dedeoglu et al. [60] discovered that guests pleasured by servicescape express intentions to repeat purchase, recommend, and even pay more. Dedeoglu et al. [11] confirmed these results with emotional value derived from servicescape influencing revisits and WOM intentions. In an online consumption environment, Guo et al. [61] found that the positive emotions elicited by pleasant online reviews increases the likelihood of making a purchase. The authors call this the positive emotion bias. On the strength of the preceding exposition, we hypothesize that:
H3. 
Passengers’ positive emotion has a positive effect on behavioral intentions to (i) repeat purchase, (ii) recommend, (iii) pay more, and (iv) spend more.
Post-consumption satisfaction forms a significant determinant of customers’ intentions [49,62,63]. Churchill and Surprenant [64] espoused that post-purchase satisfaction links all activities leading to purchase and consumption with post-purchase phenomena, including change in attitude, repeat purchase, and product recommendation. At the most basic, the operationalization of satisfaction is close to that of attitude but the two concepts are readily distinguishable by their temporal arrangements. Knowledge of product attributes before a purchase forms attitudes [32], consistent with attitude-behavior specification [65]. Product attributes, again, inform satisfaction post-purchase and use [66].
Nonetheless, Oliver [67] illustrated that satisfaction also becomes a critical component in an experiential-based attitude change. This new attitude invariably molds behavioral responses, thereby positioning satisfaction as an antecedent to customer behavioral loyalty intentions [66]. Kramer, Bothner, and Spiro [68] suggested that passenger satisfaction management at airports is likely to create a competitive edge in regions where passengers have multiple airport choices via repeat business and more spending at retail areas leading to higher profit margins. On this account, airport researchers have evaluated the SSoS on passenger satisfaction [12,39] and its consequent effects on behavioral intentions to repeat purchases and recommend at the transfer terminal [13]. On the weight of the discussion above, the following hypothesis is offered:
H4. 
Passenger satisfaction has a positive effect on behavioral intentions to (i) repeat purchase, (ii) recommend, (iii) pay more, and (iv) spend more.

3.2.3. The Moderation Effect of Passengers’ Travel Frequency

Air transport researchers suggest the potential role of passenger travel experience (air travel history) in assessing airport performance. Empirical studies have shown that passengers with different air travel experiences (measured with travel frequency) perceive airport performance differently. Infrequent travelers tend to score airport performance higher than frequent travelers. Assigned reasons for such a difference range from infrequent flyers’ anxiety to their low service requirements [69,70]. This revelation on travel frequency corroborates evidence in the literature that prior consumption experiences alter subsequent post-consumption evaluation [10,66] via advanced customer knowledge [26]. Consumption frequency expands consumer knowledge, which promotes familiarity. Customer familiarity, therefore, may lead to more demanding customer service requirements. Broadly, researchers agree on the interchangeable use of customer “knowledge” and “familiarity”; however, in Ha and Perks’ [69] view, subsumed in customer familiarity are concepts such as intensity of belief, prior knowledge, and experience. Söderlund [23] contended that customer familiarity or experience results from cognitive-based changes in the customer due to repeated exposure. As a result, the author argued that high (vs. low) familiarity customers possess different frames of reference for post-purchase evaluation. Frequency of encounter is commonly used to measure familiarity. This manner of operationalizing customer familiarity exhibits high positive association with subjective, objective, and prior experience measures of customer knowledge [23,71]. In this study, we use air passengers’ travel frequency to measure passengers’ familiarity with airport terminal facilities and processes.
As earlier discussed, the role of customer pre-purchase history (familiarity in this study) in post-purchase evaluation is not conclusive. For instance, Söderlund [23], studying restaurant service settings, found that customers with high familiarity before a purchase episode exhibited extreme or polarized post-purchase responses. With more elaborate cognitive structure via familiarity, the post-purchase appraisal is more stringent. When services perform, their satisfaction and behavioral responses are correspondingly higher than low-familiarity customers, and the converse happens when services fail. In addition, Dedeoglu et al.’s [11] study revealed that repeating guests of a hotel showed polarized post-purchase responses regarding the hotel servicescape’s effect on their emotional value and attendant impact on intentions to repeat visit and recommend. However, Dedeoglu et al.’s [10], assessing the effects of hotel servicescape on positive affect, satisfaction, and behavioral intentions, found low-brand-familiarity customers to be more affected by high SSoS performance. These inconsistent findings on customers’ familiarity (i.e., elaborate cognitive structure) and their post-consumption evaluative responses require more evidence from both similar and different contexts. A close analysis of these studies hints at the role of familiarity (previous experience) in determining which servicescape components exert more influence on emotion. For example, it was observed in J.Y. Park et al.’s [10] study that over 50% of the respondents visited the hotel once. Low familiarity appears to explain the more substantial effect of SSoS on positive affect. Not much information was supplied on guests’ profiles in Dedeoglu et al.’s [11] study to compare how many or what percentage were first-time visitors. Additionally, Söderlund’s [23] study only simulated social servicescape. In respect to these, we hold the view that travelers may be less or more affectively affected and satisfied by the performance of the airport servicescape (SSoS and CSoS) depending on whether they are frequent or infrequent travelers. Travel frequency is further expected to influence how their positive emotion and satisfaction engender their behavioral loyalty intentions. On this premise, we propose the following hypotheses:
H5. 
The strength of the positive effect of airport (a) SSoS and (b) CSoS on passenger (i) positive emotion and (ii) satisfaction is dependent on their travel frequency.
H6. 
The strength of the positive effect of passenger (a) positive emotion and (b) satisfaction on behavioral intentions to (i) repeat purchase, (ii) recommend, (iii) pay more, and (iv) spend more is dependent on their travel frequency.

4. Research Methods

4.1. Study Setting, Participants and Procedure

Participants for this study were drawn from departing passengers from Shanghai Hongqiao International Airport (SHA). SHA is the first international airport built to serve the Shanghai municipality and dates back to 1907. Currently, SHA is known for its robust domestic and regional connectivity. The hyperconnectivity is achieved through SHA’s role in the three-city “Northeast Asian Golden Aviation Circle” consisting of Shanghai, Tokyo, and Seoul [72]. This role of SHA is a strategic one considering its location: Shanghai Hongqiao transportation hub. It is perhaps the most connected transport hub in China with road, rail, and air transport terminals. This elaborate transport network system has made SHA a highly competitive airport for domestic and regional travel, particularly on short- and medium-haul routes. Aside from this, SHA has well-functioning ground access, facilitating a seamless flow of town buses, subway lines, taxis, and private cars for rent to various parts of the Shanghai municipality. It is near downtown Shanghai (13 miles approximately). SHA handled well over 44.6 million passengers in 2018. Considering that this study seeks to measure Chinese responses to airport servicescape, this airport offers an excellent opportunity to achieve this aim because it is oriented towards the domestic and regional market.
The convenience sampling technique was adopted for participants’ recruitment with great keenness on airport security protocols and the need to avoid disturbing the participants’ activities. Because of the limited time for interaction and the need to assess all processes and facilities of the airport, a web-based mode of questionnaire distribution was used. The questionnaire was organized online using KwikSurveys—Online Survey Maker (GDPR compliant, 3 million users). This platform has been utilized in past research [73,74]. Research assistants briefed participants on the research purpose, its sponsors, and the supervisory institution. It is noteworthy that participants’ consent was informed following the Belmont Report of 1978 but were not documented. Undocumented consent is not an unusual practice in survey research [75]. The very form of the survey (web-based) also permitted participants to re-evaluate their consent on every question. The research assistants sent the Quick Response Code (QR Code) or the hyperlink of the survey instrument to participants via WeChat (Chinese version of Facebook) or email. More often, though, participants took pictures of the QR code. Data collection began in late August and ended in early September 2019. The final sample used for this study was 387. Descriptively, about 52% (201) of the respondents were women, around 57% possessed at least a bachelor’s degree, and close to half (47.55%) were leisure travelers. The large majority (76.23%) of them were at least 30 years old and mainly infrequent travelers (40.83) (see Table 1).

4.2. Measurement Scales

The measures for the latent variables explored in this study were adapted from prior studies with sound validity and reliability reports. The multi-componential structure of the airport’s SSoS (layout accessibility, facility ambiance and aesthetics, functionality, and cleanliness) was measured with items adopted from Ali et al., and Moon et al. [12,39]. The airport’s CSoS was measured as a bidimensional construct; airport staff helpfulness and communication (HC) with four items [45,76,77] and airport’s representativeness of local culture with five items [50,78]. Additionally adapted were the items for passengers’ positive emotion [5,79], satisfaction [67], and behavioral loyalty intentions [80,81]. Passengers reported their perception of the airport’s SSoS and CSoS and satisfaction on 5-point Likert scales (1 = strongly disagree to 5 = strongly agree). Passengers’ positive emotion was measured on a 7-point bipolar scale (1 = extremely accurate to 7 = extremely inaccurate). In contrast, their behavioral intentions were measured on a 7-point Likert scale (1 = not at all likely to 7 = extremely likely). Additionally, participants’ socio-demographic information such as gender (measured with 1 = Man and 2 = Woman), age (in years), education (1 = junior high school; 2 = high or technical school; 3 = college or undergraduate or diploma; 4 = masters or above), travel purpose (1 = business; 2 = education; 3 = leisure) [70], and travel frequency (all domestic and international flights in a year and recoded into low, moderate, and high following Liou et al.’s [76] attribute categorization for improving airport service quality) were recorded.
Content translation, assessment, and evaluation of the scales were performed before use in the Chinese airport context. The scales’ translation followed two systematic procedures. Two professional bilingual native Chinese translators translated the original measurement scales from English to the Chinese language using the forward- and back-translation technique [82]. Five members of the university’s research review committee assessed the items and sub-components (where applicable) of the scales for content, semantic, technical, criterion, and conceptual equivalences in line with Squires et al.’s [83] recommendations. Upon their suggestions, minor modifications were made to ensure relevance and quality of translation. The final survey instrument in Chinese was pilot-tested in keeping with the Belmont Report and Helsinki Declaration.

4.3. Analytic Technique

We first examined the measurements’ psychometric characteristics with confirmatory factor analyses (CFA) using IBM SPSS statistic and SPSS AMOS, version 25 [84]. Furthermore, constructs’ convergent and discriminant validity, composite, and items’ internal reliabilities were examined [85]. The study’s hypotheses were tested utilizing path analysis: structural equation modeling (SEM). The confounding effects of sociodemographic and travel characteristics were controlled as they are related to the outcome variables [49,70,76]. A bias-corrected bootstrap method with a 95% confidence interval (CI) was adopted to test the hypothesized interaction effects.

5. Results

5.1. Data Preparation

The items’ descriptive statistics were examined following the recommendations by Allison [86]. Because the data was self-reported, we addressed common method bias issues with Harman’s one-factor solution and one-factor confirmatory factor analysis [87]. The single factor solution did not explain the majority of the covariance (15.03%), which was less than 50%, as recommended by Tehseen et al. [88]. Furthermore, the one-factor CFA had poor fit (χ2/df =18.39, SRMR = 0.101, CFI = 0.72, TLI = 0.35, RMSEA = 0.19), indicating that CMB is not a concern in the data. The items’ descriptive statistics (skewness and kurtosis values) met the recommended threshold (≤±2.00) [89].

5.2. Measurement Model

5.2.1. Confirmatory Factory Analysis

First, the twelve-factor model that examines the first order factors was tested using the confirmatory factor analytic (CFA) procedure. Following Jackson, Gillaspy, and Purc-Stephenson [90], we used the full-information maximum likelihood estimators (FIML), which is robust to mild violations of normality to specify the measurement model. One item from the local culture scale (LC5: γ = 0.33, CR = 7.23, CI = 0.22, 0.44) had low factor loading and was dropped. Subsequently, the model had adequate fit to the data (χ2 [1401] = 3531, χ2-to-df index of 2.52, SRMR = 0.04, CFI = 0.96, TLI = 0.93, RMSEA = 0.06). ML factor loadings were all significant (CI: low 0 = 0.61–0.92, upper = 0.59–0.97) after item-level modifications (see Table 2).

5.2.2. Validity and Reliability Assessment

The constructs’ discriminant validity was achieved, with average variance explained (AVE) values greater than maximum shared variance (MSV) values and the square root of the AVEs greater than inter-construct correlation coefficients [85]. Additionally, the heterotrait-monotrait (HTMT) ratio of correlation analysis confirmed the distinguishability of the constructs (i.e., all correlation ratios met the 0.90 or 0.85 cutoff) [91]. AVE value estimates were checked and compared to a minimum threshold of 0.50. All constructs had AVE values greater than the minimum threshold (0.50), supporting convergent validity. Again, the constructs’ composite (CR) and items’ internal reliabilities (a) were examined, as suggested by Hair et al. [85]. The constructs’ CR and items’ a (Cronbach alpha) met the recommended threshold (0.70). Inter-constructs correlation coefficients revealed that the variables shared moderate positive correlations (see Table 3).

5.3. Hypotheses Testing

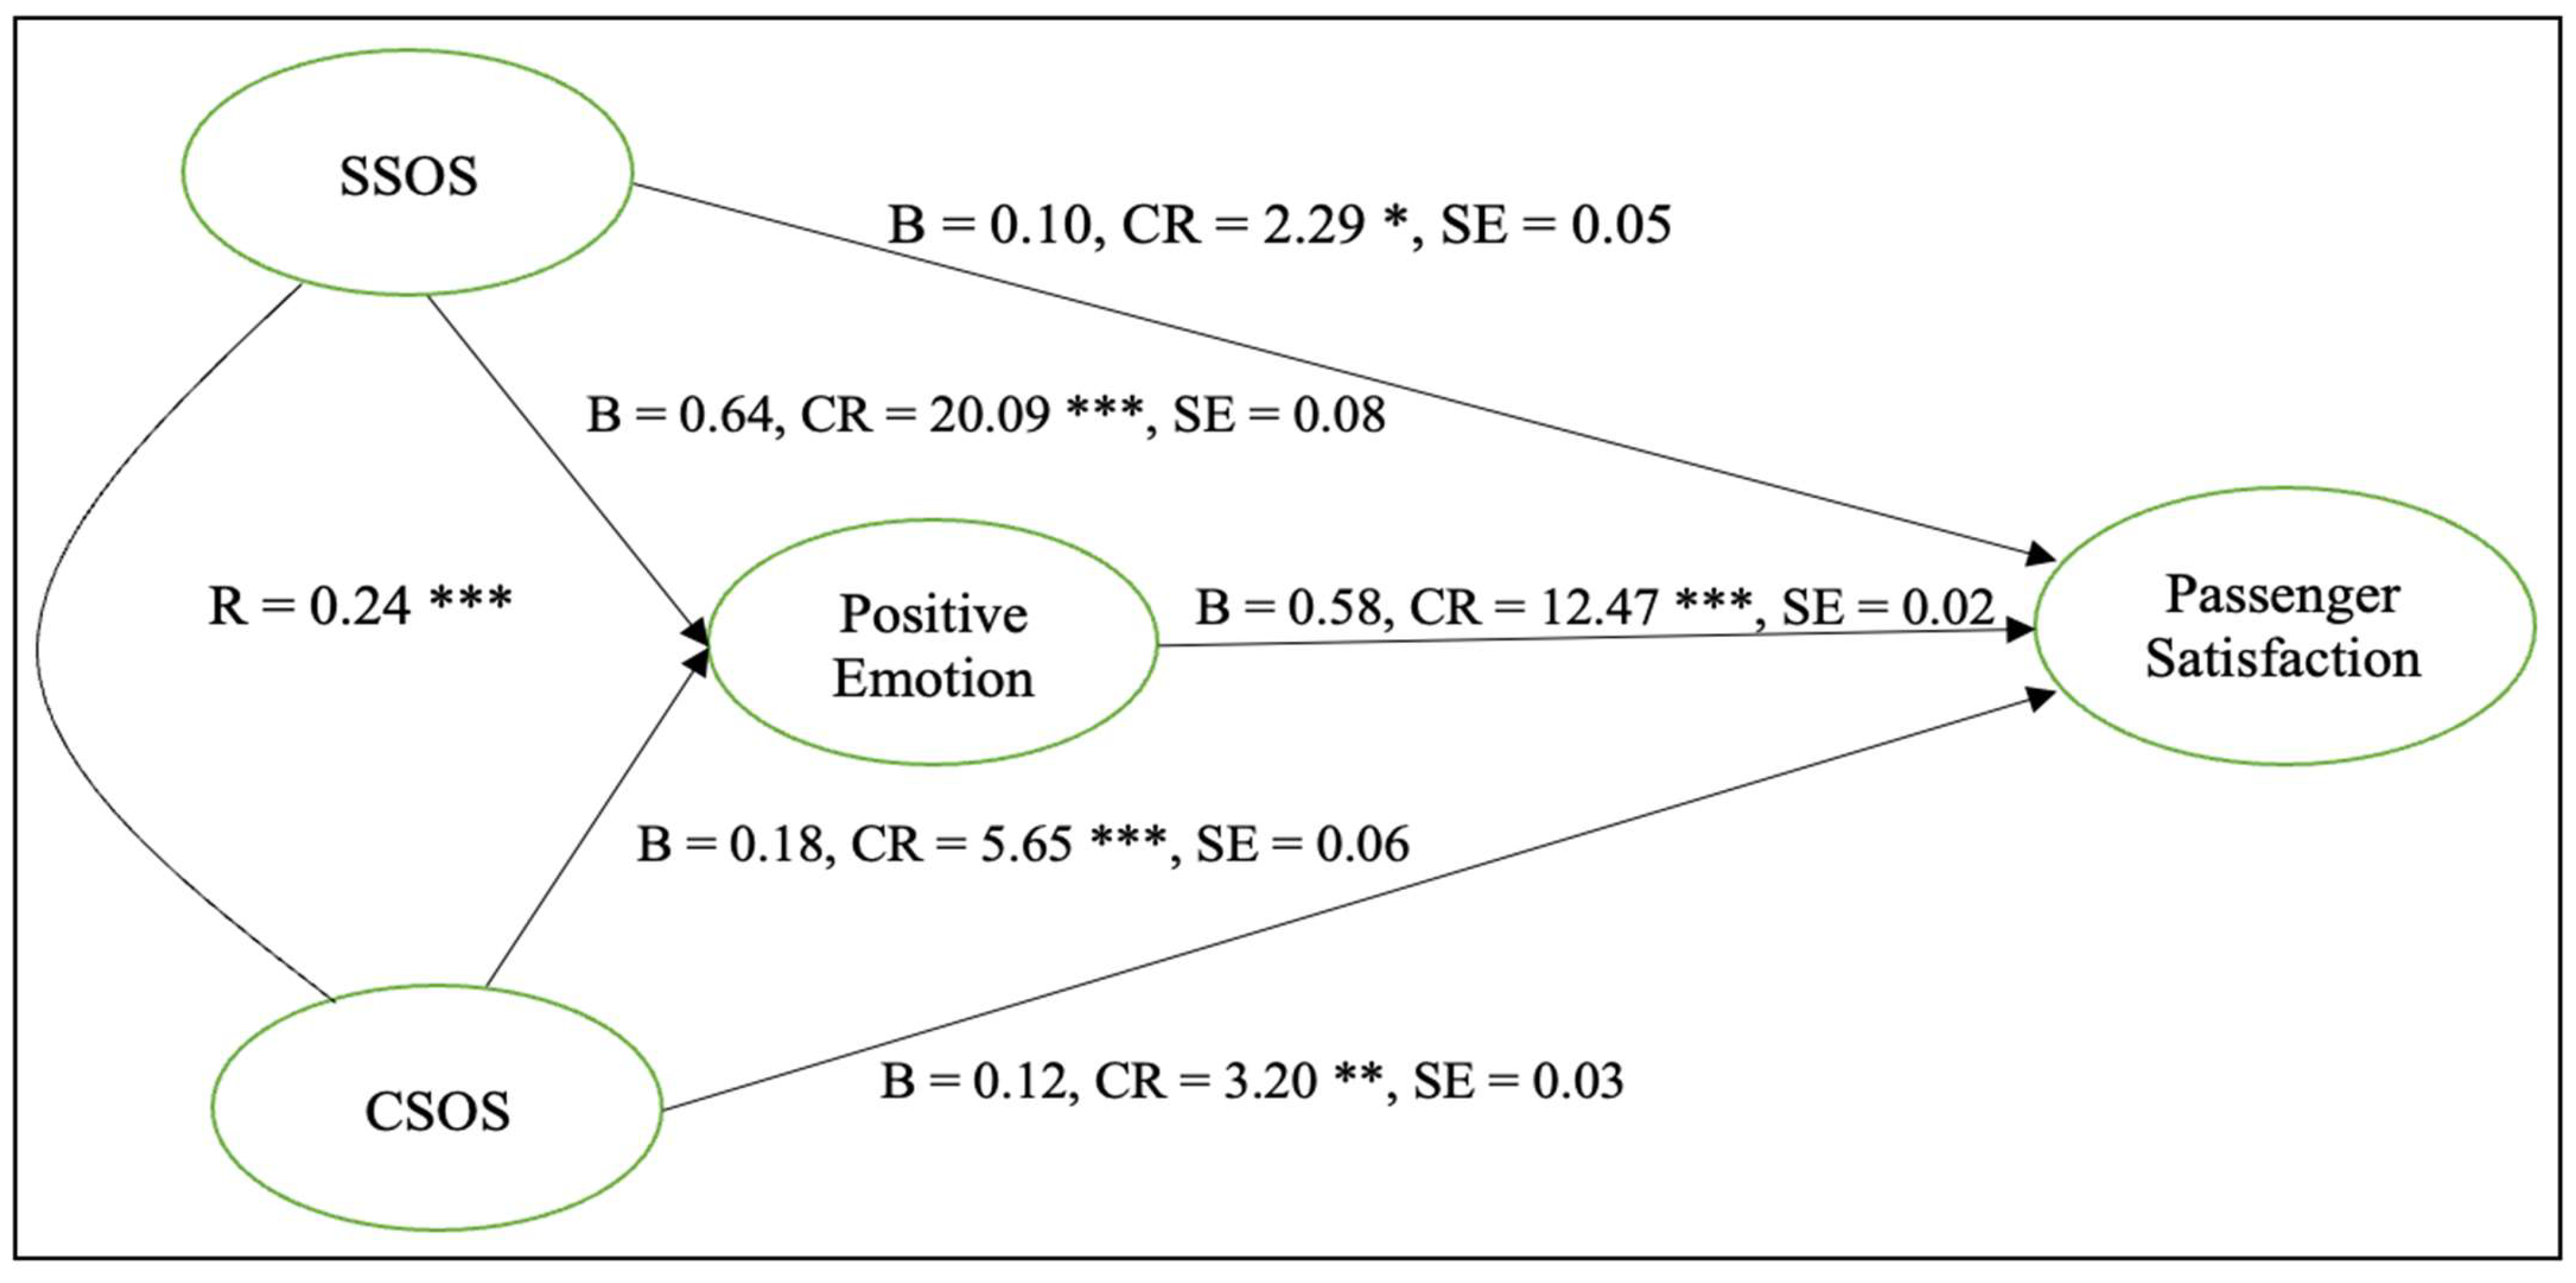
5.3.1. The Association among SSoS, CSoS, Passengers’ Emotion, and Satisfaction

The latent path model assessing the influence of SSoS and CSoS on passengers’ positive emotion and satisfaction fitted the data (χ2 [9] = 21.27, p = 0.012, χ2-to-df index of 2.36, SRMR = 0.04, CFI = 0.98, TLI = 0.95, RMSEA = 0.05). Regression estimates for the direct associations between SSoS and passengers’ positive emotion (H1a), CSoS and passengers’ positive emotion (H1b), SSoS and satisfaction (H2a), and CSoS and satisfaction (H2b) were positive and statistically significant, after controlling for the confounding effects of passenger characteristics (i.e., age, education, gender, trip purpose, and travel frequency).

5.3.2. Passengers’ Emotion and Satisfaction as Predictors of Behavioral Intentions

The model that examines whether passengers’ positive emotion and satisfaction are significant predictors of their behavioral intentions had acceptable fit indices (χ2 [17] = 69.78, χ2-to-df index of 3.88, SRMR = 0.06, CFI = 0.95, TLI = 0.92, RMSEA = 0.07). Passengers’ positive emotion and satisfaction significantly and positively predicted their behavioral intentions to (i) repeat purchase, (ii) recommend, and (iii) pay more; however, it was found that satisfaction had an insignificant effect on intentions to (iv) spend more, after accounting for the effects from the control variables (see Table 4).

5.3.3. Moderating Effect of Travel Frequency on the Influence of Airport Servicescape (i.e., SSoS and CSoS) on Passenger (a) Positive Emotion and (b) Satisfaction

The latent path model, containing the direct and interaction effects, and the critical confounders had acceptable fit to the data (Model1: χ2 [25] = 102.75, p < 0.001, χ2-to-Df index of 3.95, SRMR = 0.06, CFI = 0.98, TLI = 0.95, RMSEA = 0.06). First, only the interaction effects between airport servicescape (i.e., SSoS and CSoS) and travel frequency on passenger satisfaction in Model1 were significant but not those between SSoS and CSoS and travel frequency on positive emotion.

5.3.4. Moderating Effect of Travel Frequency on the Influence of Passenger (a) Positive Emotion and (b) Satisfaction on Behavioral Intensions

The model for the interaction effect fitted the data (Model2: χ2 [21] = 128.14, p < 0.001, χ2-to-Df index of 5.82, SRMR = 0.07, CFI = 0.97, TLI = 0.90, RMSEA = 0.07). The interaction effects of passengers’ positive emotion and travel frequency and of passenger satisfaction and travel frequency on willingness to repeat purchase and pay more were significant, but not on willingness to recommend. Furthermore, the interaction between passenger satisfaction and travel frequency on the intention spend more was significant but not that between passengers’ positive emotion and travel frequency on the intention to spend more (see Table 4).
Adding to the substantive model, an alternative model—exploring the direct influence of airport servicescape (i.e., SSoS and CSoS) on all the outcome variables—was tested. The alternative model fitted the data (χ2 [9] = 23.01, p = 0.01 χ2-to-df index of 2.56, SRMR = 0.03, CFI = 0.99, TLI = 0.94, RMSEA = 0.05), producing results identical to the substantive model (see Table 5). The results illustrate that passengers’ perceived SSoS and CSoS do not only orchestrate cognitive mechanisms that produce perceptual and emotional responses, which then effectuate behaviors, but can also directly affect passengers’ behaviors.

5.4. Post Hoc Analysis

Considering the potential influence of passengers’ positive emotion on their satisfaction, as indicated by the substantive model with the support of the broaden-and-build theory of positive emotions, a post hoc analysis was performed to assess the indirect effects of SSoS and CSoS on passenger satisfaction through their positive emotion (see Figure 2). The results show that the indirect effect of passengers’ positive emotion on the SSOS-satisfaction link (38 ***, CI = 0.08, 0.15, Bootstrap SE = 0.02.), and the CSOS-satisfaction link (0.11 ***, CI = 0.32, 0.44, Bootstrap SE = 0.03.) is significant and positive. This shows the effect of affect (emotion) on perception in addition to behaviors.

6. Discussion

6.1. Results Summary

With service consumers as co-producers coupled with the immateriality of services, physical and human aspects of service delivery play instrumental roles in the service consumption experience. Accordingly, this study, using the SOR theoretical framework complemented by the broaden-and-build theory of positive emotions, assessed the influence of airport servicescape (i.e., SSoS and CSoS) on passengers’ emotional responses (i.e., positive emotion and satisfaction) and their resultant effects on behavioral intentions (i.e., intentions to repeat purchase, recommend, pay more, and spend more). Additionally, the extent to which the strength of these effects is subject to travel frequency (i.e., familiarity with airport processes and facilities) was explored. This study extends the extant literature on airport servicescape in three ways. First, this study empirically tests the effects of the substantive and communicative airport servicescape on passengers’ emotional responses at a departure terminal. Second, unlike prior studies on airport servicescape, this study examines the effects of these emotional responses on behavioral responses critical for airport service and relationship marketing. Lastly, the study demonstrates the moderating role of travel frequency in airport servicescape and passengers’ emotional and behavioral responses. Except for H4iv, all the hypothesized direct relations (H1a, H1b, H2a, H2b, H3i‥iv, and H4i‥iii) were supported by the data. The results from the moderation analyses reveal that most of the interaction effects (H5aii, H5bii, H6ai, H6aii, H6aiii, H6bi, H6bii, H6biii, and H6biv) were significant, except for H5ai, H5bi, and H6aiv.
Even though both the substantive and communicative servicescape showed a significant positive influence on passengers’ positive emotions (H1a and H1b) and satisfaction (H2a and H2b), the influence of the substantive servicescape was more robust in both instances. Additionally, passengers’ positive emotion and satisfaction set off significant passengers’ behavioral responses (H3i-iv and H4i-iii). Furthermore, travel frequency’s interaction with airport servicescape (SSoS and CSoS) affected only passenger satisfaction (H5aii and H5bii) and not positive emotion (H5ai, H5bi). Lastly, travel frequency interacted with passengers’ positive emotion and satisfaction to influence their willingness to repeat purchase, pay more, and recommend (H6ai, H6aii, H6aiii, H6bi, H6bii, and H6biii). Willingness to spend more was influenced only by the interaction between travel frequency and satisfaction (H6biv).

6.2. Theoretical Implication

Several theoretical implications are noteworthy given the scant research on the relevance of the airport servicescape in generating an enriching passenger experience at international airport terminals. These contributions are produced from the comprehensive analysis of airports’ social and physical elements and passengers’ emotional and behavioral responses at a departure terminal. First, the evidence that the substantive servicescape has a more substantial effect on passengers’ emotional responses (i.e., positive emotion and satisfaction) than the communicative servicescape is telling given the literature on SSoS and CSoS’s influence on emotional responses. This finding, first of all, is in harmony with evidence from the hotel [10] and restaurant servicescape [93], and therefore extends this to an international airport context. Nonetheless, some inconsistencies are notable when compared to results of some studies on hot spring resorts [52] and restaurants [94], where equivalent results were found for both substantive and communicative servicescape, or with findings from a hotel servicescape [11], where communicative staging was more critical for emotional value. Summarily, the result strengthens Meng and Choi [93] and J.Y. Park et al.’s [10] attempts to offer a response to Arnould et al.’s [9] inquiry on whether communicative staging of the wilderness servicescape was more important because it was barely substantively staged. Arnould et al. [9] wondered if the converse might be true in a mostly substantively staged servicescape, such as in hotels and airports. This study bolsters the theoretical separation of substantive and communicative servicescape and illustrates their significance across contexts with the relevant literature.
Second, the significantly positive interaction effect between passengers’ travel frequency and the communicative servicescape on satisfaction suggests that frequent flyers are more satisfied with a high communicative servicescape performance than infrequent flyers. This result corroborates Söderlund’s [23] findings that a high level of pre-purchase familiarity is linked with extreme post-purchase responses, such as customer satisfaction, but disagrees with J.Y. Park et al.’s [10] study, which shows the opposite. Interestingly, the communicative servicescape in this study is similar, in one dimension, to Söderlund’s [23] manipulated service encounter. The author argued that service encounters are essentially social encounters. Like cultures, no two social encounters—even with the same or similar individuals—are the same, given the subjective and emotive nature of social interactions. Therefore, frequent travelers with multiple experiences of airport staff and cultures are more satisfied than infrequent flyers when served by airport staff who are highly helpful, respectful, and responsive and/or when the local culture of the host’s city or state is distinctively felt. Nonetheless, infrequent flyers are more satisfied with the substantive servicescape than frequent flyers, which agrees with J.Y. Park et al.’s [10] findings. This is likely because most international airports are similarly substantively staged. So, with high similarity in airports’ substantive design, high familiarity is unlikely to generate extreme evaluative responses.
Third, the findings that passenger satisfaction with and positive emotion toward an airport enkindled by airport servicescape (i.e., SSoS and CSoS) engender their behavioral intentions to repeat purchase, recommend, pay more, and spend more were consistent with outcomes in previous studies both at the airport [3,13,63] and in other service industries, such as hotels [10,11] and restaurants [23]. Apart from passengers’ willingness to pay more, passengers’ positive emotion displayed greater influence on passengers’ intention to repeat purchase, recommend, and spend more compared to their satisfaction. In addition to the results of the post hoc analysis, this finding demonstrates the influence of positive emotions as an evocative force in goal-directed behaviors, giving credence to Fredrickson’s [29,30] broaden-and-build theory of positive emotions.
Lastly, in line with Söderlund [23] and Tam’s [95] studies, the significant positive interaction effects between passenger satisfaction and travel frequency indicate that frequent travelers are more likely to repeat purchase and pay more when highly satisfied than infrequent flyers, but less likely to recommend and spend more where the converse was the case. However, supporting the findings of J.Y. Park et al. [10], the significant negative effects of the interaction between passengers’ positive emotion and their travel frequency imply that, except for the willingness to spend more, infrequent travelers are more likely to repurchase, recommend, and pay more at an airport when they experience strong positive emotions toward the airport compared to frequent travelers. The study extends these findings from the hotel [10] and restaurant settings [95] to an international airport environment. These differential interaction effects between passengers’ positive emotion and their satisfaction with travel frequency (thus, their level of familiarity with airport facility and processes) are perhaps due to the explanations offered by Söderlund [23] and J.Y. Park et al. [10]. Söderlund’s [23] polarized-response effect of high familiarity in satisfaction and behavioral responses may account for the results produced by an interaction between passenger satisfaction and their travel frequency. In the case of positive emotion, J.Y. Park et al. [10] contended that familiarity reduces or eliminates servicescapes’ “wow” effect on consumers with high familiarity. On one breadth, these findings suggest that polarized post-purchase responses triggered by high pre-purchase familiarity may occur with perceptual constructs, such as satisfaction, and not affective ones, such as positive emotions in this study or positive affect in J.Y. Park et al.’s [10]. On the other hand, low pre-purchase familiarity may be a likely trigger of high post-purchase affect due to the “wow” factor. Overall, this study supports the SOR framework, strengthens the broaden-and-build theory of positive emotion, and somewhat illustrates the consumer familiarity and response nexus, indicating when polarized responses and “wow” effects are plausible outcomes.

6.3. Practical Implication

This research offers crucial managerial, strategic, and operational implications for managers of service firms or destinations with a highly staged substantive servicescape in TTH, particularly international airports. First, airport managers are aware of passengers’ reactions in the form of anger, frustration, or sadness when terminals are too congested with long queues and waiting times, or when the terminal is thermally and acoustically uncomfortable, smelly, or has poor lighting and signage systems, or has insufficient trolleys, among other issues. So, most airport managers take the necessary steps to avoid these elements. The study’s results intimate that these investments are not misdirected. Yet, passengers’ expression of dissatisfaction [17] demands that managers pay closer attention to these physical elements to address issues with the arrangement and comfort of seats, navigation and information communication systems, and cleanliness. Such efforts help airports benefit from the strong predictive capacity of airports’ physical elements for passenger affect and satisfaction.
Second, the results indicate further that managers’ efforts must also be dedicated to the communicative servicescape. To a lesser extent, the communicative servicescape contributes to passengers’ emotional responses (i.e., positive emotion and satisfaction), which produce behavioral intentions. Even in cases of predominantly hedonic consumption, where a substantive servicescape is the attraction, occasional brief encounters with a poor communicative servicescape trigger unpleasant affects, such as irritation or anger [41]. Airport managers need investment in training and development and streamlining of service personnel at all passenger interactive service touchpoints, from ticketing to boarding, to elicit the right emotional responses, especially from frequent flyers. In particular, script training and role-playing of airport staff may be critical, but managers should pay attention to value co-destruction. Travel, tourism, and hospitality service firms are known for unfavorable work conditions, including low pay and long hours [96]. In addition to personnel training, instituting better compensation plans so that the commensurate passenger-contact airport staff’s responsibilities create the necessary motivation. Motivation evokes the right attitude, needed commitment, and better engagement [97], enabling a service climate for favorable emotional responses from passengers.
Cultures are uniquely local, and the presence, aura, or feel of the host city or country’s local culture is hardly imitable. Culture is a strong determiner of pre-and post-purchase processes [50]. Creating a cultural flavor with local elements must be well-planned and executed with input from domestic and international passengers. A typical example question to ask passengers could be as simple as: “If you transferred in Shanghai without the opportunity to go out into the city, what cultural element(s) of Shanghai would you like to experience?” A pleasant airport experience produces airport reuse and host city (destination) revisit intentions [98] and even possesses the potential to convert stopovers to stayovers [44]. The authors project this potential as characterizing airports as quasi-destinations. Considering tourists are pulled in by the prospect of experiencing a unique culture, airport managers have the power to serve as promoters of a host city, thereby increasing airport reuse and local tourism development.
Lastly, airport managers should focus on developing competencies that blend the different aspects of the airport servicescape. For example, thematizing international airports may inspire managers to put together sensory ensembles that quintessentially welcome and relax passengers. Themes could be situated in airports’ architectural designs, popular local cultures, or service-personnel orientations. This will create an expectation in passengers that can be satisfied at the airport. Color, texture, heat, and sound, among other elements, with expert consultation, can be blended in a way that syncs with the theme and elicits pleasant affect and satisfaction. With the increasing importance of non-aeronautical revenues in airport sustainability, passengers need to be induced to spend at airport terminals. As the results indicate, managers have the opportunity to make this happen by staging airport servicescape with the right mix of elements. Overall, employee orientation and motivation, organizational culture, and facility maintenance require commitment from leadership. This commitment is pivotal as experience management is not a one-time thing. Therefore, airport managers need staunch commitment to enact the right changes in their servicescape.

6.4. Limitations and Avenues for Further Studies

Despite the wealth of insights this study brings to bear on the investigative problem explored and though it enriches theory and practice, certain limitations on interpreting the findings deserve mention. First, though the context of this study is international, generalizing the results contained therein is not advised. The study’s instrument was in Chinese as it is the primary language for service delivery at the airport. This limits the participation of passengers with challenging Chinese language ability. Therefore, it is recommended that the study’s model be replicated in other international airport contexts with a dominant language other than Chinese. Such research will strengthen the preliminary findings of the study’s model. Second, affective feelings are dynamically fluid and temporally contingent [99]. Therefore, the retrospective appraisal of passengers’ positive emotion may be controversial [100] as they may be liable to memory reconstruction [101]. We recommend that future studies capture passengers’ positive emotions in situ. Third, it is recommended that future studies assess movement types (domestic vs. international) and flight types (low-cost vs. full-service carriers). Fourth, self-report measures employed in this study may be liable to common method bias (CMB) [87]. We addressed this in many ways. Anonymity and confidentiality assurance was offered to ease respondents’ apprehension. Additionally, the use of an online questionnaire may eliminate the social desirability inherent in researcher-administered self-report measures. With the questionnaire format, predictor variables followed the outcome variables per the recommendation of Salancik and Pfeffer [102]. Fifth, Harman’s one-factor solution and one-factor confirmatory factor analysis showed no concerns for CMB. Lastly, travel frequency was self-reported; Dowds et al. [103] found that this may lead to over- or underestimation. We recommend the use of secondary information for travel frequency.

Author Contributions

Conceptualization, C.O.A., W.Z. and J.R.; methodology, C.O.A., W.O.-A., M.O.A., E.A.-O. and J.R.; formal analysis, W.Z., M.O.A. and E.A.-O.; investigation, C.O.A., W.O.-A. and R.A.A.; resources, C.O.A., W.Z. and J.R.; data curation, M.O.A., W.Z. and E.A.-O.; writing—original draft preparation, C.O.A., W.O.-A. and R.A.A.; writing—review and editing, R.A.A., W.O.-A., M.O.A., E.A.-O. and J.R.; visualization, C.O.A., W.Z. and E.A.-O.; supervision, J.R.; project administration, C.O.A., W.Z., R.A.A. and J.R.; funding acquisition, C.O.A. and J.R. All authors have read and agreed to the published version of the manuscript.

Funding

This work was funded by Grant ZC304020924 from the ZJNU Postdoctoral Research; Grant PJ103018001 from the Open Research Fund of College of Teacher Education, Zhejiang Normal University; Grant BBA170067 from The National Social Science Fund; and also Supported by China Positive Psychology Research Foundation 2021 Key Projects, Beijing Well-Being Foundation. The funders had no involvement in the data collection, analysis, and interpretation, as well as the manuscript write-up and the decision to submit the manuscript for publication.

Institutional Review Board Statement

Ethical review and approval were waived for this study, due to the fact that the form, structure, and content of the study’s data collection instruments and procedures were found unlikely to be injurious to the research participants. First, the topic under study does not require a participant to divulge any sensitive or traumatic information about themselves or a referent other. Second, the questionnaire was self-administered in the absence of the researchers, so participants were under no social or financial obligation to complete the survey. Third, it was unlikely to treat participants unjustly, disrespectfully, or unfairly considering the protocols of data collection.

Informed Consent Statement

Informed consent was obtained from all of the passengers involved in the study.

Data Availability Statement

Data will be supplied upon request from the corresponding author.

Acknowledgments

We extend our sincere thank you to the management and employees at Shanghai Hongqiao International Airport (SHA). In addition, our express appreciation goes to Fan Chong-jun of the Business School, University of Shanghai for Science and Technology (USST) for his support in data collection.

Conflicts of Interest

The authors of this manuscript declare that they have no known competing interest, financial or otherwise, that could impact the decisions on the study design, results reporting, and the choice of publication outlet.

References

  1. Duleba, S.; Moslem, S. Sustainable Urban Transport Development with Stakeholder Participation, an AHP-Kendall Model: A Case Study for Mersin. Sustainability 2018, 10, 3647. [Google Scholar] [CrossRef]
  2. Ghorbanzadeh, O.; Moslem, S.; Blaschke, T.; Duleba, S. Sustainable Urban Transport Planning Considering Different Stakeholder Groups by an Interval-AHP Decision Support Model. Sustainability 2018, 11, 9. [Google Scholar] [CrossRef]
  3. Antwi, C.O.; Fan, C.-J.; Ihnatushchenko, N.; Aboagye, M.O.; Xu, H. Does the nature of airport terminal service activities matter? Processing and non-processing service quality, passenger affective image and satisfaction. J. Air Transp. Manag. 2020, 89, 101869. [Google Scholar] [CrossRef]
  4. Gündoğdu, F.K.; Duleba, S.; Moslem, S.; Aydın, S. Evaluating public transport service quality using picture fuzzy analytic hierarchy process and linear assignment model. Appl. Soft Comput. 2020, 100, 106920. [Google Scholar] [CrossRef]
  5. Mehrabian, A.; Russell, J.A. An Approach to Environmental Psychology; The MIT Press: Cambridge, MA, USA, 1974. [Google Scholar]
  6. Mehrabian, A.; Russell, J.A. The Basic Emotional Impact of Environments. Percept. Mot. Skills 1974, 38, 283–301. [Google Scholar] [CrossRef] [PubMed]
  7. Bitner, M.J. Servicescapes: The Impact of Physical Surroundings on Customers and Employees. J. Mark. 1992, 56, 57–71. [Google Scholar] [CrossRef]
  8. Pine, B.J.; Gilmore, J.H. The experience economy: Past, present and future. In Handbook on the Experience Economy; Sundbo, J., Sorensen, F., Eds.; Edward Elgar Publishing Limited: Cheltenham, UK, 1999; pp. 21–44. [Google Scholar]
  9. Arnould, E.J.; Price, L.L.; Tierney, P. Communicative Staging of the Wilderness Servicescape. Serv. Ind. J. 1998, 18, 90–115. [Google Scholar] [CrossRef]
  10. Park, J.-Y.; Back, R.M.; Bufquin, D.; Shapoval, V. Servicescape, positive affect, satisfaction and behavioral intentions: The moderating role of familiarity. Int. J. Hosp. Manag. 2018, 78, 102–111. [Google Scholar] [CrossRef]
  11. Dedeoglu, B.B.; Bilgihan, A.; Ye, B.H.; Buonincontri, P.; Okumus, F. The impact of servicescape on hedonic value and behavioral intentions: The importance of previous experience. Int. J. Hosp. Manag. 2018, 72, 10–20. [Google Scholar] [CrossRef]
  12. Ali, F.; Kim, W.G.; Ryu, K. The effect of physical environment on passenger delight and satisfaction: Moderating effect of national identity. Tour. Manag. 2016, 57, 213–224. [Google Scholar] [CrossRef]
  13. Park, K.; Park, J.-W. The effects of the servicescape of airport transfer amenities on the behavioral intentions of transfer passengers: A case study on Incheon International Airport. J. Air Transp. Manag. 2018, 72, 68–76. [Google Scholar] [CrossRef]
  14. Ma, G.; Ding, Y.; Ma, J. The Impact of Airport Physical Environment on Perceived Safety and Domestic Travel Intention of Chinese Passengers during the COVID-19 Pandemic: The Mediating Role of Passenger Satisfaction. Sustainability 2022, 14, 5628. [Google Scholar] [CrossRef]
  15. Bakır, M.; Akan, Ş.; Özdemir, E.; Nguyen, P.-H.; Tsai, J.-F.; Pham, H.-A. How to Achieve Passenger Satisfaction in the Airport? Findings from Regression Analysis and Necessary Condition Analysis Approaches through Online Airport Reviews. Sustainability 2022, 14, 2151. [Google Scholar] [CrossRef]
  16. Wall, E.A.; Berry, L.L. The Combined Effects of the Physical Environment and Employee Behavior on Customer Perception of Restaurant Service Quality. Cornell Hotel Restaur. Adm. Q. 2007, 48, 59–69. [Google Scholar] [CrossRef]
  17. Yang, J.-S.; Park, J.-W.; Choi, Y.-J. Passengers’ Expectations of Airport Service Quality: A Case Study of Jeju International Airport. Int. J. Bus. Soc. Res. 2015, 5, 30–37. [Google Scholar]
  18. Blišťanová, M.; Tirpáková, M.; Brůnová, L. Overview of Safety Measures at Selected Airports during the COVID-19 Pandemic. Sustainability 2021, 13, 8499. [Google Scholar] [CrossRef]
  19. Shamohammadi, M.; Park, Y.; Choi, J.H.; Kwon, O.K. Exploring the Performance of International Airports in the Pre- and Post-COVID-19 Era: Evidence from Incheon International Airport. Sustainability 2022, 14, 4222. [Google Scholar] [CrossRef]
  20. Barczak, A.; Dembińska, I.; Rozmus, D.; Szopik-Depczyńska, K. The Impact of COVID-19 Pandemic on Air Transport Passenger Markets-Implications for Selected EU Airports Based on Time Series Models Analysis. Sustainability 2022, 14, 4345. [Google Scholar] [CrossRef]
  21. Song, K.-H.; Choi, S. A Study on the Perception Change of Passengers on Sustainable Air Transport Following COVID-19 Progress. Sustainability 2021, 13, 8056. [Google Scholar] [CrossRef]
  22. Mancinelli, E.; Rizza, U.; Canestrari, F.; Graziani, A.; Virgili, S.; Passerini, G. New Habits of Travellers Deriving from COVID-19 Pandemic: A Survey in Ports and Airports of the Adriatic Region. Sustainability 2022, 14, 8290. [Google Scholar] [CrossRef]
  23. Söderlund, M. Customer familiarity and its effects on satisfaction and behavioral intentions. Psychol. Mark. 2002, 19, 861–879. [Google Scholar] [CrossRef]
  24. Alba, J.W.; Hutchinson, J.W. Dimensions of Consumer Expertise. J. Consum. Res. 1987, 13, 411–454. [Google Scholar] [CrossRef]
  25. Avornyo, P.; Fang, J.; Antwi, C.O.; Aboagye, M.O.; Boadi, E.A. Are customers still with us? The influence of optimum stimulation level and IT-specific traits on mobile banking discontinuous usage intentions. J. Retail. Consum. Serv. 2019, 47, 348–360. [Google Scholar] [CrossRef]
  26. Mitchell, A.A.; Dacin, P.A. The Assessment of Alternative Measures of Consumer Expertise. J. Consum. Res. 1996, 23, 219–239. [Google Scholar] [CrossRef]
  27. Ampadu, S.; Jiang, Y.; Debrah, E.; Antwi, C.O.; Amankwa, E.; Gyamfi, S.A.; Amoako, R. Online personalized recommended product quality and e-impulse buying: A conditional mediation analysis. J. Retail. Consum. Serv. 2021, 64, 102789. [Google Scholar] [CrossRef]
  28. Guo, Z.; Yao, Y.; Chang, Y.-C. Research on Customer Behavioral Intention of Hot Spring Resorts Based on SOR Model: The Multiple Mediation Effects of Service Climate and Employee Engagement. Sustainability 2022, 14, 8869. [Google Scholar] [CrossRef]
  29. Fredrickson, B.L. The role of positive emotions in positive psychology: The broaden-and-build theory of positive emotions. Am. Psychol. 2001, 56, 216–226. [Google Scholar] [CrossRef]
  30. Fredrickson, B.L. What Good Are Positive Emotions? Rev. Gen. Psychol. 1998, 2, 300–319. [Google Scholar] [CrossRef]
  31. Pizam, A.; Tasci, A.D. Experienscape: Expanding the concept of servicescape with a multi-stakeholder and multi-disciplinary approach (invited paper for ‘luminaries’ special issue of International Journal of Hospitality Management). Int. J. Hosp. Manag. 2019, 76, 25–37. [Google Scholar] [CrossRef]
  32. Hanks, L.; Line, N.D. The restaurant social servicescape: Establishing a nomological framework. Int. J. Hosp. Manag. 2018, 74, 13–21. [Google Scholar] [CrossRef]
  33. Zhang, Z. The effect of library indoor environments on occupant satisfaction and performance in Chinese universities using SEMs. Build. Environ. 2019, 150, 322–329. [Google Scholar] [CrossRef]
  34. Liu, S.Q.; Bogicevic, V.; Mattila, A.S. Circular vs. angular servicescape: “Shaping” customer response to a fast service encounter pace. J. Bus. Res. 2018, 89, 47–56. [Google Scholar] [CrossRef]
  35. Jeon, S.; Kim, M.-S. The effect of the servicescape on customers’ behavioral intentions in an international airport service environment. Serv. Bus. 2012, 6, 279–295. [Google Scholar] [CrossRef]
  36. Dimitriou, D.; Karagkouni, A. Assortment of Airports’ Sustainability Strategy: A Comprehensiveness Analysis Framework. Sustainability 2022, 14, 4217. [Google Scholar] [CrossRef]
  37. Ryu, K.; Jang, S.S. The Effect of Environmental Perceptions on Behavioral Intentions Through Emotions: The Case of Upscale Restaurants. J. Hosp. Tour. Res. 2007, 31, 56–72. [Google Scholar] [CrossRef]
  38. Lee, Y.-K.; Lee, C.-K.; Lee, S.-K.; Babin, B.J. Festivalscapes and patrons’ emotions, satisfaction, and loyalty. J. Bus. Res. 2008, 61, 56–64. [Google Scholar] [CrossRef]
  39. Moon, H.; Yoon, H.J.; Han, H. Role of Airport Physical Environments in the Satisfaction Generation Process: Mediating the Impact of Traveller Emotion. Asia Pac. J. Tour. Res. 2015, 21, 193–211. [Google Scholar] [CrossRef]
  40. Wu, A.; Weber, K. Convention center facilities, attributes and services: The delegates’ perspective. Asia Pac. J. Tour. Res. 2005, 10, 399–410. [Google Scholar] [CrossRef]
  41. Wakefield, K.L.; Blodgett, J.G. Customer response to intangible and tangible service factors. Psychol. Mark. 1999, 16, 51–68. [Google Scholar] [CrossRef]
  42. Wakefield, K.L.; Blodgett, J.G. The effect of the servicescape on customers’ behavioral intentions in leisure service settings. J. Serv. Mark. 1996, 10, 45–61. [Google Scholar] [CrossRef]
  43. Vilnai-Yavetz, I.; Gilboa, S. The Effect of Servicescape Cleanliness on Customer Reactions. Serv. Mark. Q. 2010, 31, 213–234. [Google Scholar] [CrossRef]
  44. Tang, C.; Weaver, D.; Lawton, L. Can stopovers be induced to revisit transit hubs as stayovers? A new perspective on the relationship between air transportation and tourism. J. Air Transp. Manag. 2017, 62, 54–64. [Google Scholar] [CrossRef]
  45. Wiredja, D. Assessment of Airport Service Performance: A Passenger-Centred Model. Ph.D. Thesis, Queensland University of Technology, Brisbane, Australia, 2017. [Google Scholar]
  46. Antwi, C.O.; Ntim, S.Y.; Boadi, E.A.; Asante, E.A.; Brobbey, P.; Ren, J. Sustainable cross-border tourism management: COVID-19 avoidance motive on resident hospitality. J. Sustain. Tour. 2022, 1–21. [Google Scholar] [CrossRef]
  47. Boadi, E.A.; He, Z.; Antwi, C.O.; Altab, H.; Bosompem, J.; Hinson, R.E.; Boadi, V.A. Value co-creation and employee service behaviours: The moderating role of trust in employee-hotel relationship. J. Retail. Consum. Serv. 2022, 66, 102898. [Google Scholar] [CrossRef]
  48. Berry, L.L.; Wall, E.A.; Carbone, L.P. Service Clues and Customer Assessment of the Service Experience: Lessons from Marketing. Acad. Manag. Perspect. 2006, 20, 43–57. [Google Scholar] [CrossRef]
  49. Antwi, C.O.; Fan, C.-J.; Nataliia, I.; Aboagye, M.O.; Xu, H.; Azamela, J.C. Do airport staff helpfulness and communication generate behavioral loyalty in transfer passengers? A conditional mediation analysis. J. Retail. Consum. Serv. 2020, 54, 102002. [Google Scholar] [CrossRef]
  50. Ariffin, A.A.M.; Yahaya, M.F. The relationship between airport image, national identity and passengers delight: A case study of the Malaysian low cost carrier terminal (LCCT). J. Air Transp. Manag. 2013, 31, 33–36. [Google Scholar] [CrossRef]
  51. Ariffin, A.A.M.; Maghzi, A. A preliminary study on customer expectations of hotel hospitality: Influences of personal and hotel factors. Int. J. Hosp. Manag. 2012, 31, 191–198. [Google Scholar] [CrossRef]
  52. Chang, K.-C. Effect of servicescape on customer behavioral intentions: Moderating roles of service climate and employee engagement. Int. J. Hosp. Manag. 2016, 53, 116–128. [Google Scholar] [CrossRef]
  53. Eroglu, S.A.; Machleit, K.A.; Davis, L.M. Atmospheric qualities of online retailing. J. Bus. Res. 2001, 54, 177–184. [Google Scholar] [CrossRef]
  54. Bagozzi, R.P. Principles of Marketing Management; Science Research Associates: Chicago, IL, USA, 1986. [Google Scholar]
  55. Grönroos, C. A Service Quality Model and its Marketing Implications. Eur. J. Mark. 1984, 18, 36–44. [Google Scholar] [CrossRef]
  56. Park, J.-W.; Ryu, Y.K. Investigating the Effects of Airport Servicescape on Airport Users’ Behavioral Intentions: A Case Study of Incheon International Airport Terminal 2 (T2). Sustainability 2019, 11, 4171. [Google Scholar] [CrossRef]
  57. Russell, J.A.; Pratt, G. A description of the affective quality attributed to environments. J. Pers. Soc. Psychol. 1980, 38, 311–322. [Google Scholar] [CrossRef]
  58. Lyubomirsky, S.; King, L.; Diener, E. The Benefits of Frequent Positive Affect: Does Happiness Lead to Success? Psychol. Bull. 2005, 131, 803–855. [Google Scholar] [CrossRef]
  59. Lazarus, R.S. Emotion & Adaptation; Oxford University Press: Oxford, UK, 1991. [Google Scholar] [CrossRef]
  60. Dedeoğlu, B.B.; Küçükergin, K.G.; Balıkçıoğlu, S. Understanding the Relationships of Servicescape, Value, Image, Pleasure, and Behavioral Intentions Among Hotel Customers. J. Travel Tour. Mark. 2015, 32, S42–S61. [Google Scholar] [CrossRef]
  61. Guo, J.; Wang, X.; Wu, Y. Positive emotion bias: Role of emotional content from online customer reviews in purchase decisions. J. Retail. Consum. Serv. 2019, 52, 101891. [Google Scholar] [CrossRef]
  62. Kim, H.; Lee, N. The Effects of the In-Flight Safety Information Characteristics on the Safety Behavioral Intention of Airline Passengers. Sustainability 2022, 14, 2819. [Google Scholar] [CrossRef]
  63. Antwi, C.; Ren, J.; Owusu-Ansah, W.; Mensah, H.; Aboagye, M. Airport Self-Service Technologies, Passenger Self-Concept, and Behavior: An Attributional View. Sustainability 2021, 13, 3134. [Google Scholar] [CrossRef]
  64. Ekinci, Y. An Investigation of the Determinants of Customer Satisfaction. Tour. Anal. 2003, 8, 193–196. [Google Scholar] [CrossRef]
  65. Ajzen, I.; Fishbein, M. Attitude-behavior relations: A theoretical analysis and review of empirical research. Psychol. Bull. 1977, 84, 888–918. [Google Scholar] [CrossRef]
  66. Mittal, V.; Kumar, P.; Tsiros, M. Attribute-Level Performance, Satisfaction, and Behavioral Intentions over Time: A Consumption-System Approach. J. Mark. 1999, 63, 88. [Google Scholar] [CrossRef]
  67. Oliver, R.L. A Cognitive Model of the Antecedents and Consequences of Satisfaction Decisions. J. Mark. Res. 1980, 17, 460. [Google Scholar] [CrossRef]
  68. Kramer, L.S.; Bothner, A.; Spiro, M. How Airports Measure Customer Service Performance: A Synthesis of Airport Practice; Transportation Research Board: Washington, DC, USA, 2013. [Google Scholar]
  69. Ha, H.-Y.; Perks, H. Effects of consumer perceptions of brand experience on the web: Brand familiarity, satisfaction and brand trust. J. Consum. Behav. 2005, 4, 438–452. [Google Scholar] [CrossRef]
  70. Chao, C.-C.; Lin, H.-C.; Chen, C.-Y. Enhancing Airport Service Quality: A Case Study of Kaohsiung International Airport. J. East. Asia Soc. Transp. Stud. 2013, 10, 2235–2254. [Google Scholar]
  71. Raju, P.; Lonial, S.C.; Mangold, W.G. Differential Effects of Subjective Knowledge, Objective Knowledge, and Usage Experience on Decision Making: An Exploratory Investigation. J. Consum. Psychol. 1995, 4, 153–180. [Google Scholar] [CrossRef]
  72. Fan, C.; Zhang, L.; Yang, J.; Shu, W.; Zhang, Z.; Ji, Q. Information integration of Hongqiao transportation hub public information platform based on SOA. In Proceedings of the 2010 Seventh International Conference on Fuzzy Systems and Knowledge Discovery (FSKD 2010), Yantai, China, 10–12 August 2010; IEEE: Shanghai, China, 2010; pp. 2834–2838. [Google Scholar] [CrossRef]
  73. Belle, M.A.; Antwi, C.O.; Ntim, S.Y.; Affum-Osei, E.; Ren, J. Am I Gonna Get a Job? Graduating Students’ Psychological Capital, Coping Styles, and Employment Anxiety. J. Career Dev. 2021. [Google Scholar] [CrossRef]
  74. Antwi, C.O.; Belle, M.A.; Ntim, S.Y.; Wu, Y.; Affum-Osei, E.; Aboagye, M.O.; Ren, J. COVID-19 Pandemic and International Students’ Mental Health in China: Age, Gender, Chronic Health Condition and Having Infected Relative as Risk Factors. Int. J. Environ. Res. Public Health 2022, 19, 7916. [Google Scholar] [CrossRef]
  75. Fowler, F.J. Survey Research Methods, 5th ed.; SAGE Publications, Inc.: Los Angeles, CA, USA, 2014. [Google Scholar]
  76. Liou, J.J.; Tang, C.-H.; Yeh, W.-C.; Tsai, C.-Y. A decision rules approach for improvement of airport service quality. Expert Syst. Appl. 2011, 38, 13723–13730. [Google Scholar] [CrossRef]
  77. Park, Y. An analysis for the competitive strength of Asian major airports. J. Air Transp. Manag. 2003, 9, 353–360. [Google Scholar] [CrossRef]
  78. Dong, P.; Siu, N.Y.-M. Servicescape elements, customer predispositions and service experience: The case of theme park visitors. Tour. Manag. 2013, 36, 541–551. [Google Scholar] [CrossRef]
  79. Ahn, J.A.; Seo, S. Consumer responses to interactive restaurant self-service technology (IRSST): The role of gadget-loving propensity. Int. J. Hosp. Manag. 2018, 74, 109–121. [Google Scholar] [CrossRef]
  80. Zeithaml, V.A.; Berry, L.L.; Parasuraman, A. The Behavioral Consequences of Service Quality. J. Mark. 1996, 60, 31. [Google Scholar] [CrossRef]
  81. Newman, A.J. Uncovering Dimensionality in the Servicescape: Towards Legibility. Serv. Ind. J. 2007, 27, 15–28. [Google Scholar] [CrossRef]
  82. Brislin, R.W. Back-translation for cross-cultural research. J. Cross-Cult. Psychol. 1970, 1, 185–216. [Google Scholar] [CrossRef]
  83. Squires, A.; Aiken, L.H.; Heede, K.V.D.; Sermeus, W.; Bruyneel, L.; Lindqvist, R.; Schoonhoven, L.; Stromseng, I.; Busse, R.; Brzostek, T.; et al. A systematic survey instrument translation process for multi-country, comparative health workforce studies. Int. J. Nurs. Stud. 2012, 50, 264–273. [Google Scholar] [CrossRef]
  84. Dewil, R.; Appels, L.; Baeyens, J. Energy use of biogas hampered by the presence of siloxanes. Energy Convers. Manag. 2006, 47, 1711–1722. [Google Scholar] [CrossRef]
  85. Hair, J.F.; Black, W.C.; Babin, B.J.; Anderson, R.E. Multivariate Data Analysis, 7th ed.; Prentice-Hall, Inc.: Upper Saddle River, NJ, USA, 2010. [Google Scholar]
  86. Allison, P.D. Missing Data Techniques for Structural Equation Modeling. J. Abnorm. Psychol. 2003, 112, 545–557. [Google Scholar] [CrossRef]
  87. Podsakoff, P.M.; MacKenzie, S.B.; Lee, J.Y.; Podsakoff, N.P. Common method biases in behavioral research: A critical review of the literature and recommended remedies. J. Appl. Psychol. 2003, 88, 879–903. [Google Scholar] [CrossRef]
  88. Tehseen, S.; Ramayah, T.; Sajilan, S. Testing and Controlling for Common Method Variance: A Review of Available Methods. J. Manag. Sci. 2017, 4, 142–168. [Google Scholar] [CrossRef]
  89. Field, A. Discovering Statistics Using IBM SPSS Statistics, 2nd ed.; SAGE Publications, Inc.: London, UK, 2005. [Google Scholar]
  90. Jackson, D.L.; Gillaspy, J.A., Jr.; Purc-Stephenson, R. Reporting practices in confirmatory factor analysis: An overview and some recommendations. Psychol. Methods 2009, 14, 6–23. [Google Scholar] [CrossRef]
  91. Henseler, J.; Ringle, C.M.; Sarstedt, M. A new criterion for assessing discriminant validity in variance-based structural equation modeling. J. Acad. Mark. Sci. 2015, 43, 115–135. [Google Scholar] [CrossRef]
  92. Frazier, P.A.; Tix, A.P.; Barron, K.E. Testing Moderator and Mediator Effects in Counseling Psychology Research. J. Couns. Psychol. 2004, 51, 115–134. [Google Scholar] [CrossRef]
  93. Meng, B.; Choi, K. Theme restaurants’ servicescape in developing quality of life: The moderating effect of perceived authenticity. Int. J. Hosp. Manag. 2017, 65, 89–99. [Google Scholar] [CrossRef]
  94. Lin, I.Y.; Mattila, A.S. Restaurant Servicescape, Service Encounter, and Perceived Congruency on Customers’ Emotions and Satisfaction. J. Hosp. Mark. Manag. 2010, 19, 819–841. [Google Scholar] [CrossRef]
  95. Tam, J.L. Brand familiarity: Its effects on satisfaction evaluations. J. Serv. Mark. 2008, 22, 3–12. [Google Scholar] [CrossRef]
  96. Chiang, C.-F.; Jang, S.C. An expectancy theory model for hotel employee motivation. Int. J. Hosp. Manag. 2008, 27, 313–322. [Google Scholar] [CrossRef]
  97. Saks, A.M. Antecedents and consequences of employee engagement. J. Manag. Psychol. 2006, 21, 600–619. [Google Scholar] [CrossRef]
  98. Prentice, C.; Kadan, M. The role of airport service quality in airport and destination choice. J. Retail. Consum. Serv. 2018, 47, 40–48. [Google Scholar] [CrossRef]
  99. Kuppens, P.; Stouten, J.; Mesquita, B. Individual differences in emotion components and dynamics: Introduction to the Special Issue. Cogn. Emot. 2009, 23, 1249–1258. [Google Scholar] [CrossRef]
  100. Prentice, R.; Guerin, S.; McGugan, S. Visitor learning at a heritage attraction: A case study of Discovery as a media product. Tour. Manag. 1998, 19, 5–23. [Google Scholar] [CrossRef]
  101. Cutler, S.E.; Larson, R.J.; Bunce, S.C. Ropressive Coping Style and the Experience and Recall of Emotion: A Naturalistic Study of Daily Affect. J. Pers. 1996, 64, 379–405. [Google Scholar] [CrossRef]
  102. Salancik, G.R.; Pfeffer, J. An Examination of Need-Satisfaction Models of Job Attitudes. Adm. Sci. Q. 1977, 22, 427. [Google Scholar] [CrossRef]
  103. Dowds, J.; Aultman-Hall, L.; LaMondia, J.J. Comparing alternative methods of collecting self-assessed overnight long-distance travel frequencies. Travel Behav. Soc. 2020, 19, 124–136. [Google Scholar] [CrossRef]
Figure 1. The theoretical model.
Sustainability 14 10114 g001
Figure 2. Post hoc analysis of the mediation role of passengers’ positive emotion in SSoS- and CsoS -satisfaction links. Note: β—standardized regression weights, CR—critical ratios, CI—confidence interval, SE—standardized error, *** p < 0.001, ** p < 0.01, * p < 0.05.
Sustainability 14 10114 g002
Table 1. Sample demographics (n = 387).
Respondents’ DemographicsDescriptive Statistics
Frequency (%)Mean ± SD
Demographic Profile of Travelers
Gender
        Men186 (48.06%)
        Women201 (51.94%)
Age category 34.79 ± 9.11
        <30 years92 (23.77%)
        30 to 39139 (35.92%)
        ≥40156 (40.31%)
Educational level
        Junior High School63 (16.28%)
        High/Technical School103 (26.61%)
        College/Undergraduate/Diploma128 (33.07%)
        Masters+93 (24.03%)
Travel purpose
        Business91 (23.51%)
        Education112 (28.94%)
        Leisure184 (47.55%)
Travel Frequency 3.13 ± 1.21
        Low158 (40.83%)
        Moderate113 (29.20%)
        High116 (29.97%)
Table 2. Items’ sources, descriptive statistics, and CFA factor loadings (n = 387).
AuthorsItemsDescriptive and Normality StatisticsCFA Loadings
Mean ± SDSkew, Kurtγ [CR]95% CI (L, U)
[12,57]Substantive servicescape (SSoS)
FUNC 1. This airport provided comfortable and spacious seating in the waiting areas.3.9 ± 0.92-1.35, 2.390.92 [------]0.85, 0.95
FUNC 2. The signs and electronic displays provide information accurately and clearly.3.9 ± 0.89-1.49, 3.110.87 [30.83]0.82, 0.92
FUNC 3. The electronics facilities (e.g., television screens, electronic billboards) add excitement to the airport.4.03 ± 1.01-1.31, 2.390.88 [30.98]0.83, 0.92
FUNC 4. The airport provided internet/Wi-Fi connectivity.3.95 ± 0.93-1.44, 2.950.94 [37.87]0.92, 0.96
FUNC 5. The airport provided international power sockets for charging electronic devices.3.99 ± 0.90-1.31, 1.640.90 [32.94]0.87, 0.92
FUNC 6. The elevators, electronic walkways and other services were properly working.3.96 ± 0.95-1.32, 2.110.90 [32.83]0.83, 0.94
FA&A 1. The color schemes within the airport were attractive.3.85 ± 0.90-0.82, 0.510.91 [-------]0.85, 0.93
FA&A 2. The architecture and decoration of the airport were
appealing.
3.78 ± 1.00-1.10, 0.860.84 [26.10]0.77, 0.89
FA&A 3. The brightness within the airport was welcoming.3.44 ± 1.19-0.44, -0.750.51 [12.21]0.43, 0.59
FA&A 4. Temperature within the airport was comfortable.3.78 ± 0.96-0.83, 0.410.93 [32.54]0.87, 0.95
FA&A 5. The background music within the airport was appropriate.3.77 ± 0.96-0.98, 0.830.77 [22.27]0.71, 0.82
FA&A 6 The aroma within the airport was pleasant.3.7 ± 0.98-0.89, 0.810.71 [19.23]0.62, 0.78
LA 1. The airport’s signs clearly directed me to services such as parking, car rentals, terminals, ATM etc.3.43 ± 1.07-0.63, -0.170.75 [-------]0.69, 0.81
LA 2. Baggage trolleys were available and conveniently located.3.46 ± 1.04-0.44, -0.250.94 [20.94]0.91, 0.96
LA 3. Well-known retail and dining options were available and conveniently located.3.62 ± 0.96-0.53, -0.090.73 [16.53]0.66, 0.79
LA 4. The layout was properly managed to avoid passenger crowding and easy movement.3.50 ± 1.02-0.49, -0.030.76 [17.26]0.70, 0.81
CLEAN 1. Restrooms and bathrooms in the airport were kept clean.3.31 ± 1.11-0.51, -0.580.78 [-------]0.72, 0.83
CLEAN 2. Retail, dining and entertainment areas were kept clean.3.59 ± 0.98-0.80, 0.540.87 [19.54]0.83, 0.90
CLEAN 3. Walkways, exits and baggage claim areas were kept clean.3.62 ± 1.05-0.70, 0.050.75 [16.94]0.69, 0.81
CLEAN 4. Overall, the airport environment was hygienic.3.29 ± 1.14-0.46, -0.560.74 [16.53]0.66, 0.80
[45,50]Communicative servicescape (CSoS)
HC 1. Airport staff were helpful.3.43 ± 1.11-0.46, -0.480.87 [-------]0.82, 0.91
HC 2. Airport staff were friendly and courteous.3.40 ± 1.13-0.30, -0.710.95 [29.00]0.91, 0.97
HC 3. Airport staff were efficient.3.46 ± 1.19-0.36, -0.830.74 [19.81]0.67, 0.80
HC 4. Airport staff communicate in the language I understand.3.11 ± 1.16-0.09, -0.850.59 [14.38]0.50, 0.67
LC 1. The airport terminal brings the local culture to me.3.61 ± 1.17-0.85, -0.110.91 [-------]0.83, 0.95
LC 2. Chinese “flavors” can be sensed almost everywhere in the terminal.3.65 ± 1.13-0.95, 0.220.82 [23.93]0.75, 0.89
LC 3. Chinese designs, arts, and symbols can be seen at the terminal.3.74 ± 1.08-0.86, 0.220.72 [19.10]0.62, 0.81
LC 4. Airport staffs’ uniforms are distinctively Chinese.3.65 ± 1.14-0.88, 0.090.84 [24.49]0.72, 0.90
LC 5. The airport reflects the national identity of China.3.85 ± 1.08-0.94, 0.430.33 [7.23]0.22, 0.44
[5]Passengers’ positive emotion
Pleasure-
PPE 1. Happy-unhappy5.12 ± 1.54-0.88, 0.060.78 [-------]0.78, 0.82
PPE 2. Pleased-annoyed4.30 ± 1.73-0.09, -0.860.79 [18.73]0.74, 0.83
PPE 3. Satisfied-unsatisfied5.01 ± 1.56-0.67, -0.290.66 [15.03]0.57, 0.73
PPE 4. Hopeful-despairing4.77 ± 1.55-0.18, -0.910.75 [17.66]0.69, 0.80
[67]Passengers’ Behavioral Loyalty
Recommend
RC 1. Say positive things about this airport to others.3.35 ± 1.11-0.33, -0.590.81 [-------]0.75, 0.85
RC 2. Recommend this airport to someone who seeks my advice.3.37 ± 1.08-0.25, -0.570.93 [23.40]0.90, 0.96
RC 3. Encourage friends and relatives to use this airport.3.45 ± 1.14-0.32, -0.700.84 [21.09]0.78, 0.88
Repeat Purchase.
RP 1. Consider this airport my first choice when traveling.4.96 ± 1.33-0.61, 0.290.83 [-------]0.76, 0.88
RP 2. Travel more with this airport in the next few years.4.99 ± 1.24-0.57, 0.820.78 [18.13]0.72, 0.80
Pay More
PM 1. Continue to travel with this airport even if its prices (charges) increase somewhat.4.44 ± 1.480.02, -0.220.67 [-------]0.57, 0.76
PM 2. Pay a higher price than other airports’ charges for the benefits you currently receive from this airport.4.16 ± 1.550.05, -0.110.83 [12.02]0.75, 0.90
[80]Spend More
SP 1. Overall, I like the shopping atmosphere at the airport.3.35 ± 1.11-0.32, -0.590.85 [-------]0.80, 0.88
SP 2. I will enjoy shopping in this airport terminal.3.37 ± 1.08-0.25, -0.570.89 [24.15]0.86, 0.91
SP 3. I will happily spend extra time browsing.3.45 ± 1.14-0.32, -0.700.85 [22.85]0.80, 0.90
SP 4. I will be inclined to spend more money in the shops.3.22 ± 1.16-0.21, -0.810.71 [17.66]0.65, 0.77
[67]Airport Passenger Satisfaction
SAT 1. I am satisfied with my decision to use this airport.3.87 ± 0.88-0.84, 0.770.76 [-------]0.68, 0.82
SAT 2. If I had to do it all over again, I would use this airport.4.00 ± 0.82-0.89, 1.330.84 [18.99]0.78, 0.90
SAT 3. My choice to use this airport was a wise one.3.83 ± 1.02-0.92, 0.390.74 [16.48]0.79, 0.79
SAT 4. I think I did the right thing when I decided to use this airport.3.86 ± 0.91-0.69, 0.390.70 [15.55]0.63, 0.76
Note: FUNC—functionality, FA&A—facility ambiance and aesthetics, LA—layout accessibility, CLEAN—cleanliness, HC—helpfulness and communication, LC—local culture, PPE—passengers’ positive emotion, RC—recommend, RP—repeat purchase, PM—pay more, SP—spend more, SAT—satisfaction, γ—CFA factor loadings.
Table 3. Constructs’ validity, reliability, and correlation coefficients.
Constructs’ Validity and ReliabilityIntern-Construct Correlation Coefficients
CRaAVEMSV123456789101112
1. PM0.730.720.570.340.76
2. PPE0.930.930.560.540.58 ***0.75
3. FUNC0.960.960.810.170.27 **0.16 *0.90
4. FA&A0.910.890.620.370.080.19 *0.27 **0.79
5. CLEAN0.870.860.620.440.29 **0.050.030.010.79
6. SP0.900.890.680.170.000.010.060.050.15 *0.83
7. LC0.860.850.570.250.50 ***0.020.000.050.22 **0.11 *0.75
8. LA0.880.870.640.430.14 *0.040.050.010.050.29 **0.28 **0.800
9. SAT0.880.880.690.540.44 ***0.74 ***0.24 **0.25 **0.040.31 **0.35 ***0.030.77
10. HC0.870.860.640.430.15 *0.010.41 ***0.020.020.27 **0.27 **0.66 ***0.21 **0.80
11. RC0.890.900.740.370.020.070.040.61 ***0.36 ***0.42 ***0.15 *0.40 ***0.58 ***0.52 ***0.86
12. RP0.720.710.600.440.48 ***0.20 **0.10 *0.10 *0.66 ***0.010.23 **0.210.16 *0.27 **0.040.77
Note: CR—composite reliability, a—Cronbach alpha, AVE—average variance explained, MSV—maximum shared variance, PM—pay more, PPE—passengers’ positive emotion, FUNC—functionality, FA&A—facility ambiance and aesthetics, CLEAN—cleanliness, SP—spend more, LC—local. *** p < 0.001, ** p < 0.01, * p < 0.05.
Table 4. Results for the substantive model.
Covariates, Predictors and ModeratorStandardized Estimates (Critical Ratios)
Model1Model2
PPESATRPRCPMSP
Level 1 covariates
Gender b-0.20 (-6.16) ***0.00 (05) NS0.02 (0.42)0.09 (2.69) **0.01 (0.27)0.04 (0.82)
Age -0.06 (-1.87) NS0.00 (.08) NS0.01 (.34)-0.01 (-0.17)-0.03 (-0.74)-0.07 (-1.59)
Education b-0.09 (-2.74) **-0.04 (-1.09) NS-0.03 (-0.79)-0.11 (-3.48) ***0.10 (2.30) *0.10 (2.28) *
Purpose of Travel c-0.01 (-0.28) NS-0.12 (-3.24) **0.05 (1.30)0.01 (0.46)0.03 (0.58)-0.06 (-1.41)
Linear Relations
SSOS0.64 (19.97) ***0.48 (12.74) ***
CSOS0.18 (5.59) ***0.22 (5.73) ***
Passengers’ Positive Emotion 0.38 (6.71) ***0.45 (9.83) ***0.12 (1.91) *0.26 (4.23) ***
Passenger Satisfaction 0.17 (3.03) **0.30 (6.45) ***0.22 (3.47) ***0.04 (0.57) NS
Interaction Effects
Travel Frequency (TF)-0.07 (-2.16) *-0.06 (-1.45) NS
SSOS*TF-0.05 (-0.39) NS-0.20 (-1.97) *
CSOS*TF0.10 (.78) NS0.33 (2.22) **
Travel Frequency (TF) 0.37 (2.91) **0.21 (2.04) **0.031 (2.85) **0.08 (1.51)
Passengers’ Positive Emotion * TF -0.13 (-2.05) **-0.11 (-1.97) *-0.19 (-3.09) ***0.08 (-1.07)
Passenger Satisfaction * TF 0.17 (3.08) ***-0.09 (-1.78) *0.20 (3.13) ***-0.22 (-3.76) ***
χ2/df2.36 ê/3.95 ë3.88 ê/5.82 ë
SRMR0.04 ê/0.06 ë0.06 ê/0.07 ë
CFI0.98 ê/0.98 ë0.95 ê/0.97 ë
TLI0.96 ê/0.95 ë0.92 ê/0.90 ë
RMSEA0.05ê/0.06ë 0.06 ê/0.07 ë
Note: Critical covariates (a). 1 = Male, 2 = Female (b). 1 = junior high school, 2 = high/technical or vocational school, 3 = college/university, 4 = master’s or above (c). 1 = business, 2 = education, 3 = leisure; age and travel frequency (TF) were measured as continuous variables. SAT—Passenger Satisfaction, RP—repeat visit, PM—pay more, RC—recommend, SP—spend more, PPE—passengers’ positive emotion. NS—non-significant; ê—fit indices for the model that assessed the direct effects; ë—fit indices for the model that assessed the interaction effects; —dummy-coded variables; —categorical variables; —variables measured as continuous 1. Predictors and moderators were mean-centered before the analysis, as recommended by Frazier et al., [92]. *** p < 0.001, ** p < 0.01, * p < 0.05.
Table 5. Alternative model.
PathsβCRCISEp-Values
SSOS-Passengers’ positive emotion0.6420.090.59, 0.690.01<001
CSOS-Passengers’ positive emotion0.185.650.12, 0.250.04<001
SSOS-Passenger Satisfaction0.4812.550.40, 0.550.01<001
CSOS-Passenger Satisfaction0.235.890.14, 0.320.01<001
SSOS-Repeat Purchase0.5314.130.42, 0.620.03<001
CSOS-Repeat Purchase0.164.310.09, 0.230.03<001
SSOS-Recommend0.5515.020.47, 0.610.02<001
CSOS-Recommend0.133.470.05, 0.200.03<001
SSOS-Pay More0.297.110.19, 0.390.05<001
CSOS-Pay More0.266.170.18, 0.330.05<001
SSOS-Spend More0.173.950.07, 0.270.04<001
CSOS-Spend More0.255.730.14, 0.340.04<001
Note: β—standardized regression weights, CR—critical ratios, CI—confidence interval, SE—standardized error.
Publisher’s Note: MDPI stays neutral with regard to jurisdictional claims in published maps and institutional affiliations.

