Article

Spatio-Temporal Variation of Habitat Quality for Bird Species in China Caused by Land Use Change during 1995–2015

1
Department of Tourism Management, Jinzhong University, Jinzhong 030619, China
2
Science and Technology Innovation and Public Management Research Center of Shanghai, Fudan University, Shanghai 200433, China
3
College of Public Administration, Huazhong University of Science and Technology, Wuhan 430079, China
4
School of Management, Wuhan Institute of Technology, Wuhan 430205, China
*
Authors to whom correspondence should be addressed.
Sustainability 2022, 14(16), 10078; https://doi.org/10.3390/su141610078
Submission received: 13 July 2022 / Revised: 10 August 2022 / Accepted: 11 August 2022 / Published: 15 August 2022
(This article belongs to the Special Issue Sustainable Land Use and Management)

Abstract

:
The analysis of land use change (LUC) has become an important criterion for evaluating the impact of human activities on the natural environment. Habitat loss and degradation caused by LUC are the main threats to biodiversity worldwide. Research on the impact of long-term, wide-scope, and fine-scale LUC on bird habitats is currently limited due to a lack of adequate data. In this study, conducted in China, 9 km grid units were sampled randomly between 1995 and 2015. Logistic regression was used to calculate the probability that each unit grid contained suitable habitat (hereinafter, abbreviated as PGSH) for 981 bird species and analyze the spatial-temporal characteristics of PGSH accordingly. The results showed that: (1) The habitat quality of 84 bird species deteriorated, but for 582 bird species, habitat quality improved. (2) There is an inverted U-shaped relationship between the intensity of LUC and the PGSH. The LUC intensity threshold is approximately 67.21%. (3) Based on the counterfactual scenario analysis, the construction of the Three North Shelterbelt has increased the PGSH for all bird species from 20.76% before restoration to 21.38% after restoration. Within the LUC grid representing the transformation of farmland back to forests, the average PGSH for all birds increased from 73.97% to 75.04%. These results may provide a reference for measuring the impacts of LUC on bird species, enabling the protection of bird species and habitats that need it most.

1. Introduction

Humans and other living creatures depend on our natural environment for survival. Natural landscapes have undergone a long-term transformation, largely as a result of increasing human populations and their associated activities; consequently, land use has changed greatly over time. Unreasonable utilization of land resources has caused a series of major global problems, such as environmental pollution, vegetation destruction, land degradation, species extinction, and resource scarcity [1,2].
The analysis of LUC has become an important criterion for evaluating the impact of human activities on the natural environment [3]. The driving factors of land use change are complex. They are not only affected by natural factors, such as climate, land slope, and drought [4,5,6], but also affected by social and economic factors, of which population growth, economic development, urbanization process, and improvement of traffic conditions are of particular concern [7,8]. Habitat loss and degradation caused by the transformation of land use are the main threats to biodiversity worldwide [9,10,11]. Habitats provide important resources for all living organisms, such as sufficient food resources, suitable breeding sites, protection from natural enemies, and challenging climatic conditions. Among wildlife species, birds are highly sensitive to habitat changes, and can therefore act as indicators of habitat changes [12,13]. With the advancement of urbanization, habitat reduction and habitat fragmentation caused by economic development and human activities are having increasing impacts on bird communities [14,15,16,17], which also impacts species composition [18,19,20], predation behaviors [21], and migration paths. Studies have found that the number of birds in North America has decreased by around 29% since 1970, equivalent to nearly 3 billion birds, with habitat loss being the main reason for this steep decline [2].
With growing economies and urbanization, the trend of land use change in developing countries represented by China is more obvious than that in Western developed countries [22]. In the last few decades, great changes have taken place in the land use pattern of developing countries. Large areas of undeveloped land around urban centers, such as cultivated land, forests, and wetlands, have been urbanized, which is a rapidly expanding trend in China. It is the large availability of undeveloped land that has supported the urbanization process and brought about great economic achievements since China’s reform. However, the drastic changes in land use have affected avian habitat, which poses a huge threat to bird communities. There is a close relationship between the living conditions of birds and their habitats. The conditions of the habitats will affect all stages of the life stage of birds [23]. The food sources, activity sites, and breeding sites that are indispensable for the survival of birds depend on the habitat environment. However, land use may directly reduce the land types that birds mainly depend on, such as forests, wetlands, and swamps, resulting in the fragmentation and loss of habitats and further affecting the species distribution pattern [24], accelerating species extinction [25] and reducing bird biodiversity [26]. This issue has attracted extensive attention of scholars. In 1999, the first review paper on birds’ habitat selection in China was published, which is a phased summary of avian habitat research in China and the prospects for future research [27]. The China Biodiversity Red List, released in 2015, showed that habitat degradation and loss caused by deforestation, alternative planting of an economic forest, and wetland reclamation is the key factor affecting avian survival, accounting for 80.8% of all factors [28]. In recent years, due to the acceleration of urbanization and the increase of land use intensity, the overwintering habitat of Red Crowned Crane in Northern Jiangsu Province, located in the eastern province, has gradually decreased, posing a serious threat to the survival of the Red Crowned Crane population [29]. The decrease of birds in Hainan Island, in the southern tropics of China, is mainly due to urban development [30]. Coastal wetland areas in the subtropical region of Xiamen have decreased, and many wetland birds that rely on coastal wetlands for survival and reproduction have lost important habitat [31]. The Yellow River Wetland Nature Reserve, located in the temperate zone in China, has experienced a massive reduction, and the natural reed marshes and tidal flats have been reclaimed into fish ponds, lotus ponds, and rice fields. As a result, the overall area of avian habitat has reduced by 20,000 hectares, and is continually decreasing, leading to the wintering waterfowl in this area being sharply reduced (https://www.sohu.com/a/151012215_351301, accessed on 1 July 2018). These studies and reports highlight the substantial decrease of avian habitat caused by the transformation of land use and the threat that this poses to the survival of many bird species.
Observational changes in bird distribution can help inform on the extinction risks of birds [32]. However, published bird distribution data in China are province-scale based and lack spatial details of avian distribution, which hinders further research [33]. Therefore, a large amount of bird information is collected by professional birdwatchers through field surveys [34], bibliometrics [35], GPS tracking [36], citizen science [37,38], and other methods, which have become the main methods of fine-scale research on avian distribution. However, there are still very few data sources that provide such information on a national scale. China Bird Watching Database [39] and China Biodiversity Observation Network-Birds are two rare national bird observation databases, but both the number of observations and the selection of observation sample areas are far less abundant than EBird. EBird is a bird sighting record database, managed by the Cornell Lab of Ornithology in the US. It is the largest, most comprehensive, and most popular civilian science project related to biodiversity in the world [40]. The EBird Basic Dataset released by EBD_relApr-2019 has more than 600 million observation records, with each record detailing 45 observational attributes, including species name, observation time (including year, month, day, and hour), and observation location represented by longitude and latitude [41]. Therefore, the spatial cover of the data, based on longitude and latitude, and spatial superposition with land use data, can show the temporal and spatial relationship of bird distribution with LUC. Inspired by EBird, BirdReport has been developed for use in China, essentially the Chinese version of EBird.
Using observational and land use data from EBird and BirdReport, we hope to quantitatively answer the following research questions: How much impact does land use change have on bird habitat quality in China? What is the spatial and temporal pattern of this impact? To the best of the author’s knowledge, this study is the first exploration to use fine broad-scale data on the distribution and habitats of bird species in China. It can help to inform on which bird species are most threatened by LUC, which will allow for corresponding measures to protect their habitats.

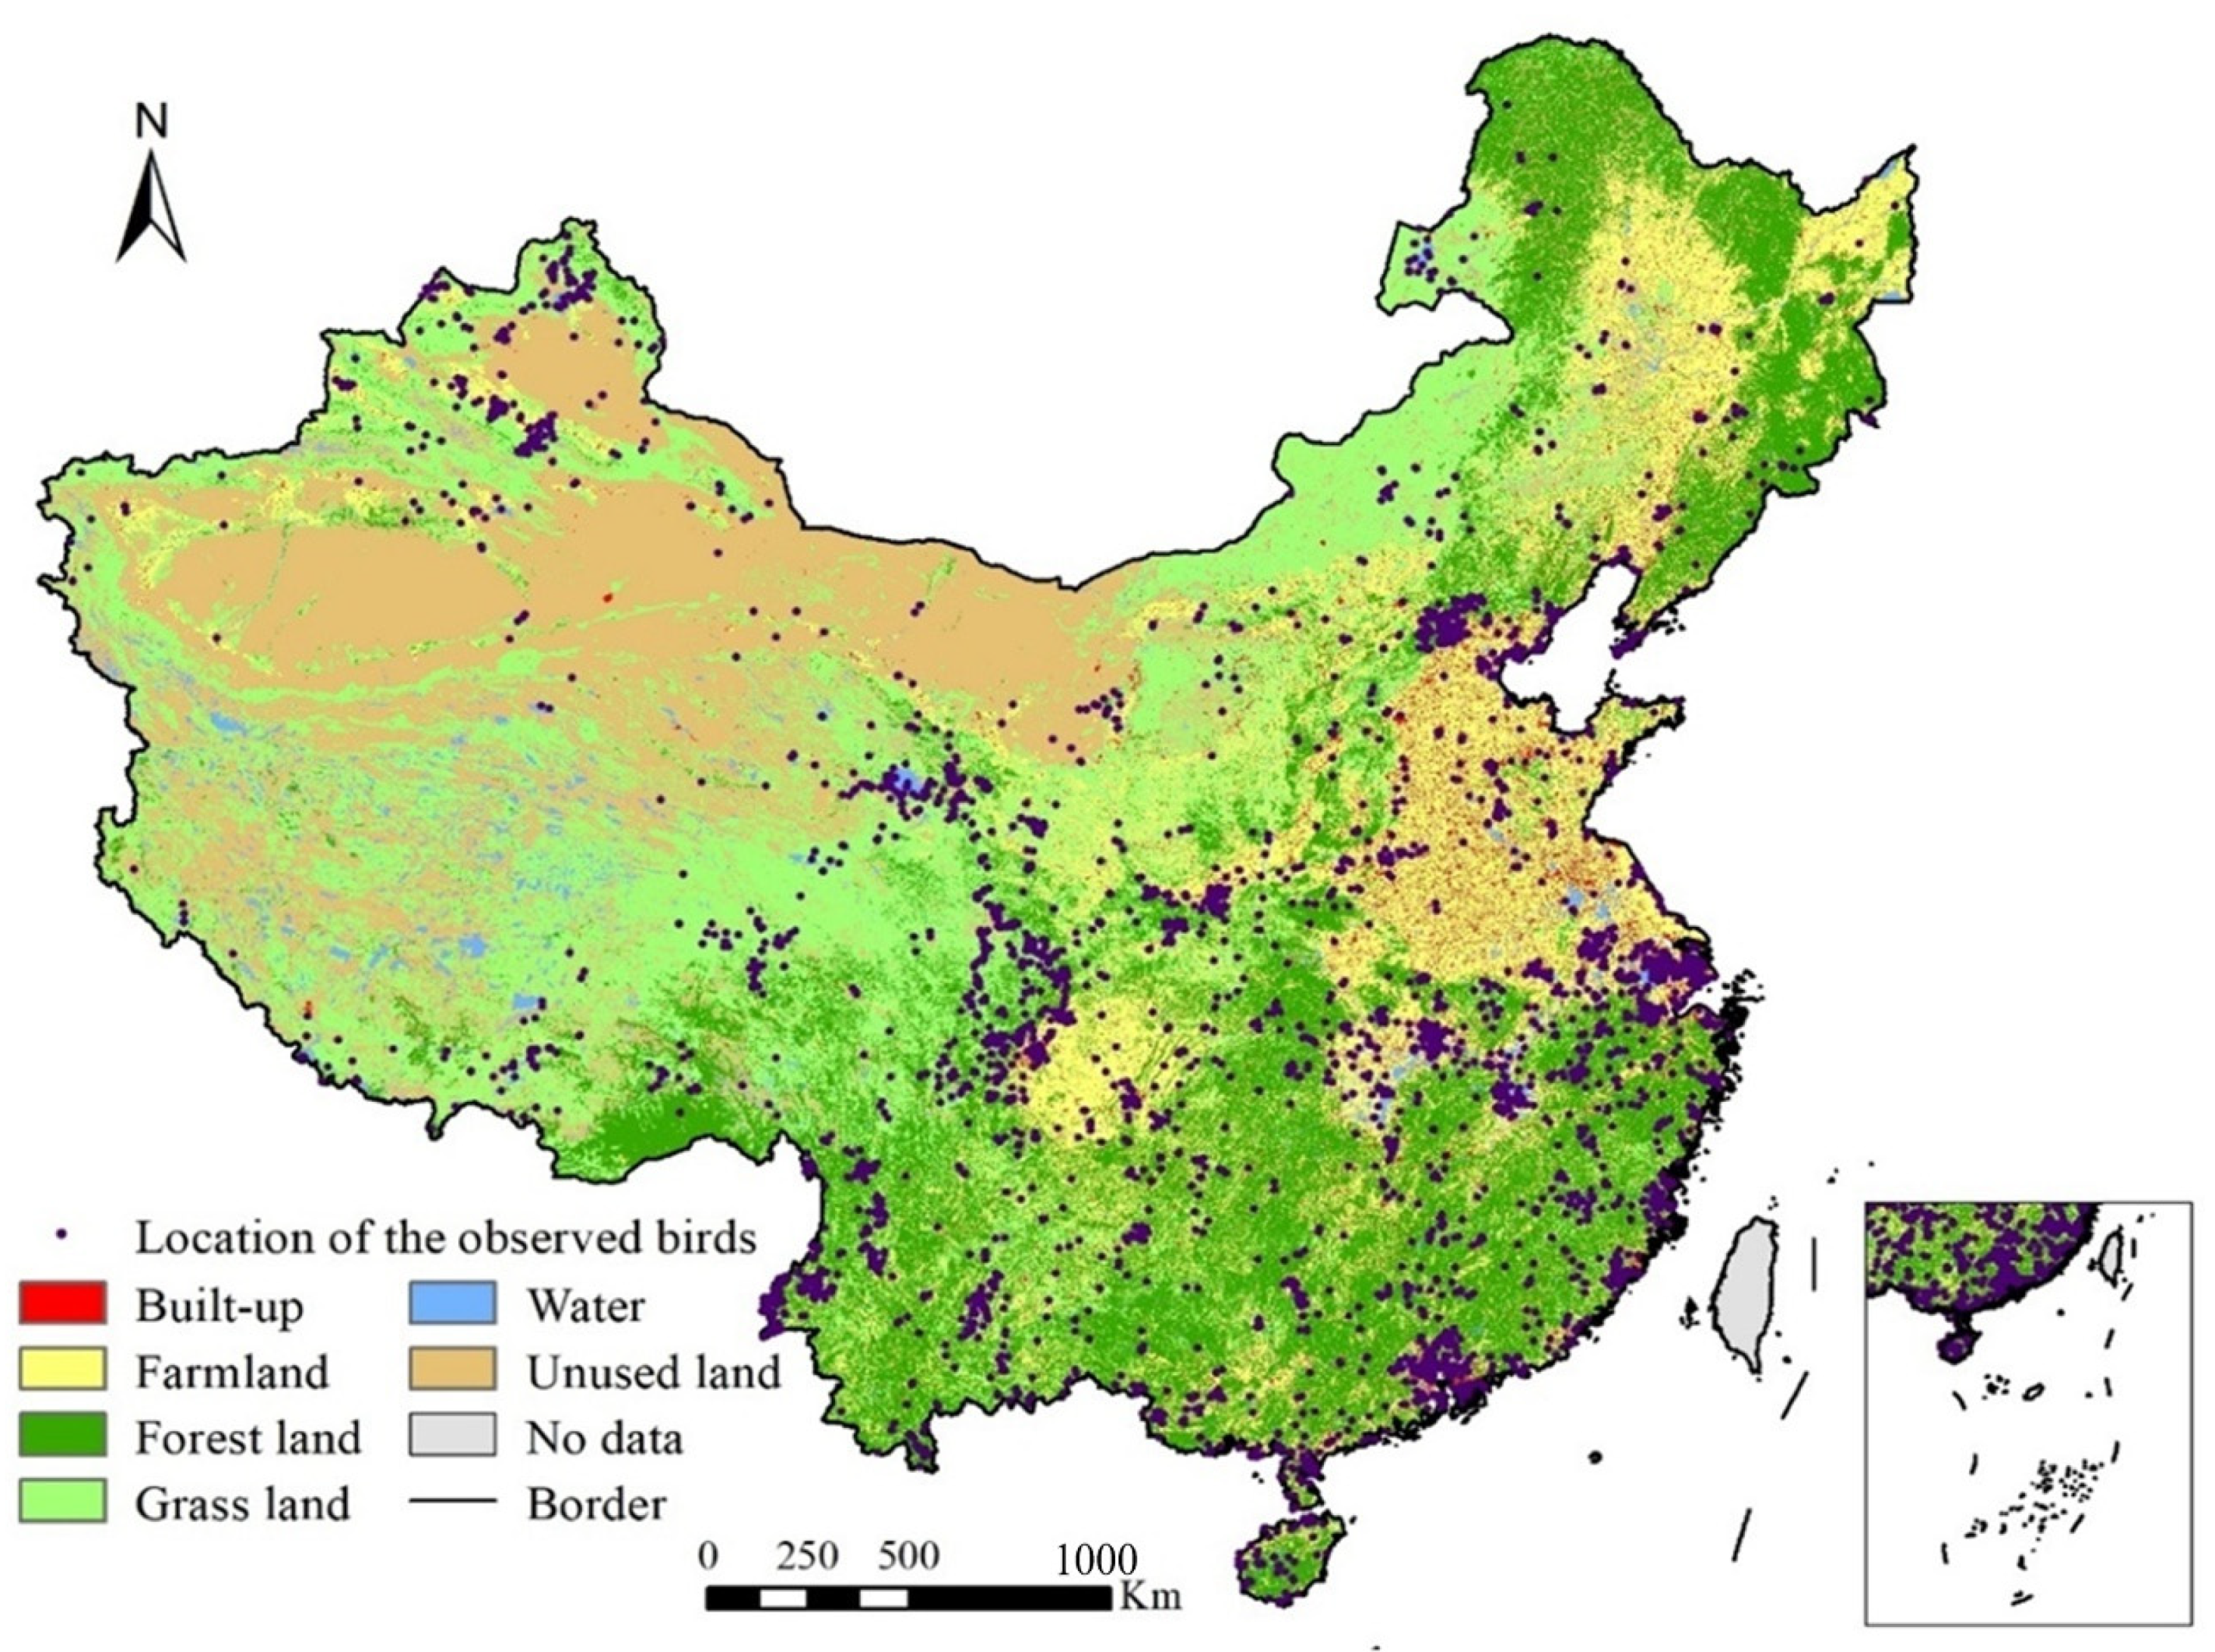
2. Study Area and Data Source
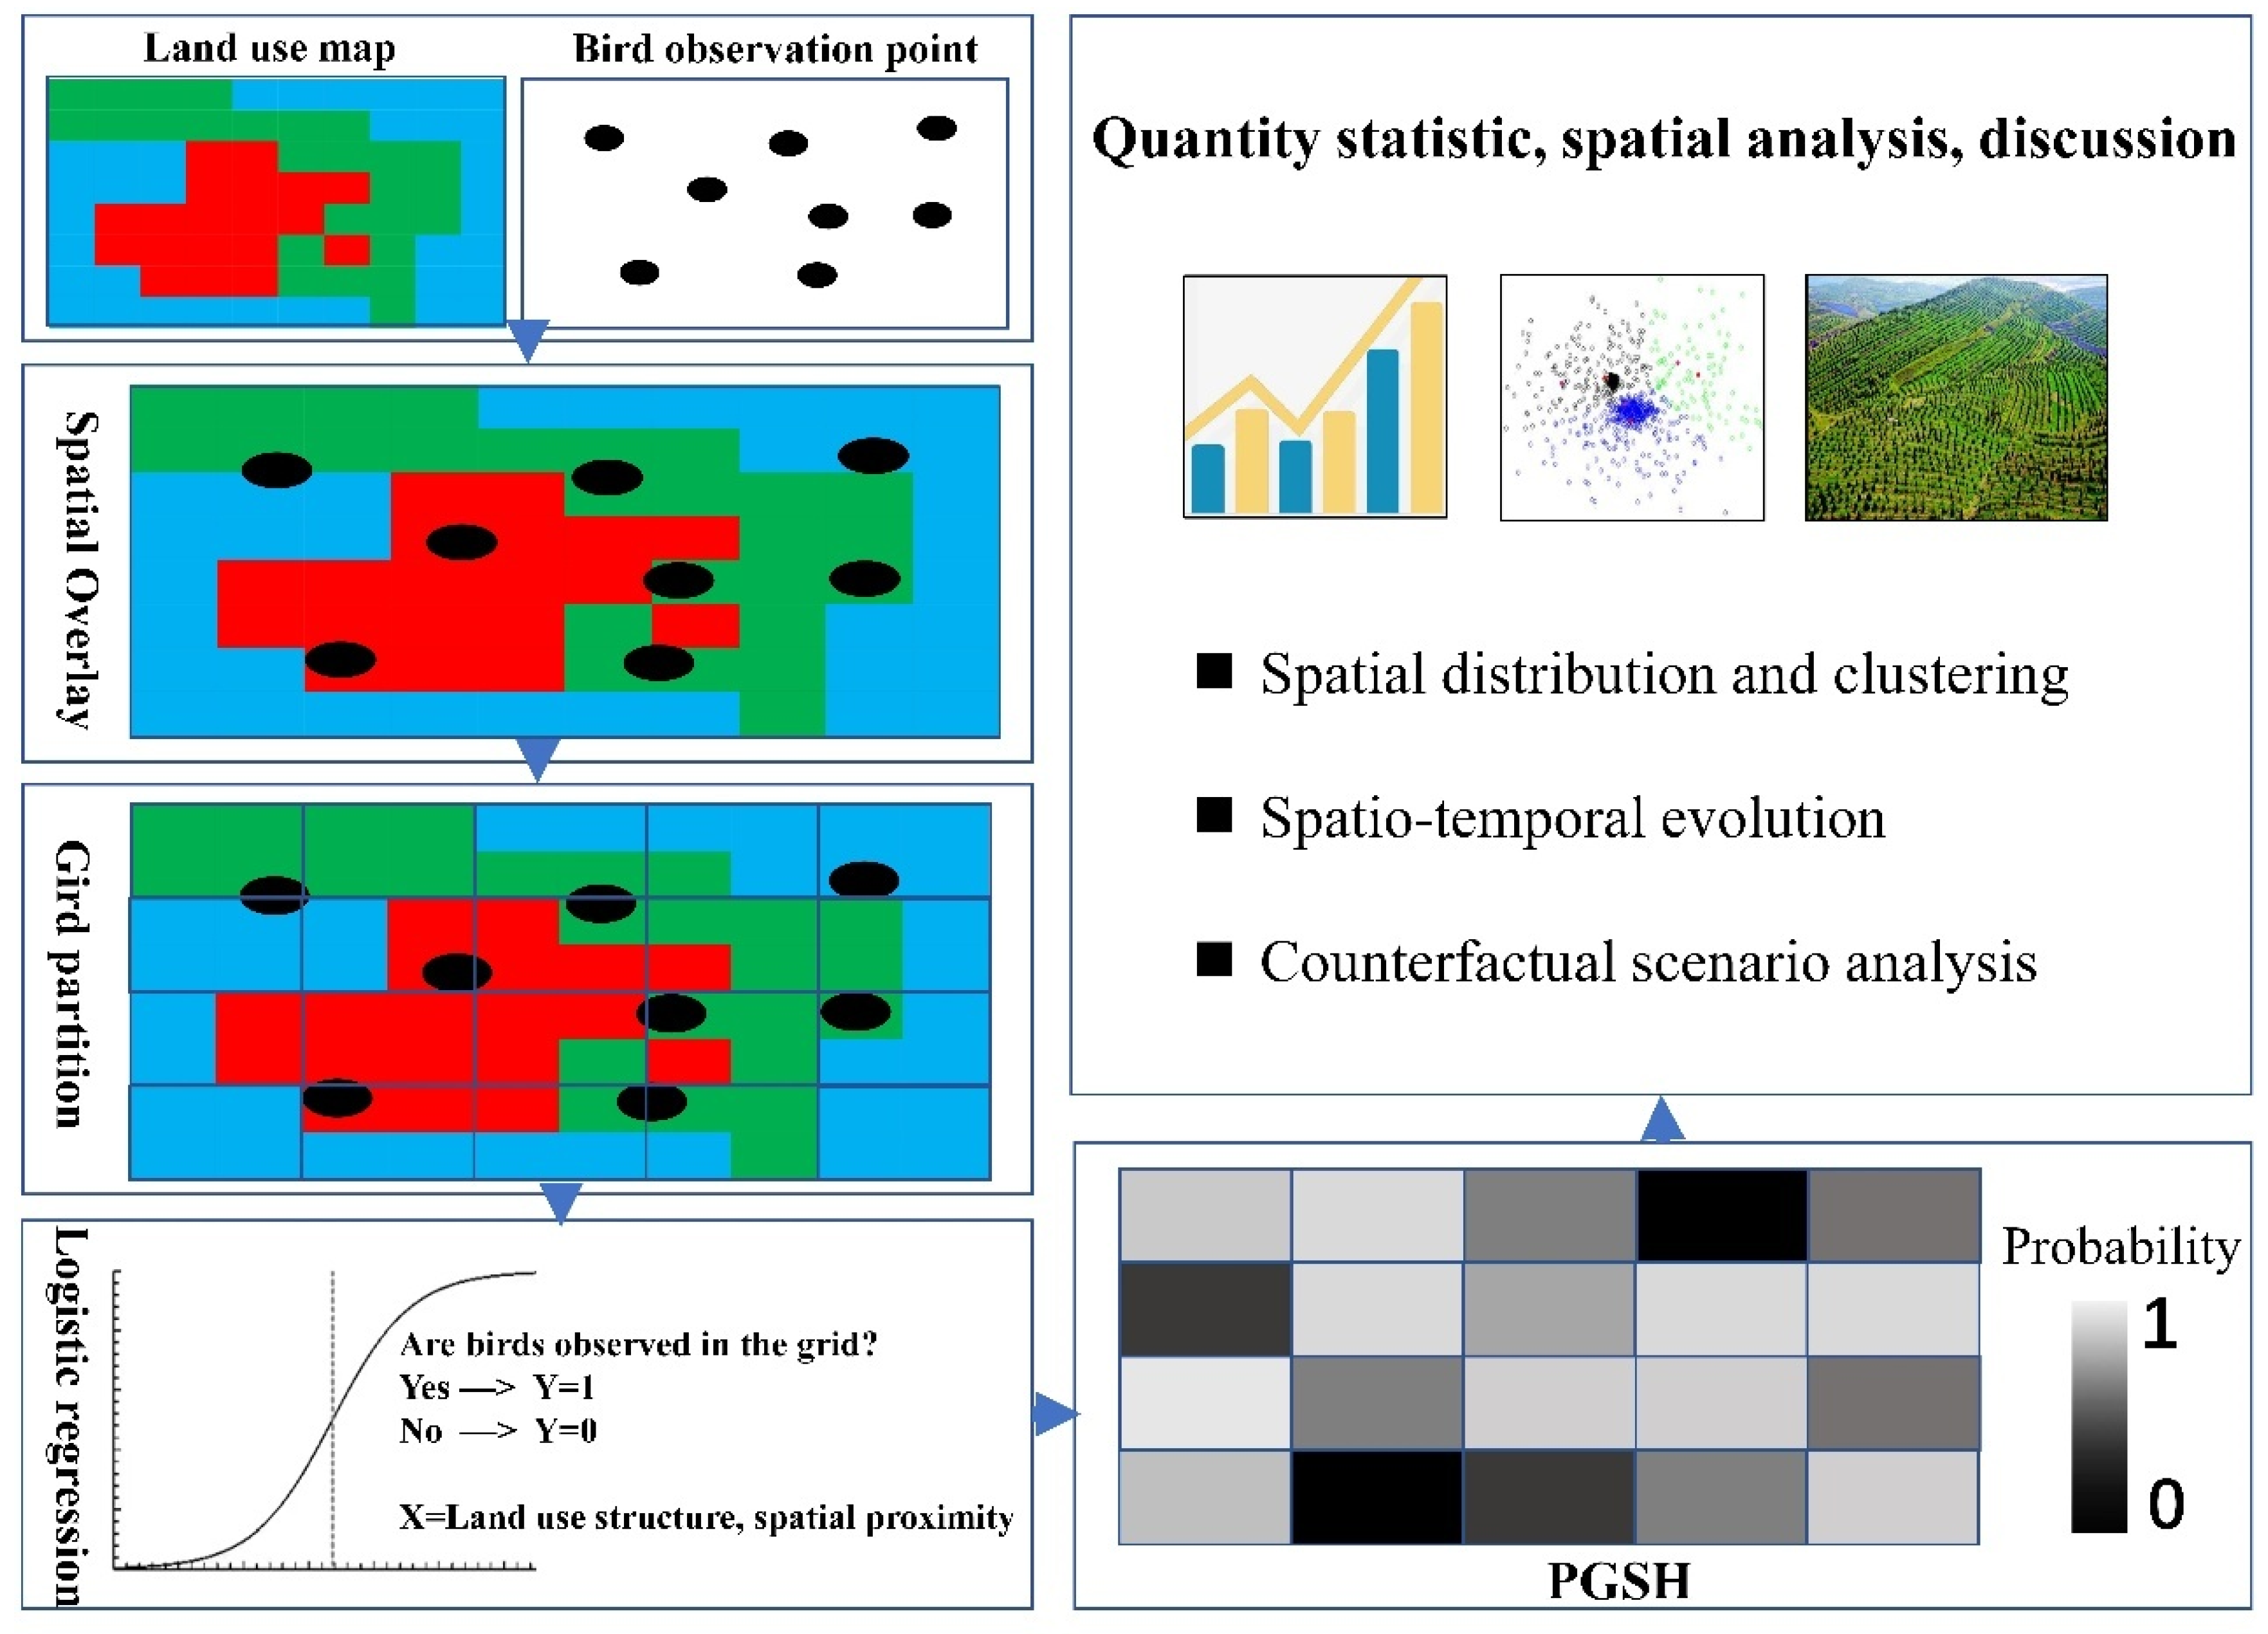
This study was conducted in China from 1995 to 2015. This period was an important stage of China’s economic development. China’s market economic system was set up and the economy developed rapidly shortly after 1995. However, 20 years later, China’s economic growth slowed, and land and space development were restricted [42]. Land use transformation was therefore most prevalent during this period, which made it most appropriate to study the impact of LUC on avian habitats during this period. Data for land use in 1995, 2000, 2005, 2010, and 2015 were selected from the Institute of Geography affiliated with the Chinese Academy of Sciences to investigate spatial and temporal changes of land use. The spatial resolution of these data was 30 m, including six first-class levels: cultivate, forest, grass, water, build-up, and non-use land. This dataset was the most accurate land use data available in China. The accuracy and practicability of the classification have been demonstrated in the literature [43].
The avian observation data originated from EBird (https://ebird.org/home, accessed on 1 June 2019) and BirdReport (www.birdreport.cn, accessed on 1 June 2019). Each dataset contained the attributes longitude and latitude, bird name, and year. According to the observation year of land use data, we extracted records from 1995, 2000, 2005, 2010, and 2015. There were 128,543 records of 1022 species of birds. Records with less than 10 observations were eliminated as they did not meet the required threshold (10) for logistic regression analysis, which left us with 981 birds’ species for analysis. The spatial distribution of land use and avian observation sites is shown in Figure 1.

3. Methodology

Exploring the impact of land use change (LUC) on bird habitat requires an analysis of habitat characteristics, including the structure of the land type, and the preference of spatial proximity. However, what scope is used to calculate the composition and proportion of land use types around each bird observation point, and how should the probability of research units suitable as habitat for specific birds be determined? After answering the above two questions, we can calculate the probability that each unit grid contained suitable habitat (PGSH) over time, then analyze its spatial distribution and spatial-temporal evolution, and detect the impact of LUC policy on bird habitat change. In general, we followed the framework of the methods shown in Figure 2. The details of the methods involved are stated in turn below.
Use grids to divide basic analysis units. Since we need to make statistics on the composition and proportion of land types near each bird observation point, it is necessary to determine a statistical range for each observation point. However, there is no authoritative data to demonstrate the specific activity range of birds, and the collected observation points are not regularly distributed in space, Therefore, we used Thiessen polygon, a method proposed by Dutch climatologist A. H. Thiessen to calculate the average rainfall according to the rainfall of discrete meteorological stations [44]. The rainfall intensity of a unique weather station included in this polygon represents the rainfall intensity in this polygon area. In our case, that is, each polygon represents the statistical range of the habitat of the observation bird, and a total of 119,753 polygons were divided with a radius of approximately 9 km, corresponding to the average polygon area as the grid width, and the grid range as the statistical range. Note that 9 km is not the average radius of activity of the birds, it refers to the statistical range determined in the context of the current distribution of bird observation points.
Use logistic regression to calculate the PGSH: We collected the land use characteristics of the grid where the observation points for where the bird has appeared and has not appeared in 1995, 2000, 2005, 2010, and 2015, respectively. The composition and proportion of various land types of each bird habitat were calculated, along with the distance from cities and water as spatial proximity. The land use structure feature reflects the preference of different birds for the land use composition of the habitat. For example, wader birds inhabit wetlands, while woodpeckers are associated with forests. As the densest agglomerations of human activity, cities may have adverse effects on the migration and habitat of birds, while water sources can provide water and other resources for birds. The urban area is directly characterized by the construction polygon extracted from LUC, and the waters are replaced by rivers, canals, and lakes. Therefore, for each sampled grid, the following record can be used:
C b = ( B , R c u l t i v a t e , R f o r e s t , R g r a s s , R w a t e r , R b u i l t u p , R n o n u s e , D i s c i t y , D i s r i v e r , D i s l a k e )
where the value of B is 0 or 1; if a bird is observed in the selected grid then B is 1, otherwise B is 0. R c u l t i v a t e , R f o r e s t , R g r a s s , R w a t e r , R b u i l t u p , R n o n u s e are the proportion of land type: cultivated land, forest land, grassland, waterbody, and built-up land within the statistical scope. D i s c i t y , D i s r i v e r , D i s l a k e are distances from the grid center to the nearest city, river, and lake, respectively. When we counted the above-mentioned characteristic variables in each grid for five years—1995, 2000, 2005, 2010, and 2015—the probability of each grid being suitable for habitat could be calculated according to the following:
P i m = e y m 1 + e y m
where P is PGSH for bird habitat i at grid m. y m can be calculated based on each variable’s value and corresponding weight at grid m. P is in a range of 0–1. The closer P is to 1, the higher the probability of it being suitable for habitat. For the five sampled years between 1995 and 2015, we determined threatened bird habitat by more than three consecutive periods of decreased PGSH, and when the PGSH increased for more than three consecutive periods, it was categorized as continuous improvement.
Use spatial autocorrelation to detect the spatial distribution characteristic. Global Moran’s I can measure spatial autocorrelation based on element locations and element values [45]. Given a set of elements and related attributes, this index evaluates whether the expressed pattern is a clustering pattern, a discrete pattern, or a random pattern. Z scores and p values were used to evaluate the significance of the index. The value of Global Moran’s I falls in the interval from −1.0 to +1.0. When the value is positive, it means that there is a spatial agglomeration of elements, and the larger the value is, the more obvious the agglomeration. Conversely, when the value is negative, it means that there is spatial diffusion of elements, and the smaller the value is, the more obvious the diffusion is. When the Global Moran’s I value is 0, it means a random distribution of elements. Global Moran’s I can only reflect the global distribution characteristics of elements but cannot detect the local clustering of elements. Local Moran’s I gives a set of elements (input element class) and an analysis field (input field), which can identify the spatial clustering of elements with high or low values [46]. In this study, Moran’s I and local Moran’s I were used to detect the spatial distribution clustering characteristics of the probability of bird habitat suitable for grid-scale. We used tools in ArcGIS10.2 to realize the calculation of Global Moran’s I, and the cartographic display of Local Moran’s I.
Use counterfactual analysis to evaluate the effect of land use policies. Counterfactual reasoning refers to the negation and representation of a fact that has occurred in the past, to construct a hypothesis of possibility [47]. A counterfactual approach is appropriate for answering fundamental questions, such as what would have happened if there had been no intervention, or if there had been different policy systems. In the counterfactual analysis, an unobserved case (called a counter fact) is designed to be compared with the actual case to illustrate the important factors that explain the impact of the policy. In this article, if we examine the impact of changes in a certain land type A on the habitat of birds, we will examine the following scenarios. From A to other land types and other land types to A, we compared the changes in the PGSH in the factual scenarios and in the hypothetical unhappened scenarios.

4. Results and Analysis

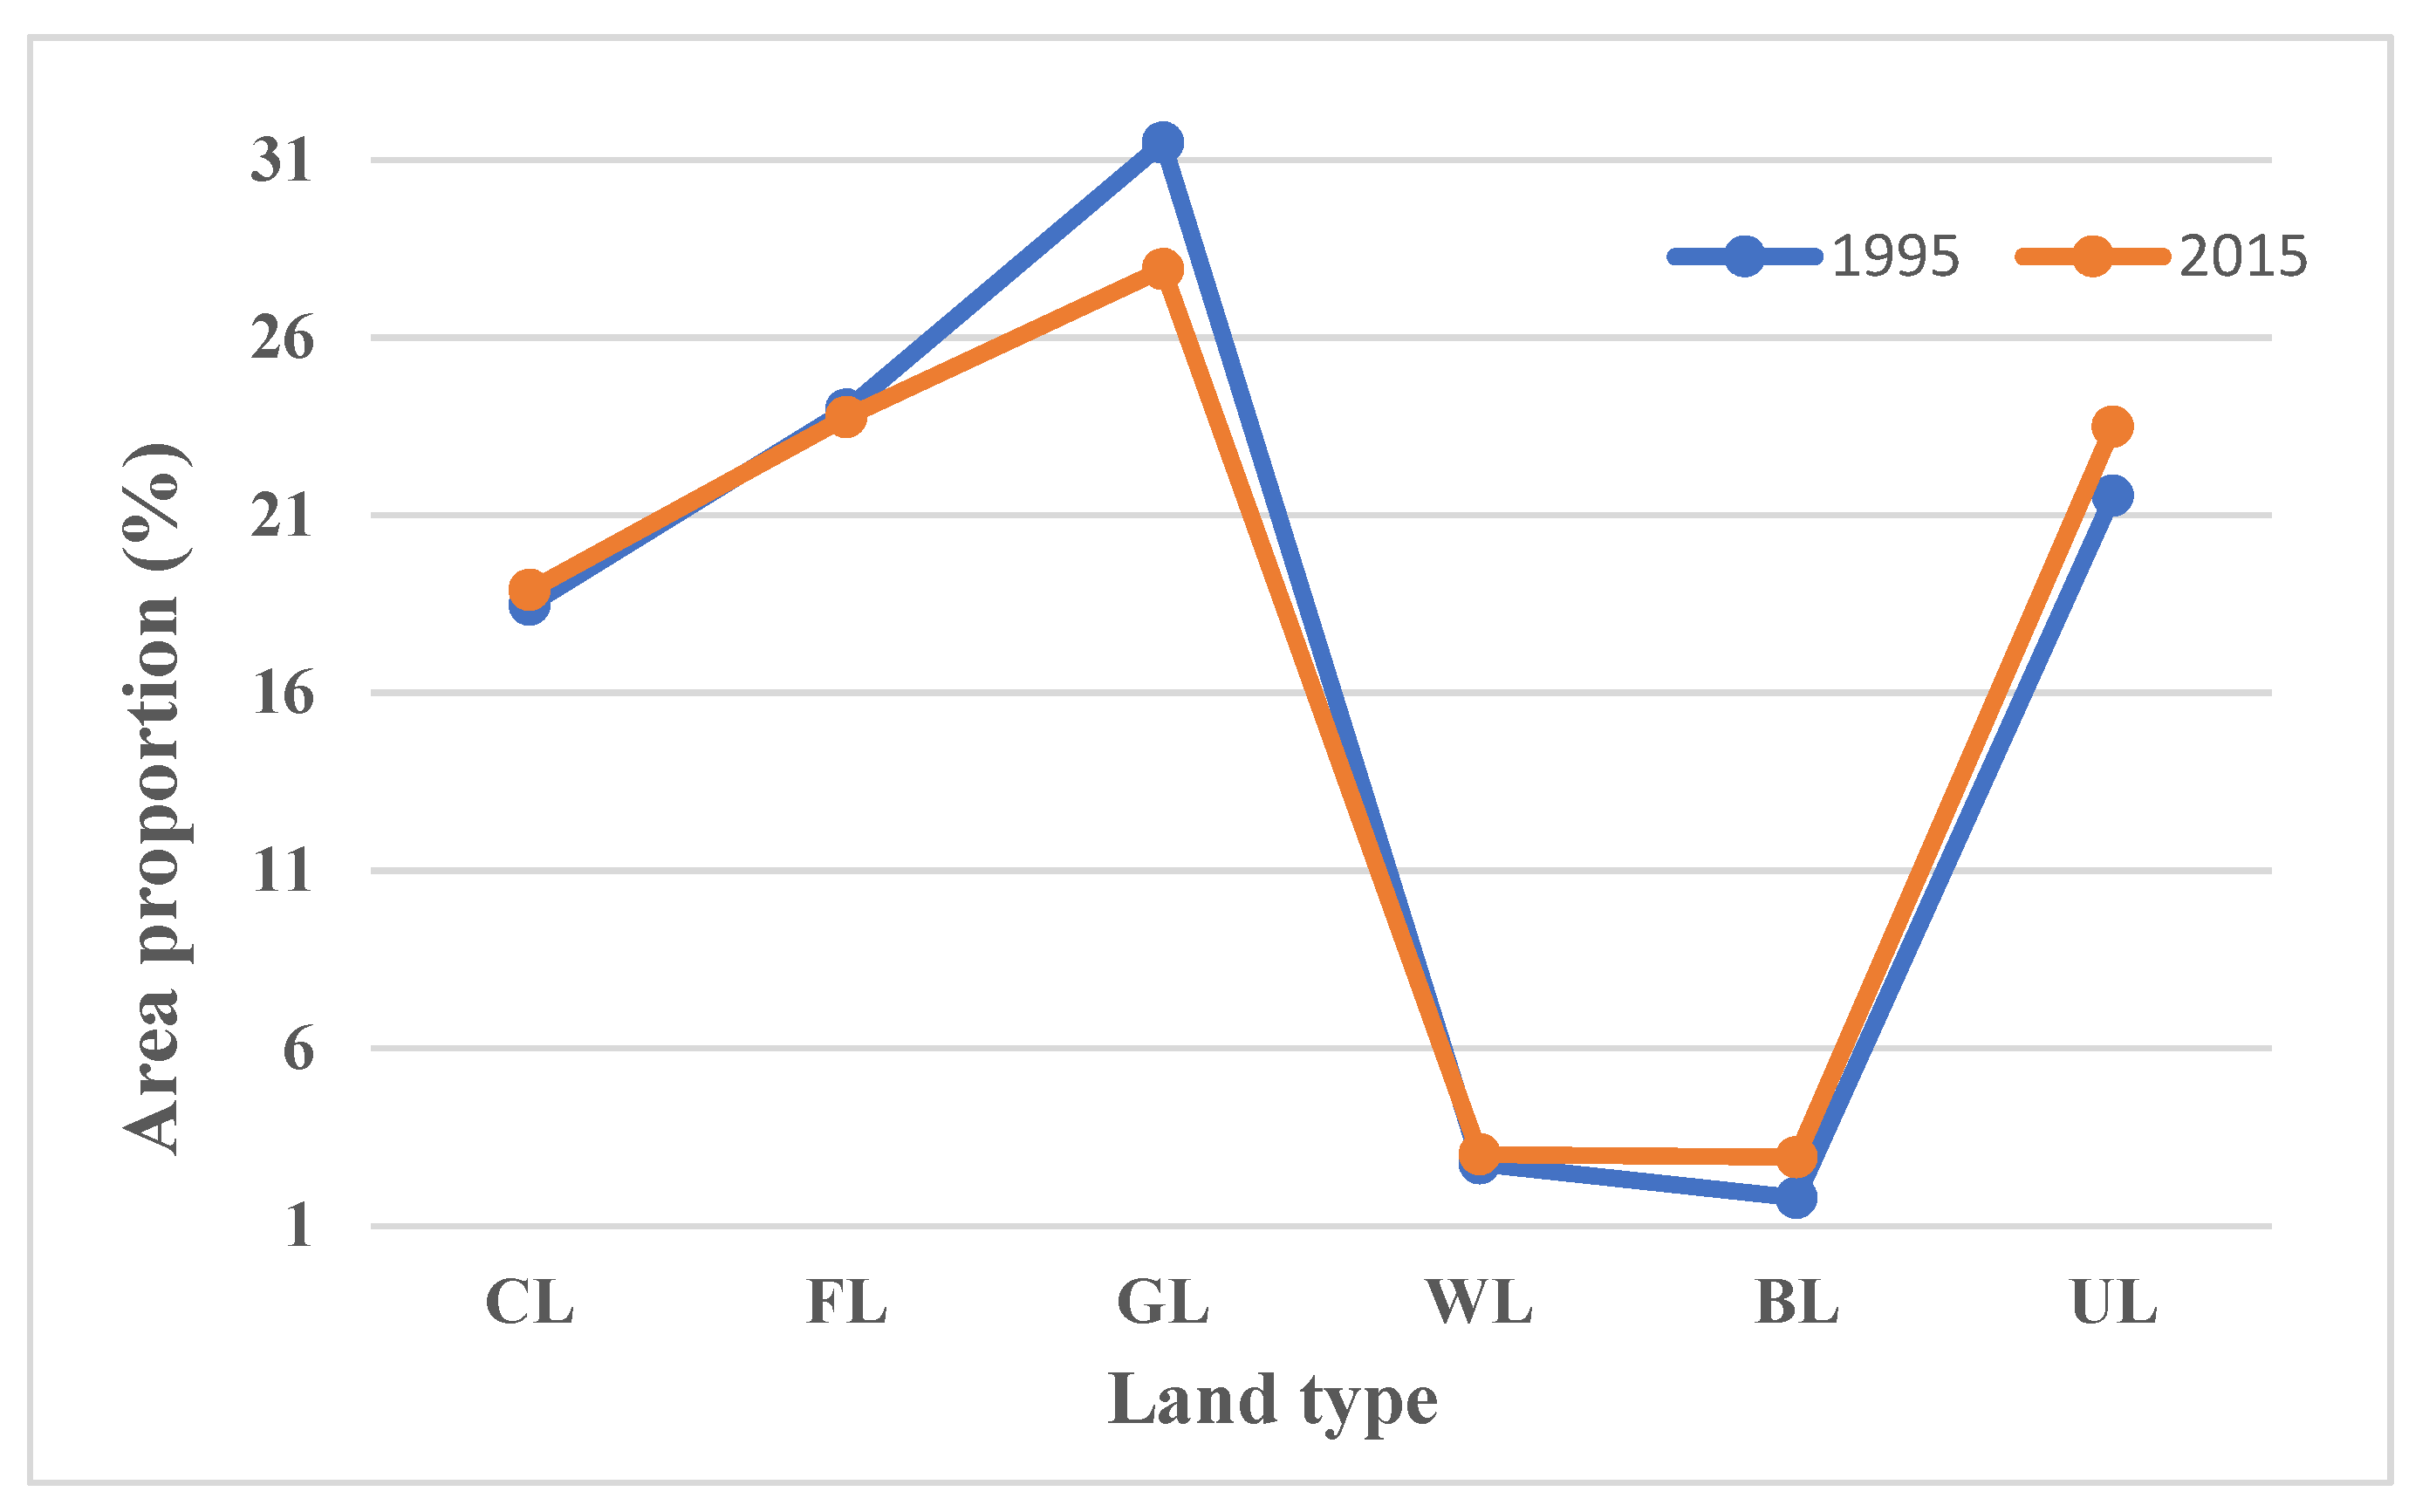
4.1. Land Use Change in 1995–2015

The land use transition matrix represented by area from 1995 to 2015 is shown in Table 1. In terms of area proportion change (Figure 3), the proportion of cultivated land (CL), forest land (FL), grassland (GL), water (WL), built-up land (BL), and unused land (UL) changed from 18.47%, 23.97%, 31.48%, 2.75%, 1.79%, and 21.54% in 1995 to 18.89%, 23.76%, 27.92%, 3.01%, 2.93%, and 23.49%, respectively, in 2015. The largest decline was found in GL, which decreased by 3.56 percentage points. BL and UL increased by 1.14 and 1.95 percentage points, respectively, with small changes in the other three land use types. However, the relative variation rate was 2.27%, −0.88%, −11.31%, 9.45%, 63.69%, and 9.05%, respectively.

4.2. Quantitative Changes of Bird Habitat Suitability

The number of bird species at risk between 1995 and 2015 was 84 (84/981). Among them, four bird species, white-winged magpie, limestone leaf warbler, rusty-flanked tree-creeper, and rusty-fronted barwing, were found to be of particular conservation concern, because, in 2015, the average PGSH for these species across China was only 0.7%, 3.9%, 7.1%, and 7.3% (the average PGSH of all birds was about 48.6%), respectively. If no vigorous conservation measures are adopted to protect them, they risk potential extinction in the relatively near future. Habitat suitability for 582 bird species (582/981) continued to improve, which far exceeds the number of threatened birds. Figure 4 presents 20 species of birds, showing low PGSH (average PGSH less than 10% in 2015) but constant improvement. The IUCN Red List of Endangered Birds lists a total of 86 endangered bird species and 83 other supplementary rare birds, of which 6 species are threatened: Hainan partridge, yellow-bellied tragopan, Chinese monal, great bustard, spotted greenshank, and fairy pitta. The habitats of 18 bird species on the Red List have been improved continuously.

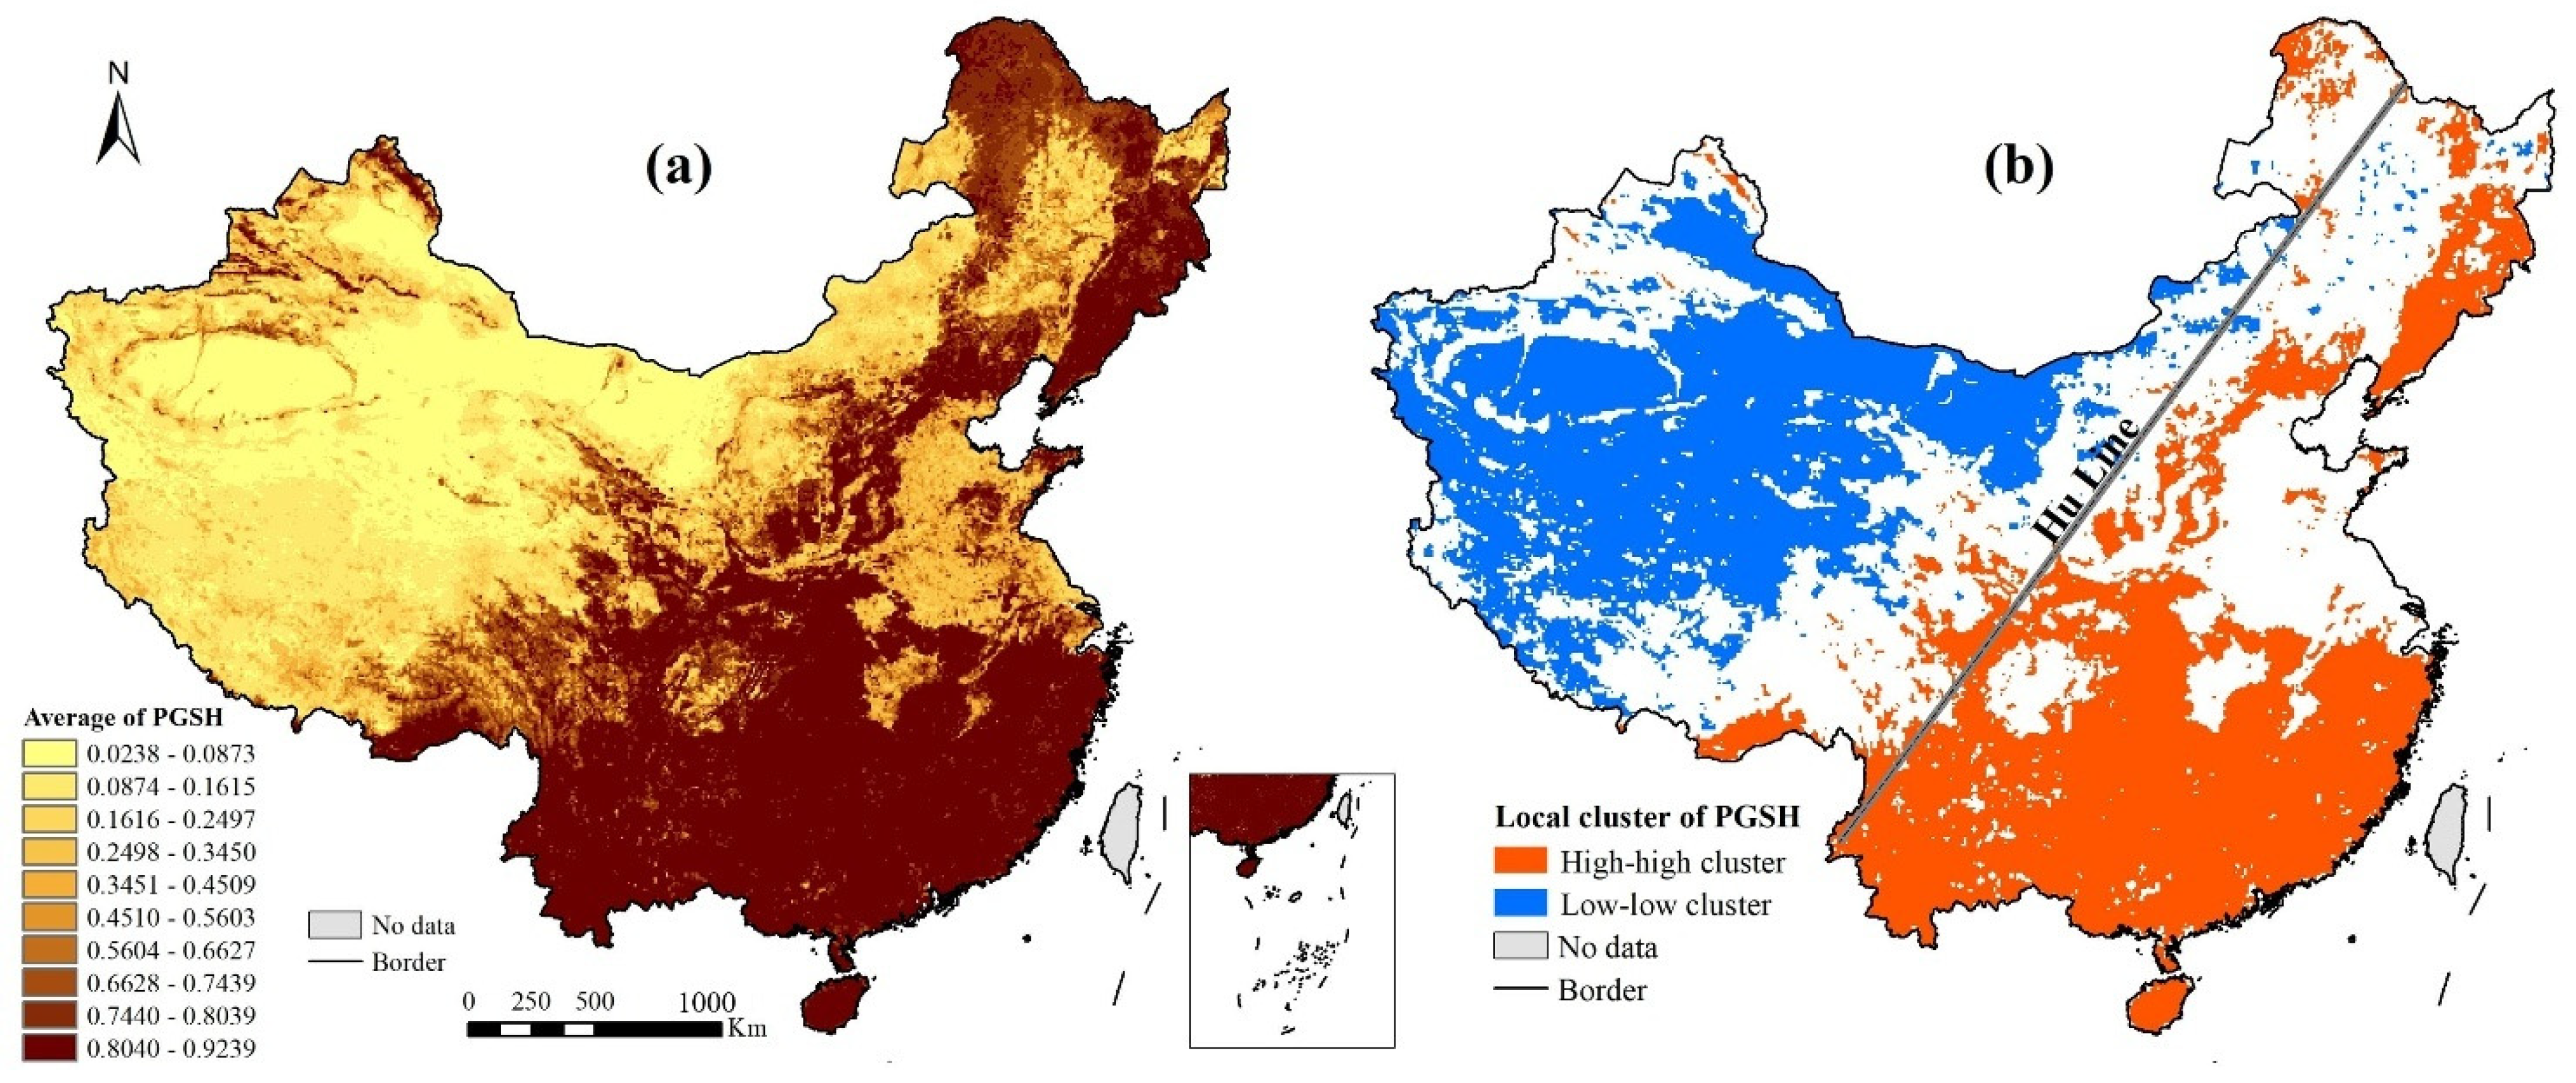
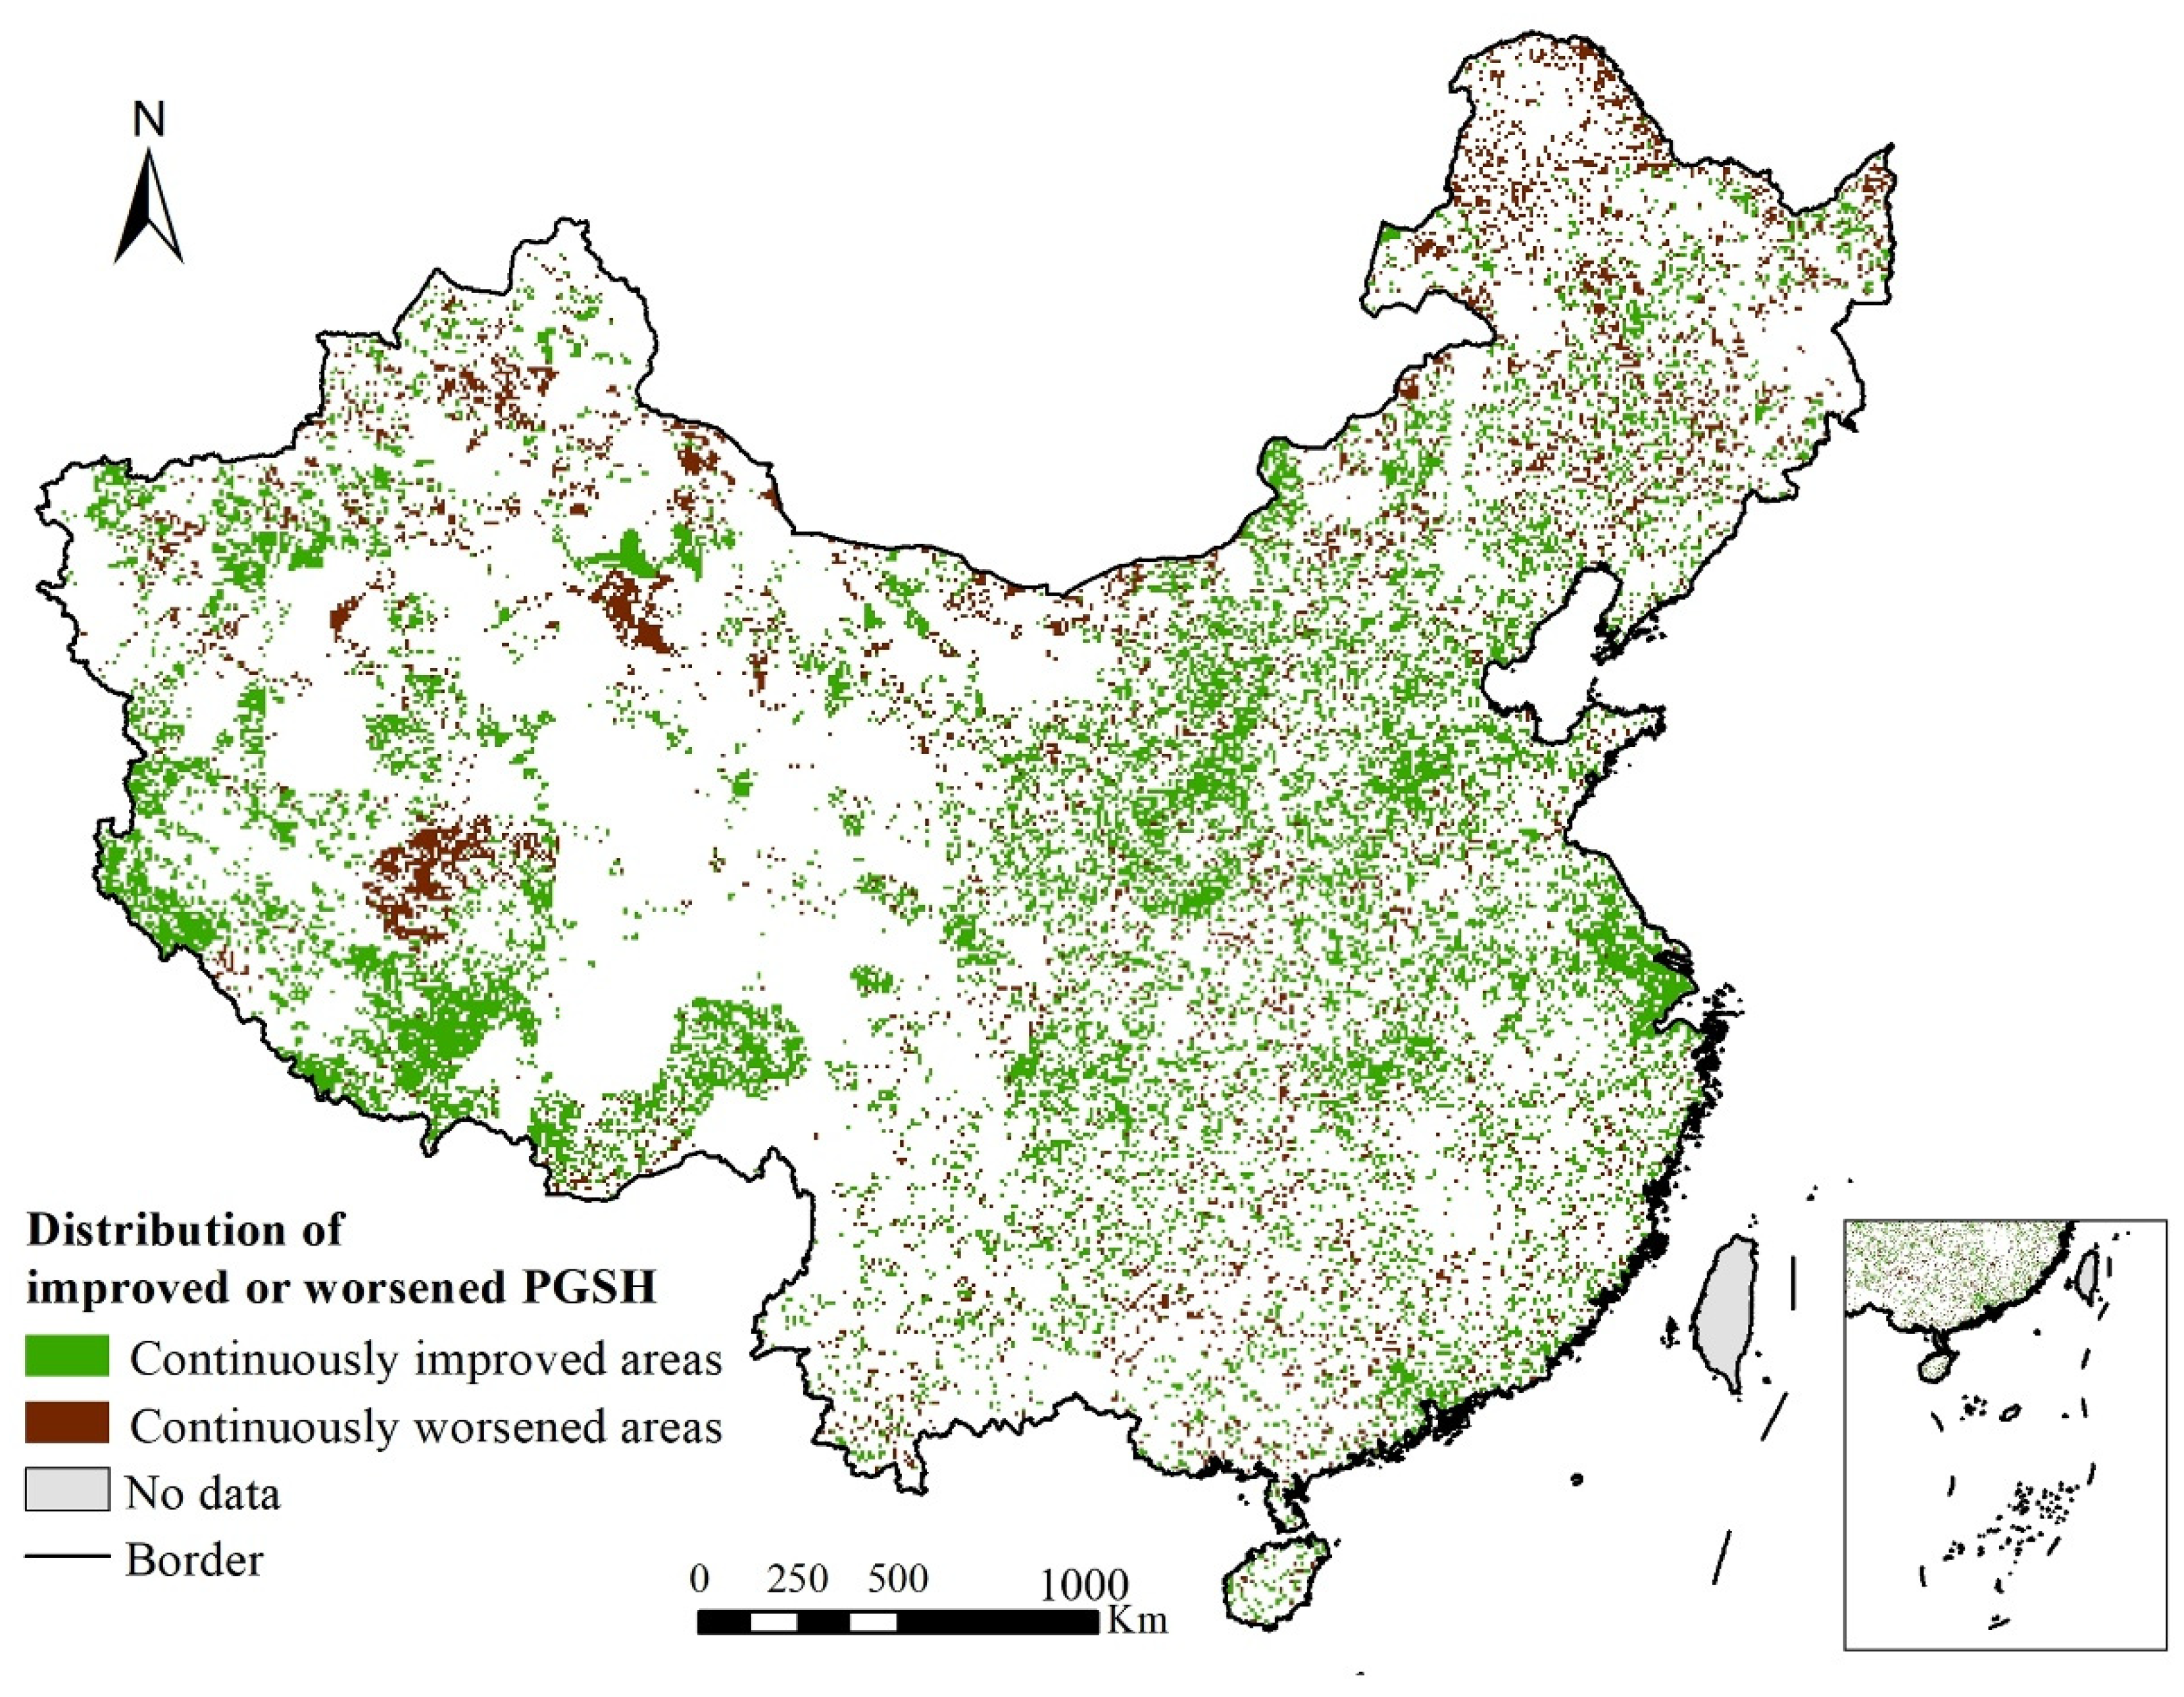
4.3. The Spatial Distribution of Suitability for Bird Habitats

The average PGSH for all 981 species of birds analyzed in each 9 km grid unit is shown in Figure 5a. The higher the grid value, the more important it is for maintaining bird species diversity. The Global Morans’ I index is 0.938, which takes on a typically obvious spatial agglomeration feature. Detected by local clusters, high aggregation areas are southern China and northeast China, which are crucial forest areas of China that play an important role in maintaining bird habitats. An interesting finding was that high aggregation areas and low aggregation areas were split by the Chinese population distribution line “Hu-Line” (Figure 5b). High-value areas were mainly gathered on the right side of the line, if 0.8 is the threshold, then the right proportion is 78.84%. If the threshold is 0.9, the corresponding number is 86.60%. Therefore, bird-friendly areas overlap with the higher human population density side of the Hu-Lin, but human activities pose a huge challenge to the protection of birds.
From the four time periods formed by five years as an interval, the number of grids continuously reduced in terms of average PGSH, which was 7238, accounting for 6.27% of the total number of grids, while the number of grids that continuously improved was 18,498, accounting for 16.02%. The spatial distribution of the average PGSH reduction and increases are shown in Figure 6. The area of improvement was substantially higher than that of deterioration. This discovery will lead us to re-examine the relationship between LUC and bird habitat changes. The continuously deteriorating areas were mainly located in areas containing three different land use types, namely, the forest areas in the northeast, the deserts and non-use lands in Xinjiang and Tibet in the west of China, and the grasslands in Inner Mongolia in the north. The areas of continuous improvement were more widely distributed, among which the Qinghai-Tibet Plateau was the most concentrated area of improvement, but we were surprised by the improved agglomeration area formed in the Yangtze River Delta region, having the most developed economy in China.
Integrating the four periods from 1995 to 2015 to analyze the spatial-temporal changes in the PGSH in each grid, we found the lowest overall PGSH but the most noticeable growth in the Qinghai-Tibet Plateau, which formed a gathering area. However, much of the grassland in this area is becoming bare and unused and is experiencing rising temperatures, thus the environment is becoming more suitable for highland birds. PGSH in north China, which has declined significantly on account of the transition of large areas of forest to non-forestry lands, should also be closely monitored, because of its importance for bird species in China. Furthermore, we found that some PGSH with a high level of urbanization had significant growth, such as Shanghai and Jiangsu in China’s Yangtze River Delta region, which is one of the most developed regions in China, where LUC driven by human construction is prevalent. However, there are also many areas where LUC is significant while PGSH is on the decline.

5. Discussion

5.1. The Relationship between the Intensity of LUC and PGSH

The intensity of LUC (LandCR, equal to the changed land area/total area) in each grid had a correlation coefficient of 0.038 **, with the change of PGSH in 2015 indicating a significant positive relationship between the higher LUC and the higher PGSH improvement. However, if LUC and PGSH are always in a linear relationship, it means that the more drastic the land use change, the more favorable the improvement of the bird habitat, which is obviously not in line with the cognition. Several studies have also found that the impact of land-use change on birds is complex and nonlinear [48,49,50]. We speculate that there is a threshold value for the degree of LUC to PGSH. Before this threshold value, a certain degree of LUC is beneficial to PGSH; however, exceeding this threshold will seriously disturb the living environment of birds, which is somewhat similar to the theory of Environmental Kuznets Curve [51]. Therefore, in order to determine this threshold, we added the square term of LUC (LandCR2) to the independent variable to build a new regression model. The result is shown in Table 2, which shows that the coefficient of LandCR was positive, while the coefficient of LandCR2 was negative, indicating that LUC and PGSH have an inverted U-shaped relationship. We identified the threshold as being approximately 0.6721, meaning that when the LUC is less than 0.6721, a higher LUC can promote the increase of PGSH, but beyond this value, it will reduce the PGSH value. Of all the grids in which LUC occurred in China, the PGSH of 90,752 (93.33%) grids was less than 0.6721, while the 6489 grids larger than 0.6721 accounted for 6.67%.

5.2. Influence of Two Land Use Policies on PGSH

Cities are the areas with the highest concentration of human activities, which can impact bird populations living in these areas. Because China experienced an unprecedented increase of urbanization from 1995 to 2015, we are concerned about the negative impacts that this human-led expansion has had on bird habitats. Fortunately, forests serve as the main habitat for most bird species in China, which are less disturbed by human activity than cities. During this study period, there were two major artificial expansion projects of forest land in China: returning farmland to forest, Chinese term “tuigenghuanlin” (mainly sloping and desertified farmland with severe soil erosion and low yield), and the construction of the Three-North Shelterbelt Forest (mainly to alleviate the impact of sandstorms in northern China). We question what changes these developments have made to suitable bird habitat in these areas based on the counterfactual method to compare the PGSH under the situation of returning farmland to forest and the construction of the Three-North Shelterbelt, did not happen (hypothetical state) and actual state in these grids.
Returning farmland to forest: although the total amount of forest land changed little during the study, it may have changed spatially. Because forests play a vital role in the maintenance of bird habitat, we evaluated the impact of the “returning farmland to forest” policy on birds. Since the pilot project was implemented in 1999, the area returned from farmland to forest between 2000 and 2015 has been approximately 46,082 km2. If fragmented areas with an area of less than 10,000 m2 are removed, the remaining area is 43,934 km2, accounting for around 1.93% of the total area of forest land in 2015. This forest land was distributed across 49,859 grids. The counterfactual analysis found that the policy of returning farmland to forest had no obvious benefits for improved bird habitat. This may be related to the unreasonable selection of tree species, planting site, and disturbance of nutrient cycle [52,53]. In the grid that implemented this policy, the probability of all birds inhabiting increased by only 1.07 percentage points, from an average of 73.97% to 75.04%. Even the inhabiting probability of six species of birds, namely spotted warbler, light-tailed warbler, brown-crested cuckoo falcon, Emei flycatcher warbler, wren, and unidentified falcon, had decreased.
Three-North Shelterbelt: the forest area within the Three-North Shelterbelt increased by 43,811 km2 during the study period and the average PGSH of all birds in the grid where forest increase occurred changed from 0.2076 before restoration to 0.2138 after restoration. It is believed that the Three-North Shelterbelt not only plays a direct role in improving land desertification but also improves the quality of bird habitat. This may be related to the important role of the corridors of ecological network in maintaining biodiversity, which has been greatly improved since the implementation of this policy [54,55]. We found that the habitat of 667 species of birds has been improved, but the habitat quality for 312 species deteriorated. The black-backed swallowtail had the highest improvement degree, increasing from 0.2877 to 0.368, while the PGSH of brown-winged snow finches, giant-billed sand finches, white-winged woodpeckers, and Mongolian sand finches, decreased by more than 10 percentage points.
Although returning farmland to forest and the construction of the Three-North Shelterbelt have increased the area of forest land to a certain extent, the areas scattered in each grid are small, accounting for 1.14% and 8.6748%, respectively. Therefore, it could be concluded that birds prefer large and agglomerated areas over small, fragmented ones.

6. Conclusions

Using multi-temporal land use data and the national bird observation database in China, this study systematically analyzed the impact of LUCs on 981 species of birds from 1995 to 2015. We used logistic regression to calculate the PGSH on all grid cells for each species. Overall, we found that the number of birds whose habitat quality continued to improve (582) was significantly higher than the number of birds under constant threat (84). Interestingly, the distribution of PGSH coincides with the boundary line of China’s human population (Hu-line), with a clear divide between high PGSH in the east and low PGSH in the west. Within a certain range, PGSH was generally higher in the region with high human activity, but when urbanization intensity exceeds 67.21%, the continued increase of human activity would likely threaten bird habitats. China’s policy of returning farmland to forests and the Three-North Shelterbelt project increased the area of green space, but the impact on PGSH was limited, with an average increase of less than 2%.
Although we studied the spatial and temporal changes of bird PGSH within the multi-data source over a relatively long period and across a broad research range, it provided the potential for comparative analysis of impacts of LUCs on different bird PGSH. However, because the data depend on citizen contributions to EBird and BirdReport, there may be bias for locations and observed species for specific contributors, thus these findings may have limitations for national extrapolation. In addition, the factors affecting the distribution of bird habitats are complex; for example, feed condition, presence of freshwater, climate, and temperature are important factors to consider. Simply considering land use and spatial proximity may lead to a certain degree of bias in the results. Thirdly, we found that there is an inverted U-shaped relationship between LUC and PGSH, just like the environmental Kuznets Curve; however, we did not give too much explanation for this phenomenon, which requires solid econometric statistics and discussion, which is beyond the scope of this paper. Although this paper has the above shortcomings, we believe that this research provides a useful attempt at analyzing substantial (two large datasets), large-scale (China) data. The results provide a useful reference for identifying bird species and habitats that require most conservation attention in the face of continued land use transformation.

Author Contributions

Conceptualization, B.Q. and J.Y.; methodology, Z.Z.; software, S.H.; validation, J.Y., Z.Z., and B.Q.; formal analysis, Z.Z.; investigation, J.Y.; resources, S.H.; data curation, S.H.; writing—original draft preparation, B.Q.; writing—review and editing, J.Y.; visualization, S.H.; supervision, Z.Z. All authors have read and agreed to the published version of the manuscript.

Funding

This research received no external funding.

Informed Consent Statement

Not applicable.

Data Availability Statement

The data presented in this study are available on request from the corresponding author.

Conflicts of Interest

The authors declare no conflict of interest.

References

  1. Lambin, E.F.; Meyfroidt, P. Global LUC, economic globalization, and the looming land scarcity. Proc. Natl. Acad. Sci. USA 2011, 108, 3465–3472. [Google Scholar] [CrossRef]
  2. Rosenberg, K.V.; Dokter, A.M.; Blancher, P.J.; Sauer, J.R.; Smith, A.C.; Smith, P.A.; Marra, P.P. Decline of the North American avifauna. Science 2019, 366, 120–124. [Google Scholar] [CrossRef] [PubMed]
  3. Sterling, S.M.; Ducharne, A.; Polcher, J. The impact of global land-cover change on the terrestrial water cycle. Nat. Clim. Chang. 2013, 3, 385. [Google Scholar] [CrossRef]
  4. Wu, H.; Lin, A.; Xing, X.; Song, D.; Li, Y. Identifying core driving factors of urban land use change from global land cover products and POI data using the random forest method. Int. J. Appl. Earth Obs. Geoinf. 2021, 103, 102475. [Google Scholar] [CrossRef]
  5. Liu, Y.; He, Q.; Tan, R.; Liu, Y.; Yin, C. Modeling different urban growth patterns based on the evolution of urban form: A case study from Huangpi, central China. Appl. Geogr. 2016, 66, 109–118. [Google Scholar] [CrossRef]
  6. Pielke Sr, R.A. Land use and climate change. Science 2005, 310, 1625–1626. [Google Scholar] [CrossRef] [PubMed]
  7. Zhang, D.; Liu, X.; Wu, X.; Yao, Y.; Wu, X.; Chen, Y. Multiple intra-urban land use simulations and driving factors analysis: A case study in Huicheng, China. GISci. Remote Sens. 2019, 56, 282–308. [Google Scholar] [CrossRef]
  8. Du, X.; Jin, X.; Yang, X.; Yang, X.; Zhou, Y. Spatial pattern of land use change and its driving force in Jiangsu Province. Int. J. Environ. Res. Public Health 2014, 11, 3215–3232. [Google Scholar] [CrossRef] [PubMed]
  9. Sala, O.E.; Stuart Chapin, F.I.I.I.; Armesto, J.J.; Berlow, E.; Bloomfield, J.; Dirzo, R.; Huber-Sanwald, E.; Huenneke, L.F.; Wall, D.H. Global biodiversity scenarios for the year 2100. Science 2000, 287, 1770–1774. [Google Scholar] [CrossRef] [PubMed]
  10. Northrup, J.M.; Rivers, J.W.; Yang, Z.; Betts, M.G. Synergistic effects of climate and land-use change influence broad-scale avian population declines. Glob. Chang. Biol. 2019, 25, 1561–1575. [Google Scholar] [CrossRef] [PubMed]
  11. Powers, R.P.; Jetz, W. Global habitat loss and extinction risk of terrestrial vertebrates under future land-use-change scenarios. Nat. Clim. Chang. 2019, 9, 323. [Google Scholar] [CrossRef]
  12. Mistry, J.; Berardi, A.; Simpson, M. Birds as indicators of wetland status and change in the North Rupununi, Guyana. Biodivers. Conserv. 2008, 17, 2383–2409. [Google Scholar] [CrossRef]
  13. Ali, A.A.; Idris, N.H.; Ishak, M.H.I. The influence of land use land cover changes on urban bird communities. Int. Arch. Photogramm. Remote Sens. Spat. Inf. Sci. 2019. [Google Scholar] [CrossRef]
  14. Regos, A.; Imbeau, L.; Desrochers, M.; Leduc, A.; Robert, M.; Jobin, B.; Brotons, L.; Drapeau, P. Hindcasting the impacts of land-use changes on bird communities with species distribution models of Bird Atlas data. Ecol. Appl. 2018, 28, 1867–1883. [Google Scholar] [CrossRef]
  15. Scholtz, R.; Polo, J.A.; Fuhlendorf, S.D.; Duckworth, G.D. Land cover dynamics influence distribution of breeding birds in the Great Plains, USA. Biol. Conserv. 2017, 209, 323–331. [Google Scholar] [CrossRef]
  16. Newbold, T.; Scharlemann, J.P.; Butchart, S.H.; Şekercioğlu, Ç.H.; Alkemade, R.; Booth, H.; Purves, D.W. Ecological traits affect the response of tropical forest bird species to land-use intensity. Proc. R. Soc. B Biol. Sci. 2013, 280, 20122131. [Google Scholar] [CrossRef]
  17. Sohl, T.L. The relative impacts of climate and land-use change on conterminous United States bird species from 2001 to 2075. PLoS ONE 2014, 9, e112251. [Google Scholar]
  18. Chiawo, D.O.; Kombe, W.N.; Craig, A.J. Bird responses to LUC: Guild diversity in a Kenyan coastal forest and adjoining habitats. Emu-Austral Ornithol. 2018, 118, 281–292. [Google Scholar] [CrossRef]
  19. Chapman, P.M.; Tobias, J.A.; Edwards, D.P.; Davies, R.G. Contrasting impacts of land-use change on phylogenetic and functional diversity of tropical forest birds. J. Appl. Ecol. 2018, 55, 1604–1614. [Google Scholar] [CrossRef]
  20. Waltert, M.; Mardiastuti, A.; Mühlenberg, M. Effects of land use on bird species richness in Sulawesi, Indonesia. Conserv. Biol. 2004, 18, 1339–1346. [Google Scholar] [CrossRef]
  21. Okada, S.; Lindenmayer, D.B.; Wood, J.T. Does LUC influence predation of bird nests? Austral Ecol. 2019, 44, 768–776. [Google Scholar] [CrossRef]
  22. Zhang, Y.; Wang, H.; Xie, P.; Rao, Y.; He, Q. Revisiting spatiotemporal changes in global urban expansion during 1995 to 2015. Complexity 2020, 2020, 6139158. [Google Scholar] [CrossRef]
  23. Wang, C.; He, J.; Liu, D.; Yu, X.; Shi, Q. Impact of land use change on bird habitat connectivity: A case study in Ezhou City. Acta Ecol. Sin. 2022, 42, 4197–4208, (In Chinese with English Abstract). [Google Scholar]
  24. Cintra, R.; Magnusson, W.E.; Albernaz, A. Spatial and temporal changes in bird assemblages in forest fragments in an eastern Amazonian savannah. Ecol. Evol. 2013, 3, 3249–3262. [Google Scholar] [CrossRef]
  25. Crooks, K.R. Relative sensitivities of mammalian carnivores to habitat fragmentation. Conserv. Biol. 2002, 16, 488–502. [Google Scholar] [CrossRef]
  26. Fahrig, L. Effects of habitat fragmentation on biodiversity. Annu. Rev. Ecol. Evol. Syst. 2003, 34, 487–515. [Google Scholar] [CrossRef]
  27. Zhang, Z.; Zheng, M. Advances in the Study of Bird Habitat Selection; China Forestry Press: Beijing, China, 1999. [Google Scholar]
  28. Ministry of Environmental Protection, the People’s Republic of China. China Biodiversity Red List. 2015. Available online: http://www.mee.gov.cn/gzfw/spk/hbbvideo/Videos/201605/t20160531_352442.shtml (accessed on 1 July 2020).
  29. Liu, L.; Liu, H.Y.; Li, Y.F.; Wang, J.; Xie, F.F. Dynamic changes in population size and habitat distribution of wintering red-crowned crane in northern Jiangsu Province. Acta Ecol. Sin. 2018, 38, 926–933, (In Chinese with English Abstract). [Google Scholar]
  30. Xu, Y.; Lin, S.; He, J.; Xin, Y.; Zhang, L.; Jiang, H.; Li, Y. Tropical birds are declining in the Hainan Island of China. Biol. Conserv. 2017, 210, 9–18. [Google Scholar] [CrossRef]
  31. Fang, W.Z.; Chen, Z.H.; Chen, X.L.; Lin, Q.X. Avian community diversity during winter in Xiamen wetlands. Mar. Sci. 2007, 31, 10–16, (In Chinese with English Abstract). [Google Scholar]
  32. Jiang, Z.; Ma, K. Status quo, challenges and strategy in conservation biology. Biodivers. Sci. 2009, 17, 107–116. [Google Scholar]
  33. Dai, S.; Feng, D.; Chan, K.; Gong, P.; Xu, B. A spatialized digital database for all bird species in China. Sci. China Life Sci. 2019, 62, 661–667. [Google Scholar] [CrossRef]
  34. He, F.Q.; Fellowes, J.R.; Chan, B.P.; Lau, M.W.; Lin, J.S.; Shing, L.K. An update on the distribution of the ‘Endangered’ White-eared Night Heron Gorsachius magnificus in China. Bird Conserv. Int. 2007, 17, 93–101. [Google Scholar] [CrossRef]
  35. Chen, J.; Zhang, B.; Ma, K.; Jiang, Z. Bibliometric analysis of status quo of conservation biology in China. Biodivers. Sci. 2009, 17, 423–429. [Google Scholar]
  36. Si, Y.; Xin, Q.; Prins, H.H.; De Boer, W.F.; Gong, P. Improving the quantification of waterfowl migration with remote sensing and bird tracking. Sci. Bull. 2015, 60, 1984–1993. [Google Scholar] [CrossRef]
  37. Bonney, R.; Cooper, C.B.; Dickinson, J.; Kelling, S.; Phillips, T.; Rosenberg, K.V.; Shirk, J. Citizen science: A developing tool for expanding science knowledge and scientific literacy. BioScience 2009, 59, 977–984. [Google Scholar] [CrossRef]
  38. Supp, S.R.; Sorte, F.A.L.; Cormier, T.A.; Lim, M.C.; Powers, D.R.; Wethington, S.M.; Graham, C.H. Citizen-science data provides new insight into annual and seasonal variation in migration patterns. Ecosphere 2015, 6, 1–19. [Google Scholar] [CrossRef]
  39. Li, X.; Liang, L.; Gong, P.; Liu, Y.; Liang, F. Bird watching in China reveals bird distribution changes. Chin. Sci. Bull. 2013, 58, 649–656. [Google Scholar] [CrossRef]
  40. Sullivan, B.L.; Wood, C.L.; Iliff, M.J.; Bonney, R.E.; Fink, D.; Kelling, S. eBird: A citizen-based bird observation network in the biological sciences. Biol. Conserv. 2009, 142, 2282–2292. [Google Scholar] [CrossRef]
  41. EBird Basic Dataset (EBD). Version: EBD_relApr-2019; Cornell Lab of Ornithology: Ithaca, NY, USA, 2019. [Google Scholar]
  42. He, Q.; Song, Y.; Liu, Y.; Yin, C. Diffusion or coalescence? Urban growth pattern and change in 363 Chinese cities from 1995 to 2015. Sustain. Cities Soc. 2017, 35, 729–739. [Google Scholar] [CrossRef]
  43. Lai, L.; Huang, X.; Yang, H.; Chuai, X.; Zhang, M.; Zhong, T.; Chen, Z.; Chen, Y.; Wang, X.; Thompson, J.R. Carbon emissions from land-use change and management in China between 1990 and 2010. Sci. Adv. 2016, 2, e1601063. [Google Scholar] [CrossRef]
  44. Thiessen, A.H. Precipitation averages for large areas. Mon. Weather. Rev. 1911, 39, 1082–1089. [Google Scholar] [CrossRef]
  45. Fu, W.; Jiang, P.; Zhou, G.; Zhao, K. Using Moran’s I and GIS to study the spatial pattern of forest litter carbon density in a subtropical region of southeastern China. Biogeosciences 2014, 11, 2401–2409. [Google Scholar] [CrossRef]
  46. Anselin, L. Local indicators of spatial association—LISA. Geogr. Anal. 1995, 27, 93–115. [Google Scholar] [CrossRef]
  47. Bennett, J. Event causation: The counterfactual analysis. Philos. Perspect. 1987, 1, 367–386. [Google Scholar] [CrossRef]
  48. Butler, S.; Boccaccio, L.; Gregory, R.; Vorisek, P.; Norris, K. Quantifying the impact of land-use change to European farmland bird populations. Agric. Ecosyst. Environ. 2010, 137, 348–357. [Google Scholar] [CrossRef]
  49. De Lima, R.F.; Dallimer, M.; Atkinson, P.; Barlow, J. Biodiversity and land-use change: Understanding the complex responses of an endemic-rich bird assemblage. Divers. Distrib. 2013, 19, 411–422. [Google Scholar] [CrossRef]
  50. Acevedo, M.; Restrepo, C. Land-cover and land-use change and its contribution to the large-scale organization of Puerto Rico’s bird assemblages. Divers. Distrib. 2008, 14, 114–122. [Google Scholar] [CrossRef]
  51. Dinda, S. Environmental Kuznets curve hypothesis: A survey. Ecol. Econ. 2004, 49, 431–455. [Google Scholar] [CrossRef]
  52. Trac, C.; Schmidt, A.; Harrell, S.; Hinckley, T. Environmental reviews and case studies: Is the returning farmland to forest program a success? Three case studies from Sichuan. Environ. Pract. 2013, 15, 350–366. [Google Scholar] [CrossRef]
  53. Li, Z.; Sun, X.; Huang, Z.; Zhang, X.; Wang, Z.; Li, S.; Zhai, B. Changes in nutrient balance, environmental effects, and green development after returning farmland to forests: A case study in Ningxia, China. Sci. Total Environ. 2020, 735, 139370. [Google Scholar] [CrossRef]
  54. Mu, H.; Li, X.; Ma, H.; Du, X.; Huang, J.; Su, W.; Li, B. Evaluation of the policy-driven ecological network in the Three-North Shelterbelt region of China. Landsc. Urban Plan. 2022, 218, 104305. [Google Scholar] [CrossRef]
  55. Wang, H.; He, M.; Ran, N.; Xie, D.; Wang, Q.; Teng, M.; Wang, P. China’s key forestry ecological development programs: Implementation, environmental impact and challenges. Forests 2021, 12, 101. [Google Scholar] [CrossRef]
Figure 1. Spatial distribution of land use (2015) and sampled avian observation sites (to improve visualization, the resolution of the land use grid was set to 1 km, and the bird distribution was based on 10,000 randomly selected bird observation points).
Sustainability 14 10078 g001
Figure 2. Methods framework diagram.
Sustainability 14 10078 g002
Figure 3. Area proportion change of six land type during the 1995–2015 period.
Sustainability 14 10078 g003
Figure 4. Twenty species of birds with low PGSH but constant improvement (PGSH change trend).
Sustainability 14 10078 g004
Figure 5. Spatial distribution of average PGSH for all 981 species of birds in each grid and local cluster. ((a): Average PGSH for all 981 species of birds analyzed in each grid unit; (b): Local cluster of PGSH, note that the right side of Hu-Line accounts for about 43.8% of the national area, containing 95% of the total population).
Sustainability 14 10078 g005
Figure 6. Spatial distribution of continuously improved/reduced grids with PGSH.
Sustainability 14 10078 g006
Table 1. Land use transition matrix from 1995 to 2015 in China (km2).
Land Use TypeCLFLGLWLBLUL
CL1,543,309.6456,402.9655,947.7418,442.0588,532.4310,224.89
FL86,234.842,016,160.76125,749.328406.8033,374.3130,836.77
GL111,111.40176,691.312,151,035.0843,172.0813,472.24527,014.15
WL12,957.204594.0520,414.69180,167.354207.6641,929.24
BL25,952.832084.322254.034406.07136,487.09942.86
UL33,822.7024,570.33324,941.5034,439.865527.711,644,181.76
Table 2. The regression result of LandCR and LandCR2.
VariableCoefficient
LandCR0.082 ***
LandCR2−0.061 ***
Dependent variable: PGSH; *** denotes significant at the p < 0.01 level.
Publisher’s Note: MDPI stays neutral with regard to jurisdictional claims in published maps and institutional affiliations.

