Article

Study on the Spatial-Temporal Evolution of Land Use Ecosystem Service Value and Its Zoning Management and Control in the Typical Alpine Valley Area of Southeast Tibet—Empirical Analysis Based on Panel Data of 97 Villages in Chayu County

1
College of Economics and Management, Anhui Agricultural University, Hefei 230036, China
2
Ministry of Natural Resources, Jianghuai Key Laboratory of Arable Land Resources Conservation and Ecological Restoration, Anhui Provincial Institute of Land and Spatial Planning, Hefei 230601, China
3
Anhui Provincial Academy of Eco-Environmental Science Research, Hefei 230071, China
4
University of Chinese Academy of Sciences, Beijing 100049, China
5
Xinjiang Institute of Ecology and Geography, Chinese Academy of Sciences, Wulumuqi 830011, China
6
Anhui Transportation Planning, Design and Research Institute Company Limited, Hefei 230088, China
*
Author to whom correspondence should be addressed.
Sustainability 2022, 14(16), 10057; https://doi.org/10.3390/su141610057
Submission received: 17 July 2022 / Revised: 4 August 2022 / Accepted: 8 August 2022 / Published: 14 August 2022
(This article belongs to the Special Issue Sustainable Land Use and Management)

Abstract

:
Under the background of ecological civilization construction and the overall planning of land and space, it is particularly important to explore the land use ecosystem service value and its zoning control. This paper, taking Chayu County, a typical alpine valley area of southeast Tibet as an example and based on the remote sensing interpretation data of three periods in 2000, 2010 and 2020, employs the three-level spatial scale from the village level, the township level to the county level to converge step by step, and uses a series of model algorithms to analyze and calculate the regional ecosystem service value and their dynamic changes, as well as spatial agglomeration and regional type division. The research shows that the land use types mainly consist of forest land, grassland and unused land, whose overall change range is small during the study period. The conversion of land use types is mainly between forest land, grassland and unused land and the land use index generally presents a spatial pattern of “high in the southwest and low in the northeast”, showing a decreasing trend to some degree. ESVI generally presents a differentiation pattern of “high in the west and low in the east”, with obvious spatial differentiation characteristics of kernel density, significant clustering and distribution characteristics and stable variation range, displaying an overall spatial pattern with characteristics of “dense in the west and sparse in the east, high in the north and low in the south”. Based on the administrative village scale, the study area is divided into three different types of land use ecological function areas: habitat maintenance function area, biological protection function area and production support function area. Differentiated approaches to appropriate development and construction and the corresponding optimization paths of ecological protection will be put forward.

1. Introduction

As a non-renewable resource, land is the most basic material for human production, life and ecology. Land use refers to the management and application of land in a certain period based on the attributes of land itself and the needs of economic and social development [1]. After the modern industrial civilization, the land use structure is out of balance, the environmental quality is deteriorating, and the resource reserves are drying up. Many pollutants caused by this have a serious impact on the balance of the ecological service system, resulting in the continuous decline of its service value. It is necessary to re-examine the balance between land use change and ecological service value so as to provide a scientific basis for the sustainable use of resources [2]. In particular, the rapid progress of urbanization and industrialization has revealed many negative effects related to ecology, climate and human settlements. Land use affects various types, areas and spatial distribution patterns of ecosystems, and also changes the structure, functions and processes of ecosystems, thus affecting the rational allocation of land resources [3]. Therefore, the quantitative research on the impact of land use change on the value of ecological services has become the research frontier and hot topic of many interdisciplinary subjects in the past century.
Ecosystem service function refers to the natural environmental conditions and functions formed and maintained by ecosystems and processes [4]. Ecological service value (ESV), as the core index to measure ecological security, is of great significance to the scientific management of ecosystems and the realization of sustainable development [5,6]. Humans began to study the ecosystem service system in the 1960s, however, due to the limitations of the research environment and technical means, only some research methods were provided, and their value was not quantitatively evaluated [7]. In the 1990s, Costanza et al. defined the research method of ecological service value for the first time, thus laying the research foundation of ESV [8,9]. After the 21st century, many researchers such as Xie Gaodi et al. [10,11] conducted in-depth research on the basis of Costanza’s study and formulated the “table of equivalent value of ecological services per unit area of China’s terrestrial ecosystem”. Since then, they have revised it to varying degrees according to China’s land use conditions [12] and ESV has been widely used in the assessment of grassland [13,14], forest [15], farmland [16], cities [17,18], and coastal zones [19]. At present, the methods for estimating ecosystem service value mainly include the functional value method [20,21] and the equivalent factor method [22], but the former involves many parameters and is highly subjective, and the equivalent factor method is widely used [23]. The existing documentary achievements are substantial, which can provide technical ideas, model algorithms and other references for this study.
Throughout the current research, many scholars selected typical representative areas, and took the measurement of land use ecosystem service value as the main body to further explore the laws of space-time evolution and influencing factors. The spatial scale employed by the study is mainly macro and meso, and the micro scale level is scarcely used. It is even more rare to propose zoning differentiation management and control measures from the perspective of spatial zoning [24]. In order to further divide land use ecological function areas and put forward differentiated pattern optimization control measures, this paper, taking Chayu County, a typical alpine valley area in Southeast Tibet as an example and based on the remote sensing interpretation of three periods in 2000, 2010 and 2020 and the formation of 30 m × 30 m grid data, employs the three-level spatial scale from the village level, the township level to the county level to converge step by step, analyze the changes in the quantity and degree of regional land use, calculate the ecosystem service value and analyze the spatial-temporal evolution characteristics. The research results are expected to provide theoretical basis and technical support for deepening land use ecosystem service value.

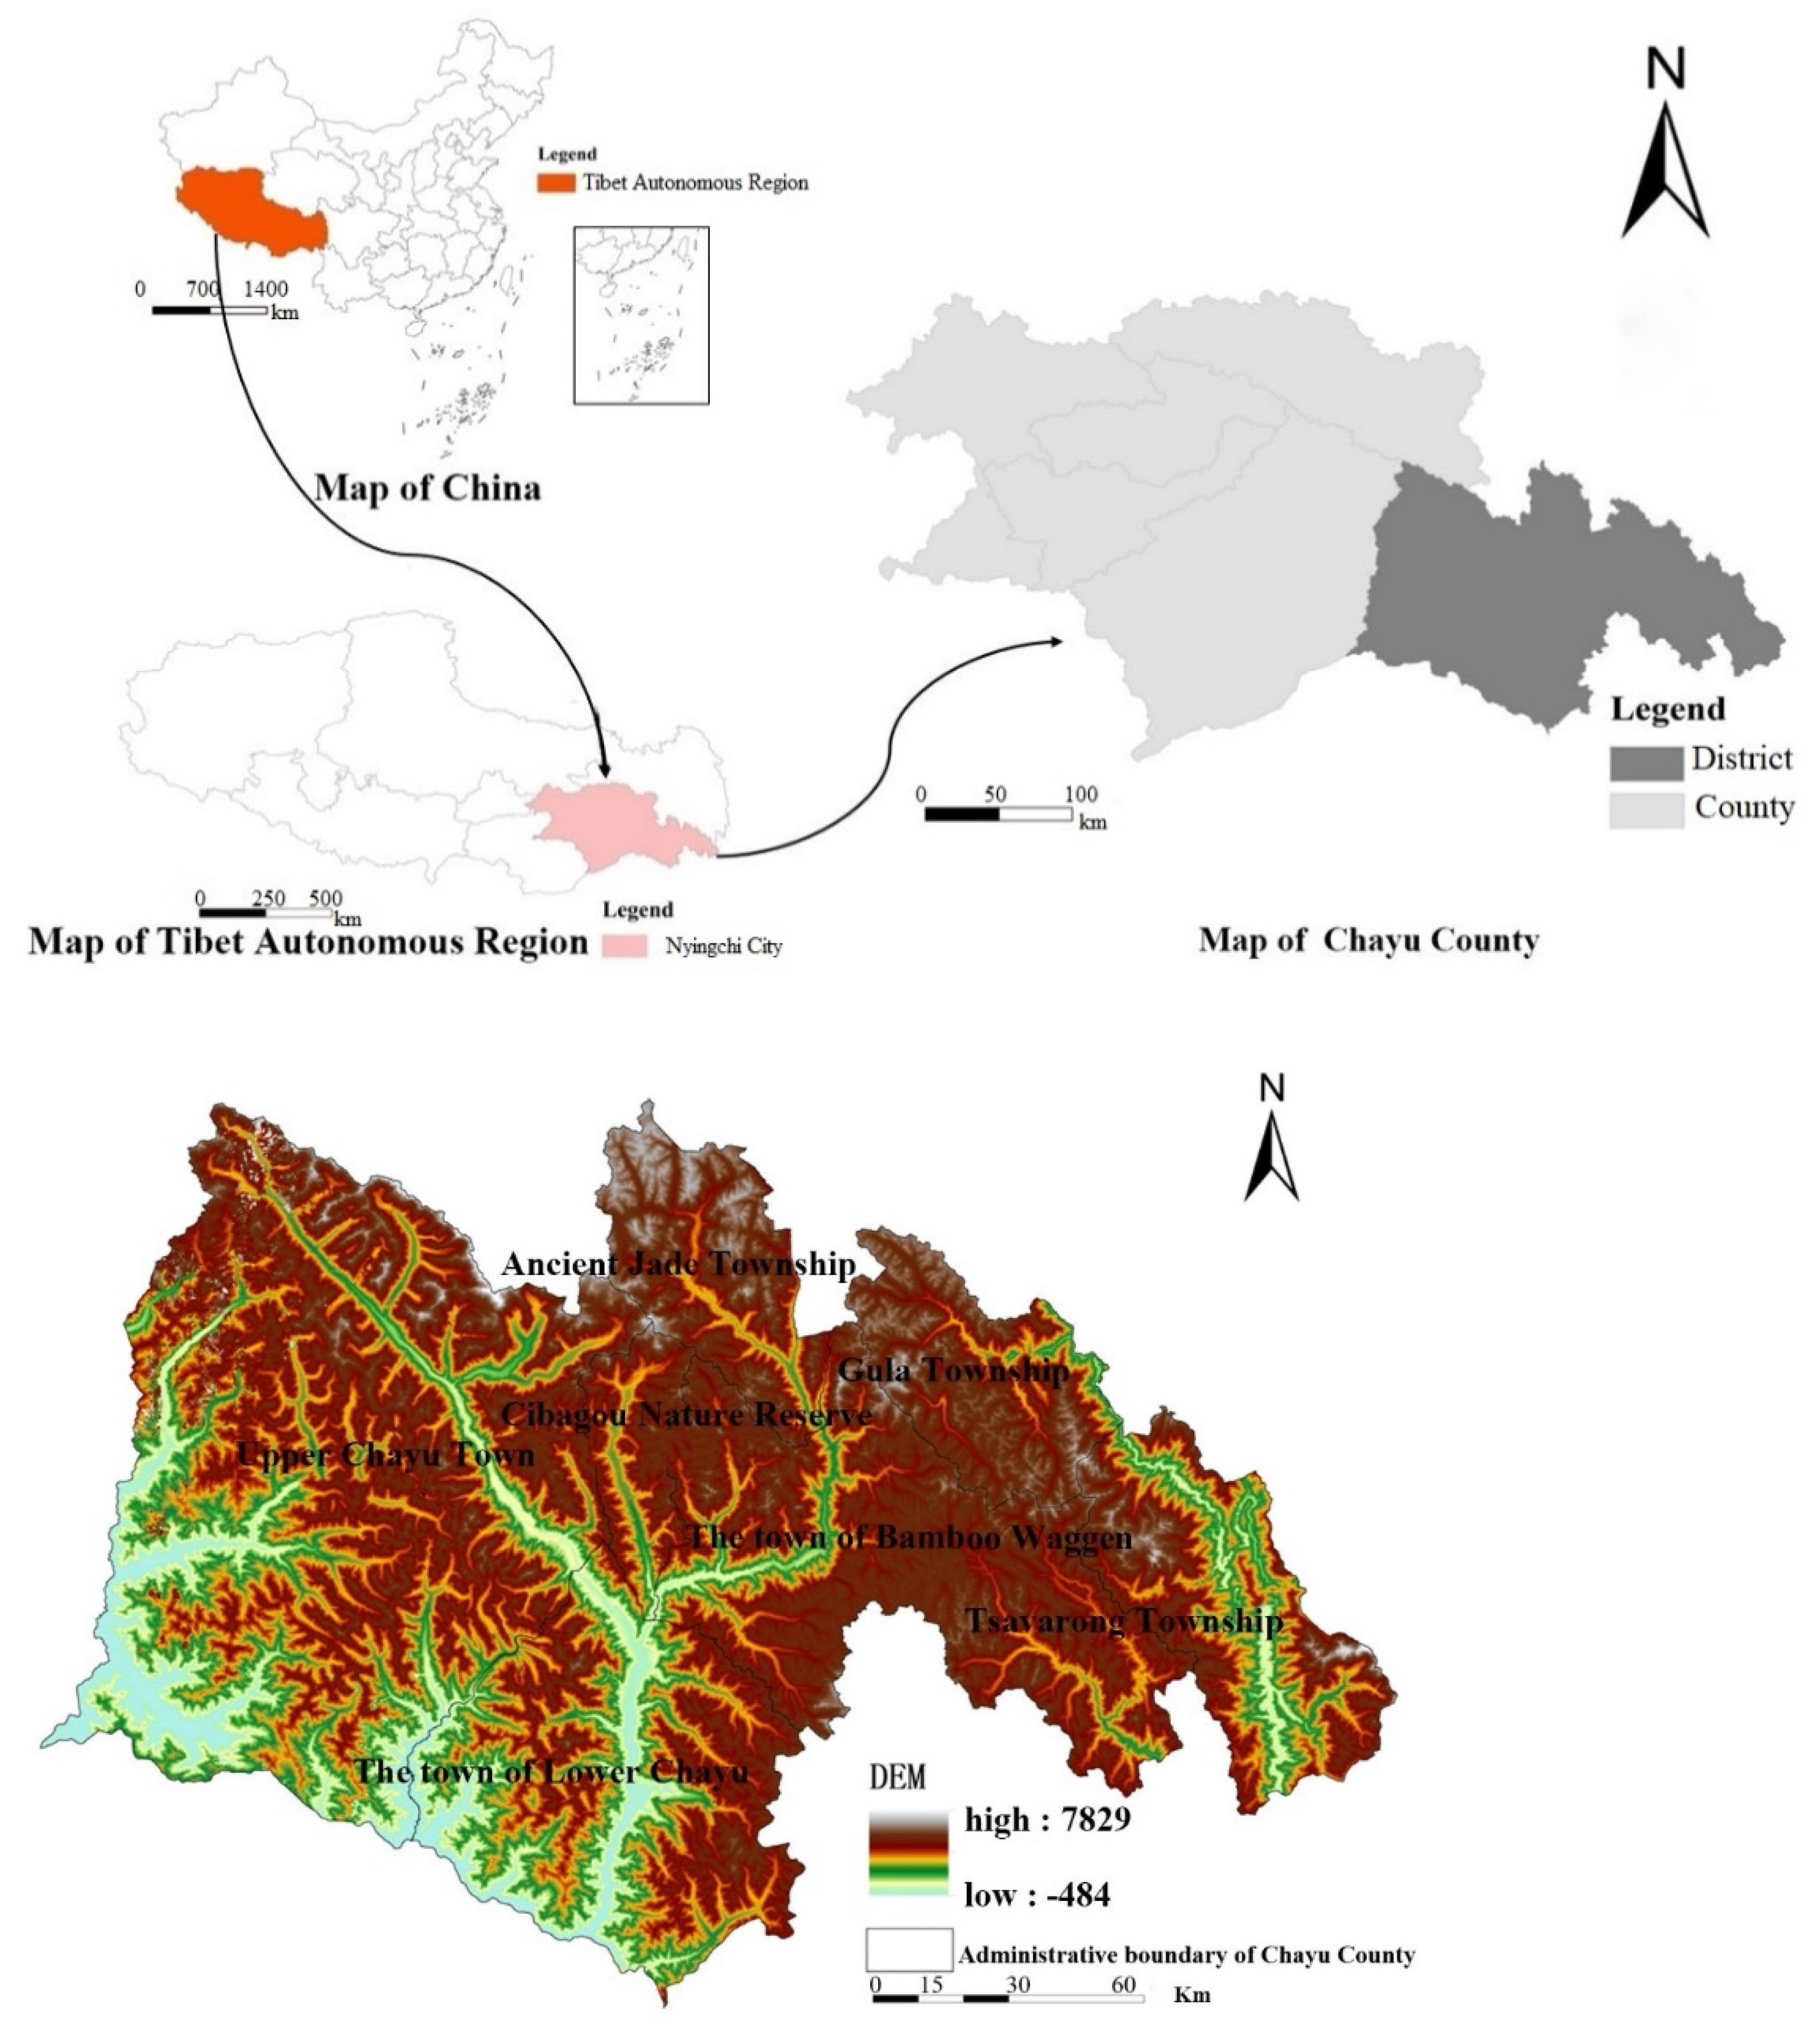
2. Overview of the Study Area

Chayu county is a typical area of Southeast Tibet with high mountains and valleys in the western section of Hengduan Mountains (Figure 1). The terrain is high in the northwest and low in the southeast, with a wide vertical height difference. Affected by the Indian Ocean warm current in the south and clamped by derma snow mountain in the north, the high altitude and undisturbed natural environment jointly determine the high sensitivity of the ecosystem. The county covers an area of 31,400 km2, with forest land taking the absolute advantage, followed by grassland and unused land. The unique topography, climate and hydrothermal conditions make it one of the regions with richest Mountain Biodiversity in Tibet and even China. Having a variety of ecological types and rich biological resources, with forests, wetlands, grasslands, lakes, deserts and other ecosystems distributed, the ecosystem in this county is extremely fragile and has poor anti-interference ability. Once damaged, it is difficult to recover and biodiversity is facing severe challenges. It is extremely important to carry out the research on the value of land-use ecosystem services in this region.

3. Data Sources and Research Methodology

3.1. Sources of Data

Since 2000, China has increased social and economic construction and paid attention to the improvement of the ecological environment. Considering the availability of data and comparative differences, this study, taking 10 years as a period, selects three time spans of the case sites in 2000, 2010 and 2020. The administrative division data of Chayu County are provided by the State Administration of Surveying, Mapping and Geoinformation (https://www.ngcc.cn/ngcc/, accessed on 8 January 2022). The land use data of 30m spatial resolution in 2000, 2010 and 2020 in Chayu County are all from the land use status remote sensing monitoring database downloaded by Globe Land30 (http://www.globallandcover.com/, accessed on 25 December 2021), with 30 m multispectral images as the main data source for production, including (Landsat) TM5, ETM+ and HJ-1 multispectral images. According to the type with the largest area occupied within 30 m, the land use type is reclassified, so that the land use type is divided into 10 types of land cover: arable land, forest, grassland, shrubland, wetland, water body, tundra, artificial bare land and glacier and permanent snow. In view of the needs of this study, forests and shrublands, artificial surfaces, bare land and glaciers and permanent snow are classified as woodland, construction land and unused land, respectively. Data on grain prices, yields and sown areas are from the 2020 China Agricultural Product Price Survey Yearbook and the 2020 Tibet Statistical Yearbook.

3.2. Research Methodology

3.2.1. Land Use Change

(1)
Model of land use quantity change
The analysis of the total change of land use type can help to understand the overall situation of regional land change, and the dynamic degree of land use can quantitatively present the speed of regional land use change; the formula is as follows:
K = S i n S o u t S i 0 × 1 T × 100 %
where K is the annual change rate of land use type; S i n is the inflow area of a certain land type; S o u t refers to the outflow area of a certain land type; S i 0 is the area of a certain land type at the initial stage of the stage; T is the span of research years.
(2)
Land use degree change model
The comprehensive index of land use degree (L) indicates the degree of human development and utilization of regional land and reflects the two-way impact of land on its natural attributes and human activities, which is an important indicator to measure the depth and breadth of regional land use [25]. The formula is as follows:
L = 100 × i = 1 i = n A i × B i
where L is the index of land use degree; A i is the classification index of the grade i , referring to the existing studies [26], unused land = 1, forest land, grassland and water area = 2, cultivated land = 3, construction land = 4; B i is the percentage of land use type area of class i in the total area.

3.2.2. Ecosystem Service Value Assessment

(1)
Value revision assessment
Revision based on grain price: according to the research of Xie Gaodi et al. [12], 1/7 of the economic value of the annual natural grain yield of the farmland with an average yield of 1 hm2 is a standard ecosystem ecological service value equivalent factor. To eliminate the impact of crop price fluctuations in different years on the total value, taking the sown area, the yield and average price of crops of the five major crops (rice, wheat, highland barley, soybean and corn) in Tibet in 2020 as the basic data, the economic value of food crops in the farmland ecosystem per unit area is calculated by the formula as 297.21 yuan/km2.
E n = 1 7 i = 1 n q i p i M
where E n is the economic value (yuan/hm2) of providing food production services for the farmland ecosystem within the unit area of the study area; n is the main food crops in the study area; q i is the price of crop i (yuan/kg); p i is the total yield of crop i (kg); M is the total area of n kinds of food crops (hm2).
Taking this as a benchmark and taking the spatial-temporal heterogeneity of ecosystems into account, the value coefficient of ecosystem services in the study area needs to be further revised. Referring to the biomass factor table of farmland ecosystems in each region of the country given by Xie Gaodi et al., the biomass factor of farmland ecosystems in the study area is determined to be 0.75, and through revising the biomass factors of various services provided by farmland ecosystems, the value coefficient tables of ecosystem services of different land use types will be generated. The ecosystem services value coefficients of land use type is shown in Table 1.
(2)
Value dynamics
The value of ecosystem services of different land use types is equal to the area of different land types multiplied by the corresponding ecosystem service value coefficient, and the change in the value of ecosystem services of land use types in the study area can be expressed by EV (value dynamic degree) of the ecosystem service. The formula is as follows:
E V = E A V b E V A a E V A a × 1 T × 100 %
where E A V a and E A V b are the ecosystem service value of a certain land use type at the initial stage and at the end of the study, respectively; T is the research years.
(3)
Sensitivity index
The sensitivity index is employed to analyze the sensitivity of ecosystem services in the study area. The calculation formula is as follows:
I = | E S V i E S V j E S V j L i L j L j |
where I is the sensitivity index of ecosystem service value; E S V i is the ecosystem service value in year i ; E S V j is the ecosystem service value in year j ; L i is the index of land use degree in year i ; L j is the index of land use degree in year j .

3.2.3. Spatial Agglomeration of Ecosystem Service Value

(1)
Kernel density analysis
Kernel density estimation (KDE), as one of the density estimation methods in the spatial analysis tools built into ArcGIS software, depends on a filter window to define nearby objects.
f n = 1 n h i = 1 n k ( x x i h )
where f n is the estimated value of ESVI distribution kernel density; n is the number of plots; h is the bandwidth or smoothing parameter; k is the kernel density function, and x x i is the distance from the measured block x to the sample block x i .
(2)
Spatial autocorrelation analysis
Spatial autocorrelation analysis is an important method and effective means to quantitatively study spatial relationships and analyze spatial patterns. Ecosystem service value is directly related to the distribution of natural geographical elements and the social and economic development of the region. With randomness and structure in space, these factors have geoscience characteristics. Therefore, ecosystem service value, like various geographical entities, has a certain spatial correlation, and geoscience statistical analysis methods such as spatial autocorrelation analysis can be employed [27,28]. The global spatial autocorrelation (GSA) and local spatial autocorrelation (LISA) are used comprehensively to dig into the spatial pattern and evolution characteristics of ESVI, and reveal the correlation between the attribute values of spatial units and other attribute values in adjacent space. The spatial autocorrelation analysis is based on Geodal.18 software to complete.

4. Results and Analysis

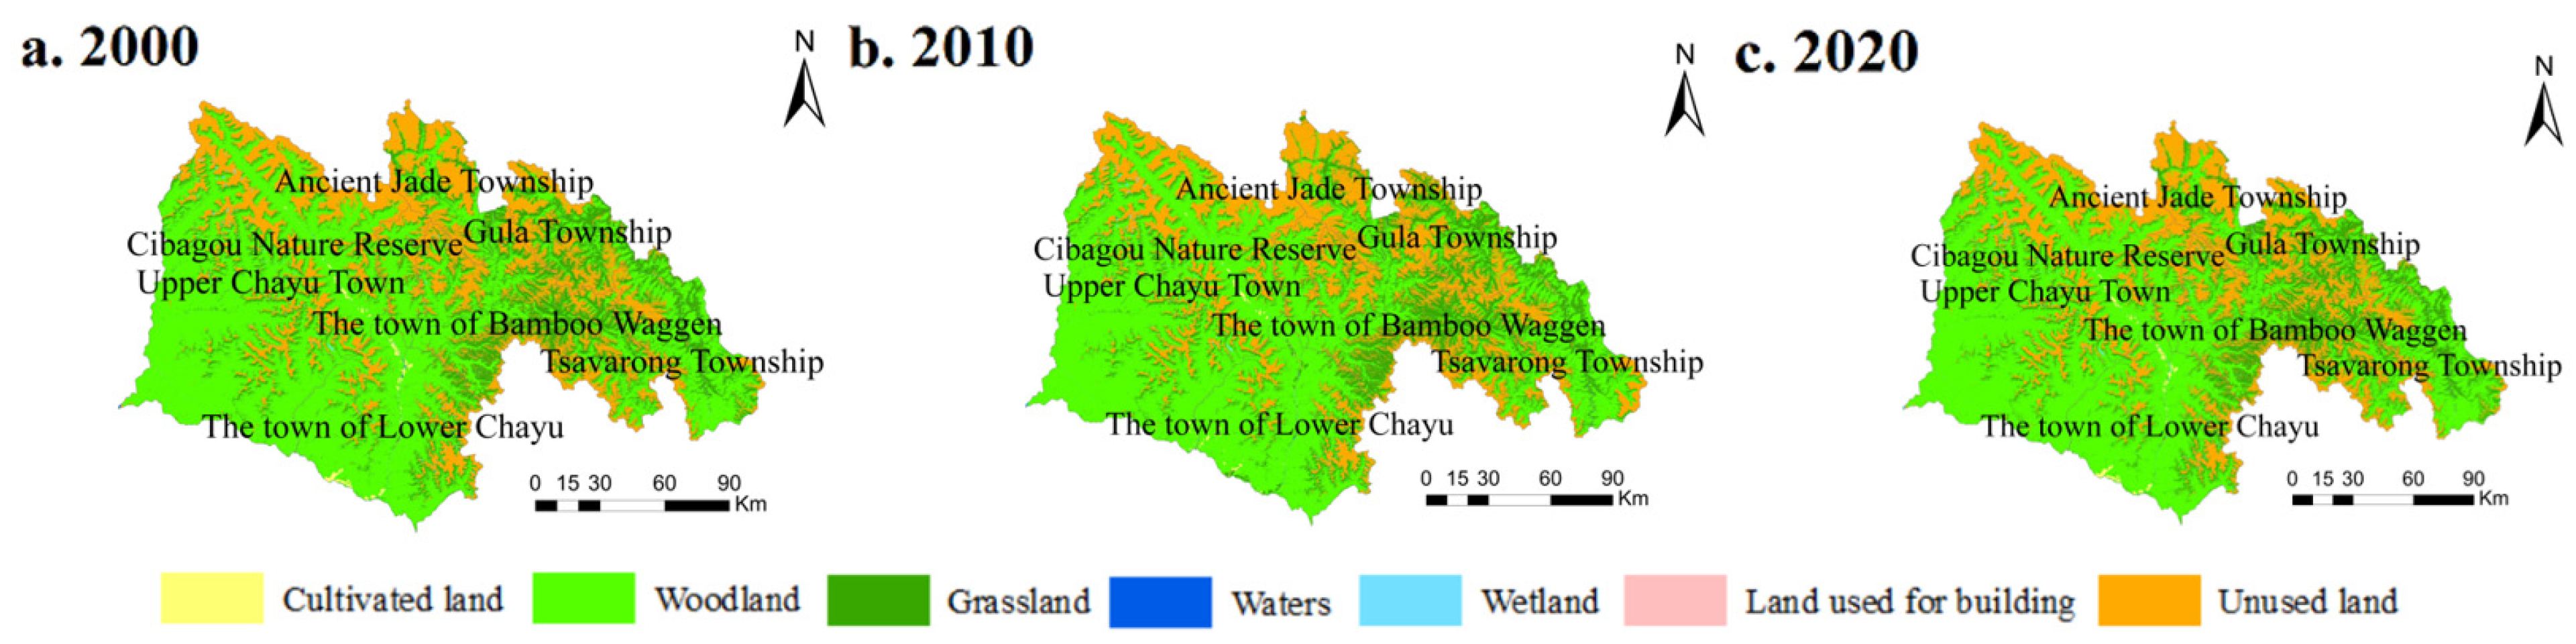
4.1. Analysis of Land Use Change

4.1.1. Characteristics of Changes in Land Use Quantity

According to Figure 2, from 2000 to 2020, the county forest land accounted for the largest area, followed by grassland and unused land. The cultivated land distribution transferred gradually from the marginal area in 2000 to the inner river valley while the construction land was mainly distributed in the central area of each township, with the “strip” spatial distribution mainly in the Upper Chayu Town and Lower Chayu Town, and the increase in construction land in the past 20 years was small.
The proportion of land use types in three different periods of 2000, 2010 and 2020 is shown in Table 2. From the perspective of the overall characteristics of land use types, the changes in the main land use types in the three periods except forest land, grassland and unused land are not obvious due to their small size. The highest proportion of area is forest land, followed by unused land, both of which account for more than 74% of the total area of the study area. From the perspective of the characteristics of land use type change, the area of unused land has increased by 45.44%, with a continuous increase of 3377.26 km2 in the past 20 years while the grassland area has continued to decrease by 1935.62 km2 in 20 years, a decrease of 29.29 percentage points. The area of the water area increased first and then decreased and the wetland area remained almost unchanged.
The transfer matrix of different land use types from 2000 to 2020 (Table 3) is obtained by employing the analysis tool of Arc GIS. The main characteristics of land use transfer are as follows: (1) The forest land and grassland have the largest area of transfer-in and transfer-out, 2191.24 km2 and 2978.08 km2, respectively, in which the main source of transfer-in is cultivated land and unused land while the main source of transfer-out is unused land and waters; (2) Unused land, as a type of land that has not yet been utilized or is difficult to utilize, has the largest difference between the transfer-in area and the transfer-out area, and its main transfer-in and transfer-out source are cultivated land, forest land and grassland; (3) The transfer-in area and the transfer-out area of cultivated land are 21,934 km2 and 22,917 km2, respectively, and the main transfer-in and transfer-out sources are woodland and grassland, including a certain proportion of waters. This shows that the scale replacement between unused land, woodland and grassland in the study area has a great impact on the land use structure. The scale increase in the secondary land types of unused land has mainly been caused by glaciers and permanent snow, and the change of land types has first decreased and then increased in the past 20 years, with the increase from 507,861.61 km2 to 975,967.01 km2 in 2020. Affected by the natural environment and geographical location, the high altitude greatly hinders the entry of warm and humid air currents in the southern Indian Ocean, and due to the low temperature, the snow encroaching upon grasslands and woodlands is difficult to melt, making the unused land grow.

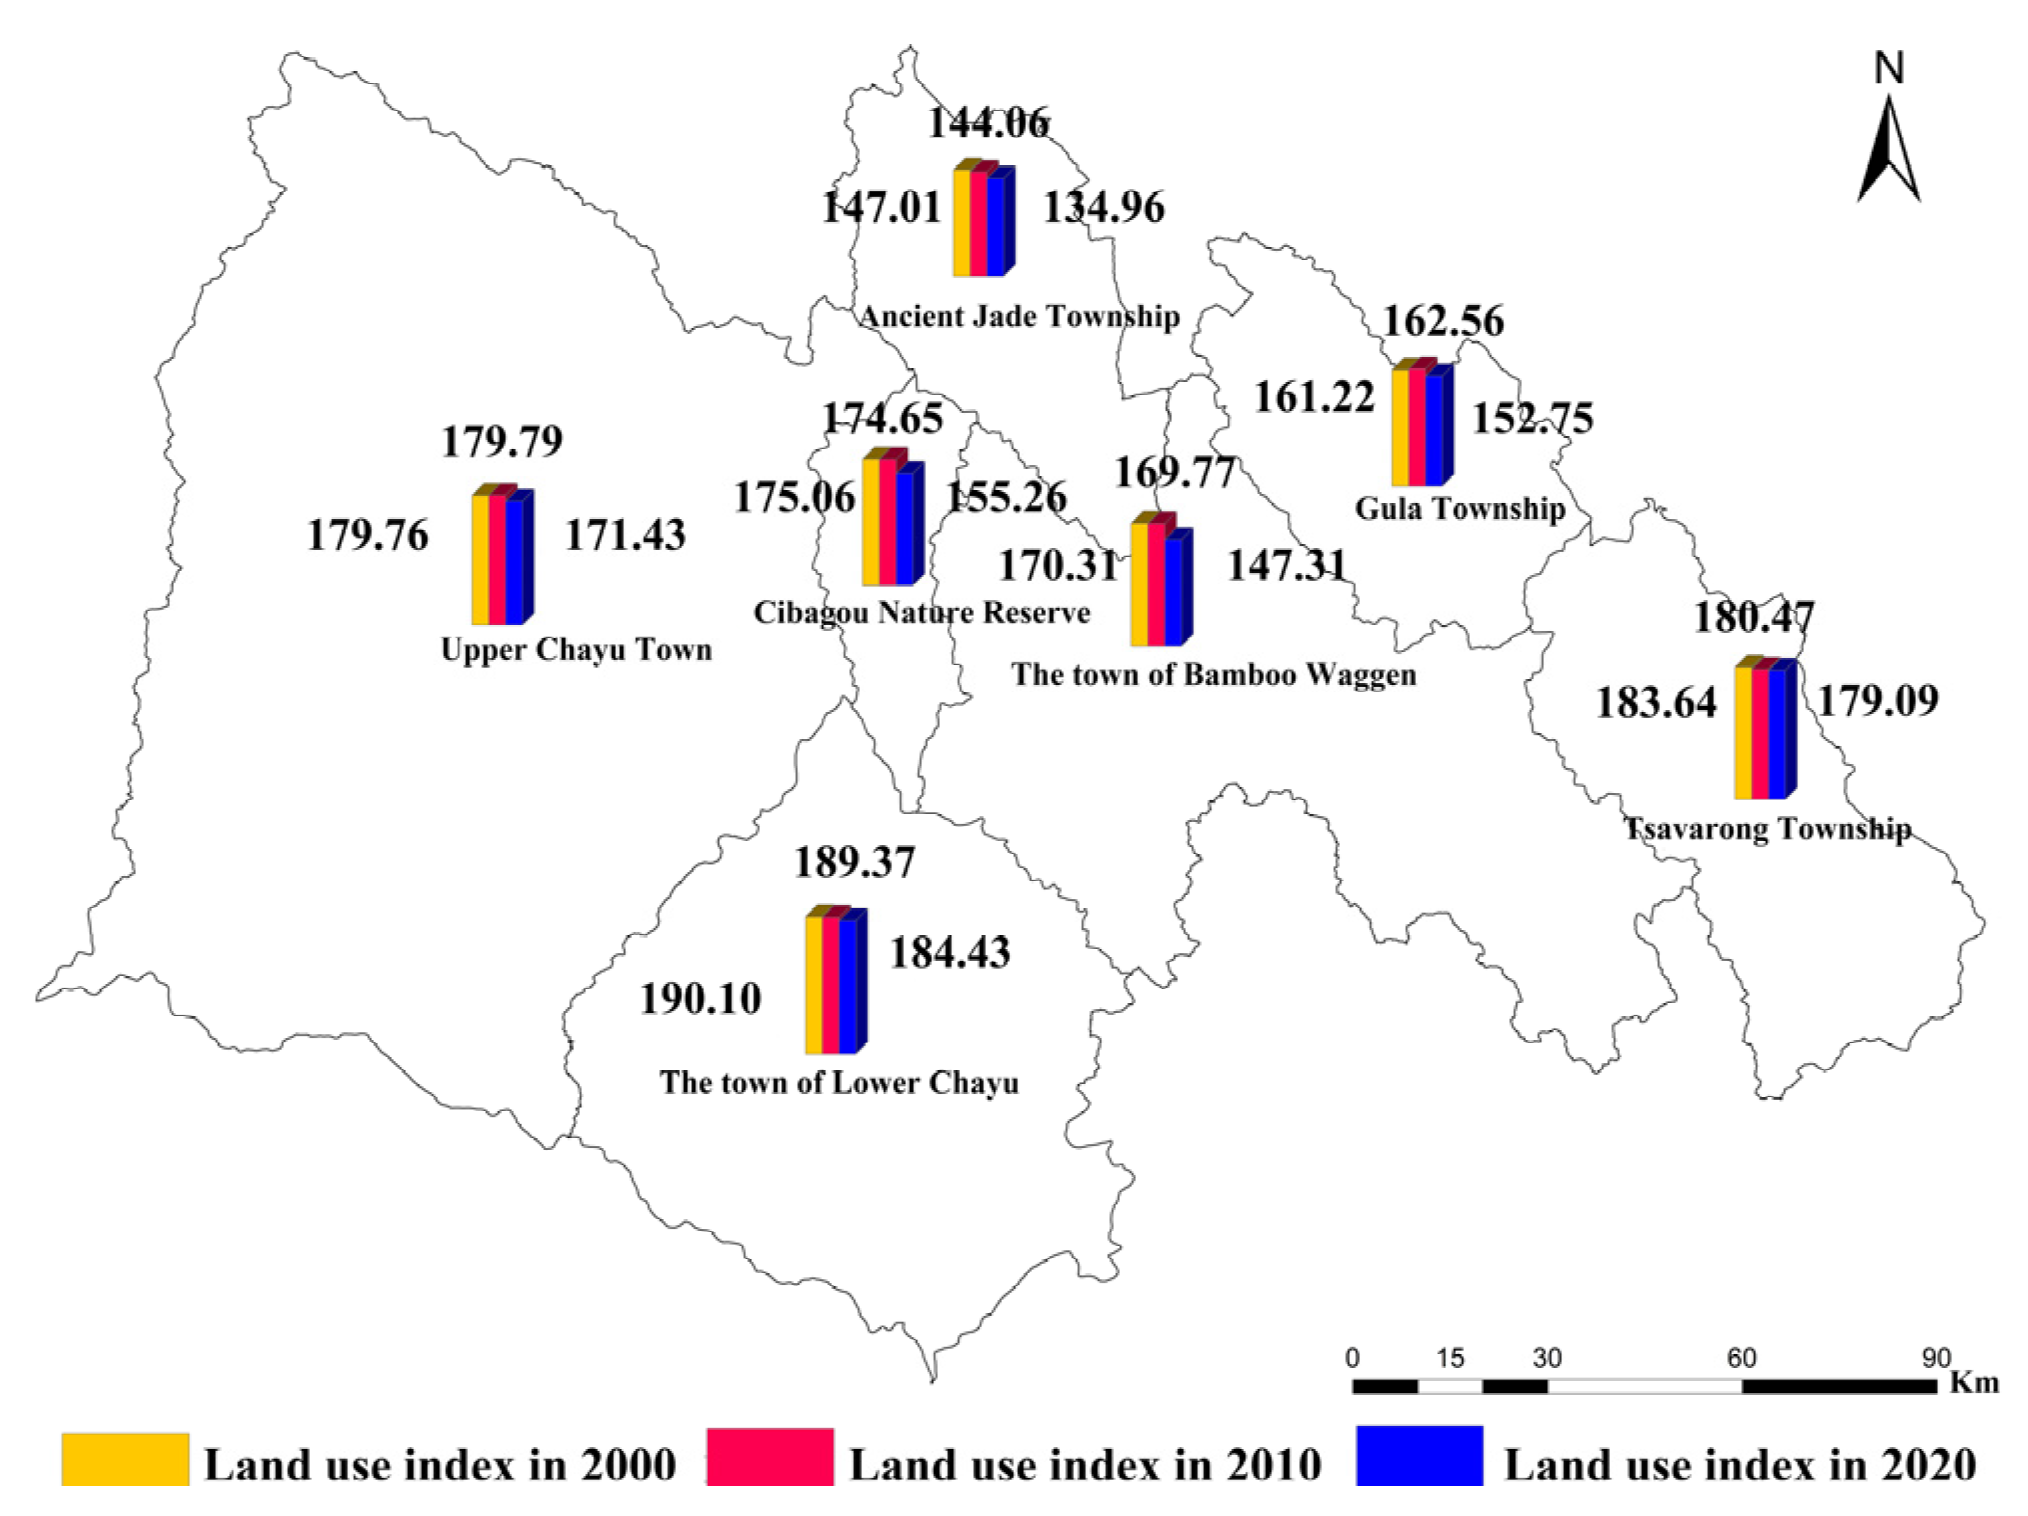
4.1.2. Characteristics of Land Use Change

A gradually decreasing distribution pattern of “southwest- northeast” of the land use degree index during the study period can be seen from the spatial distribution map of the land use degree index from 2000 to 2020 (Figure 3). The variable quantity of land use degree from 2000 to 2010 was 3.35, and 3.24 from 2010 to 2020. Since the variable quantity of land use degree in these two periods was greater than 0, the overall study area in these two periods was in development.
From the specific point of view of each township, the land use degree index showed a decreasing trend of different degrees from 2000 to 2020, of which Zhuwagen Town (23.00) decreased the most, followed by Cibagou Nature Reserve (19.79) and Guyu Township (12.06). The decrease is because of the increase in the scale of unused land. A considerable part of the unused land structure is glaciers and permanent snow, the scale of which has increased during the study period, resulting in a continuous decline in the impact of human activities on land use.
From the specific point of view of each land type, the utilization degree of forest land from 2000 to 2020 is the highest while the utilization degree of construction land is the lowest. The degree of utilization of unused land tended to increase year by year between 2000 and 2020 while the utilization of woodland and grassland showed a downward trend from 2000 to 2020. The degree of utilization of unused land showed an upward trend between 2000 and 2020, and the actual change was more obvious, which was since unused land accounted for a relatively large proportion of the land use structure, with an increase of up to 45.44% during the period. The conversion of land types was mainly based on unused land and grassland, so the variation of land use changed greatly. The actual change in the degree of land use of cultivated land, water areas and construction land between 2000 and 2020 is not obvious mainly due to the small base of the land scale itself.

4.2. Value Analysis of Ecosystem Services

4.2.1. Temporal Change Analysis of Ecosystem Services

Overall, ESV showed a decreasing trend between 2000 and 2020, from 964.596 billion yuan in 2000 to 866.642 billion yuan in 2020, a decrease of 16.98%. During the study period, the value of ecosystem services in woodland decreased the most, followed by grassland, with the smallest reduction in cultivated land, of which the reduction in woodland accounted for 70.55% of the total reduction. The value of ecosystem services in unused land increased the most while the wetlands increased the least, of which the increase in unused land accounted for 98.05% of the total increase. During the study period, the proportion of forest land area decreased from 54.56% in 2000 to 50.04% in 2020, but the proportion of ecosystem service value increased from 86.52% to 88.33%, with the net reduction in ESV of 69.108 billion yuan. The proportion of grassland area decreased from 21.04% in 2000 to 14.88% in 2020, and the proportion of ESV decreased from 11.06% to 8.70%, with the net reduction in ESV of 31.238 billion yuan, which shows that the contribution of woodland and grassland to ESV and the regulation of ecological environment are of great significance. The proportion of unused land area increased the most, from 23.66% in 2000 to 34.42% in 2020, and the proportion of ESV also showed an increasing trend, with a net increase in ESV of 3.237 billion yuan. The ratio of EVS from cultivated land to water areas is basically stable, and the ESV of wetlands is relatively small. The ESV changes of different types of land use are shown in Table 4.

4.2.2. Spatial Change Analysis of the Value of Ecosystem Services

With the help of ArcGIS spatial analysis technology and the square grid units of 30 m×30 m, the land use data of three periods of the study area were completed. On this basis, the ESVI in each raster cell is measured and analyzed and the spatial interpolation is carried out by kriging. Meanwhile, the natural breakpoint used, and the real situation of the study area fully taken into consideration, the ESVI in each raster is divided into four levels of lower, low, higher, and high according to (1000,2200), (2200), (3400), (3400,4600) and (4600,5800). Then, the spatial pattern distribution map of ESVI in three periods of the study area from 2000 to 2020 is obtained.
It can be seen from Figure 4 that the overall spatial distribution pattern of the study area is “high in the west and low in the east”. Specifically, the ESVI in the Middle East region is low while the ESPI in the east-west marginal area is higher. The ESVI in the western parts of the study area, such as Shangcha Town (Buzong Village, Xiba Village, Sports Village), Xiachayu Town (Shama Village, Buba Village, Rima Village) and Cibagou Nature Reserve, are larger while Guyu Township (Boxue Village, Bayi Village, Gujing Village), Gula Township (Shadui Village, Shamei Village, Oyu Village) and the high-altitude area of Ridong (Gada Village, Quwa Village) in the eastern part of Zhuwagen Town have smaller ESVI. ESVI is mainly based on two levels, the high and the low, whose average area accounts for 35% and 30%. The proportion of ESVI low-level area shows an increasing trend while the proportion of area high in ESVI and the ecological service value shows a decreasing trend, and the rate of change of area with low level of ESVI increases first and then decreases.

4.2.3. Analysis of Dynamic Change Degree of Ecosystem Service Value

During the study period, the dynamic change degree of the unused land ESV is all positive while that of the other land types is positive or negative. Only the cultivated land’s absolute value of ESV dynamic change degree in Xiachayu town is higher than the absolute value of the whole region, and that of the remaining townships is lower than the absolute value of the whole region, among which Zhuwagen Town, Tsavalong Township, Gula Township and Cibagou Nature Reserve have the smallest absolute value, indicating that the cultivated land in the above areas has decreased the most during the study period. The villages and towns where the absolute value of ESV dynamics of forest land is greater than the absolute values of the whole region include Zhuwagen Town, Guyu Township, Gula Township and Cibagou Nature Reserve, indicating that the forest lands in the above areas increased significantly during the study period. Therefore, the ecological environment quality has significantly improved. In terms of grassland, except for Shangchayu Town, Zhuwagen Town and Cibagou Nature Reserve, the absolute value of ESV dynamic change degree in the remaining townships is lower than the absolute value of the whole region, indicating that the large reduction in grassland areas in these places has an impact on the balance of the ecosystem to a certain extent. In regard to unused land, except for Xiachayu Town, Zhuwagen Town and Cibagou Nature Reserve, the absolute value of ESV dynamic change degree of unused land in the other townships is lower than the absolute value of the whole region, which can indicate that the use efficiency of unused land is gradually improving. The ESV dynamics of different land types are shown in Table 5.

4.2.4. Sensitivity Analysis of Ecosystem Service Value

Through measuring and analyzing the ecological sensitivity index of land use change in each township from 2000 to 2020, the range of overall ecosystem sensitivity index is [1.4501,4.6137]. With reference to relevant data [29,30], the area of ecosystem sensitivity index less than 1 is a non-sensitive area, and all towns and townships in the county cibagou nature reserves are sensitive areas. According to the numerical size of the sensitivity, the county can be divided into three types of areas: low sensitivity, moderate sensitivity, and high sensitivity. Under this subdivision, from 2000 to 2020, the townships that belong to the low sensitivity areas mainly include Shangchayu, Xiachayu, Zhuwagen, Gula Township and Nature Reserve, where the land use degree index is large while the increase in construction land is also large. However, thanks to the high EVS coefficient of forest land and grassland, the impact on the total amount of ESV is small, indicating that the ecological sensitivity of the above areas is in equilibrium. The moderately sensitive and highly sensitive areas correspond to Tsavalong Township and Gula Township, respectively, mainly located in the lower reaches of the Nu River and the Hengduan Mountains, with an average altitude of more than 2500 m. The types of land use in the region are mainly unused land and grassland, with strong environmental resilience, and the sensitivity index is generally in a good state.

4.3. Spatial Agglomeration Analysis of Ecosystem Service Value

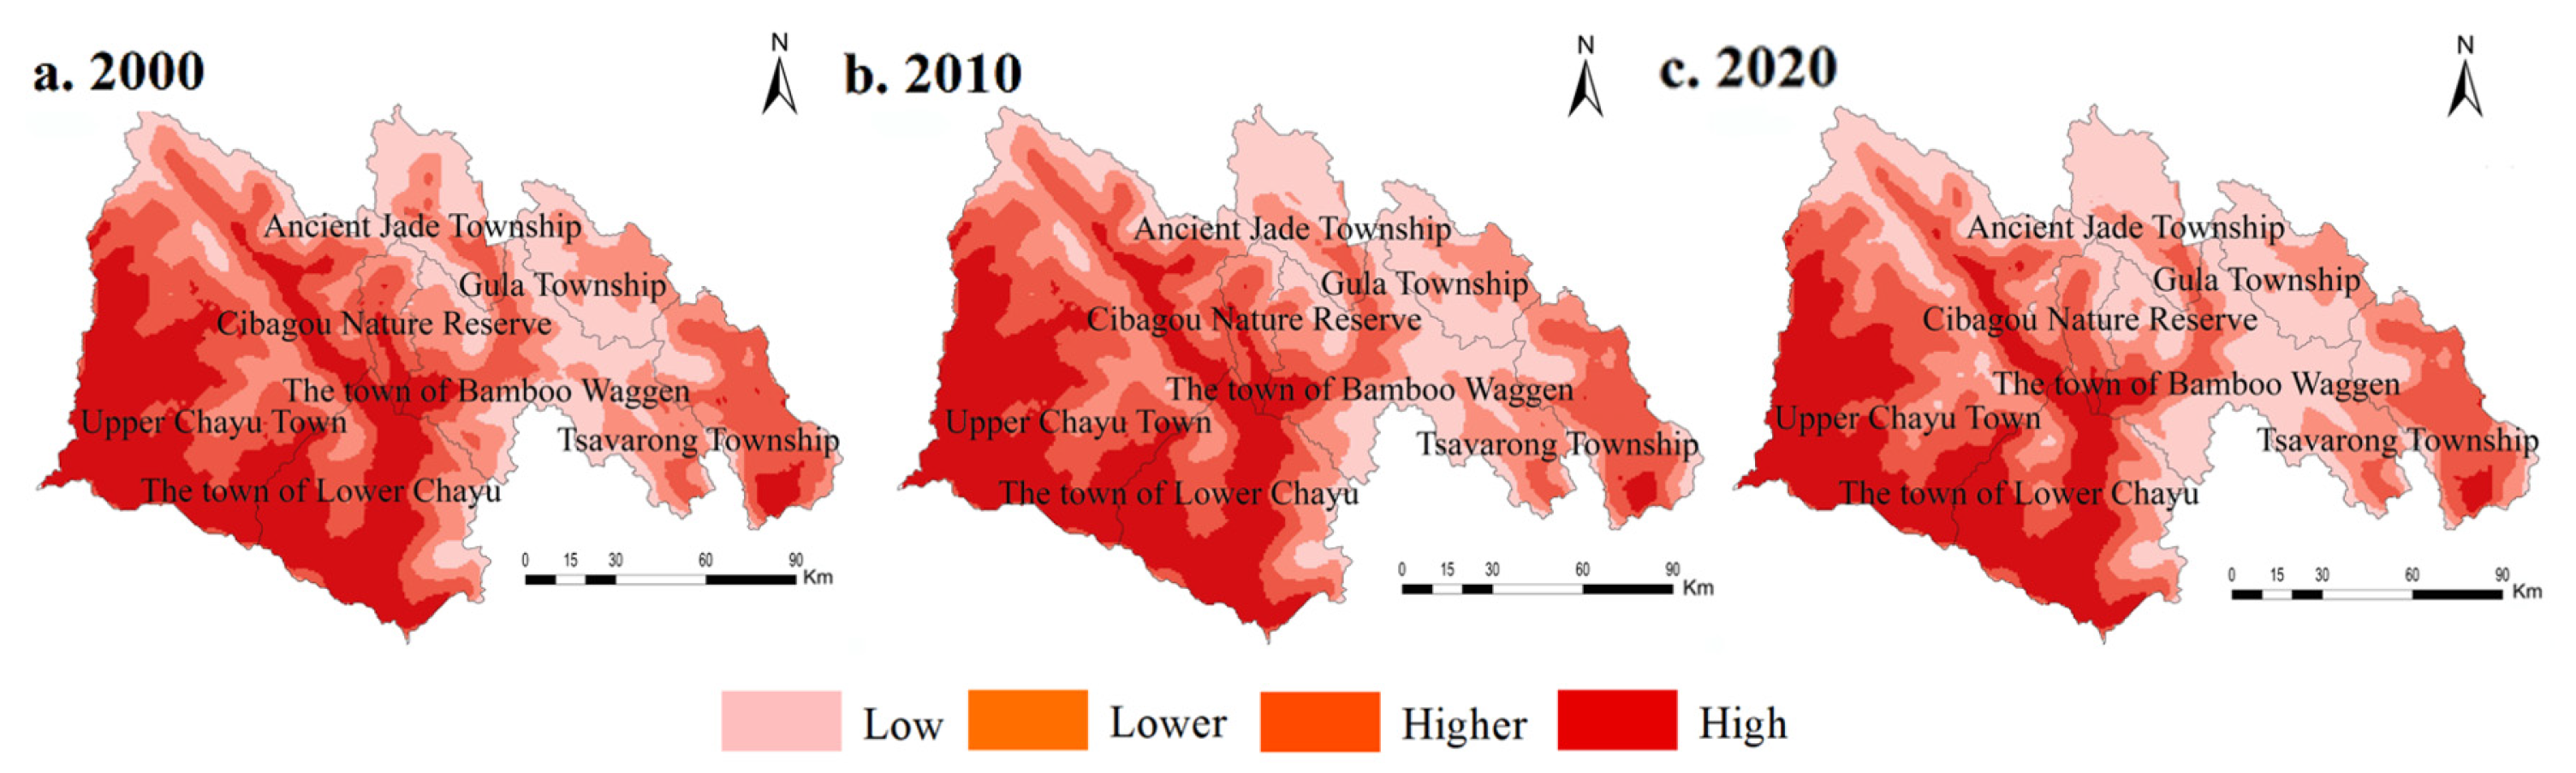
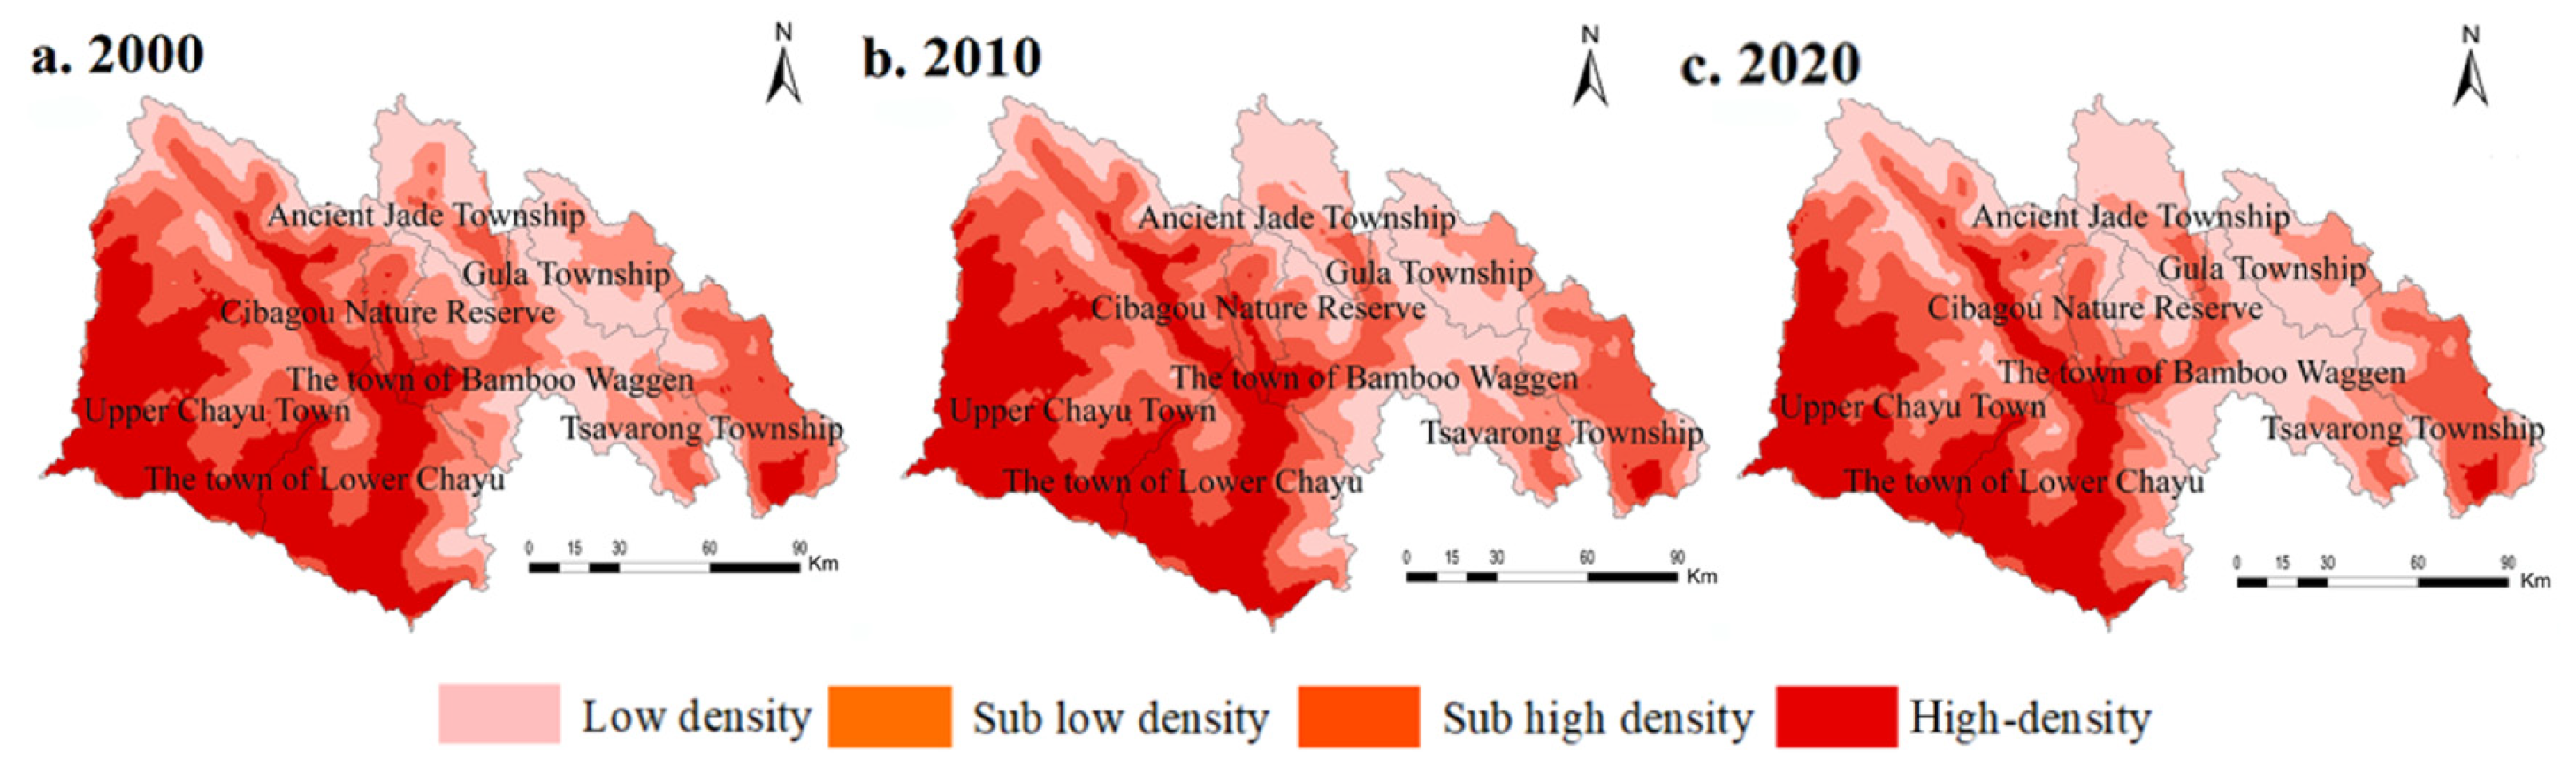
4.3.1. Kernel Density Analysis

The spatial distribution density of ESVI is calculated by using the kernel density function, and the natural breakpoint method is employed to divide the density value into four levels: low density area (0–89), sub-low-density region (89–127), sub-high density (127–166) and high-density region (166–255). The spatial difference in the distribution of ESVI density in the study area is significant (Figure 5), and the fluctuation of kernel density in each year is small.
Specifically, in 2000, the ESVI high-density areas were mainly located in Shangchayu Town (Buzong Village, Xiba Village, Sports Village), Lower Chayu Town (Tallinn Village, Shama Village, Xincun), the middle of Cibagou Nature Reserve, the western part of Zhuwagen Town (Baga Village, Xiongjiu Village), and the southern part of Tsavalong Township (Songta Village, Quzhu Village). In 2010, the ESVI high-density areas and the sub-high-density areas showed a contraction trend, with the most obvious contraction in the north of Guyu Township (Boxue Village) and the southeast of Zhuwagen Town (Gada Village). In 2020, the coverage of EVI high-density areas and sub-high-density areas were further reduced, with the scope of ESVI high-density areas in the northeast of Shangchayu Town (Buzong Village) reduced. The changes in 2010 were mainly reflected in the decrease in the sub-high-density and sub-low-density areas of ESVI in the southwest and southeast of the town of Zhuwagen. In summary, the spatial differentiation of ESVI kernel density in the study area during the three study periods is obvious, and the kernel density presents a spatial distribution pattern of “dense in the West and sparse in the East” as a whole.

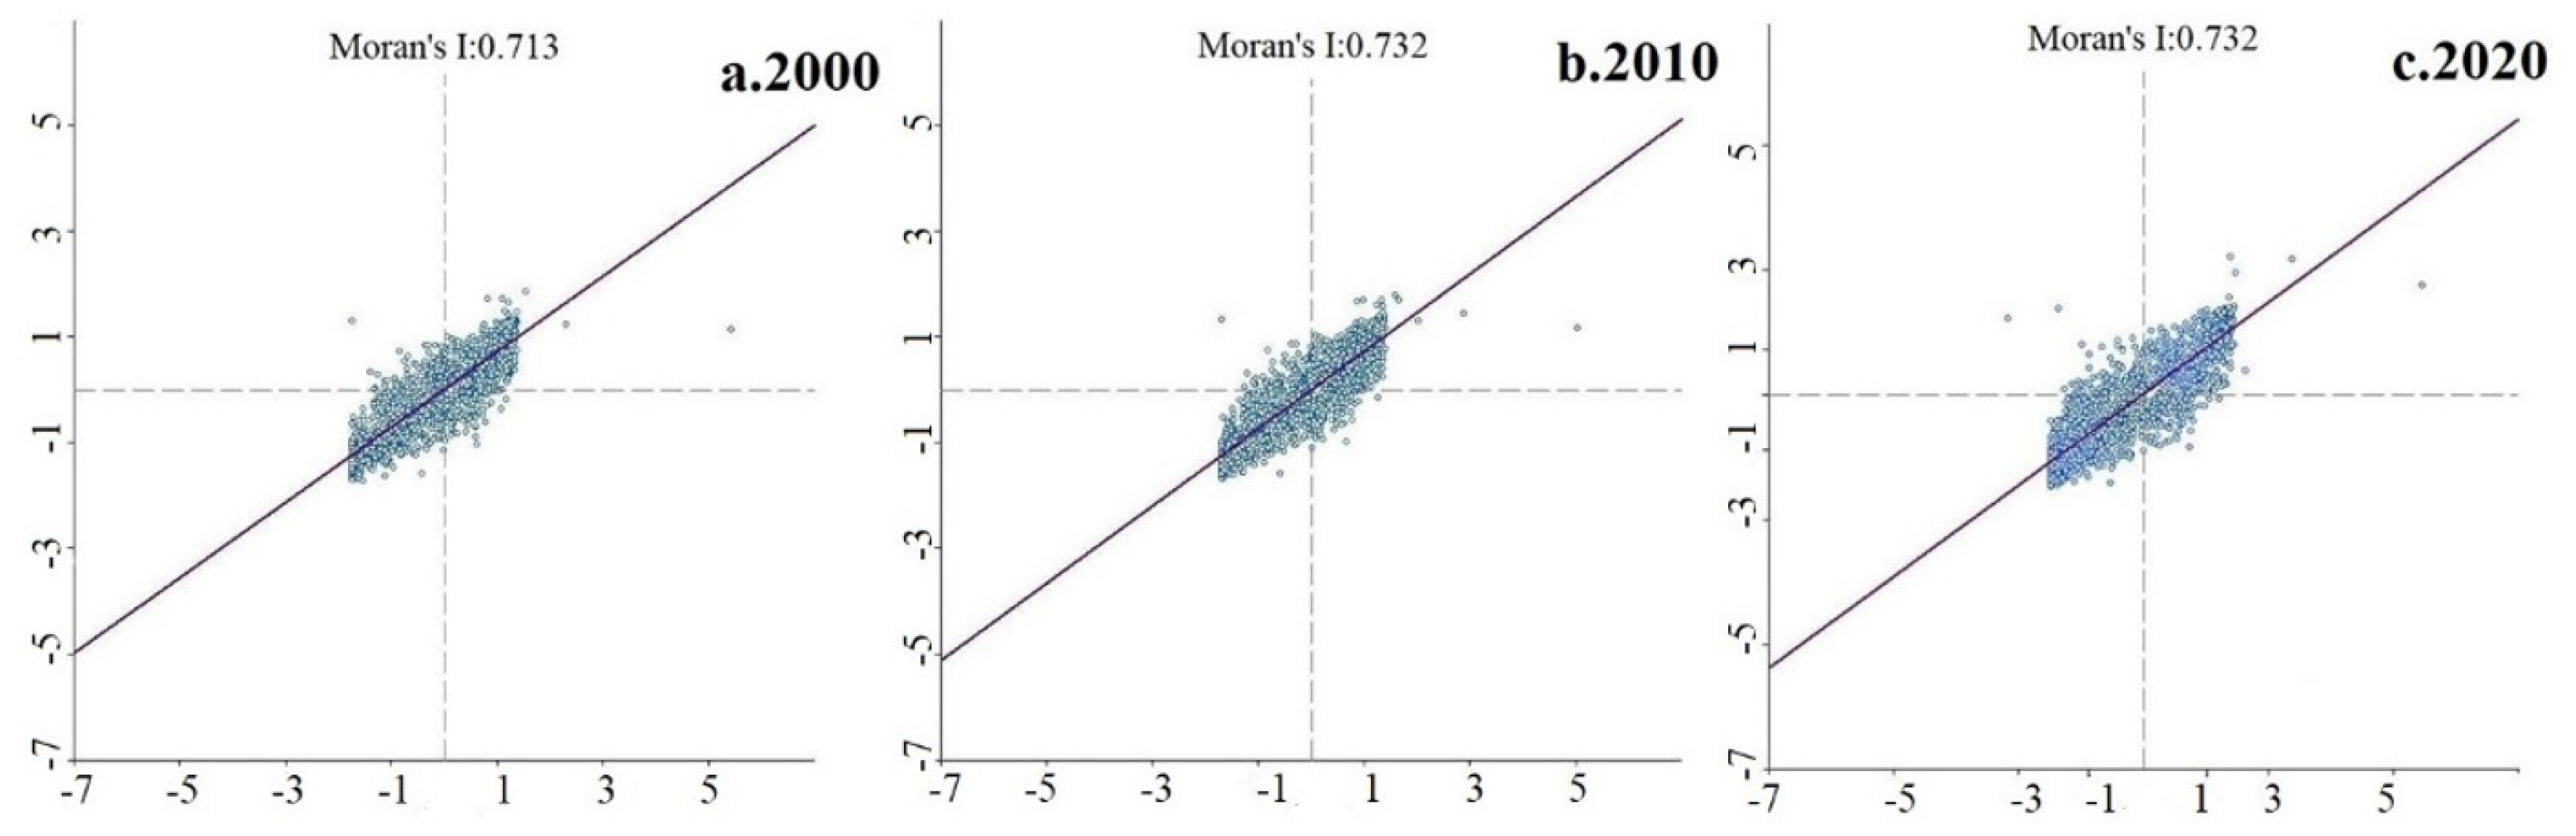
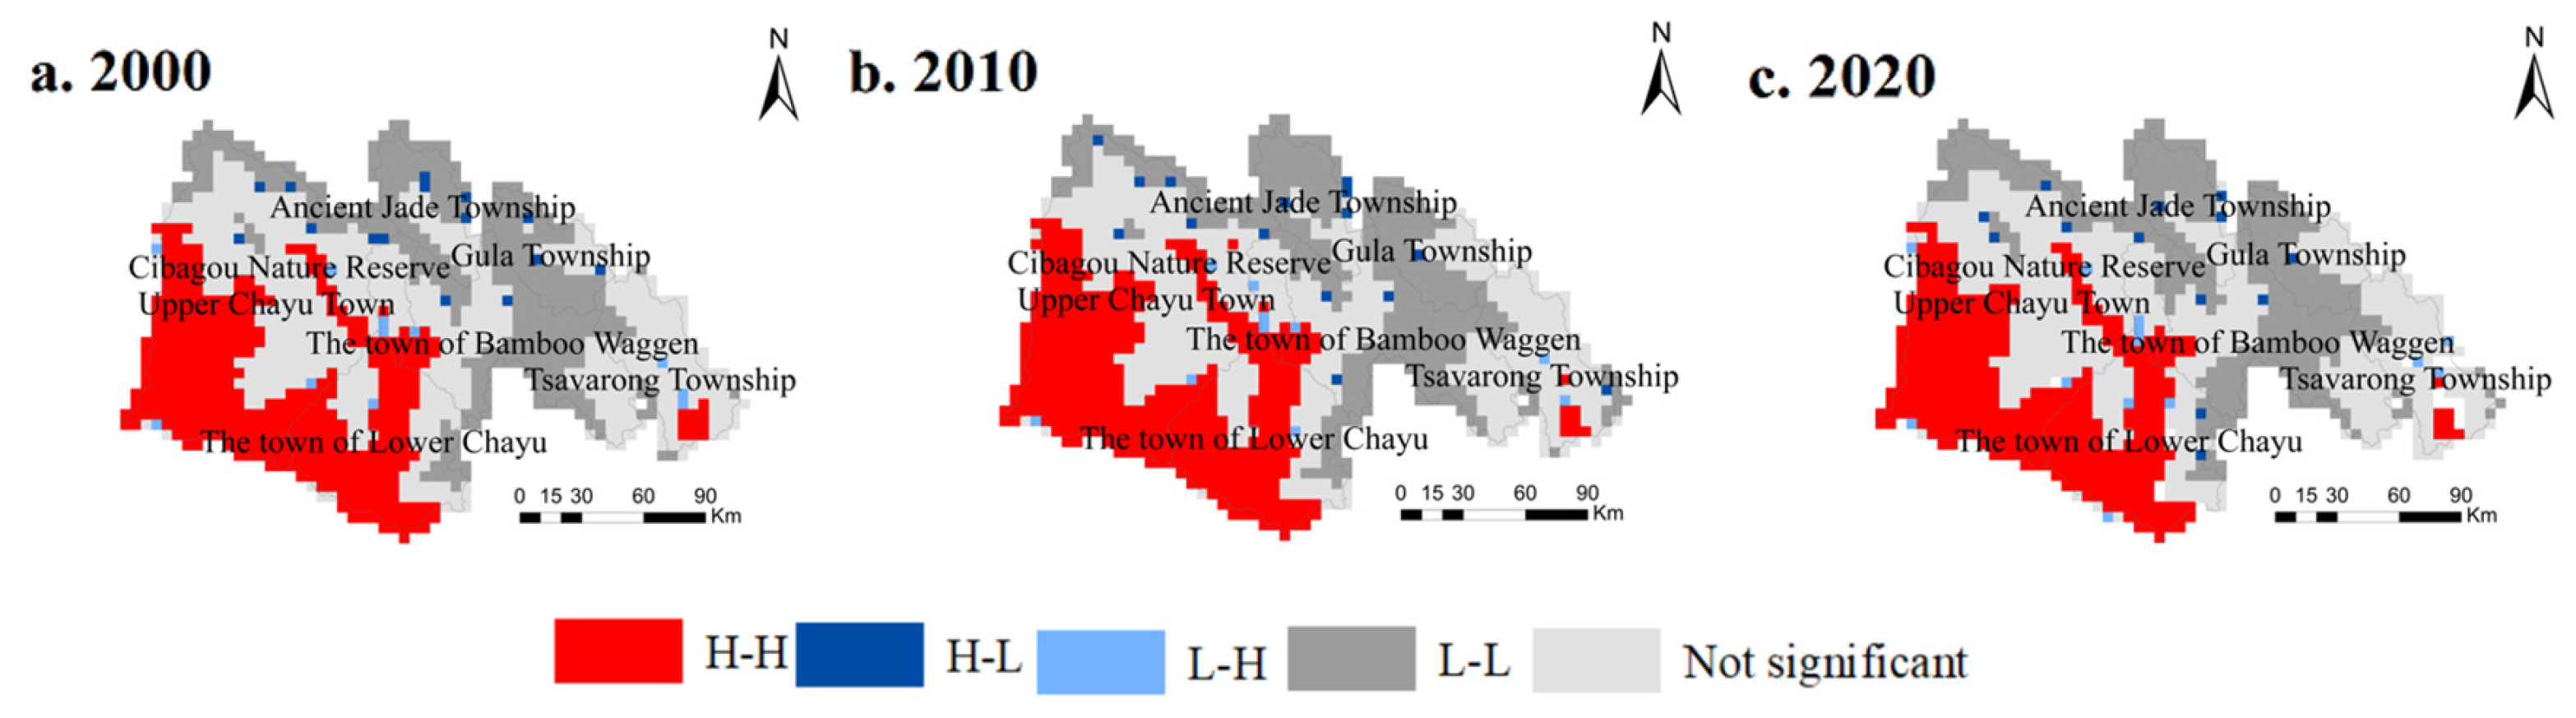
4.3.2. Spatial Autocorrelation Analysis

Through analyzing the spatial autocorrelation analysis of the ESVI in each grid in the study area, the global Moran’I value in the study area has always been greater than 0.71 in the past 20 years and the p value in most areas has been greater than 0.001, indicating that the ESVI in the townships and towns in the county as a whole has always shown significant positive spatial autocorrelation, some regions displaying obvious spatial aggregation, but the distribution in most regions is relatively random.
Moran’I scatter chart displays the spatial connection pattern between the regional and the surrounding unit attribute. What can be seen from Figure 6 is that the scatter points are mainly distributed in the first quadrant (HH) and the third quadrant (LL) while scatter points distribution in the second quadrant (LH) and the fourth quadrant (HL) is relatively small. Combined with the global Moran’I index, the chart indicates that the spatial distribution intensity of ESVI in different regions of the study area has a high spatial positive correlation and the distribution law is relatively consistent. From 2000 to 2020, the local Moran’I index increased first and then remained unchanged, combined with the situation that the scatters distributed along the trend line increased first and then remained unchanged, which reflected the trend of local spatial autocorrelation in the study area first increased and then remained unchanged.
Spatial agglomeration and spatial differentiation of ESVI are roughly similar (Figure 7). In 2000, the ESVI high-high agglomeration areas were mainly distributed on the southwest side of Shangchayu Town (Xiba Village, Sports Village), the central area of Lower Chayu Town (Kyoto Village, Tamar Village), a small part of Tsavalong Township (Songta Village, Quzhu Village), several western parts of Zhuwagen Town (Baga Village) and the Cibagou Nature Reserve, which were less affected by human interference and construction land expansion in the spatial area. The low-low agglomeration of ESVI is mainly distributed in Gula Township (Shamei Village, Shadui Village, Longri Village), Guyu Township (Boxue Village, Bayi Village, Gujing Village) and the eastern part of Zhuwagen Town (Gada Village, Jitai Village, Quwa Village), mainly because of the concentrated distribution of unused land in this area and the relatively small distribution of woodland, resulting in low ESVI. ESVI low-high agglomeration areas and high-low agglomeration areas are distributed in a “sporadic” manner within each region. In 2010, Tsavalong Township (Deng Xu Village) and Shangchayu Town (Baya Middle Village) were added to the ESVI high-high agglomeration area. In 2020, the coverage of the high-high agglomeration area in Tsavalong Township was further expanded.

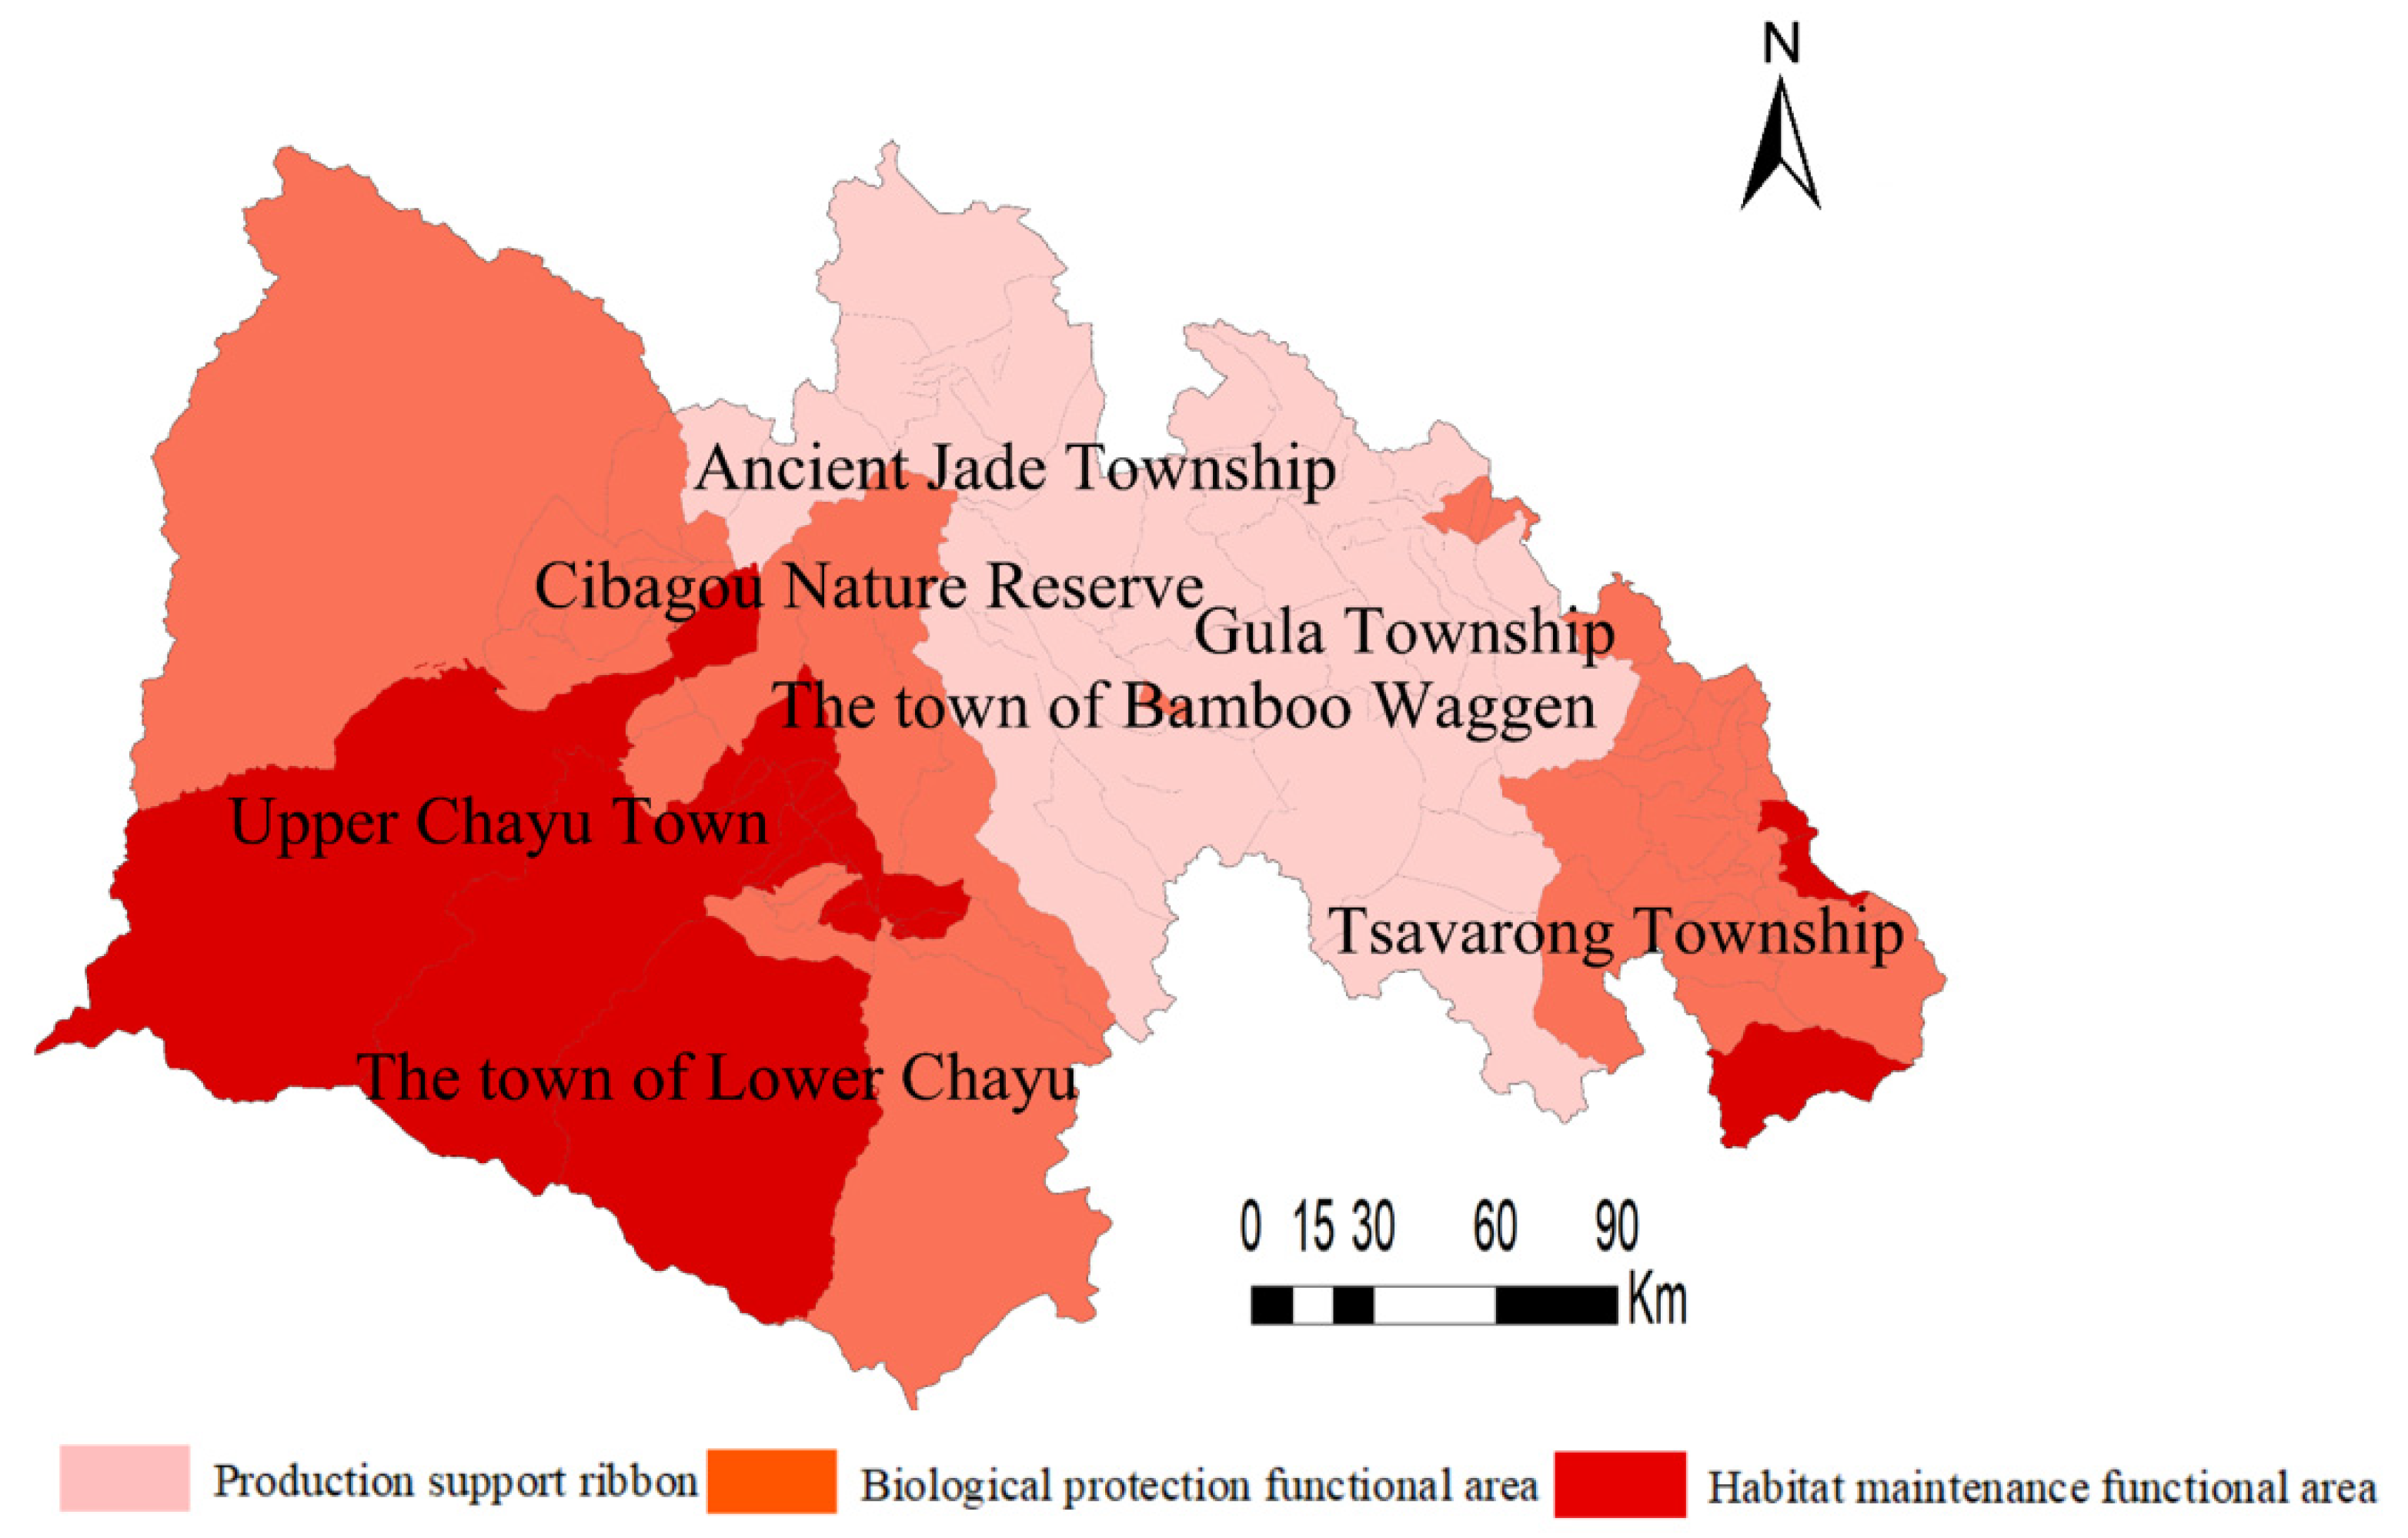
4.4. Optimization of the Pattern of Ecological Functions of Land Use

Land use ecological function zoning is used to divide the land in an area into different ecological function zones according to the unity of environmental elements such as regional landforms, the similarity between land resources and land use, the current situation of land ecological environment and the future development trend and the relative consistency of governance measures [31]. Based on the administrative village scale and employing the ESVI and K-value clustering method through SPSS software, this paper divides the study area into three different types of land use ecological function types: habitat maintenance function, biological conservation function and production support function. The result of land use ecological function zoning is shown in Figure 8.

4.4.1. Habitat Maintenance Functional Area

This type of area is generally located in the junction of the two towns of Upper and Lower Chayu, the southwestern area of Tsavalong Township and the eastern edge of Gula Township, involving 30 administrative villages. The land use type is mainly woodland and grassland, with strong gas exchange, and regulation, soil formation and protection ability. Therefore, ESVI in this type is at a high level in the county, which plays an important role in improving the climate in the region, purifying the air and improving the quality of the ecological environment. Based on this, this area is identified as habitat maintenance functional area. The reasons are as follows. First, as an area with abundant types of ecological land such as grassland, forest land and waters, measures such as vegetation restoration and habitat restoration should be adopted in accordance with the territorial spatial planning, the comprehensive land improvement and ecological restoration special planning, etc. to strengthen the protection of existing forest land and steadily improve the quality of primitive forest resources. Second, aiming to resolve the problems of weak ecosystem function, disconnected ecological corridors, and fragile ecological barriers, combined with the characteristics of the county ecosystem, the overall planning is referred to forest and grassland resource protection, water and soil conservation, water source conservation and other ecological protection work. The third is to coordinate various ecological elements such as “landscapes, forests, fields, lakes, grass and sand”, build a solid ecological security barrier, and form a natural ecological space network protection pattern, making it a veritable “ecological barrier” in the alpine valley area of southeast Tibet.

4.4.2. Biological Protection Functional Area

This type of regional space is distributed in the north-central part of the county in a sheet pattern, involving the largest number of administrative units and the widest coverage, involving 41 administrative villages. The land use types in this area are mainly woodland and grassland. Due to this, raw materials, recreation and leisure capacity in this area is weak, but the biodiversity capacity is strong. Therefore, ESVI in this area is at a relatively high level in the county, especially affected by the radiation of the Cibagou National Nature Reserve, which plays an important role in improving the level of biodiversity in the region and even the entire county, so it is classified as a biological protection functional area. The reasons are as follows. First, biodiversity plays an important role in maintaining and improving regional climatic conditions, which needs to be emphasised. Mainly relying on natural restoration and using artificial treatment as a supplement, focusing on the problems of regional plant damage, biodiversity loss and habitat system destruction, and following the principle of “overall protection, system restoration and comprehensive management” strictly, remediation goals, key areas and major projects will be put forward to protect the biodiversity. Second, to protect and restore biodiversity, more land use space will be released by changing land use patterns and improving land use efficiency, forming a reasonable and compact spatial layout with differentiated development.

4.4.3. Production Support Functional Area

This type of area is mainly scattered in the central river valley adjacent to the two towns of Upper and Lower Chayu and the northeast of Tsavalong Township, besides, there are a small number of areas in the eastern part of Gula Township, involving a total of 26 administrative villages. The land use type is mainly forest land, part of the cultivated land and part of the construction land. With good water conservation capacity and strong food production capacity, it is the main cultivation and production area of the plateau animal husbandry and the plateau forest fruit industry. ESVI within this region is at a relatively low level throughout the county, and therefore, it is classified as production support functional areas. To protect this area, the measures are as follows. First, relying on the unique natural environment and special geographical advantages, emphasis should be laid on cultivating characteristic agriculture and high-efficiency agriculture. Meanwhile, it is necessary to strengthen the prevention and control of non-point source pollution in agriculture and animal husbandry, including the reduction in and control of chemical fertilizers and pesticides, and the prevention and control of livestock and poultry breeding pollution. Second, through multiple methods such as engineering measures, biological measures and agricultural measures, soil pollution control should be strengthened, and measures such as planting green manure and increasing organic fertilizer should be adopted to improve the soil environmental capacity and risk resistance. Third, the strictest system of cultivated land protection system should be implemented to ensure that the quality and function are not reduced, the protection of permanent basic farmland should be strengthened and the illegal occupation of cultivated land should be strictly prohibited, which are in accordance with the basic criterion of “adapting to local conditions, benefiting farmers, and ecological improvement” and focusing on the goal of “harmonious coexistence between man and nature and sustainable development of human society” to strictly adhere to the bottom line of grain production control.

5. Discussion and Conclusions

5.1. Discussion

Chayu County, as a typical high mountain and canyon area in Southeast Tibet, has complex landform and geological structure, but with relatively single natural resource elements, resulting in an extremely fragile ecological environment, especially in the dual interference of natural environment and human factors, and the value of ecosystem services is particularly noteworthy [32]. This study selects typical representative areas, further explores the theory and application of ecosystem service value estimation, and theoretically deepens the scientific connotation and essential requirements, which has important strategic significance for the construction of ecological barrier and ecological civilization in the whole southeast of Tibet from the application of practical achievements.
The typical characteristic of land use in the study area is that the proportion of forest land is the largest, followed by grassland and unused land while other land types of account for a relatively small proportion. In the past 20 years, the fundamental structure of land use has changed relatively little, which is consistent with other research results, further showing that it is difficult for human activities to affect the transformation of land use in this area. It is worth mentioning that the change of cultivated land and construction land which can best represent human development and utilization can basically reflect the degree of development and utilization of land resources and the impact of human activities. It is concluded that the distribution of cultivated land resources in the study area is gradually transferred from the marginal areas to the internal river valley, while the construction land is more concentrated in the central areas of towns and townships, which is also consistent with similar research results [33,34], and synchronized with the population distribution in this region in recent years. It shows that in the areas dominated by natural environment, some local areas are still greatly affected by human effects. At the same time, from the analysis of the land use transfer matrix, the significant feature is that, in the past 20 years, the unused land area has increased by 45.44% and the grassland area has also decreased by nearly 30%, which is mainly affected by natural conditions and the continuously reduced impact of human activities on land use. This is quite different from many other research results, mainly due to the obvious particularity of the study area, which is also the reason for which this case study is chosen.
ESV in this region has decreased by 16.98% in the past 20 years, mainly due to the reduction in ecological service value of forest land and grassland, which leads to a large decline in the region, indicating that the contribution of forest and grassland to regional ESV and the regulation of ecological environment are obvious. More attention should be paid to the protection of biological resources such as forest land and grassland, and human activities should be concentrated as much as possible, and the impact of human intervention should be reduced. The ESVI in the study area presents a distribution pattern of “high in the west and low in the east”, specifically, the ESVI in the middle east is relatively low while the ESVI in the eastern and western edge areas is relatively high, mainly in the two levels of relatively high and low, and the area proportion of the relatively low level shows an increasing trend, the key distribution areas of which are analyzed by grid unit and expressed at the village level spatial scale. It will enhance the practical value of this research result and make a breakthrough based on other research results [35,36]. Through using ESDA spatial model to analyze the spatial agglomeration characteristics of regional ESVI, it is concluded that the global Moran ‘I value is always greater than 0.71, and the p value of most regions is greater than 0.001, indicating that the regional ESVI as a whole always shows significant positive spatial autocorrelation, and the degree of local spatial autocorrelation first increases and then remains unchanged. This further confirms the scientific value and rationality of using the model algorithm [37]. From the perspective of land use, spatial differentiation management and control, based on the administrative village scale, the whole region is divided into three types of land use ecological function areas. From the goal of how to maintain and improve the ecological service value of the regional land use system, this paper puts forward differentiation management and control measures from a multi-dimensional perspective, so as to improve the service capacity of the entire regional ecosystem, and also provide an optimized path to assisting the land space governance [38].
The alpine valley area of southeast Tibet, whose land use type mainly consists of woodland, grassland and unused land, is regarded as the “top priority” of the ecological civilization construction in the Tibet Autonomous Region. Its ecosystem balance directly affects the water source in the lower reaches of the center, the world’s rare animals and plants and the changes in the global climate. During the period from 2000 to 2020, on the one hand, affected by the “returning farmland to forests and grasslands” project and the intensifying phenomenon of non-granitization and non-farming of cultivated land, the area of cultivated land in the alpine valley area of southeast Tibet was greatly reduced. On the other hand, due to population growth and climatic conditions, the area of unused land increased significantly while the area of forest land and grassland decreased. The disturbance of human activities continues to intensify, resulting in gradual changes in the structure of land use types and a continuous decline in the value of ecosystem services. In the past 20 years, the enhancement of land resource development in the alpine valley areas of southeast Tibet has had a negative impact on the value of ecosystem services in the future, while implementing farmland protection and ecological land protection, special attention should be paid to improving land use efficiency, optimizing land use structure, and gradually restoring and improving regional ecosystem service functions [39].
Ecosystem service value is not only affected by the adjustment of land use structure, but also by many social and economic factors, such as climatic conditions, population density, economic level and industrial layout and so on [40]. The calculation of ecosystem service value in this study is based on the equivalent factor method of unit area value. In order to reduce the disconnection between the equivalent table and the current situation of the study area, coefficient correction is made in combination with the actual situation of the region. Despite considering the natural conditions and socio-economic factors affecting ESV, Chayu County, as a typical area of high mountains and valleys in Southeast Tibet, is affected by many factors involving topography, natural disasters and special policies in border areas, greatly different from other general areas. Therefore, it is necessary to further explore a more accurate ESV estimation model algorithm for special areas, focusing on the refinement and specialization of ecosystem classification [41]. With the update and release of high-precision remote sensing data and the continuous enrichment of data collection of positioning observation points, the follow-up will focus on the accounting of ecosystem service value in typical regions, and further explore the basic theory and system method of ecosystem service value accounting under different terrain types and socio-economic models. If the relevant theories and methodologies are further developed, this study will continue to explore in depth, constantly enrich and improve a series of research results, in order to provide an important scientific basis and research foundation for the subsequent study of land use evolution and ecosystem service value. In addition, when carrying out relevant research in the future, special attention should be focused on the spatiotemporal changes of regional ecosystem service value driven by natural factors, socio-economic factors and policy environment, as well as the prediction and simulation research, so as to improve the feasibility and practicality of the current research results.

5.2. Conclusions

The core research task of this study is to explore the characteristics of land use change and the temporal and spatial evolution law of ecosystem service value, to build the zoning pattern of land use ecological functions and put forward differentiated management and control measures. This study, taking Chayu County, a typical alpine valley region in Southeast Tibet, as a typical research object and based on the three periods of remote sensing interpretation data in 2000, 2010 and 2020, employs the three-level spatial scale from the village level, the township level to the county level to converge step by step, to further explore the characteristics of land use evolution, ESV change and space-time response.
From the perspective of the characteristics of land use type change, the area of unused land has increased by 45.44%, with a continuous increase of 3377.26 km2 in the past 20 years while the grassland area has continued to decrease by 1935.62 km2 in 20 years, a decrease of 29.29 percentage points. The forest land and grassland have the largest area of transfer-in and transfer-out, 2191.24 km2 and 2978.08 km2, respectively, in which the main source of transfer-in is cultivated land and unused land while the main source of transfer-out is unused land and waters. Unused land, as a type of land that has not yet been utilized or is difficult to utilize, has the largest difference between the transfer-in area and the transfer-out area, and its main transfer-in and transfer-out source are cultivated land, forest land and grassland. The transfer-in area and the transfer-out area of cultivated land are 21,934 km2 and 22,917 km2, respectively, and the main transfer-in and transfer-out sources are woodland and grassland, including a certain proportion of waters. The scale increase in the secondary land types of unused land has mainly been caused by glaciers and permanent snow, and the change of land types has first decreased and then increased in the past 20 years, with the increase from 507,861.61 km2 to 975,967.01 km2 in 2020.
From 2000 to 2020, the land use index of the study area generally presents a spatial pattern of “high in the southwest and low in the northeast”. The towns with high index are mainly upper Chayu town and lower Chayu Town, and the towns with low index are mainly Guyu Township and Gula township. During the study period, the land use index of each township showed a decreasing trend to varying degrees. The township with the largest decrease was Zhuwagen Town (23.00), with a decrease of 13.50%. Overall, ESVs showed a decreasing trend between 2000 and 2020, from 964.596 billion yuan in 2000 to 866.642 billion yuan in 2020, a decrease of 16.98%. During the study period, the value of ecosystem services in woodland decreased the most, accounting for 70.55% of the total reduction, followed by grassland, with the smallest reduction in cultivated land. The value of ecosystem services in unused land increased the most while the wetlands the least, of which the increase in unused land accounted for 98.05% of the total increase. From the perspective of the whole region, ESVI in the study area, with obvious spatial differentiation characteristics of kernel density, significant clustering and distribution characteristics and stable variation range, displays an overall spatial pattern with characteristics of “dense in the west and sparse in the east, high in the north and low in the south”. Over the past 20 years, the global Moran’I value in the study area has always been greater than 0.71 and the p value in most areas has been greater than 0.001, indicating that the ESVI in the townships and towns in the county has always shown significantly positive spatial autocorrelation, some regions displaying obvious spatial aggregation, but the distribution in most regions is relatively random.
From the perspective of the whole region, the spatial differentiation characteristics of kernel density in ESVI in the study area are obvious, the agglomeration distribution characteristics are significant with stable variation, displaying an overall spatial pattern with characteristics of “dense in the west and sparse in the east, high in the north and low in the south”. From the perspective of the agglomeration characteristics of ESVI, the southwest of the study area is dominated by most high ESVI agglomeration characteristics while the central part is dominated by a few high ESVI agglomeration characteristics. The agglomeration characteristics of some areas in the southeastern region are highly concentrated but lacking in contiguity, while the central region maintains the characteristics of low density. In the past 20 years, the ESVI of the townships in the study area has generally shown a differentiation pattern of “high in the west and low in the east” with little change. The high-value areas of ESVI mainly appear in parts of Upper Chayu Town, Lower Chayu Town and Tsavalong Township, which account for a relatively large area of woodland and grassland, and the ESVI low-value areas are mainly distributed in Guyu Township and Gula Township with higher terrain, unused land, woodland and grassland. Specifically, there is a significant positive correlation between ESVI in each township, with high spatial agglomeration, primarily with the high-high aggregation mode and insignificant mode. The high ESVI agglomeration is mainly distributed in a small part of the southwest and southeast of the study area in a sheet pattern, while the insignificant ESVI agglomeration is distributed in the central and eastern marginal areas in a sheet pattern.

Author Contributions

Conceptualization, P.L. and S.F.; Data curation, Q.H., J.C. and M.Z.; Formal analysis, S.F. and P.L.; Investigation, P.L., N.W. and S.Y.; Methodology, S.F. and P.L.; Project administration, M.Z., N.W. and S.Y.; Resources, S.Y. and S.P.; Software, P.L., Q.H. and J.C.; Validation, S.P.; Writing—original draft, P.L.; Writing—review & editing, S.F. All authors have read and agreed to the published version of the manuscript.

Funding

This research is supported by the natural science foundation of Anhui Province, grant number 1908085QG310. Key project of Humanities and Social Sciences Research of Anhui University, grant number SK2021a0155. General project of National Natural Science Foundation of China, grant number 71873003, prosperity and development philosophy and social science fund project of Anhui Agricultural University, grant number 2018zs12zd. Anhui Agricultural University introduces stable talents project, grant number yj2018-60. Anhui College Students’ innovation and entrepreneurship training project, grant number S202010364063. National innovation and entrepreneurship training program for college students, grant number 202110364031. Chayu county land and space master plan, grant number 2021–2035 support.

Institutional Review Board Statement

Not applicable.

Informed Consent Statement

Informed consent was obtained from all subjects involved in the study.

Data Availability Statement

All data generated or analyzed during this study are included in this published article.

Conflicts of Interest

The authors declare no conflict of interest.

References

  1. Skole, D.L.B., II; Sanderson, S.; Fischer, G.; Leemans, R. Land use and land cover change. Earth Sci. Front. 1997, 4, 26–33. [Google Scholar]
  2. Costanza, R.; D’Arge, R.; Groot, R.D.; Farber, S.; Grasso, M.; Hannon, B.; Limburg, K.; Naeem, S.; O’Neill, R.V.; Paruelo, J.; et al. The value of the world’s ecosystem services and natural capital. Nature 1997, 387, 253–260. [Google Scholar] [CrossRef]
  3. Daily, G.C.; Soederqvist, T.; Aniyar, S.; Arrow, K.; Dasgupta, P.; Ehrlich, P.R.; Folke, C.; Jansson, A.; Jansson, B.O.; Kautsky, N.; et al. The value of nature and the nature of value. Science 2000, 289, 395–396. [Google Scholar] [CrossRef] [PubMed]
  4. Etienne, C.; Jessica, P.; Yoann, L.G.; Mathieu, F. Spatial patterns of vineyard abandonment and related land use transitions in Beaujolais (France): A multiscale approach. Sustainability 2020, 12, 4695. [Google Scholar]
  5. Schneider, A.; Kucharik, L.C.J.; Christopher, J.K. Impacts of urbanization on ecosystem goods and services in the U.S. Corn Belt. Ecosystems 2012, 15, 519–541. [Google Scholar] [CrossRef]
  6. Huang, M.Y.; Yue, W.Z.; Fang, B.; Feng, S.R. Scale response characteristics and geographic exploration mechanism of spatial differentiation of ecosystem service values in Dabie mountain area. central China from 1970 to 2015. Acta Geogr. Sin. 2019, 74, 1904–1920. [Google Scholar]
  7. Daily, G.C. Natures Service: Social Dependence on Nature Ecosystems; Island Press: Washington, DC, USA, 1997. [Google Scholar]
  8. Robert, C.; Ralph, D.; Rudolf, G. The value of the world’s ecosystem services and natural capital. Nat. Int. Wkly. J. Sci. 1997, 387, 253–260. [Google Scholar]
  9. Liu, F.L.; Yang, R.Y. Evolution of land use patterns in national central cities and its impact on ecosystem service values: A case study of Wuhan city. Res. Soil Water Conserv. 2021, 28, 177–183+193+2. [Google Scholar]
  10. Xie, G.D.; Zhang, C.X.; Zhang, L.M.; Chen, W.H.; Li, S.M. Improvement of the evaluation method for ecosystem service value based on per unit area. J. Nat. Resour. 2015, 30, 1243–1254. [Google Scholar]
  11. Xie, G.D.; Zhen, L.; Lu, C.X.; Xiao, Y.; Chen, C. Expert knowledge-based valuation method of ecosystem services in China. J. Nat. Resour. 2008, 23, 911–919. [Google Scholar]
  12. Xie, G.D.; Zhang, C.X.; Zhang, C.S.; Xiao, Y.; Lu, C.X. The value of ecosystem services in China. Resour. Sci. 2015, 37, 1740–1746. [Google Scholar]
  13. Sun, H.L.; Chen, Y.N.; Li, W.H.; Li, F.; Mubarek, A. Study on types and ecological services values of the grassland in the ili river Basin. Xinjiang. China. J. Desert Res. 2011, 31, 1273–1277. [Google Scholar]
  14. Luo, N.N.; Mao, D.H.; Wen, B.L.; Liu, X.T. Climate change affected vegetation dynamics in the Northern Xinjiang of China: Evaluation by SPEI and NDVI. Land 2020, 9, 90. [Google Scholar] [CrossRef]
  15. Xia, J.Y.; Cao, M.; Xiao, W.; Li, Y.P.; Fu, G.; Wang, W.; Li, J.S. Integrating spatial valuation of ecosystem services into protected area management: A case study of the Cangshan Nature Reserve Dali, China. Sustainability 2020, 12, 9395. [Google Scholar] [CrossRef]
  16. Liu, M.Z.; Jia, Y.G.; Zhao, J.J.; Shen, Y.J.; Pei, H.W.; Zhang, H.J.; Li, Y.L. Revegetation projects significantly improved ecosystem service values in the agropastoral ecotone of northern China in recent 20 years. Sci. Total Environ. 2021, 788, 147756. [Google Scholar] [CrossRef]
  17. Tong, S.Q.; Bao, G.; Rong, A.H.; Huang, X.J.; Bao, Y.B.; Bao, Y.H. Comparison of the spatiotemporal dynamics of land use changes in four municipalities of China based on intensity analysis. Sustainability 2020, 12, 3687. [Google Scholar] [CrossRef]
  18. Chen, J.Y.; Luo, H.X.; Hu, L.L.; Li, Q.H.; Jiang, W.J. Correlation between social economic development and ecosystem service value: A case of Chongqing metropolitan area. Res. Soil Water Conserv. 2017, 24, 330–336. [Google Scholar]
  19. Yu, L.L.; Zhang, X.X.; Li, Y.F.; Zhao, X.X.; Ma, S.Q.; Cao, H.H.; Cao, J.K. Coastal ecosystem services and their spatial-temporal variation in Haikou. China. Acta Ecol. Sin. 2016, 36, 2431–2441. [Google Scholar]
  20. Fu, J.; Liu, Y.; Lü, Y. Assessing the soil erosion control service of ecosystems change in the Loess Plateau of China. Ecol. Complex. 2011, 8, 284–293. [Google Scholar] [CrossRef]
  21. Geng, Q.L.; Ren, Q.F.; Yan, H.M. Target areas for harmonizing the Grain for Green Programmed in China’s Loess Plateau. Land Degrad. Dev. 2019, 31, 325–333. [Google Scholar] [CrossRef]
  22. Costanza, R.; De Groot, R.; Sutton, P.; van der Ploeg, S.; Anderson Sharolyn, J.; Kubiszewski, I.; Farber, S.; Turner, R. Changes in the global value of ecosystem services. Glob. Environ. Chang. 2014, 26, 152–158. [Google Scholar] [CrossRef]
  23. Wang, Z.Y.; Cao, J.S. Assessing and predicting the impact of multi-scenario land use changes on the ecosystem service value: A case study in the upstream of Xiong’ an New Area, China. Sustainability 2021, 13, 704. [Google Scholar] [CrossRef]
  24. BAI, E.; Bing, X. A review of influences of land use and land cover change on ecosystems. Chin. J. Plant Ecol. 2020, 44, 543–552. [Google Scholar] [CrossRef]
  25. Li, H.; Zhang, X.Y.; Guo, H.L. Spatial and temporal changes of ecosystem service value in the three gorges reservoir area in the past 30 yeas based on land use. Res. Soil Water Conserv. 2021, 28, 309–318. [Google Scholar]
  26. Liu, J.Y.; Zhuang, D.F.; Zhang, Z.X.; Gao, Z.Q.; Deng, X.Z. The establishment of land use spatial temporal database and its relative studies in China. J. Geo-Inf. Sci. 2002, 4, 3–7+4. [Google Scholar]
  27. Daniela, S.; Michelangelo, C.; Annalisa, A.; Donato, M.; Sašo, D. Dealing with spatial autocorrelation when learning predictive clustering trees. Ecol. Inform. 2013, 13, 22–39. [Google Scholar]
  28. Myong, G.C.; Junko, N. Geographic spatial autocorrelation of morphological characters of the Hemerocallis middendorffii complex (Liliaceae). Ann. Bot. Fenn. 1998, 35, 183–189. [Google Scholar]
  29. Ma, Y.J.; Huang, X.J.; Xu, M.M.; Zhong, T.Y.; Du, W.X. Sensitivity analysis of ecosystem service value to coastal tideland development in Jiangsu Province. China Land Sci. 2006, 4, 28–34. [Google Scholar]
  30. Hu, Y.; Qiao, W.F.; He, T.Q. Changes of the land use pattern and ecosystem service value in Yangtze—hwai ecological economic zone. Resour. Environ. Yangtze Basin 2020, 29, 2450–2461. [Google Scholar]
  31. Sun, B.C.; Ding, Z.L.; Wang, D.Q.; Wang, H.Y. Ecological functional zone of land use of Shuangyashan based on ARCGIS method. J. Northeast. Agric. Univ. 2011, 42, 109–113. [Google Scholar]
  32. Sun, H.L.; Zheng, D.; Yao, T.D. Protection and construction of the national ecological security shelter zone on Tibetan Plateau. Acta Geogr. Sin. 2012, 67, 3–12. [Google Scholar]
  33. Alipbeki, O.; Alipbekova, C.; Sterenharz, A.; Toleubekova, Z.; Aliyev, M.; Mineyev, N.; Amangaliyev, K. A spatiotemporal assessment of land use and land cover changes in Peri-Urban areas: A case study of arshaly district, Kazakhstan. Sustainability 2020, 12, 1556. [Google Scholar] [CrossRef]
  34. Xia, S.F.; Chen, M.Q.; Liu, X.; Cai, H.S. Land resources ecosystem service value accounting of Ganzhou city based on geographic national condition information. Trans. Chin. Soc. Agric. Mach. 2019, 50, 184–193. [Google Scholar]
  35. Gao, H.J.; Han, H.Q.; Luo, X.Q.; Yu, H.Y.; Han, M.R. Spatial correlation of socioeconomic factors and ecosystem service values n Guizhou province. Res. Soil Water Conserv. 2016, 23, 262–266. [Google Scholar]
  36. Li, J.C.; Wang, W.L.; Hu, G.Y.; Wei, Z.H. Impacts of land use and cover changes on ecosystem service value in Zoige Plateau. Acta Ecologica Sinica 2011, 31, 3451–3459. [Google Scholar]
  37. Li, S.; He, F.; Zhang, X.; Zhou, T. Evaluation of global historical land use scenarios based on regional datasets on the Qinghai–Tibet Area. Sci. Total Environ. 2019, 657, 1615–1628. [Google Scholar] [CrossRef]
  38. Wang, L.Y.; Ke, X.L.; Hatab, A.A. Trade-Offs between Economic Benefits and Ecosystem Services Value under Three Cropland Protection Scenarios for Wuhan City in China. Land 2020, 9, 117. [Google Scholar] [CrossRef]
  39. Li, T.H.; Li, W.K.; Qian, Z.H. Variations in ecosystem service value in response to land use changes in Shenzhen. Ecol. Econ. 2008, 69, 1427–1435. [Google Scholar]
  40. Wei, X.D.; Wang, N.; Luo, P.P.; Yang, J.; Zhang, J.; Lin, K.L. Spatiotemporal assessment of land marketization and its driving forces for sustainable urban–rural development in Shaanxi Province in China. Sustainability 2021, 13, 7755. [Google Scholar] [CrossRef]
  41. Zulpiya, M.M.T.; Hamit, Y.M.T.; Anwar, E.Z.I.Z.; Ajigul, A.B.L.M.T. Response of ecosystem services value to land use/cover change in the Yanqi Basin of Xinjiang, China. J. Desert Res. 2014, 34, 275–283. [Google Scholar]
Figure 1. Study area location. (Note: the base map is made based on the standard map (Tibetan s (2020) No. 002) approved by the National Bureau of Surveying and mapping geographic information, and the base map is not modified).
Sustainability 14 10057 g001
Figure 2. Land use status of the study area from 2000 to 2020.
Sustainability 14 10057 g002
Figure 3. Spatial distribution of land use index in study areas, 2000–2020.
Sustainability 14 10057 g003
Figure 4. Spatial pattern of ESVI in the study area from 2000 to 2020.
Sustainability 14 10057 g004
Figure 5. Distribution of kernel density of ecosystem service value per unit area in the study area from 2000 to 2020.
Sustainability 14 10057 g005
Figure 6. Moran scatter chart of ecosystem service value per unit area in the study area from 2000 to 2020.
Sustainability 14 10057 g006
Figure 7. LISA distribution map of ecosystem service value per unit area in the study area from 2000 to 2020.
Sustainability 14 10057 g007
Figure 8. Pattern of land use ecological function zoning in the study area.
Sustainability 14 10057 g008
Table 1. Ecosystem services value coefficients of land use types in the study area. (Unit: RMB /km2).
Ecosystem Services and FunctionsCultivated LandWoodlandGrasslandWetlandWatersUnused Land
gas exchange111.45780.18178.33401.230.000.00
Climate regulation198.39601.85200.623811.72102.540.00
water conservation133.74713.30178.333455.074542.856.69
Soil formation and protection325.44869.34434.67381.172.234.46
waste disposal365.57292.01292.014052.464052.464.46
Biodiversity conservation158.26726.68242.97557.27555.0475.79
Food production222.9122.2966.8766.8722.292.23
raw material22.29579.5611.1515.602.230.00
Entertainment and leisure2.23285.328.921237.14967.422.23
Table 2. Changes in the proportion of different land use types in the study area from 2000 to 2020 (Unit: %).
Land Use Type200020102020
Cultivated land0.270.140.19
woodland54.5653.5550.04
grassland21.0421.7614.88
Wetland0.020.010.02
waters0.440.370.42
land used for building0.010.010.03
Unused land23.6624.1634.42
Table 3. Land use transfer matrix of the study area for 2000–2020. (Unit: km2).
2020GrasslandCultivated LandLand Used for BuildingWoodlandWetlandWatersUnused Land
2000
grassland3629.953.811.56660.350.295.642306.43
Cultivated land35.3531.153.4514.080.010.400.97
land used for building0.190.751.680.100.000.020.03
woodland824.5825.132.2114,944.670.5533.831304.94
Wetland0.770.030.020.612.270.721.79
waters7.090.120.0413.641.1481.9632.98
Unused land174.480.130.1283.562.419.187162.68
Table 4. Changes in ESV of various types of land use in the study area from 2000 to 2020.
Land Use TypeCultivated LandWoodlandGrasslandWetlandWatersUnused Land
2000Area (km2)85.4117,135.916608.036.21136.977432.56
ESV (RMB 100 million)13.168346.091066.448.68140.3571.24
2010Area (km2)45.2416,818.296833.313.54114.817589.31
ESV (RMB 100 million)6.978191.401102.794.95117.6572.74
2020Area (km2)61.1215,717.014672.416.67131.7510,809.82
ESV (RMB 100 million)9.417655.02754.069.32135.00103.61
2000–2010ESV change value−6.19−154.7036.36−3.73−22.711.50
ESV change rate−47.03%−1.85%3.41%−43.00%−16.18%2.11%
Area change value−40.17−317.62225.28−2.67−22.16156.75
Area change rate−47.03%−1.85%3.41%−43.00%−16.18%2.11%
2010–2020ESV change value2.45−536.38−348.744.3817.3630.87
ESV change rate35.10%−6.55%−31.62%88.42%14.75%42.43%
Area change value15.88−1101.28−2160.903.1316.943220.51
Area change rate35.10%−6.55%−31.62%88.42%14.75%42.43%
2000–2020ESV change value−3.74−691.08−312.380.64−5.3532.37
ESV change rate−28.44%−8.28%−29.29%7.41%−3.81%45.44%
Area change value−24.29−1418.90−1935.620.46−5.223377.26
Area change rate−28.44%−8.28%−29.29%7.41%−3.81%45.44%
Table 5. ESV dynamics of different land types in the study area from 2000 to 2020 (Unit: %).
(Township) Town NameCultivated LandWoodlandGrasslandWetlandWatersUnused Land
Entire−1.42−0.41−1.460.37−0.192.27
Upper Chayu Town−0.41−0.34−1.534.760.802.05
The town of Lower Chayu−1.86−0.15−0.85−2.32−1.072.35
The town of Bamboo Waggen0.00−0.79−2.471.21−3.393.88
Tsavarong Township0.00−0.38−0.121.431.161.41
Ancient Jade Township0.64−1.29−1.30−5.001.371.14
Gula Township0.00−0.77−0.640.00−2.561.10
Cibagou Nature Reserve0.00−0.83−3.030.00−4.023.97
Publisher’s Note: MDPI stays neutral with regard to jurisdictional claims in published maps and institutional affiliations.

