
Utilizing the Harvesting of Rainwater to Provide Safe Road Transportation Efficiency and Increase Water Resources in the Context of Climatic Change


Abstract
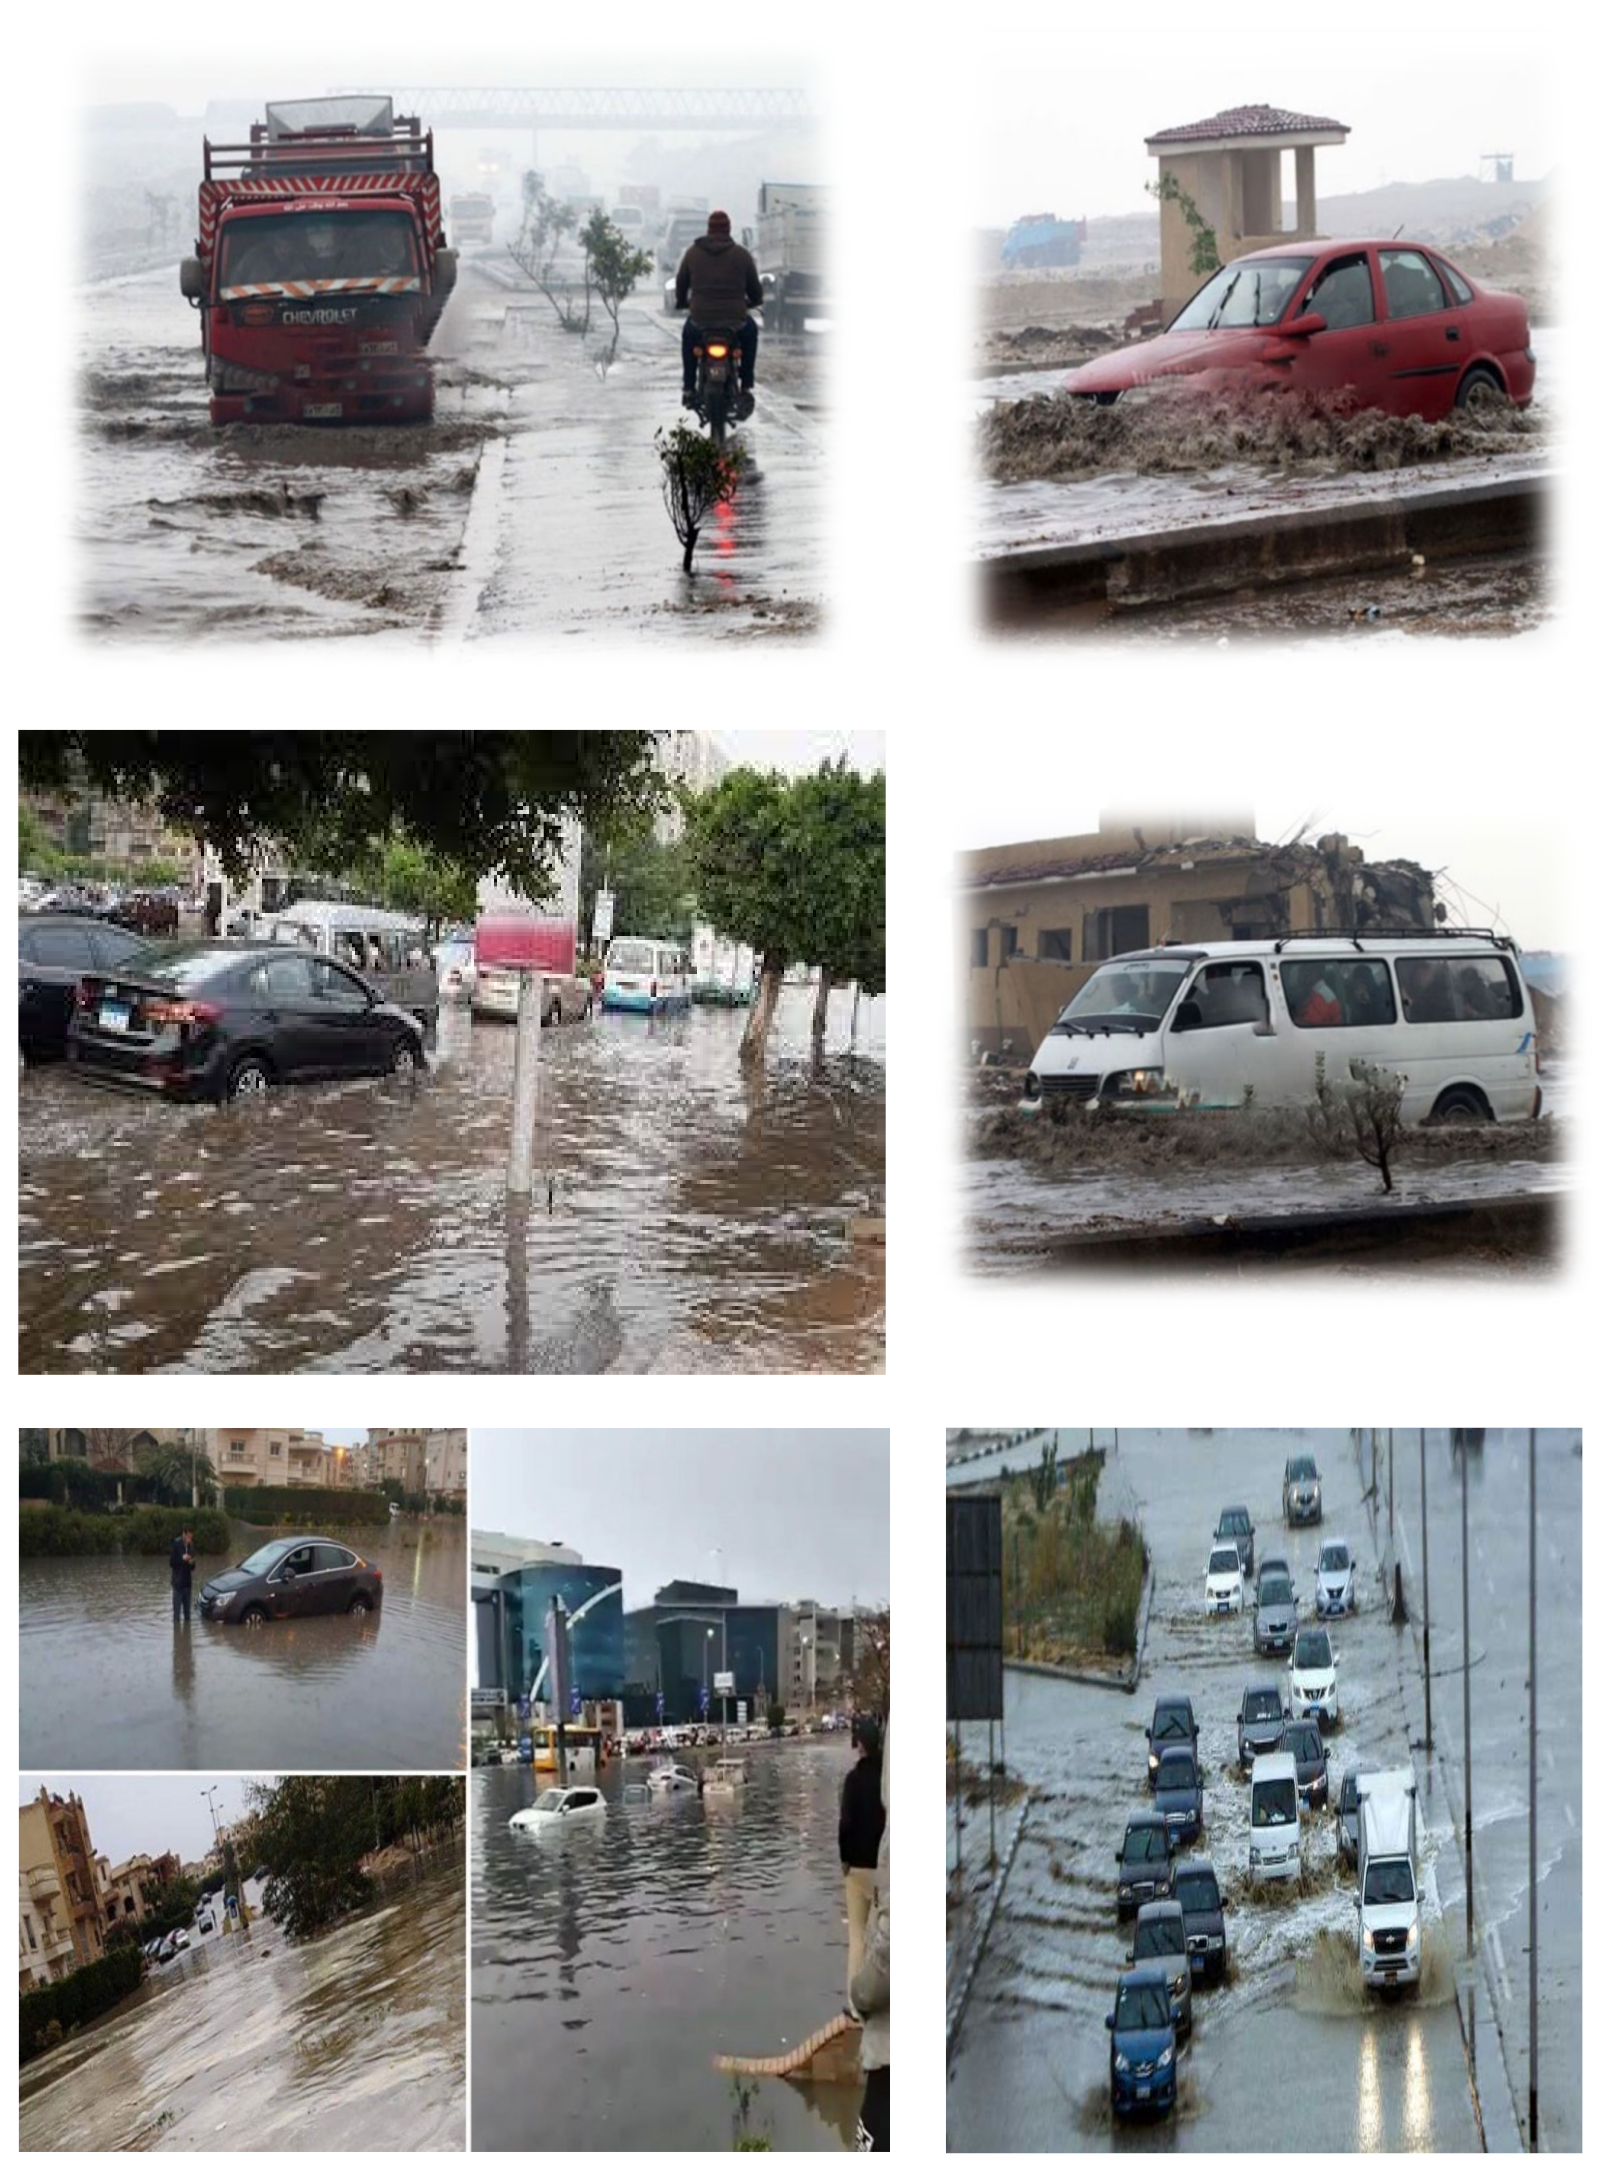
:1. Introduction
2. Materials and Methods
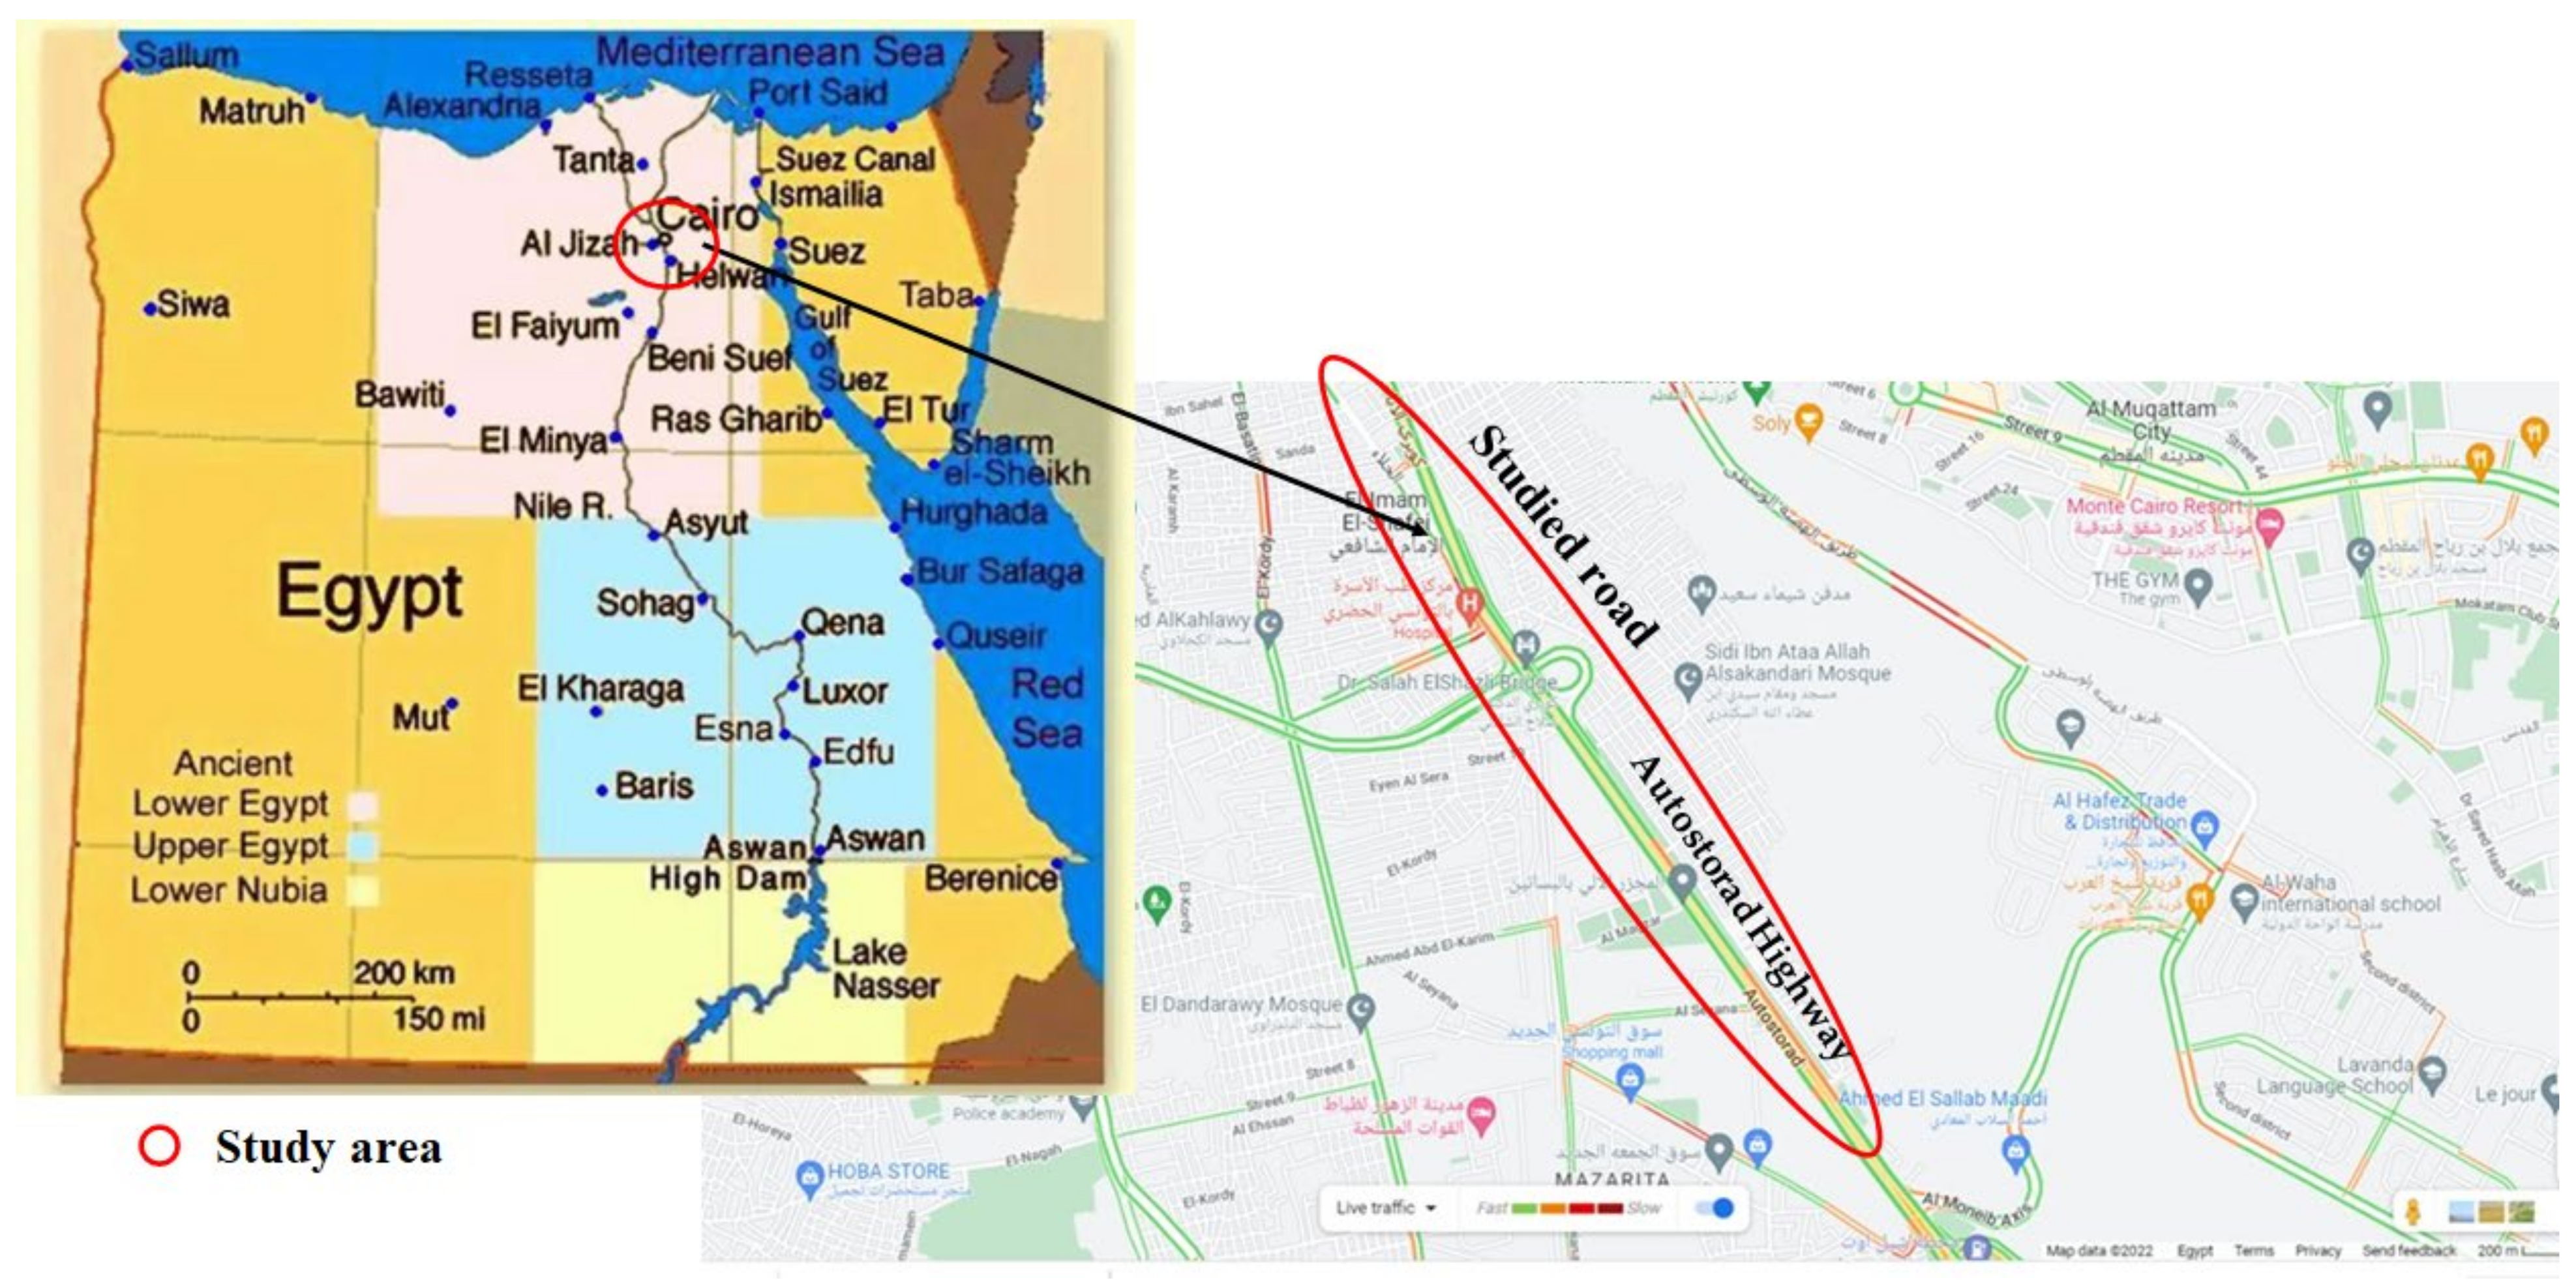
2.1. Study Area
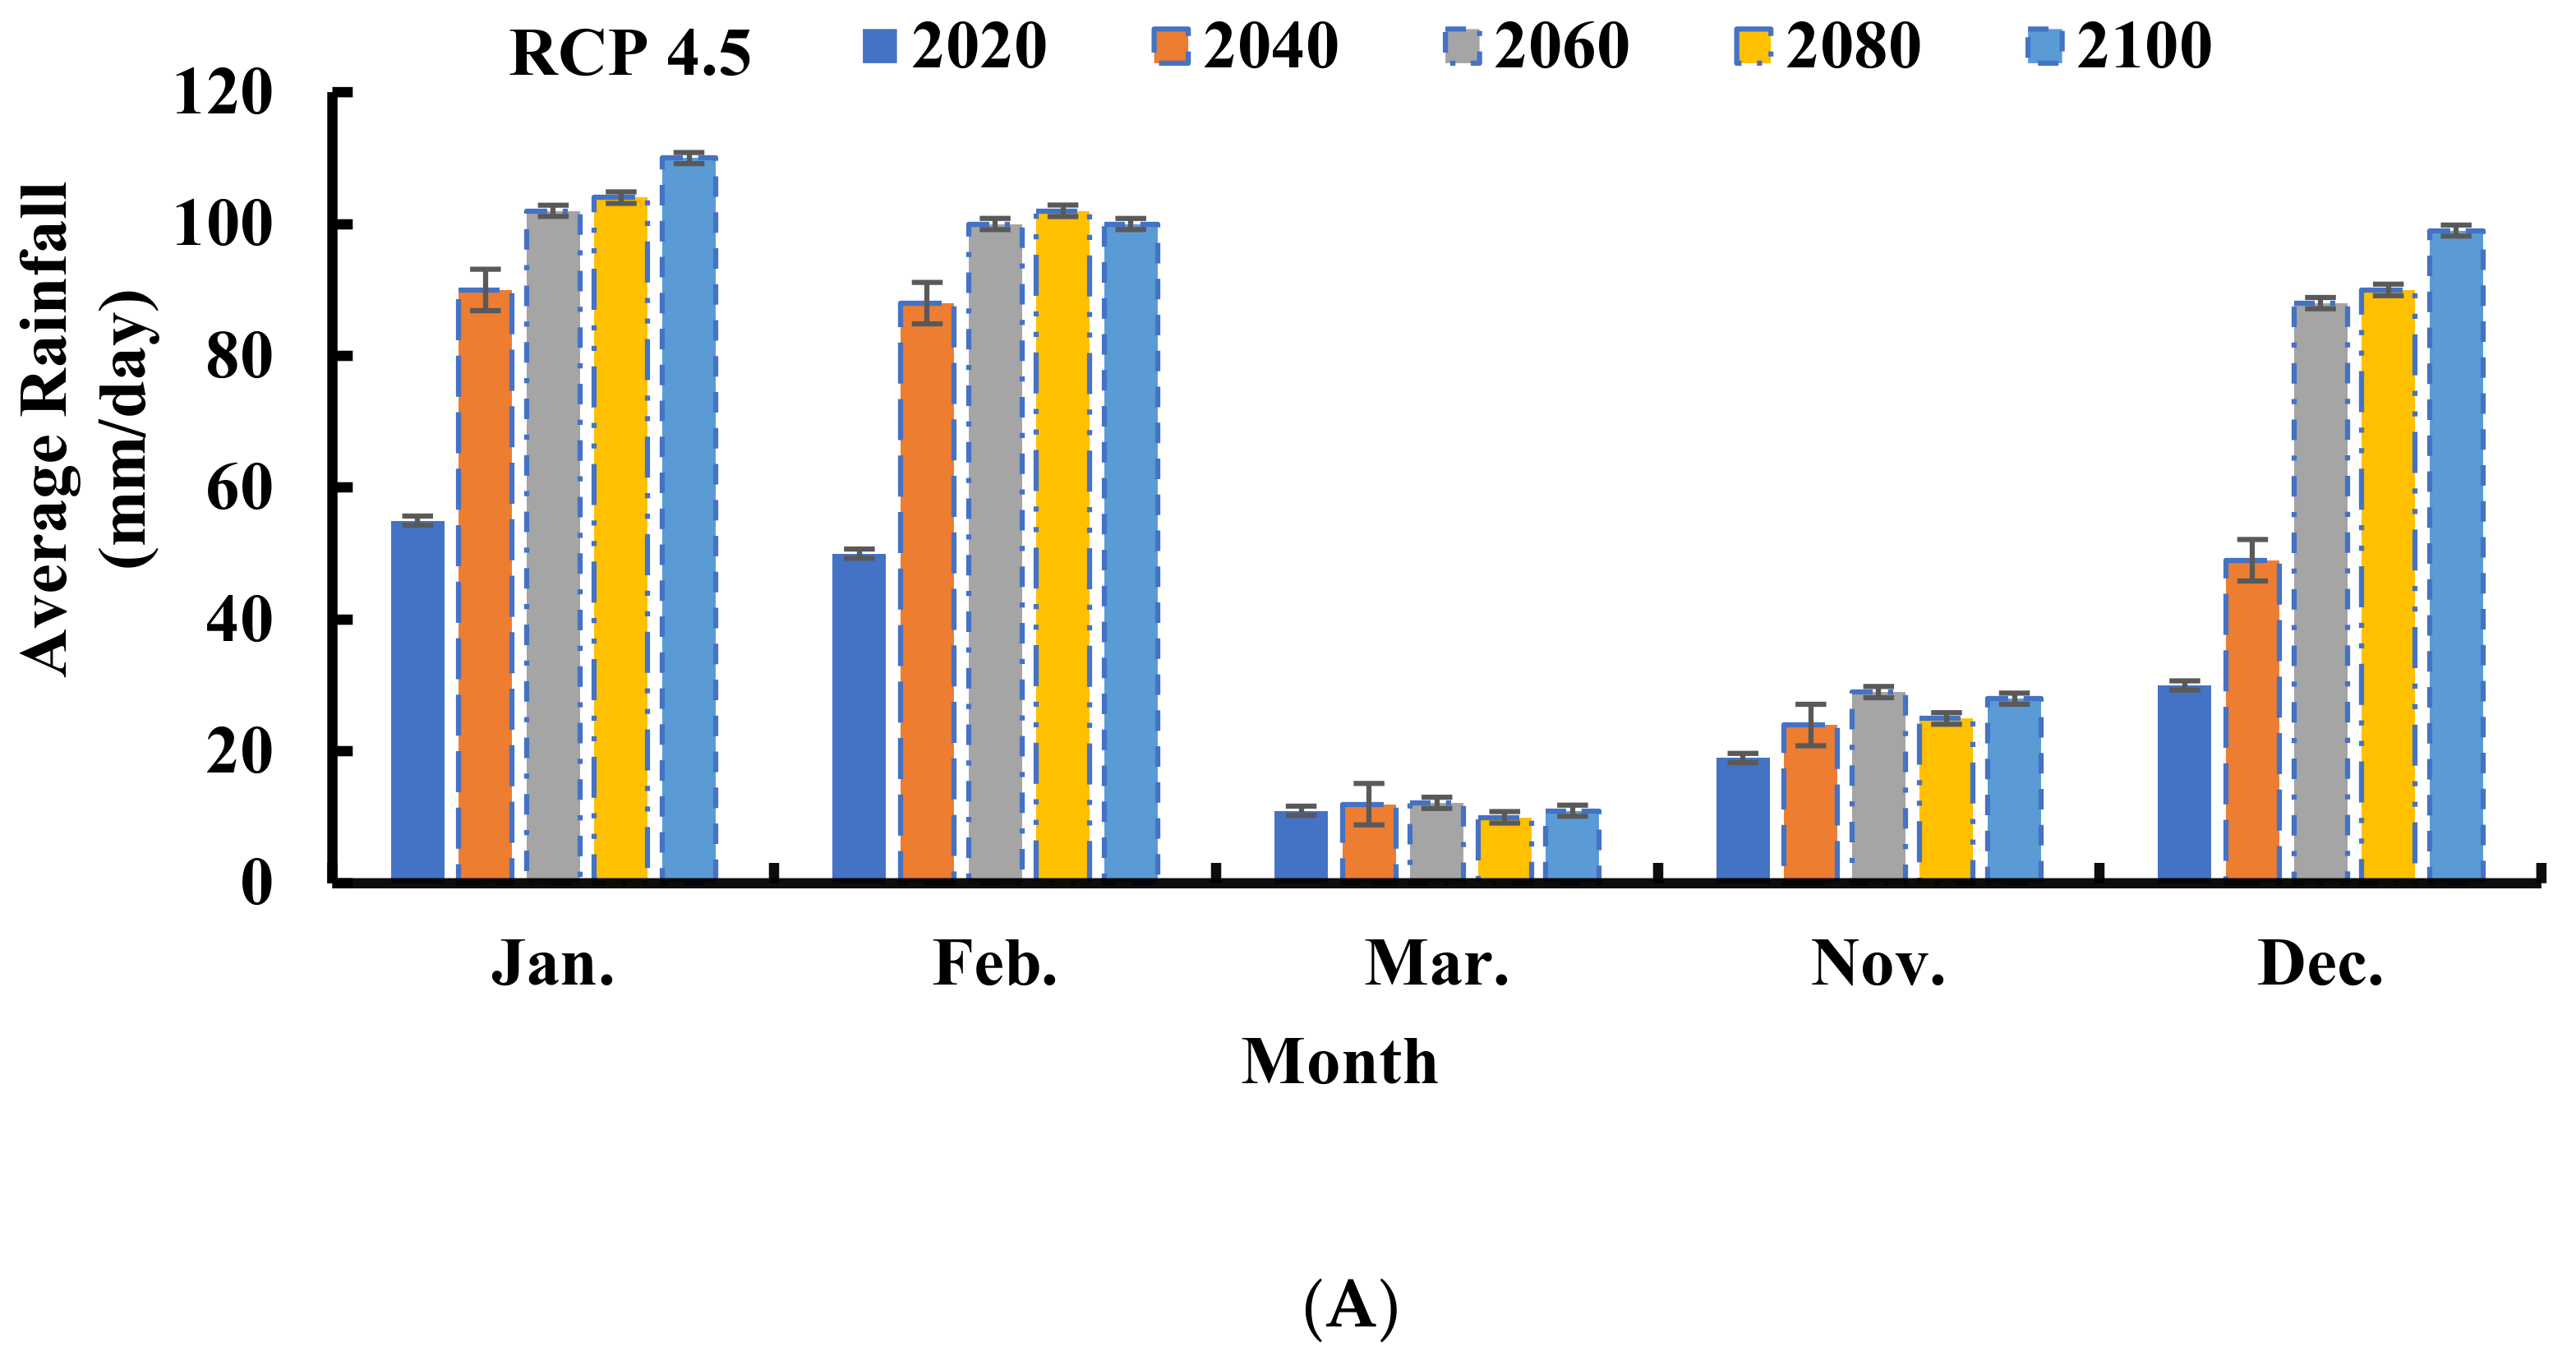
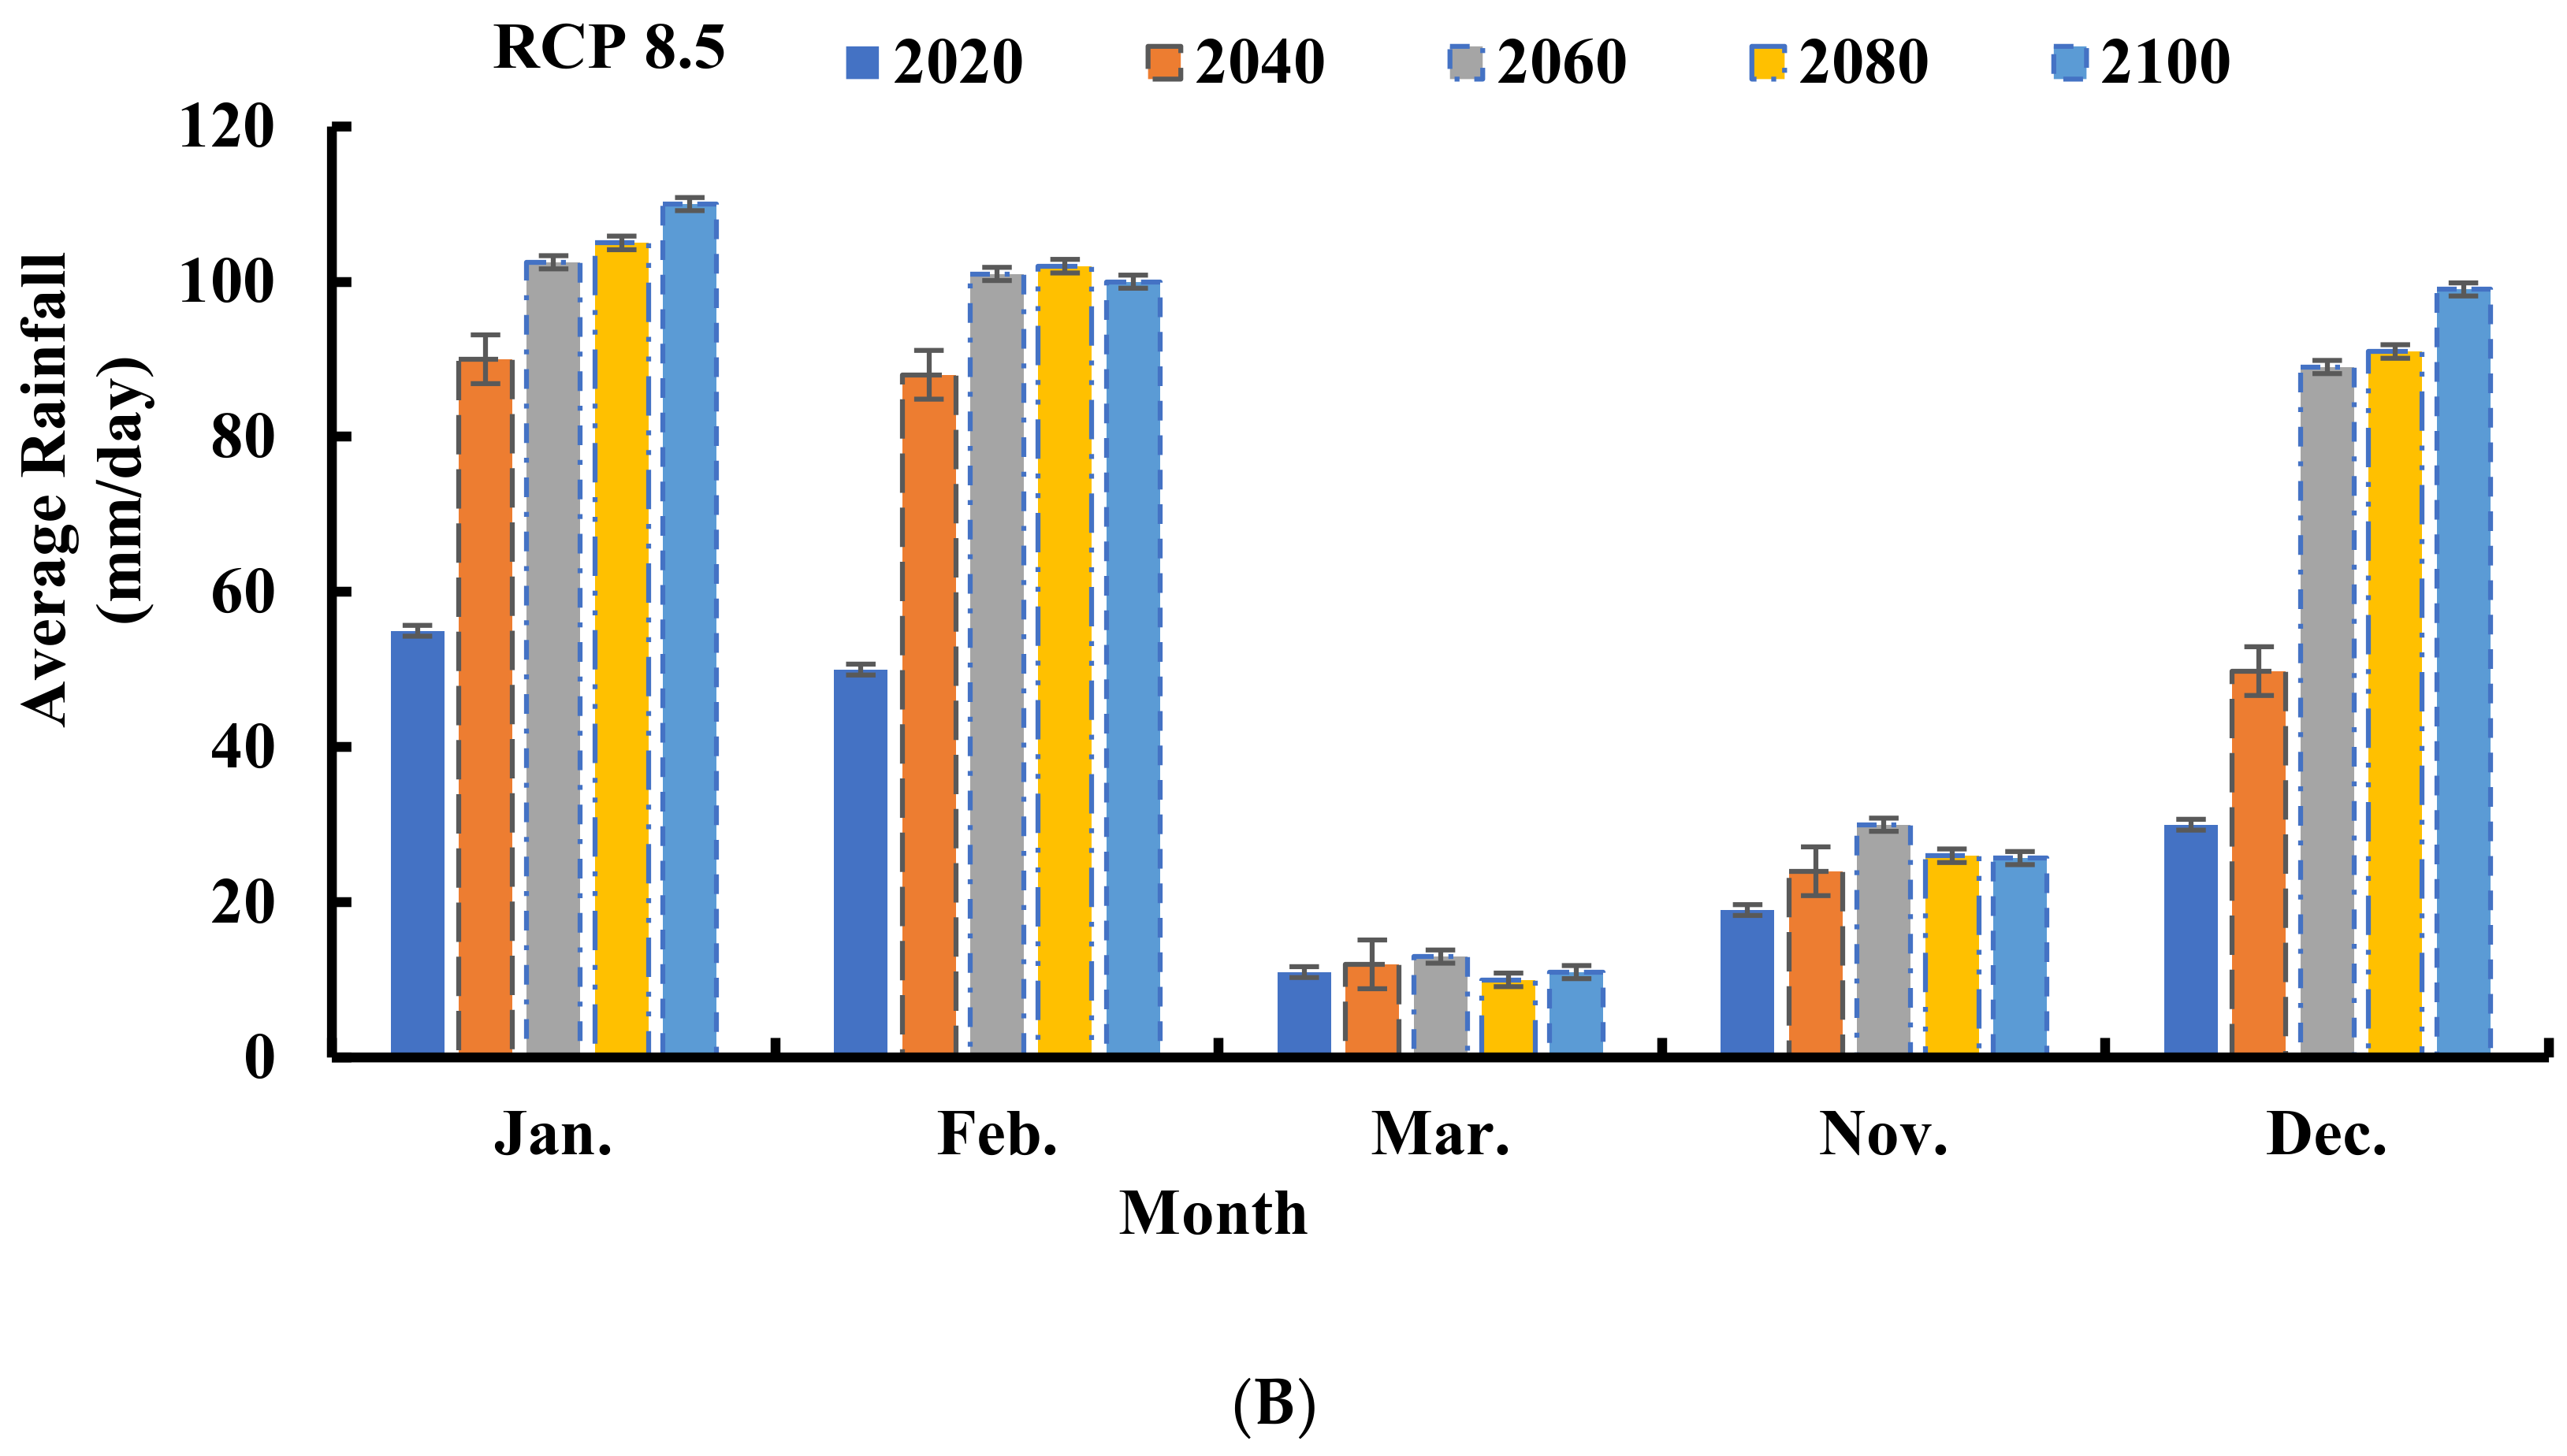
2.2. Climate Change Models
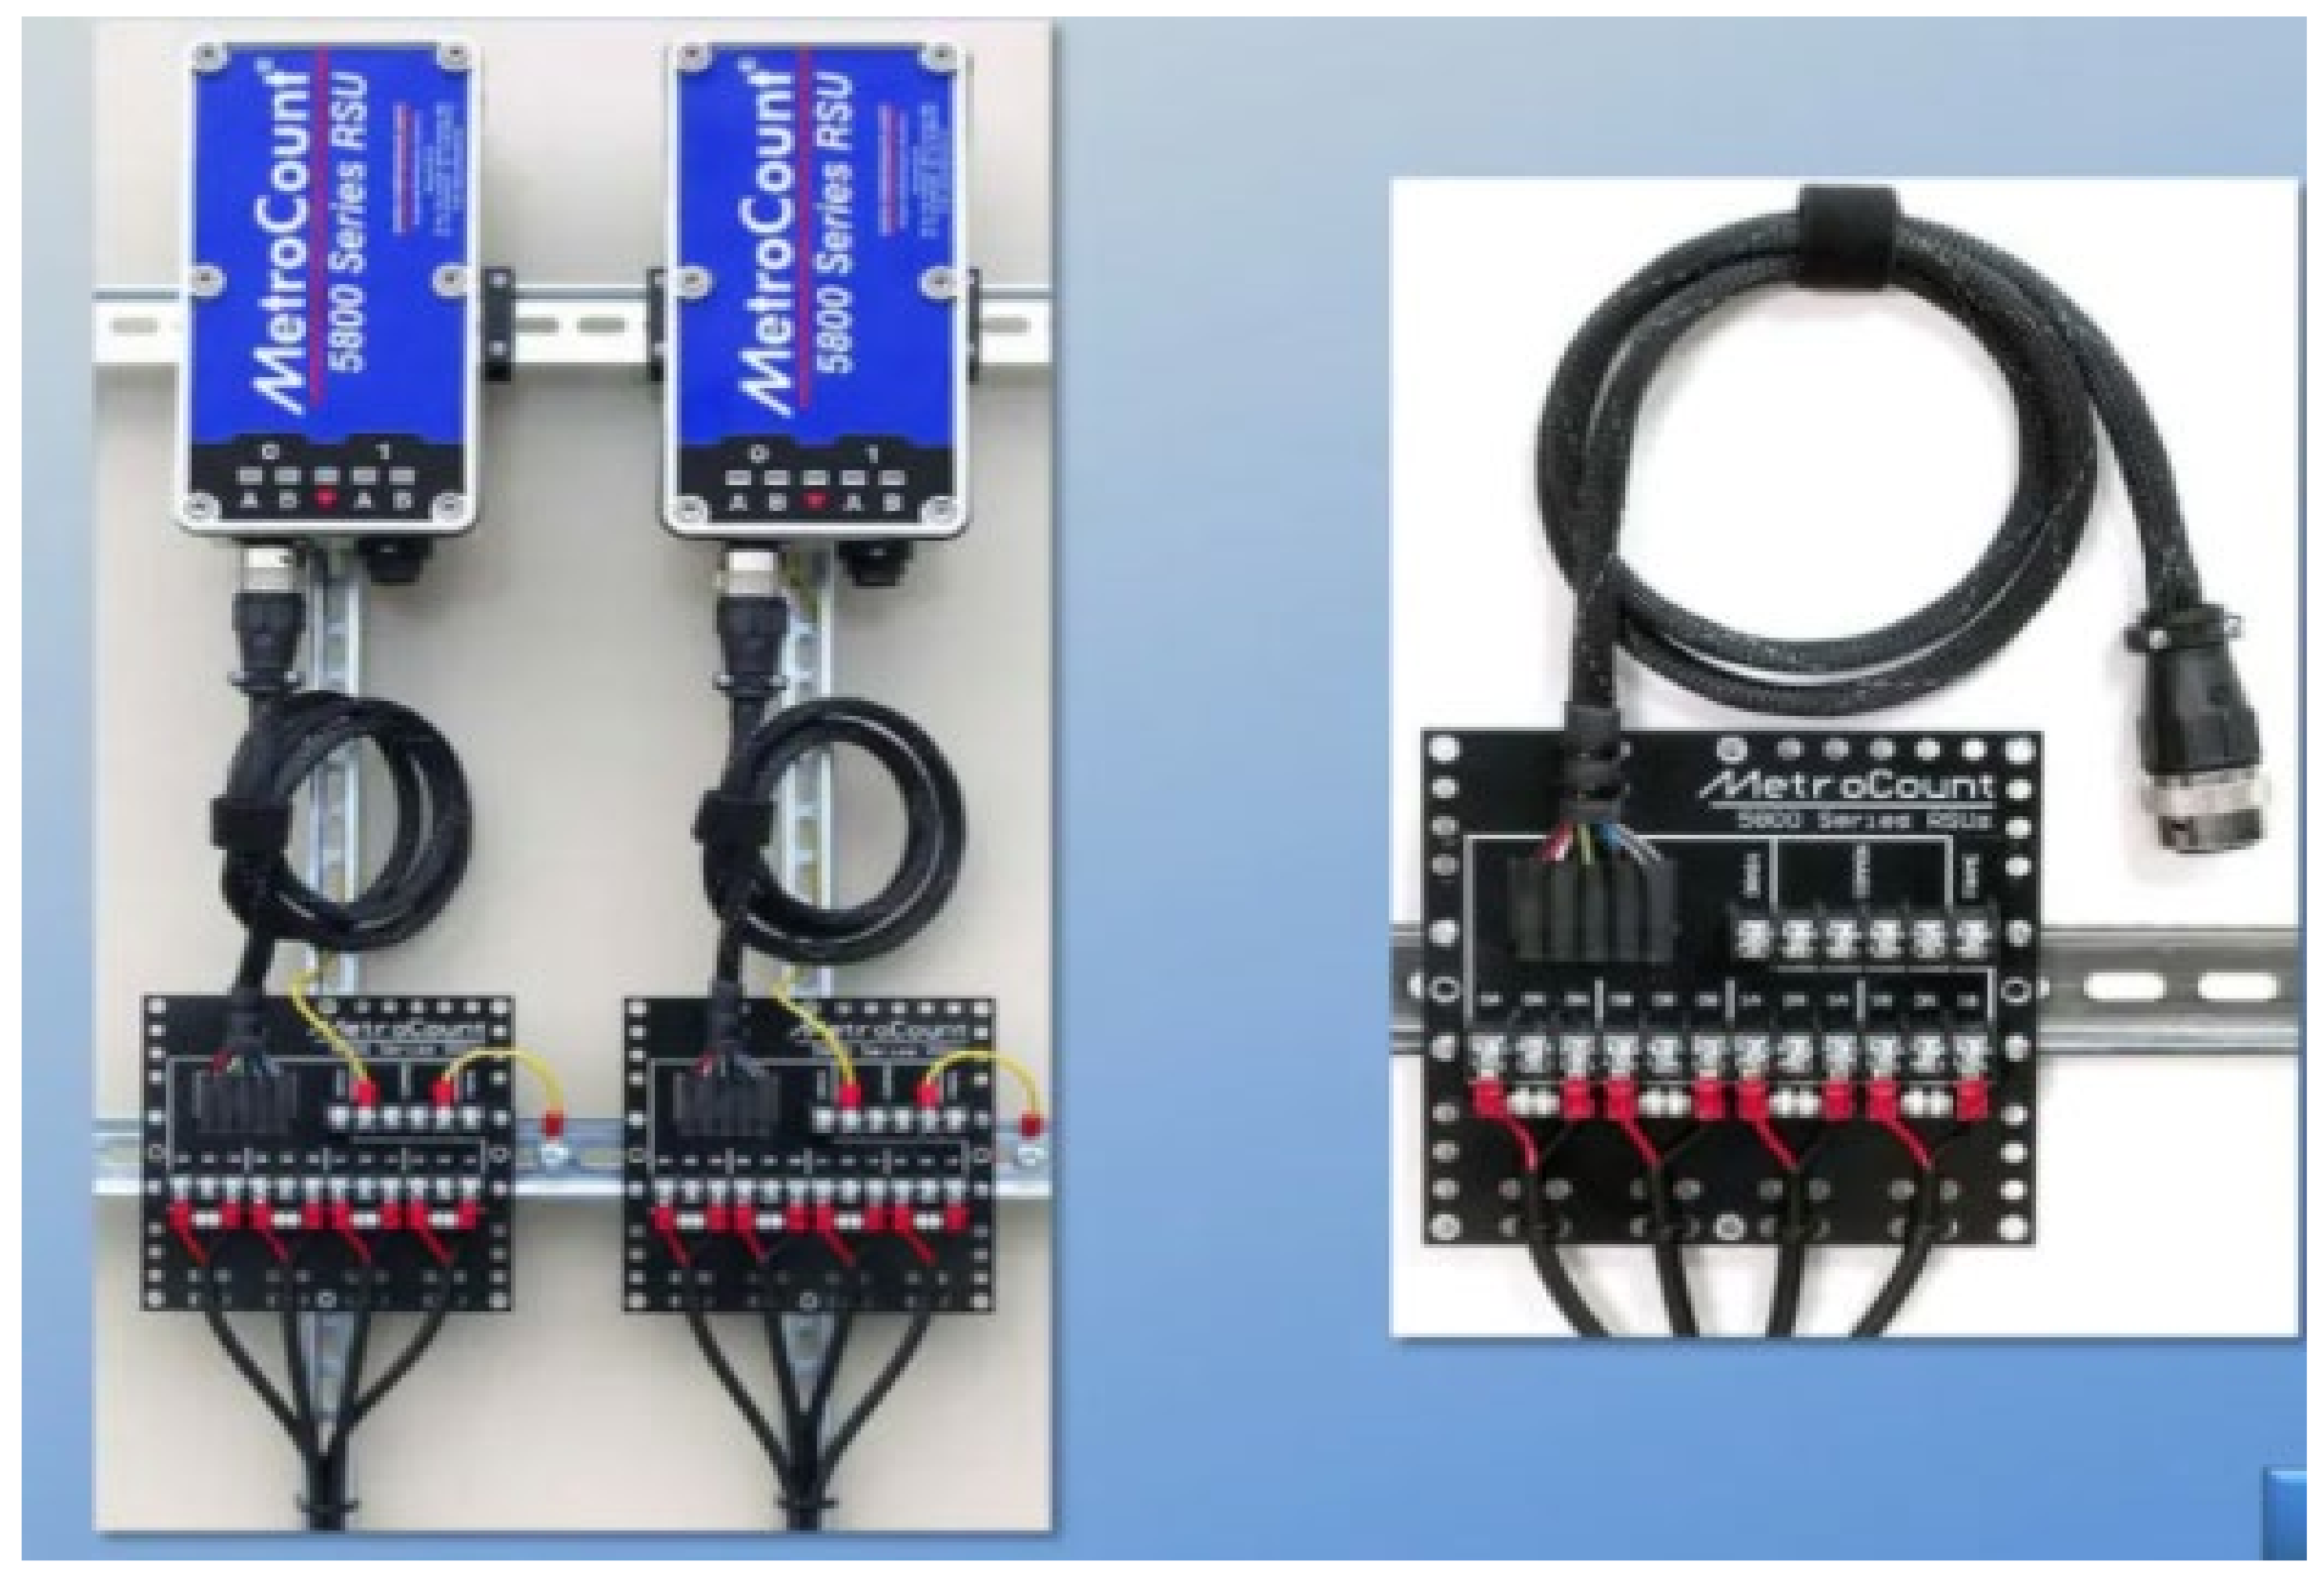
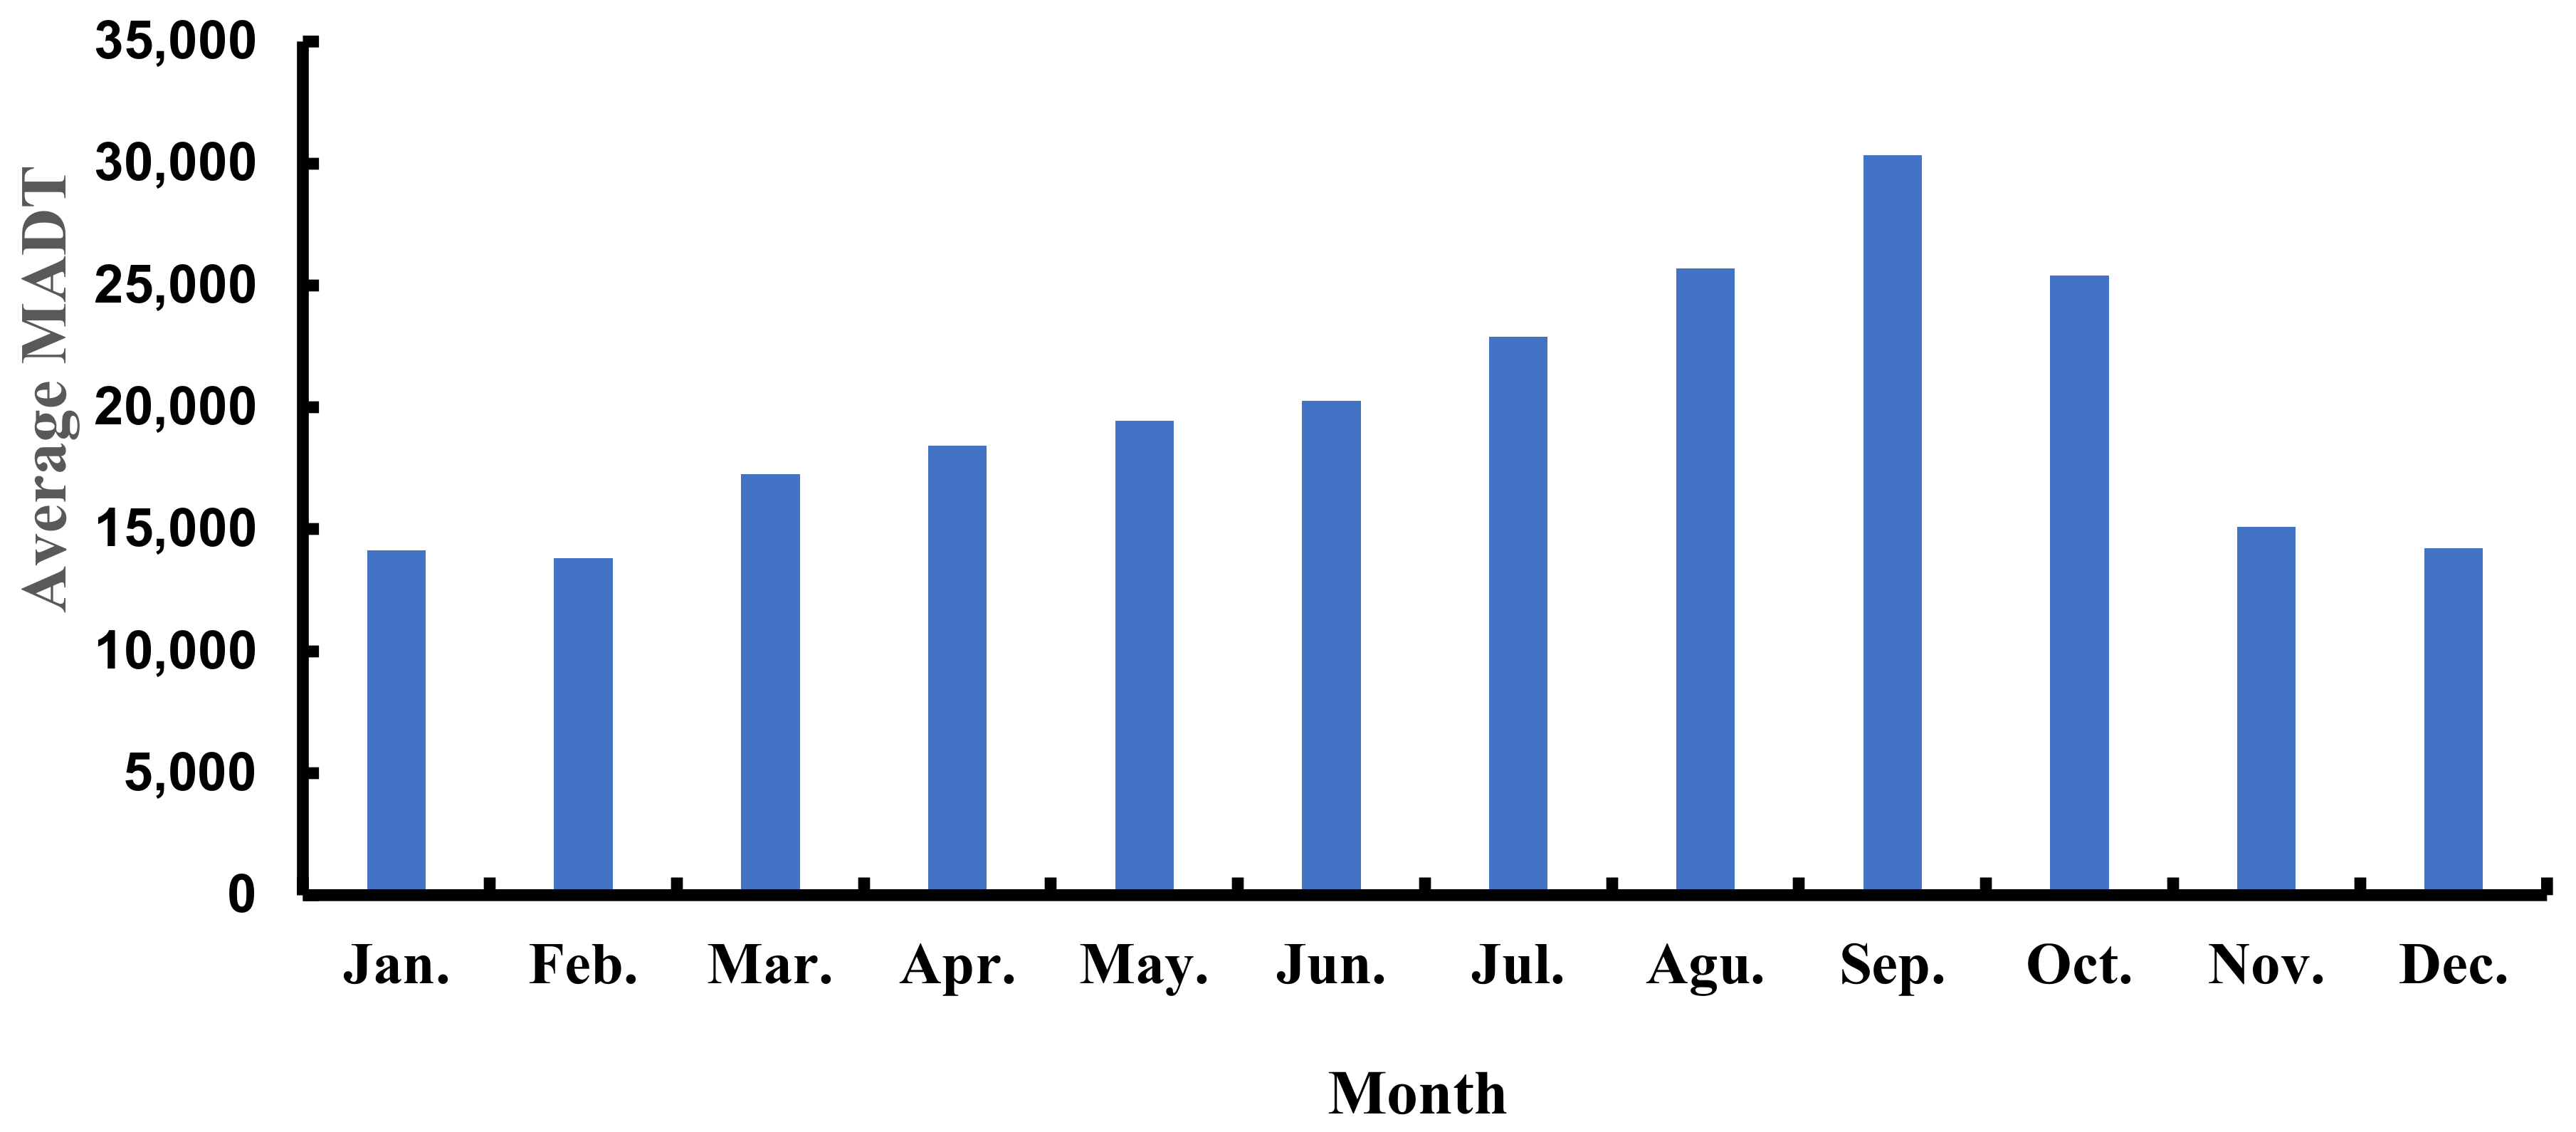
2.3. The Metrocount of Surveying Traffic
2.4. Rainfall Harvesting Methods
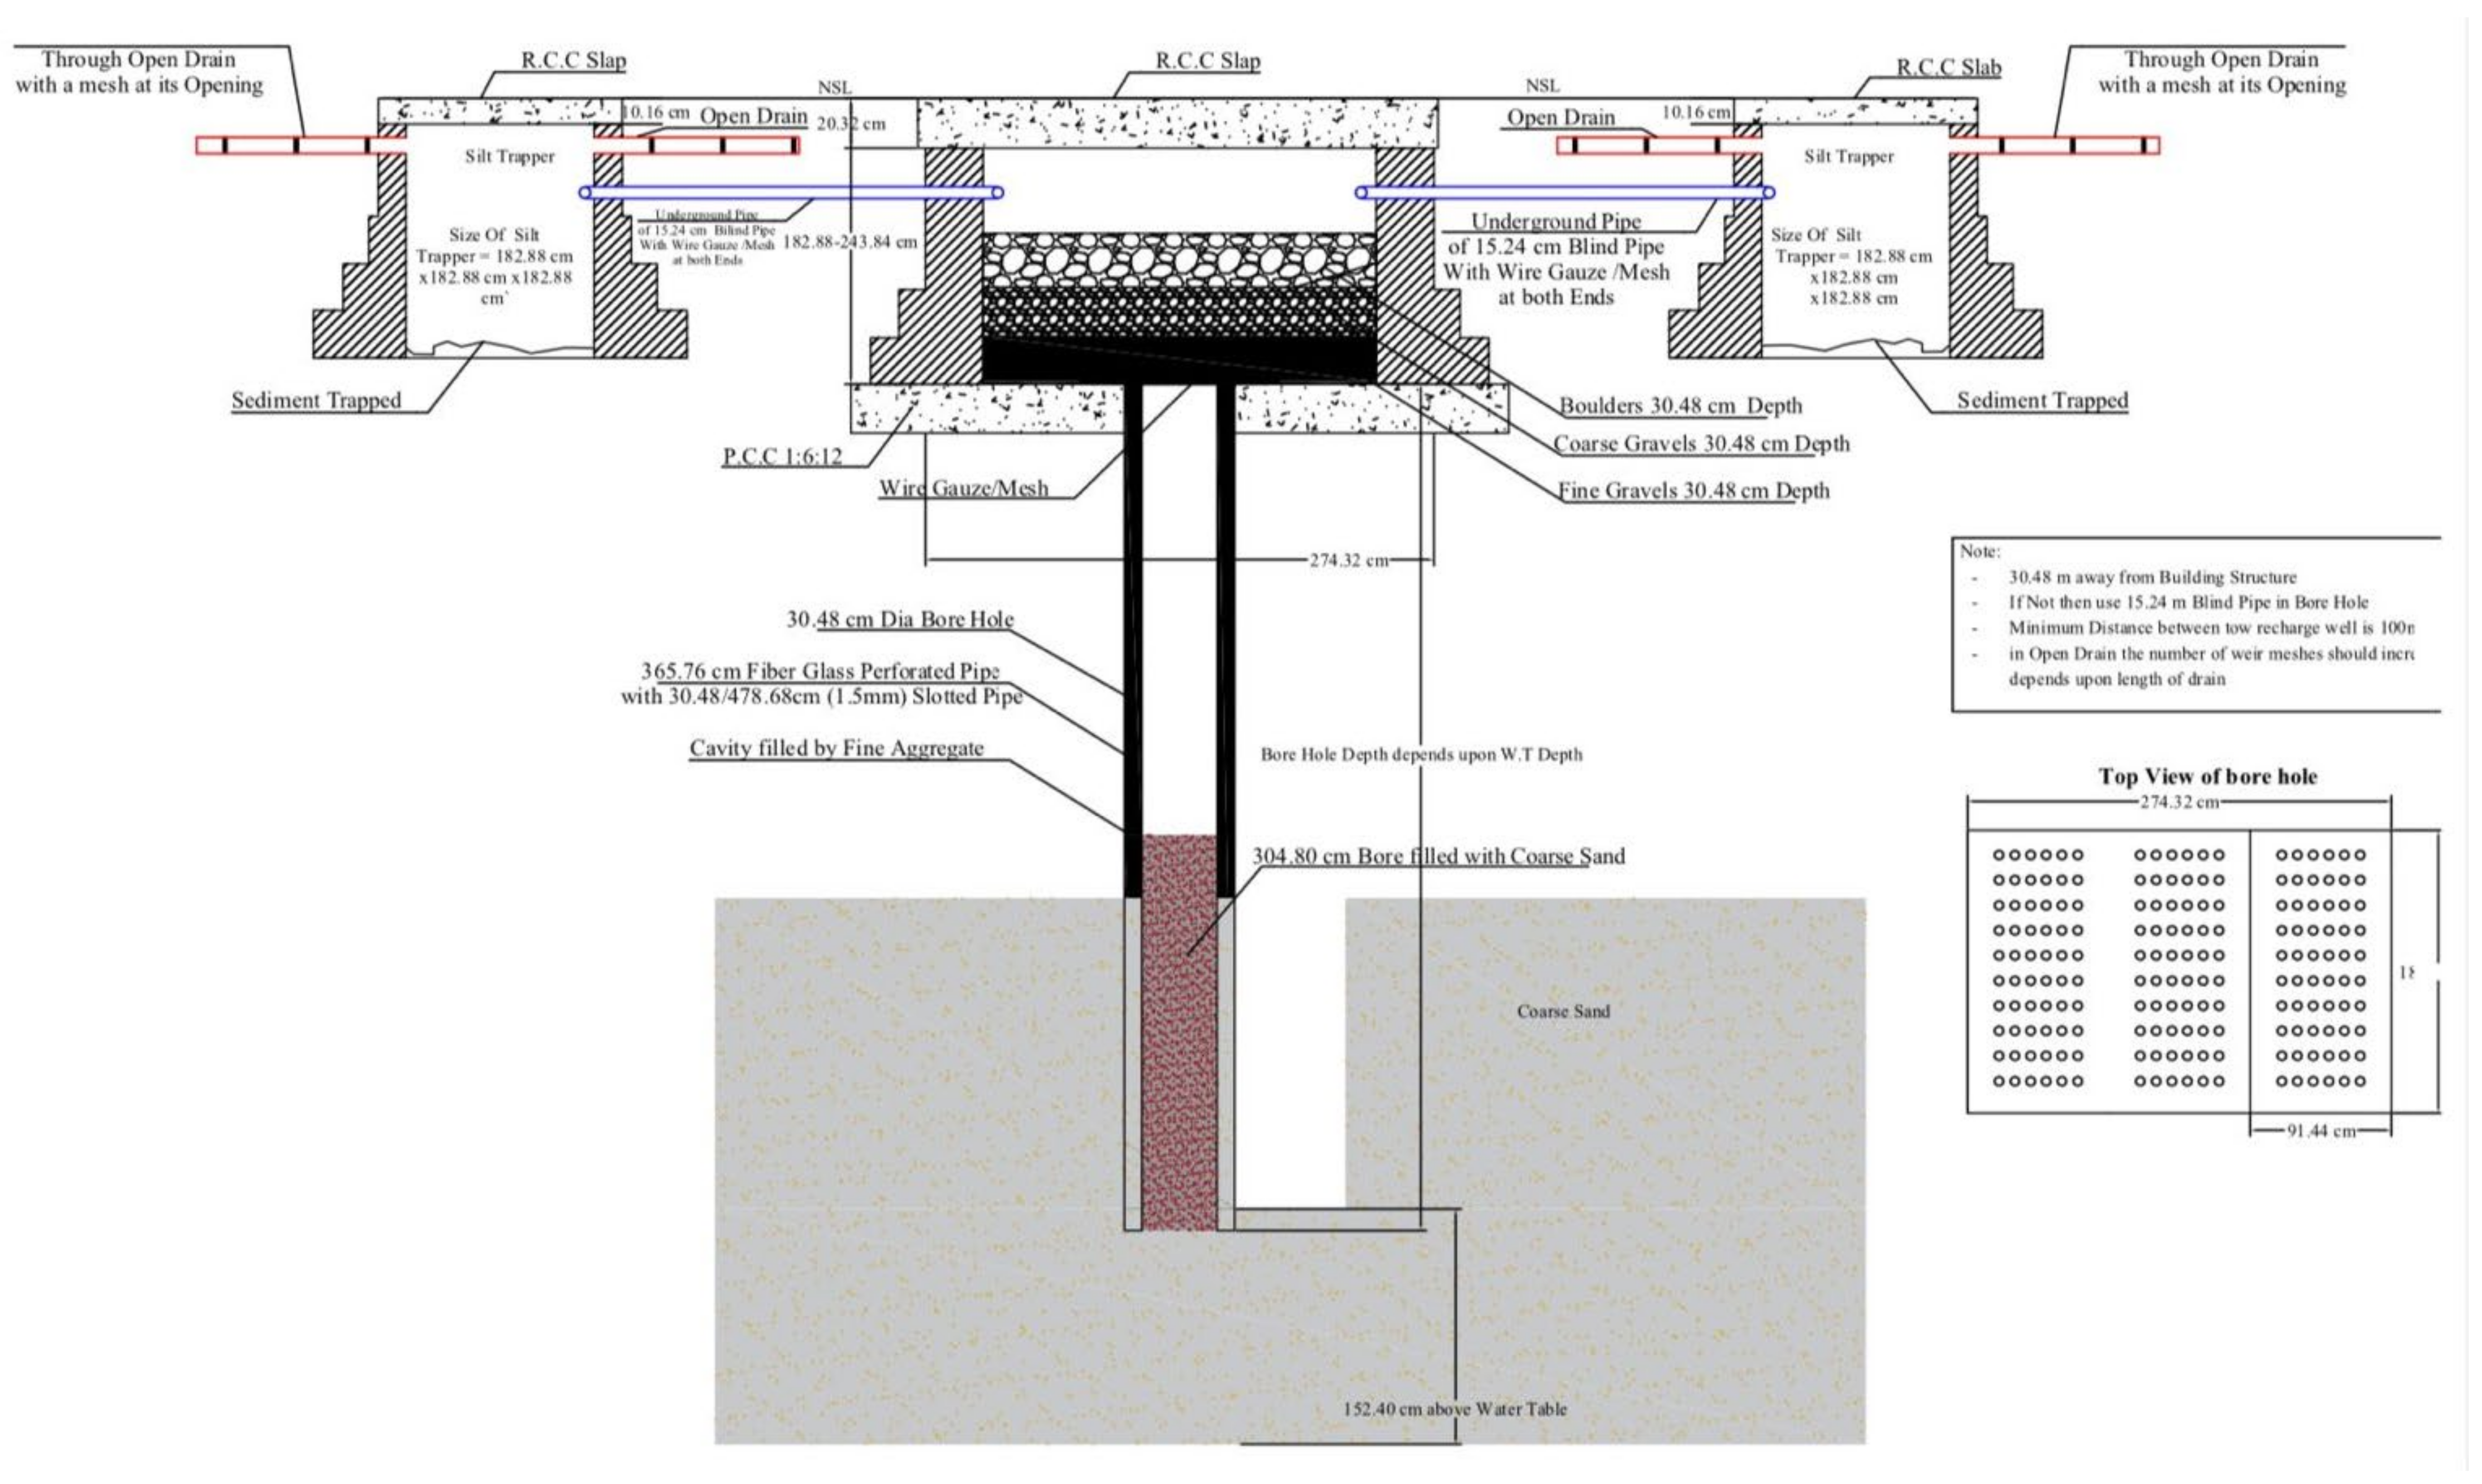
Artificial Aquifer Recharge
3. Results
3.1. Effect of Climate Changes on Road Traffic
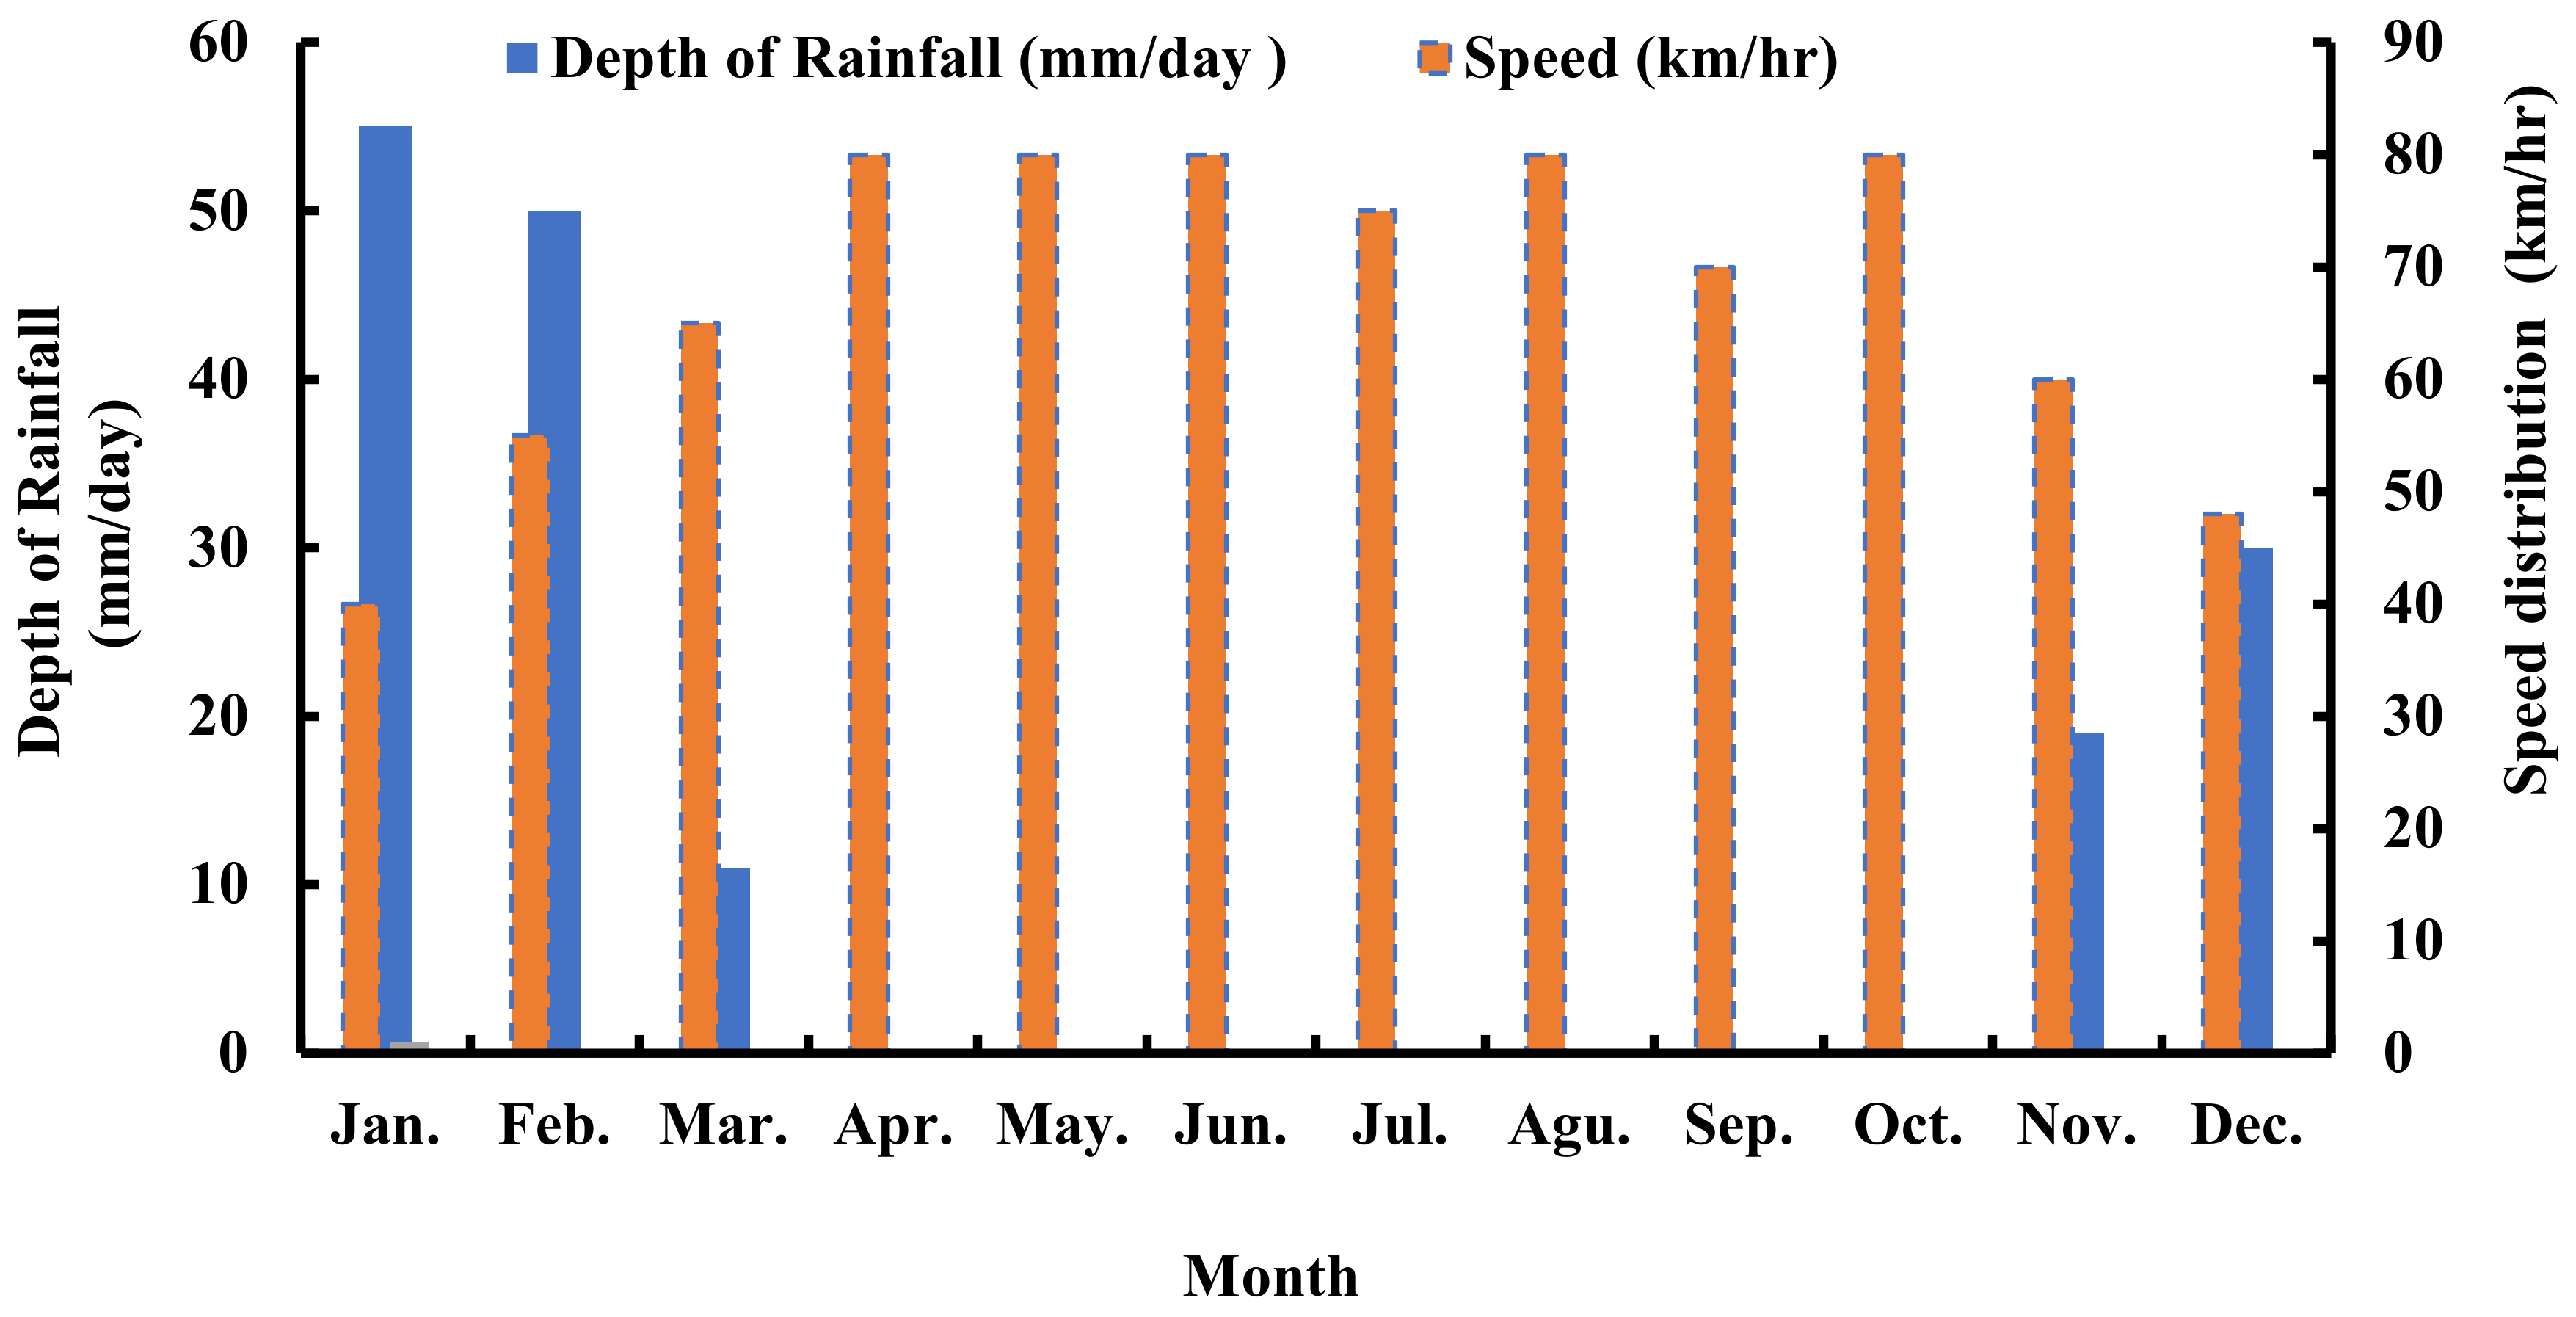
3.2. Effect of Rainfall on Traffic Flow
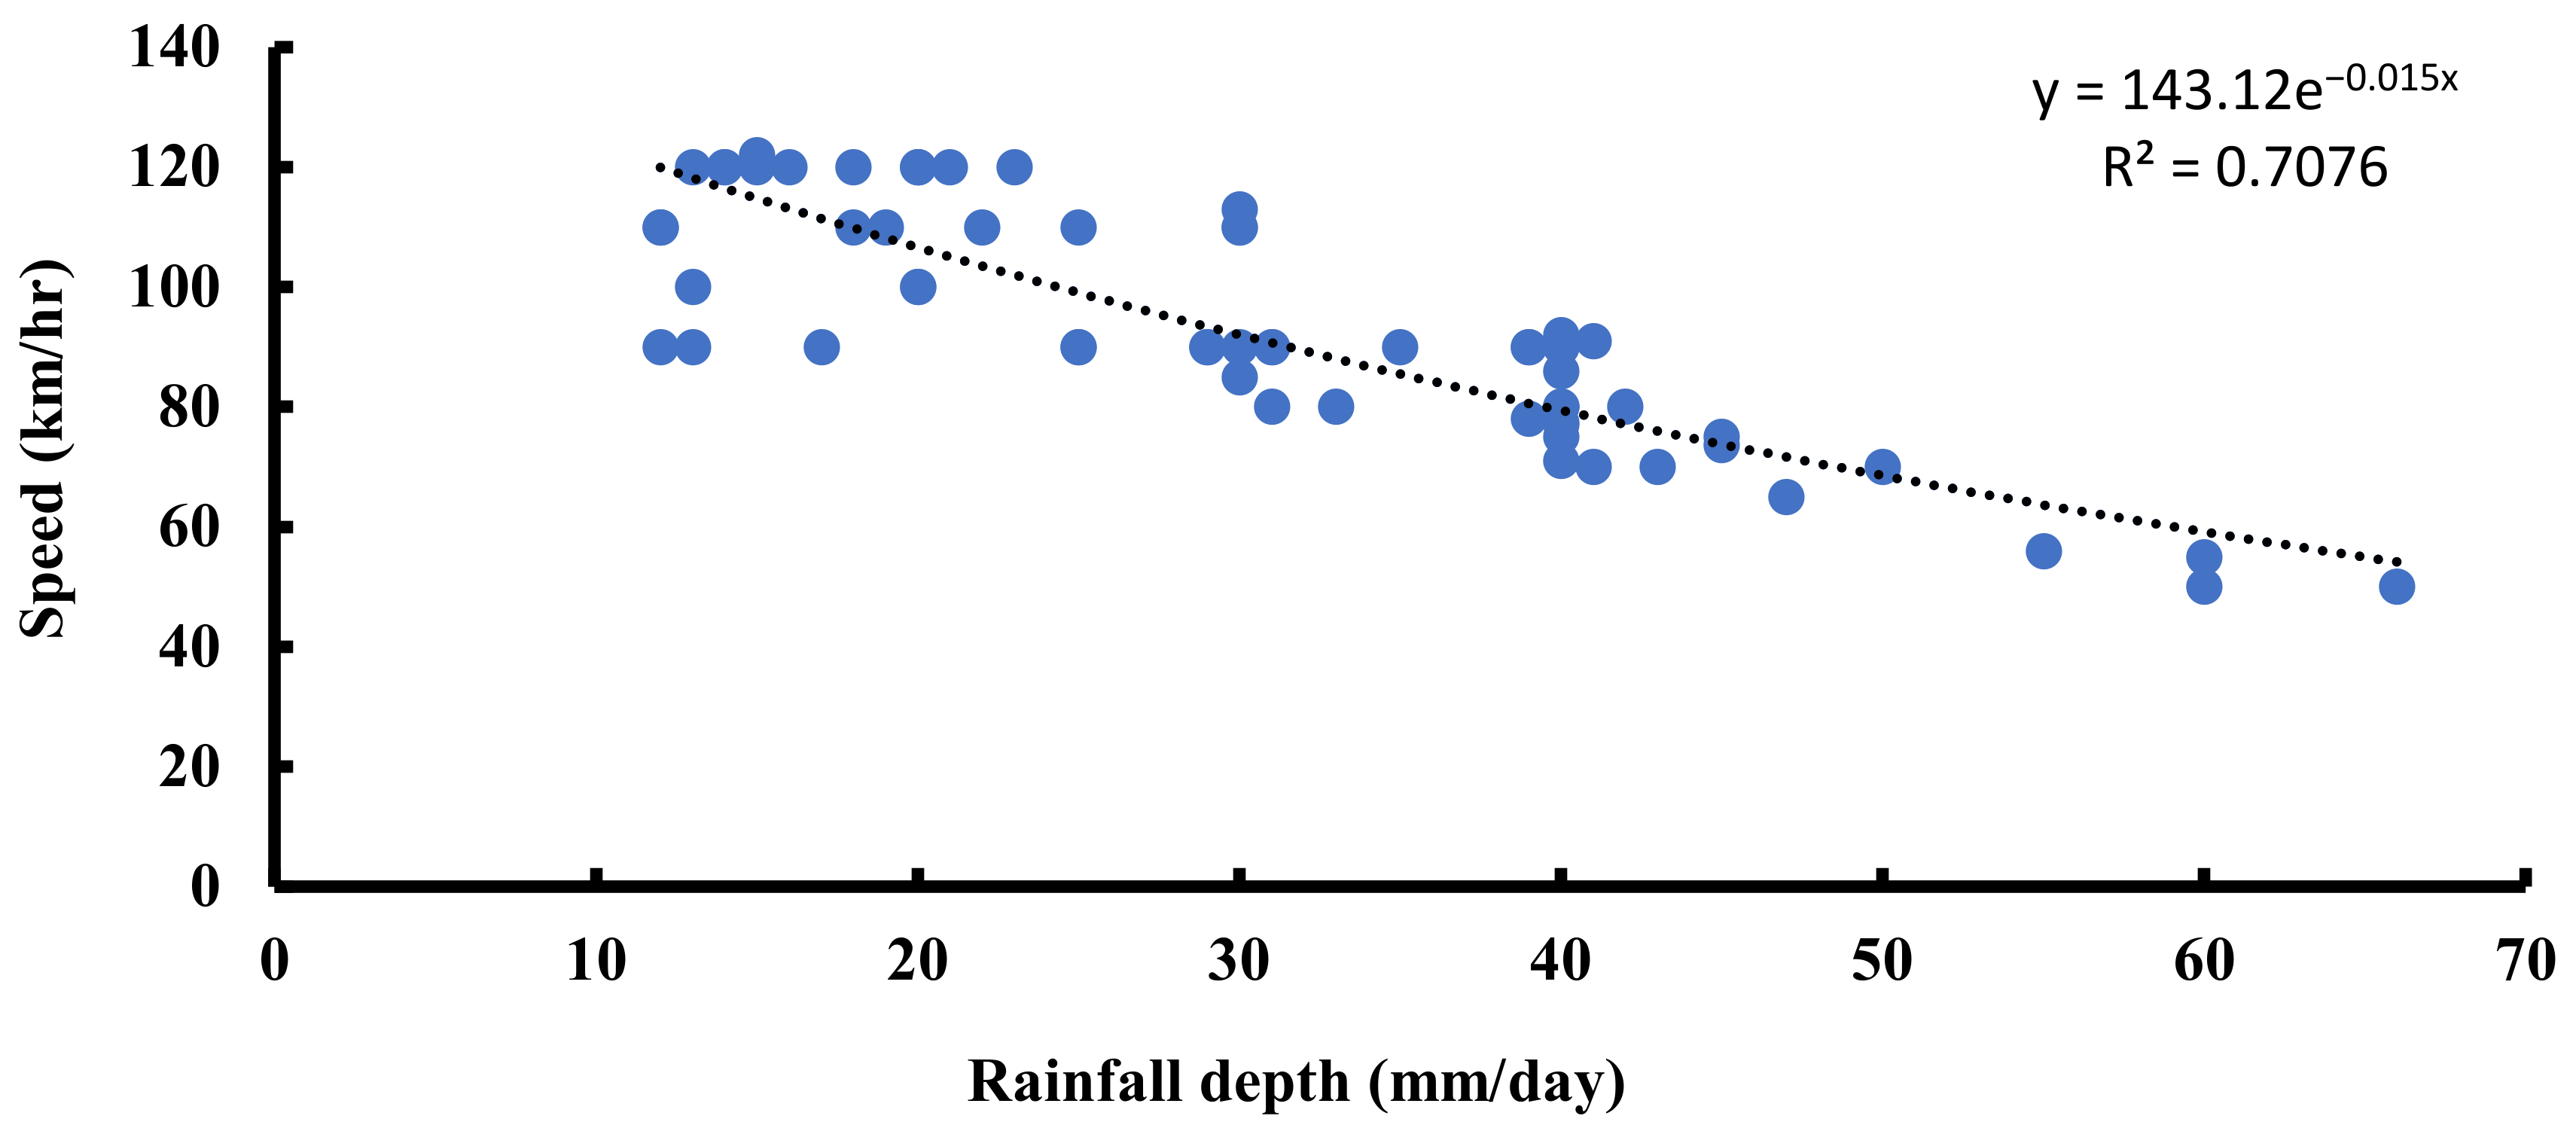
3.3. Speed Analysis
Travel Speed in Rainy Conditions
3.4. Traffic Flow Reduction at Various Rainfall Densities
3.5. Coefficient of Reduction in Heavy Rain
3.6. The Subsequent Day after Rain
3.7. Coefficient of Reduction in Lighter Rain
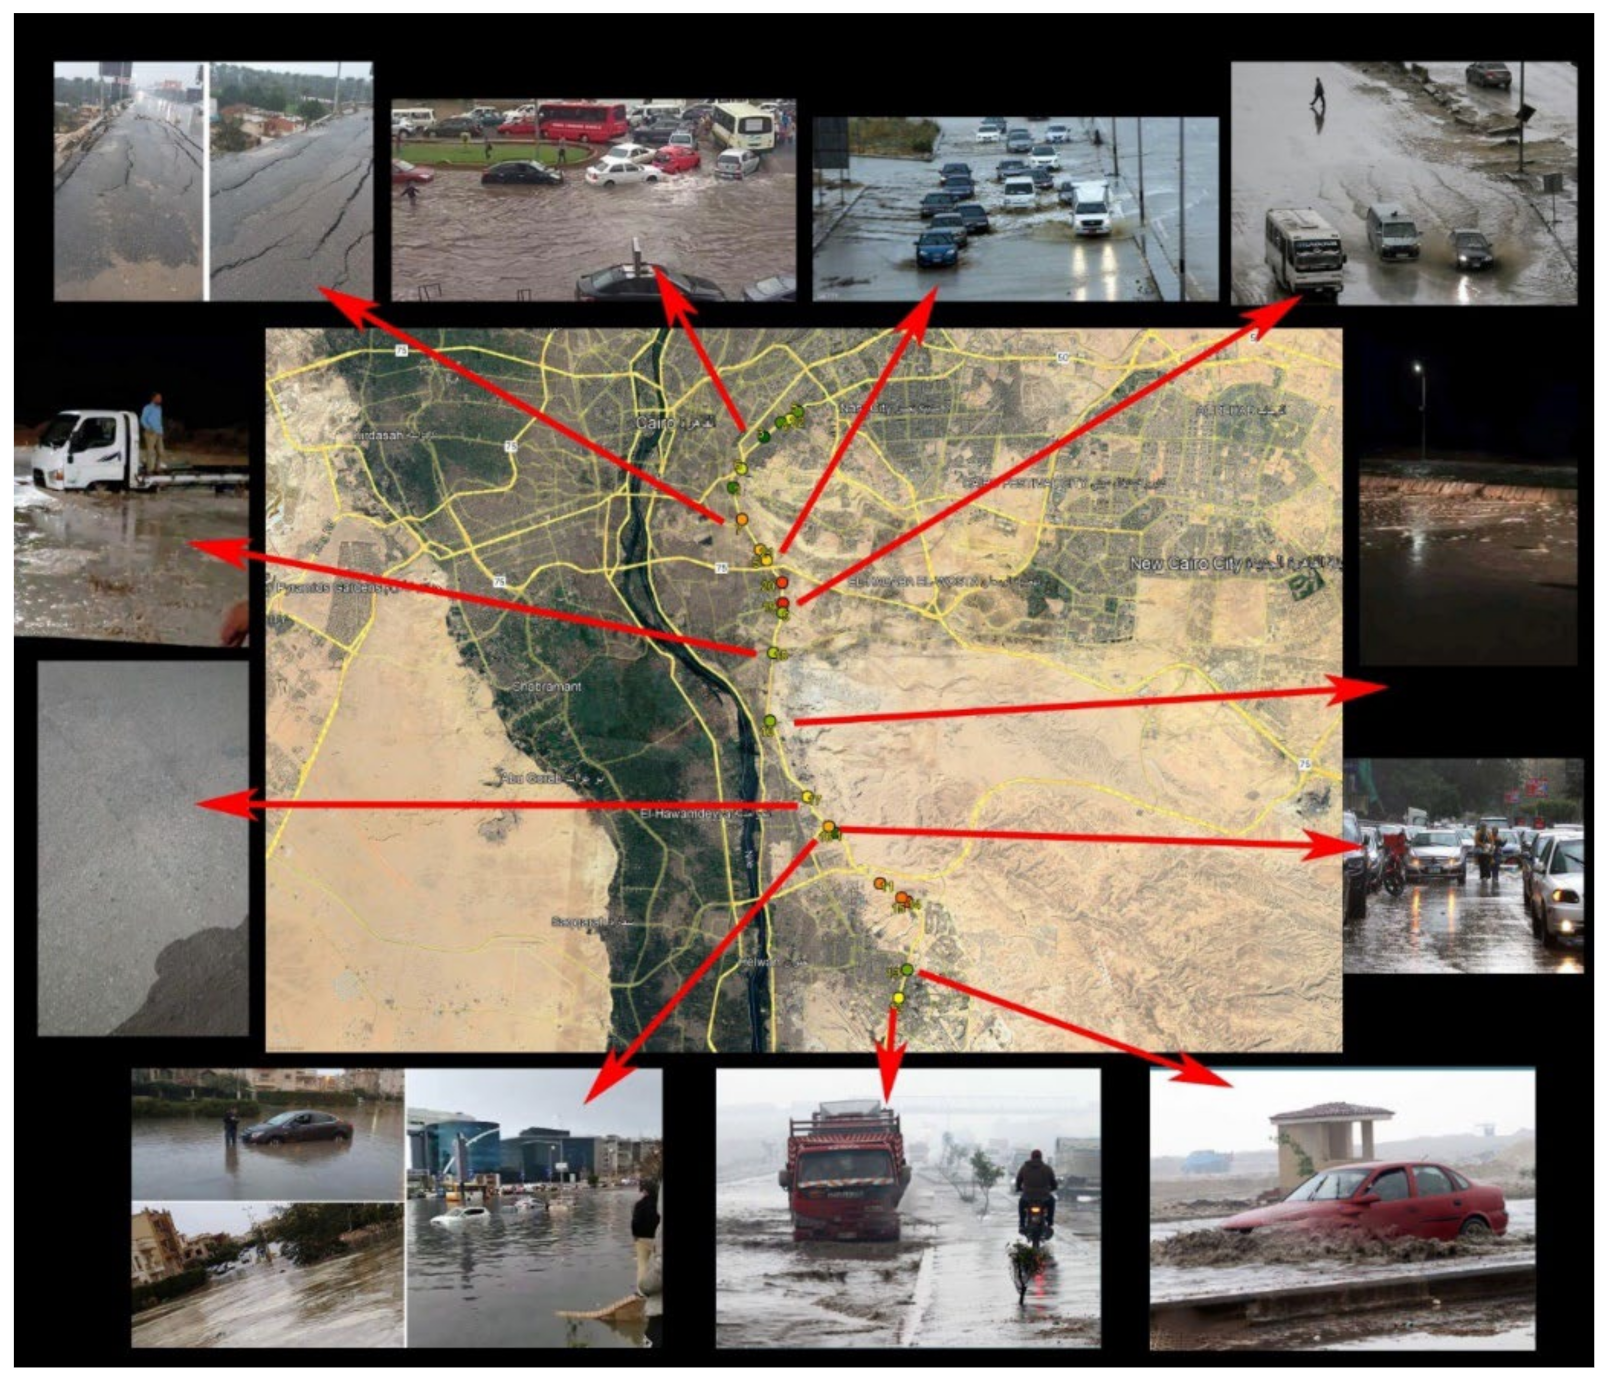
3.8. Identification of Ponding Sites
3.9. Recommended Recharging Wells
4. Discussion
4.1. Rainfall–Depth–Vehicle Speed Relationship Compared with Literature
4.2. Rainwater Harvesting by Recharging Wells
5. Conclusions and Recommendations
Author Contributions
Funding
Institutional Review Board Statement
Informed consent Statement
Data Availability Statement
Acknowledgments
Conflicts of Interest
References
- Singh, C.; Madhavan, M.; Arvind, J.; Bazaz, A. Climate change adaptation in Indian cities: A review of existing actions and spaces for triple wins. Urban Clim. 2021, 36, 100783. [Google Scholar] [CrossRef]
- Walter, L.F.; Abdul-Lateef, B.; Olawale, E.O.; Ulisses, M.A.; Desalegn, Y.A.; Pastor, D.C.M.; Gustavo, J.N.; Paulette, B.; Otienoh, O.; Yannick Toamukum, N.; et al. Assessing the impacts of climate change in cities and their adaptive capacity: Towards transformative approaches to climate change adaptation and poverty reduction in urban areas in a set of developing countries. Sci. Total Environ. 2019, 692, 1175–1190. [Google Scholar]
- Liu, Y.; Zou, Y.; Wang, Y.; Wu, B. Impact of fog conditions on lane-level speeds on freeways. J. Transp. Eng. Part A Syst. 2020, 146, 04020095. [Google Scholar] [CrossRef]
- Han, G.; Pepin, P. Introduction to the Special Section on the aquatic climate change adaptation services program. Atmos. Ocean. 2019, 57, 1–2. [Google Scholar] [CrossRef] [Green Version]
- Aalbers, C.B.E.M.; Coninx, I.; Swart, R.J. Identification of Relevant International Networks, Programmers and Institutions for JPI Climate Research. 2018 Work Package 3-Deliverable 3.1. SINcERE. Available online: www.jpi-climate.eu (accessed on 10 June 2022).
- Wilson, C.; Guivarch, C.; Kriegler, E.; Van Ruijven, B.; Van Vuuren, D.P.; Krey, V.; Thompson, E.L. Evaluating process-based integrated assessment models of climate change mitigation. Clim. Change 2021, 166, 1–22. [Google Scholar] [CrossRef]
- Gidden, M.J.; Riahi, K.; Smith, S.J.; Fujimori, S.; Luderer, G.; Kriegler, E.; Takahashi, K. Global emissions pathways under different socioeconomic scenarios for use in CMIP6: A dataset of harmonized emissions trajectories through the end of the century. Geosci. Model Dev. 2019, 12, 1443–1475. [Google Scholar] [CrossRef] [Green Version]
- Stouffer, R.J.; Eyring, V.; Meehl, G.A.; Bony, S.; Senior, c.; Stevens, B.; Taylor, K.E. CMIP5 scientific gaps and recommendations for CMIP6. Bull. Am. Meteorol. Soc. 2017, 98, 95–105. [Google Scholar] [CrossRef]
- Yang, X.; Yu, X.; Wang, Y.; He, X.; Pan, M.; Zhang, M.; Sheffield, J. The optimal multi-model ensemble of bias-corrected CMIP5 climate models over China. J. Hydrometeorol. 2020, 21, 845–863. [Google Scholar] [CrossRef]
- Gabr, M.E. Management of irrigation requirements using FAO-CROPWAT 8.0 model: A case study of Egypt. Modeling Earth Syst. Environ. 2021, 1–16. [Google Scholar] [CrossRef]
- Ministry of Water Resources and Irrigation (MWRI). Egypt’s Water Resources Plan for 2017–2037; Planning Sector, Ministry of Water Resources and Irrigation (MWRI): Giza, Egypt, 2017. Available online: https://www.mwri.gov.eg (accessed on 10 January 2022). (In Arabic)
- Mostafa, S.M.; Wahed, O.; El-Nashar, W.Y.; El-Marsafawy, S.M.; Abd-Elhamid, H.F. Impact of climate change on water resources and crop yield in the Middle Egypt region. AQUA Water Infrastruct. Ecosyst. Soc. 2021, 70, 1066–1084. [Google Scholar] [CrossRef]
- Gabr, M.E. Modelling net irrigation water requirements using FAO-CROPWAT 8.0 and CLIMWAT 2.0: A case study of Tina Plain and East South ElKantara regions, North Sinai, Egypt. Arch. Agron. Soil Sci. 2021, 68, 1322–1337. [Google Scholar] [CrossRef]
- Hafizi Md Lani, N.; Yusop, Z.; Syafiuddin, A. A review of rainwater harvesting in Malaysia: Prospects and challenges. Water 2018, 10, 506. [Google Scholar] [CrossRef] [Green Version]
- Ruso, M.; Akıntuğ, B.; Kentel, E. Optimum tank size for a rainwater harvesting system: Case study for Northern cyprus. Earth Environ. Sci. 2019, 297, 012026. [Google Scholar] [CrossRef] [Green Version]
- Gabr, M.; El-Ghandour, H.; Elabd, S. Rainwater Harvesting from Urban coastal cities Using Recharging Wells: A case Study of Egypt. Port-Said Eng. Res. J. 2022, in press. [Google Scholar] [CrossRef]
- Zabidi, H.A.; Goh, H.W.; Chang, C.K.; Chan, N.W.; Zakaria, N.A. A review of roof and pond rainwater harvesting systems for water security: The design, performance and way forward. Water 2020, 12, 3163. [Google Scholar] [CrossRef]
- Gado, T.A.; El-Agha, D.E. Feasibility of rainwater harvesting for sustainable water management in urban areas of Egypt. Environ. Sci. Pollut. Res. 2020, 27, 32304–32317. [Google Scholar] [CrossRef]
- Tolossa, T.T.; Abebe, F.B.; Girma, A.A. Review: Rainwater harvesting technology practices and implication of climate change characteristics in Eastern Ethiopia. Cogent Food Agric. 2020, 6, 1724354. [Google Scholar] [CrossRef]
- Min, Z.; Yufu, L.; Wenqi, S.; Yixiong, X.; Chang, J.; Yong, W.; Yuqi, B. Impact of rainfall on traffic speed in major cities of China. Sustainability 2021, 13, 9074. [Google Scholar] [CrossRef]
- Gabr, M.E. Design methodology for sewage water treatment system comprised of Imhoff’s tank and a subsurface horizontal flow constructed wetland: A case study Dakhla Oasis, Egypt. J. Environ. Sci. Health Part A 2022, 57, 52–64. [Google Scholar] [CrossRef]
- Madleen, S.; Gabr, M.E.; Mohamed, M.; Hani, M. Random Forest modelling and evaluation of the performance of a full-scale subsurface constructed wetland plant in Egypt. Ain Shams Eng. J. 2022, 13, 101778. [Google Scholar]
- Hofman-Caris, R.; Bertelkamp, C.; de Waal, L.; van den Brand, T.; Hofman, J.; van der Aa, R.; van der Hoek, J.P. Rainwater harvesting for drinking water production: A sustainable and cost-effective solution in the Netherlands. Water 2019, 11, 511. [Google Scholar] [CrossRef] [Green Version]
- El Afandi, G.; Morsy, M. Developing an early warning system for flash flood in Egypt: Case study Sinai Peninsula. In Flash Floods in Egypt; Springer: Cham, Switzerland, 2020; pp. 45–60. [Google Scholar]
- Vidas, M.; Tubić, V.; Ivanović, I.; Subotić, M. One Approach to Quantifying Rainfall Impact on the Traffic Flow of a Specific Freeway Segment. Sustainability 2022, 14, 4985. [Google Scholar] [CrossRef]
- Yang, Y.; Ng, S.T.; Dao, J.; Zhou, S.; Xu, F.J.; Xu, X.; Zhou, Z. BIM-GIS-DcEs enabled vulnerability assessment of interdependent infrastructures—A case of stormwater drainage-building-road transport Nexus in urban flooding. Autom. Constr. 2021, 125, 103626. [Google Scholar] [CrossRef]
- Shahdani, F.J.; Ariza, M.P.S.; Coelho, M.R.F.; Sousa, H.S.; Matos, J.C. The indirect impact of flooding on the road transport network, a case study of Santarém region in Portugal. In Proceedings of the 30th European Safety and Reliability Conference and the 15th Probabilistic Safety Assessment and Management Conference, Angers, France, 19–23 September 2021. [Google Scholar]
- Yoo, B.H.; Kim, J.; Lee, B.W.; Hoogenboom, G.; Kim, K.S. A surrogate weighted mean ensemble method to reduce the uncertainty at a regional scale for the calculation of potential evapotranspiration. Sci. Rep. 2020, 10, 1–11. [Google Scholar] [CrossRef]
- Broggio, M.F.; Garcia, C.A.E.; Silva, R.R.D. Evaluation of South Atlantic Thermohaline Properties from BESM-OA2. 5 and Three Additional Global Climate Models. Ocean Coast. Res. 2021, 69. [Google Scholar] [CrossRef]
- Rehman, N.; Adnan, M.; Ali, S. Assessment of CMIP5 climate models over South Asia and climate change projections over Pakistan under representative concentration pathways. Int. J. Glob. Warm. 2018, 16, 381–415. [Google Scholar] [CrossRef]
- Shen, C.; Duan, Q.; Miao, C.; Xing, C.; Fan, X.; Wu, Y.; Han, J. Bias. Correction and ensemble projections of temperature changes over ten subregions in CORDEX East Asia. Adv. Atmos. Sci. 2020, 37, 1191–1210. [Google Scholar] [CrossRef]
- Xu, Y.; Gao, X.; Giorgi, F.; Zhou, B.; Shi, Y.; Wu, J.; Zhang, Y. Projected changes in temperature and precipitation extremes over China as measured by 50-yr return values and periods based on a CMIP5 ensemble. Adv. Atmos. Sci. 2018, 35, 376–388. [Google Scholar] [CrossRef]
- Dix, M.; Vohralik, P.; Bi, D.; Rashid, H.; Marsland, S.; O’Farrell, S.; Puri, K. The ACCESS coupled model: Documentation of core CMIP5 simulations and initial results. Aust. Meteorol. Oceanogr. J. 2013, 63, 83–99. [Google Scholar] [CrossRef]
- Mabhaudhi, T.; Chibarabada, T.P.; Chimonyo, V.G.P.; Modi, A.T. Modelling climate change impact: A case of bambara groundnut (Vigna subterranea). Phys. Chem. Earth Parts A/B/C 2018, 105, 25–31. [Google Scholar] [CrossRef]
- Fumière, Q.; Déqué, M.; Nuissier, O.; Somot, S.; Alias, A.; Caillaud, C.; Seity, Y. Extreme rainfall in Mediterranean France during the fall: Added value of the CNRM-AROME Convection-Permitting Regional Climate Model. Clim. Dyn. 2020, 55, 77–91. [Google Scholar] [CrossRef] [Green Version]
- Creese, A.; Washington, R. A process-based assessment of CMIP5 rainfall in the Congo Basin: The September–November rainy season. J. Clim. 2018, 31, 7417–7439. [Google Scholar] [CrossRef]
- Dong, Y.; Armour, K.C.; Proistosescu, C.; Andrews, T.; Battisti, D.S.; Forster, P.M.; Shiogama, H. Biased estimates of equilibrium climate sensitivity and transient climate response derived from historical CMIP6 simulations. Geophys. Res. Lett. 2021, 48, e2021GL095778. [Google Scholar] [CrossRef]
- Sepulchre, P.; Caubel, A.; Ladant, J.B.; Bopp, L.; Boucher, O.; Braconnot, P.; Brockmann, P.; Cozic, A.; Donnadieu, Y.; Dufresne, J.L.; et al. IPSL-cM5A2-an Earth system model designed for multi-millennial climate simulations. Geosci. Model Dev. 2020, 13, 3011–3053. [Google Scholar] [CrossRef]
- Goyal, T. Traffic Data Analysis Using Automatic Traffic Counter-Cum-Classifier. Indian J. Sci. Technol. 2016, 9, 1–4. [Google Scholar] [CrossRef]
- Puan, O.C.; Nor, N.S.M.; Mashros, N.; Hainin, M.R. Applicability of an automatic pneumatic–tube–based traffic counting device for collecting data under mixed traffic. Earth Environ. Sci. 2019, 365, 012032. [Google Scholar] [CrossRef]
- José Manuel, V.; Paola carolina, B. Chapter Two—Sustainability Assessment of Transport Policies, Plans and Projects; Mouter, N., Ed.; Advances in Transport Policy and Planning; Academic Press: cambridge, MA, USA, 2021; Volume 7, pp. 9–50. [Google Scholar]
- Ibrahim, G.R.F.; Rasul, A.; Ali Hamid, A.; Ali, Z.F.; Dewana, A.A. Suitable site selection for rainwater harvesting and storage case study using Dohuk Governorate. Water 2019, 11, 864. [Google Scholar] [CrossRef] [Green Version]
- John, P.; Bahram, G.; Ramesh, R. Reference time of concentration estimation for ungauged catchments. Earth Sci. Res. 2018, 7, 58–73. [Google Scholar]
- Kirpich, Z.P. Time of concentration of small agricultural watersheds. J. Civ. Eng. 1940, 10, 362. [Google Scholar]
- Gale, I. Strategies for Managed Aquifer Recharge (MAR) in Semi-arid Areas. 2005. UNESCO, IHP/2005/GW/MAR 30p. Available online: https://unesdoc.unesco.org/ark:/48223/pf0000143819 (accessed on 15 June 2022).
- Wang, Y.; Luo, J. Study of Rainfall Impacts on Freeway Traffic Flow characteristics. World conference on Transport Research—WCTR 2016 Shanghai. Transp. Res. Procedia 2017, 25, 1533–1543. [Google Scholar]
- Aksoy, G.; Öğüt, K.S. Discharge flow rate change under rainy conditions on Urban Motorways. Promet—Traffic Transp. 2018, 30, 733–744. [Google Scholar] [CrossRef]
- Jian, L.; William, H.K.L.; AScE, M.; Xingang, L. Modeling the effects of rainfall intensity on the heteroscedastic traffic speed dispersion on urban Roads. J. Transp. Eng. 2016, 142, 05016002. [Google Scholar] [CrossRef]
- Ong, G.P.; Fwa, T.F. Hydroplaning risk management for grooved pavements. In Proceedings of the 7th International Conference on Managing Pavement Assets, calgary, AB, canada, 23–28 June 2008. [Google Scholar]
- Galatioto, F.; Glenis, V.; Roberts, R.; Kilsby, C. Exploring and modelling the impacts of rainfall and flooding on transport network. The case study of Newcastle upon Tyne. In Proceedings of the 2nd International Conference on Urban Sustainability and Resilience (USAR 2014), London, UK, 5–7 September 2014. [Google Scholar]
- YouTube. Video: UK Flood Observation, Perth. 2012. Available online: https://www.youtube.com/watch?v=tcqEARMI-_k (accessed on 22 June 2022).
- Salameh, E.; Abdallat, G.; Van der Valk, M. Planning considerations of managed aquifer recharge (MAR) projects in Jordan. Water 2019, 11, 182. [Google Scholar] [CrossRef] [Green Version]
- Malczewski, J.; Rinner, C. Multicriteria Decision Analysis in Geographic Information Science; Springer: Berlin, Germany, 2018; 331p. [Google Scholar] [CrossRef]


| Name | CO2 Equivalent (ppm) | Temperature Anomaly (°C) | Radiative Forcing | Pathway |
|---|---|---|---|---|
| RCP 4.5 | 650 | 2.4 | 4.5 Wm−2 post 2100 | Stabilization without overshoot |
| RCP 8.5 | 1370 | 4.9 | 8.5 Wm−2 in 2100 | Rising |
| Model | Model Institution | Resolution | Reference |
|---|---|---|---|
| CMCC-CMS | Centro Euro-Mediterraneo per I Cambiamenti Climatici, Italy | 1.9° × 1.9° | [29] |
| ACCESS1-0 | Commonwealth Scientific and Industrial Research Organization/Bureau of Meteorology, Australia | 1.9° × 1.3° | [30] |
| CCSM4 | National Center for Atmospheric Research | 0.9° × 1.25° | [31] |
| CNRM-CM5 | Centre National de Recherches Meteorologiques | 1.4° × 1.4° | [32] |
| CSIRO-Mk3 | Australian Commonwealth Scientific and Industrial Research Organization | 1.9° × 1.9° | [33] |
| CanESM2 | Canadian Centre for Climate Modeling and Analysis | 2.8° × 2.8° | [34] |
| GFDL-CM3 | Geophysical Fluid Dynamics Laboratory | 2.5° × 2° | [35] |
| HadGEM2-CC | Met Office Hadley Centre, UK | 1.9° × 1.3° | [36] |
| HadGEM2-ES | Met Office Hadley Centre, UK | 1.9° × 1.3° | [37] |
| IPSL-CM5A-LR | Institute Pierre-Simon Laplace, France | 3.8° × 1.9° | [38] |
| Condition | Traffic Count (Vehicles) | Average Volume (veh/h) | Capacity (pce) | Mean Speed (km/hr) | Free Flow Speed (km/hr) | Change in Speed (%) with Respect to Dry Condition |
|---|---|---|---|---|---|---|
| Dry condition | 7430 | 630 | 1375 | 65 | 70 | - |
| Wet condition | 4670 | 657 | 1230 | 45 | 55 | 30.8 |
| Time Period | Morning Peak | Evening Peak | Off-Peak | |||
|---|---|---|---|---|---|---|
| Weather condition | Heavy rain | Dry condition | Heavy rain | Dry condition | Heavy rain | Dry condition |
| Average speed (km/h) | 30 | 50 | 34 | 55 | 50 | 70 |
| Volume per hour (veh/h) | 1002 | 3425 | 1350 | 4220 | 900 | 2225 |
| Scenario | Year | Rainfall Depth (mm/day) | Speed (km/h) | ||||||||
|---|---|---|---|---|---|---|---|---|---|---|---|
| Jan. | Feb. | Mar. | Nov. | Dec. | Jan. | Feb. | Mar. | Nov. | Dec. | ||
| Current | 2020 | 50 | 55 | 10 | 19 | 30 | 68 | 63 | 123 | 108 | 91 |
| RCP 4.50 | 2040 | 90 | 88 | 12 | 24 | 49 | 37 | 38 | 120 | 100 | 69 |
| 2060 | 102 | 100 | 12.2 | 29 | 88 | 31 | 32 | 119 | 93 | 38 | |
| 2080 | 104 | 102 | 10 | 25 | 90 | 30 | 31 | 123 | 98 | 37 | |
| 2100 | 110 | 100 | 11 | 28 | 99 | 27 | 32 | 121 | 94 | 32 | |
| RCP 8.50 | 2040 | 90 | 88 | 12 | 24 | 49.8 | 37 | 38 | 120 | 100 | 68 |
| 2060 | 103 | 101 | 13 | 30 | 89 | 31 | 31 | 118 | 91 | 38 | |
| 2080 | 105 | 102 | 10 | 26 | 91 | 30 | 31 | 123 | 97 | 37 | |
| 2100 | 110 | 100 | 11 | 26 | 99 | 27 | 32 | 121 | 97 | 32 | |
Publisher’s Note: MDPI stays neutral with regard to jurisdictional claims in published maps and institutional affiliations. |
© 2022 by the authors. Licensee MDPI, Basel, Switzerland. This article is an open access article distributed under the terms and conditions of the Creative Commons Attribution (CC BY) license (https://creativecommons.org/licenses/by/4.0/).
Share and Cite
Gabr, M.E.; El Shorbagy, A.M.; Faheem, H.B. Utilizing the Harvesting of Rainwater to Provide Safe Road Transportation Efficiency and Increase Water Resources in the Context of Climatic Change. Sustainability 2022, 14, 9656. https://doi.org/10.3390/su14159656
Gabr ME, El Shorbagy AM, Faheem HB. Utilizing the Harvesting of Rainwater to Provide Safe Road Transportation Efficiency and Increase Water Resources in the Context of Climatic Change. Sustainability. 2022; 14(15):9656. https://doi.org/10.3390/su14159656
Chicago/Turabian StyleGabr, Mohamed Elsayed, Amira Mahmoud El Shorbagy, and Hamdy Badee Faheem. 2022. "Utilizing the Harvesting of Rainwater to Provide Safe Road Transportation Efficiency and Increase Water Resources in the Context of Climatic Change" Sustainability 14, no. 15: 9656. https://doi.org/10.3390/su14159656
APA StyleGabr, M. E., El Shorbagy, A. M., & Faheem, H. B. (2022). Utilizing the Harvesting of Rainwater to Provide Safe Road Transportation Efficiency and Increase Water Resources in the Context of Climatic Change. Sustainability, 14(15), 9656. https://doi.org/10.3390/su14159656