Article

Eco-Innovation and Firm Performance: Evidence from South America

by
Holger Raúl Barriga Medina
1,*,
Ruben Guevara
2,
Ronald Enrique Campoverde
1 and
Milton Ismael Paredes-Aguirre
1
1
Escuela Superior Politécnica del Litoral, ESPOL, Facultad de Ciencias Sociales y Humanísticas, Campus Gustavo Galindo, Km. 30.5 Vía Perimetral, Guayaquil P.O. Box 09-01-5863, Ecuador
2
CENTRUM Católica Graduate Business School, Pontificia Universidad Católica del Perú, Lima 15088, Peru
*
Author to whom correspondence should be addressed.
Sustainability 2022, 14(15), 9579; https://doi.org/10.3390/su14159579
Submission received: 7 July 2022 / Revised: 22 July 2022 / Accepted: 29 July 2022 / Published: 4 August 2022
(This article belongs to the Section Sustainable Management)

Abstract

:
Eco-innovation has received a great deal of attention in academia and the business sector because it promotes a firm’s sustainable development and seeks to improve its performance. The prime objective of this study was to analyze the effect of the process, organization, and product eco-innovation on the company’s financial and environmental performance. Using a structural equation model estimated by maximum likelihood and a sample from 214 South American manufacturing companies in Colombia, Ecuador, and Perú, we found that organizational eco-innovation (OE) and process eco-innovation (PCE) are positively and significantly associated with the firm’s environmental and financial performance. In contrast, product eco-innovation (PDE) is not significantly associated with the two types of performance described. Likewise, OE has a significant and positive indirect influence on PDE, environmental performance, and financial performance. These findings suggest that OE and PCE positively affect the firm’s performance. On the contrary, PDE does not have this effect, extending the discussion that eco-innovation is specific to the context of the study.

1. Introduction

In a context where pollution, environmental degradation, and resource scarcity have generated a global ecological crisis, firms seek various ways to obtain competitive advantages to improve their performance [1]. From the viewpoint of sustainability, ecological innovation, or eco-innovation, can be an appropriate strategy and a contribution to the sustainable development of firms, while also contributing to the improvement of their performance. Firms then must adopt organizational, process, and product eco-innovation practices to operate in a sustainable and environmentally friendly manner [2]. According to Kemp and Pearson [3], eco-innovation is defined as “the production, assimilation or exploitation of a product, production process, service or management or business method that is novel for the organization (developing or adopting it) and that through the life cycle results in a reduction of environmental risk, pollution and other negative impacts of the use of resources (including the use of energy) compared to other relevant alternatives” (p. 7).
While eco-innovation is a relatively new field of research, the first type of study addressed the influence of eco-innovation on performance, considering the firm’s external factors [4,5,6]. A second type of study looked at this relationship, taking into account external and internal aspects of the firm [7,8,9], while a third type of study analyzed this relationship by examining only internal factors of the firm [10,11,12]. Bossle et al. [13] suggested that eco-innovation could be studied according to a holistic approach of eco-innovation and the internal factors of the firm. Following the Oslo Manual on innovation of the Organization for Economic Co-operation and Development [14] and the document on eco-innovation in industry [15], a comprehensive vision based on internal factors of the firm includes the eco-innovation of: (a) process, (b) product, (c) marketing, and (d) organization.
The influence of eco-innovation on the firm’s performance has been studied in certain countries and contexts, such as Western and Southern European countries, as presented by Bocken et al. [16], and more recently, in countries of the Far East such as India, China, South Korea, and Malaysia, as in the research of Lin et al. [17]. However, no previous studies have been found to carry out this analysis in countries with emerging economies in South America. Based on the earlier works reviewed, the influence of eco-innovation on the firm’s performance has been studied, considering mainly financial performance and, to a lesser extent, environmental performance.
Regarding the influence of eco-innovation on the firm’s financial performance, prior studies found mixed results. Some studies showed a positive influence of eco-innovation on the firm’s financial performance [18,19], whereas other studies found that only specific categories of eco-innovation have a positive influence on financial performance [20]. However, some studies, such as the one by Ryszko [21], reported that eco-innovation has no effect on the firm’s financial performance. Concerning the influence of eco-innovation on the firm’s environmental performance, prior studies empirically demonstrated that process and product eco-innovation positively influence environmental performance [1,22]. Nevertheless, there is little evidence in the literature regarding the effect of OE on environmental performance. Chiou et al. [23] found that managerial eco-innovation, a form of OE, has no positive influence on firm’s environmental performance. These mixed results demonstrate that while there has been progress in the study of this relationship, there is still no empirical consensus between different authors.
Furthermore, according to Díaz-García et al. [24], more studies concerning eco-innovation in developing countries and in newly industrialized countries must be done. Similarly, Kemp and Oltra [25] have indicated that eco-innovation is context-specific and should therefore be carried out by researchers who better understand the context and social processes in which eco-innovation is inserted. Hence, the main purpose of this research was to empirically explain the influence that organization, process, and product eco-innovation have on the firm´s environmental and financial performance. In this sense, this study contributes to the existing literature on eco-innovation in three ways. First, we propose an integrated a theoretical model to simultaneously evaluate the impact of OE, PCE, and PDE on the firm´s environmental and financial performance. Second, this study evaluates the direct and indirect effects of OE on the two types of firm performance. Third, this work analyzes this relationship in South American countries with emerging economies.
The rest of this paper is structured as follows. Section 2 describes the theoretical framework and hypotheses development. Section 3 describes the material and methods, discussing how the data was collected and analyzed. Section 4 presents the data analysis and results. Finally, Section 5 and 6 highlight the discussion and conclusions respectively, along with the research limitations and perspectives.

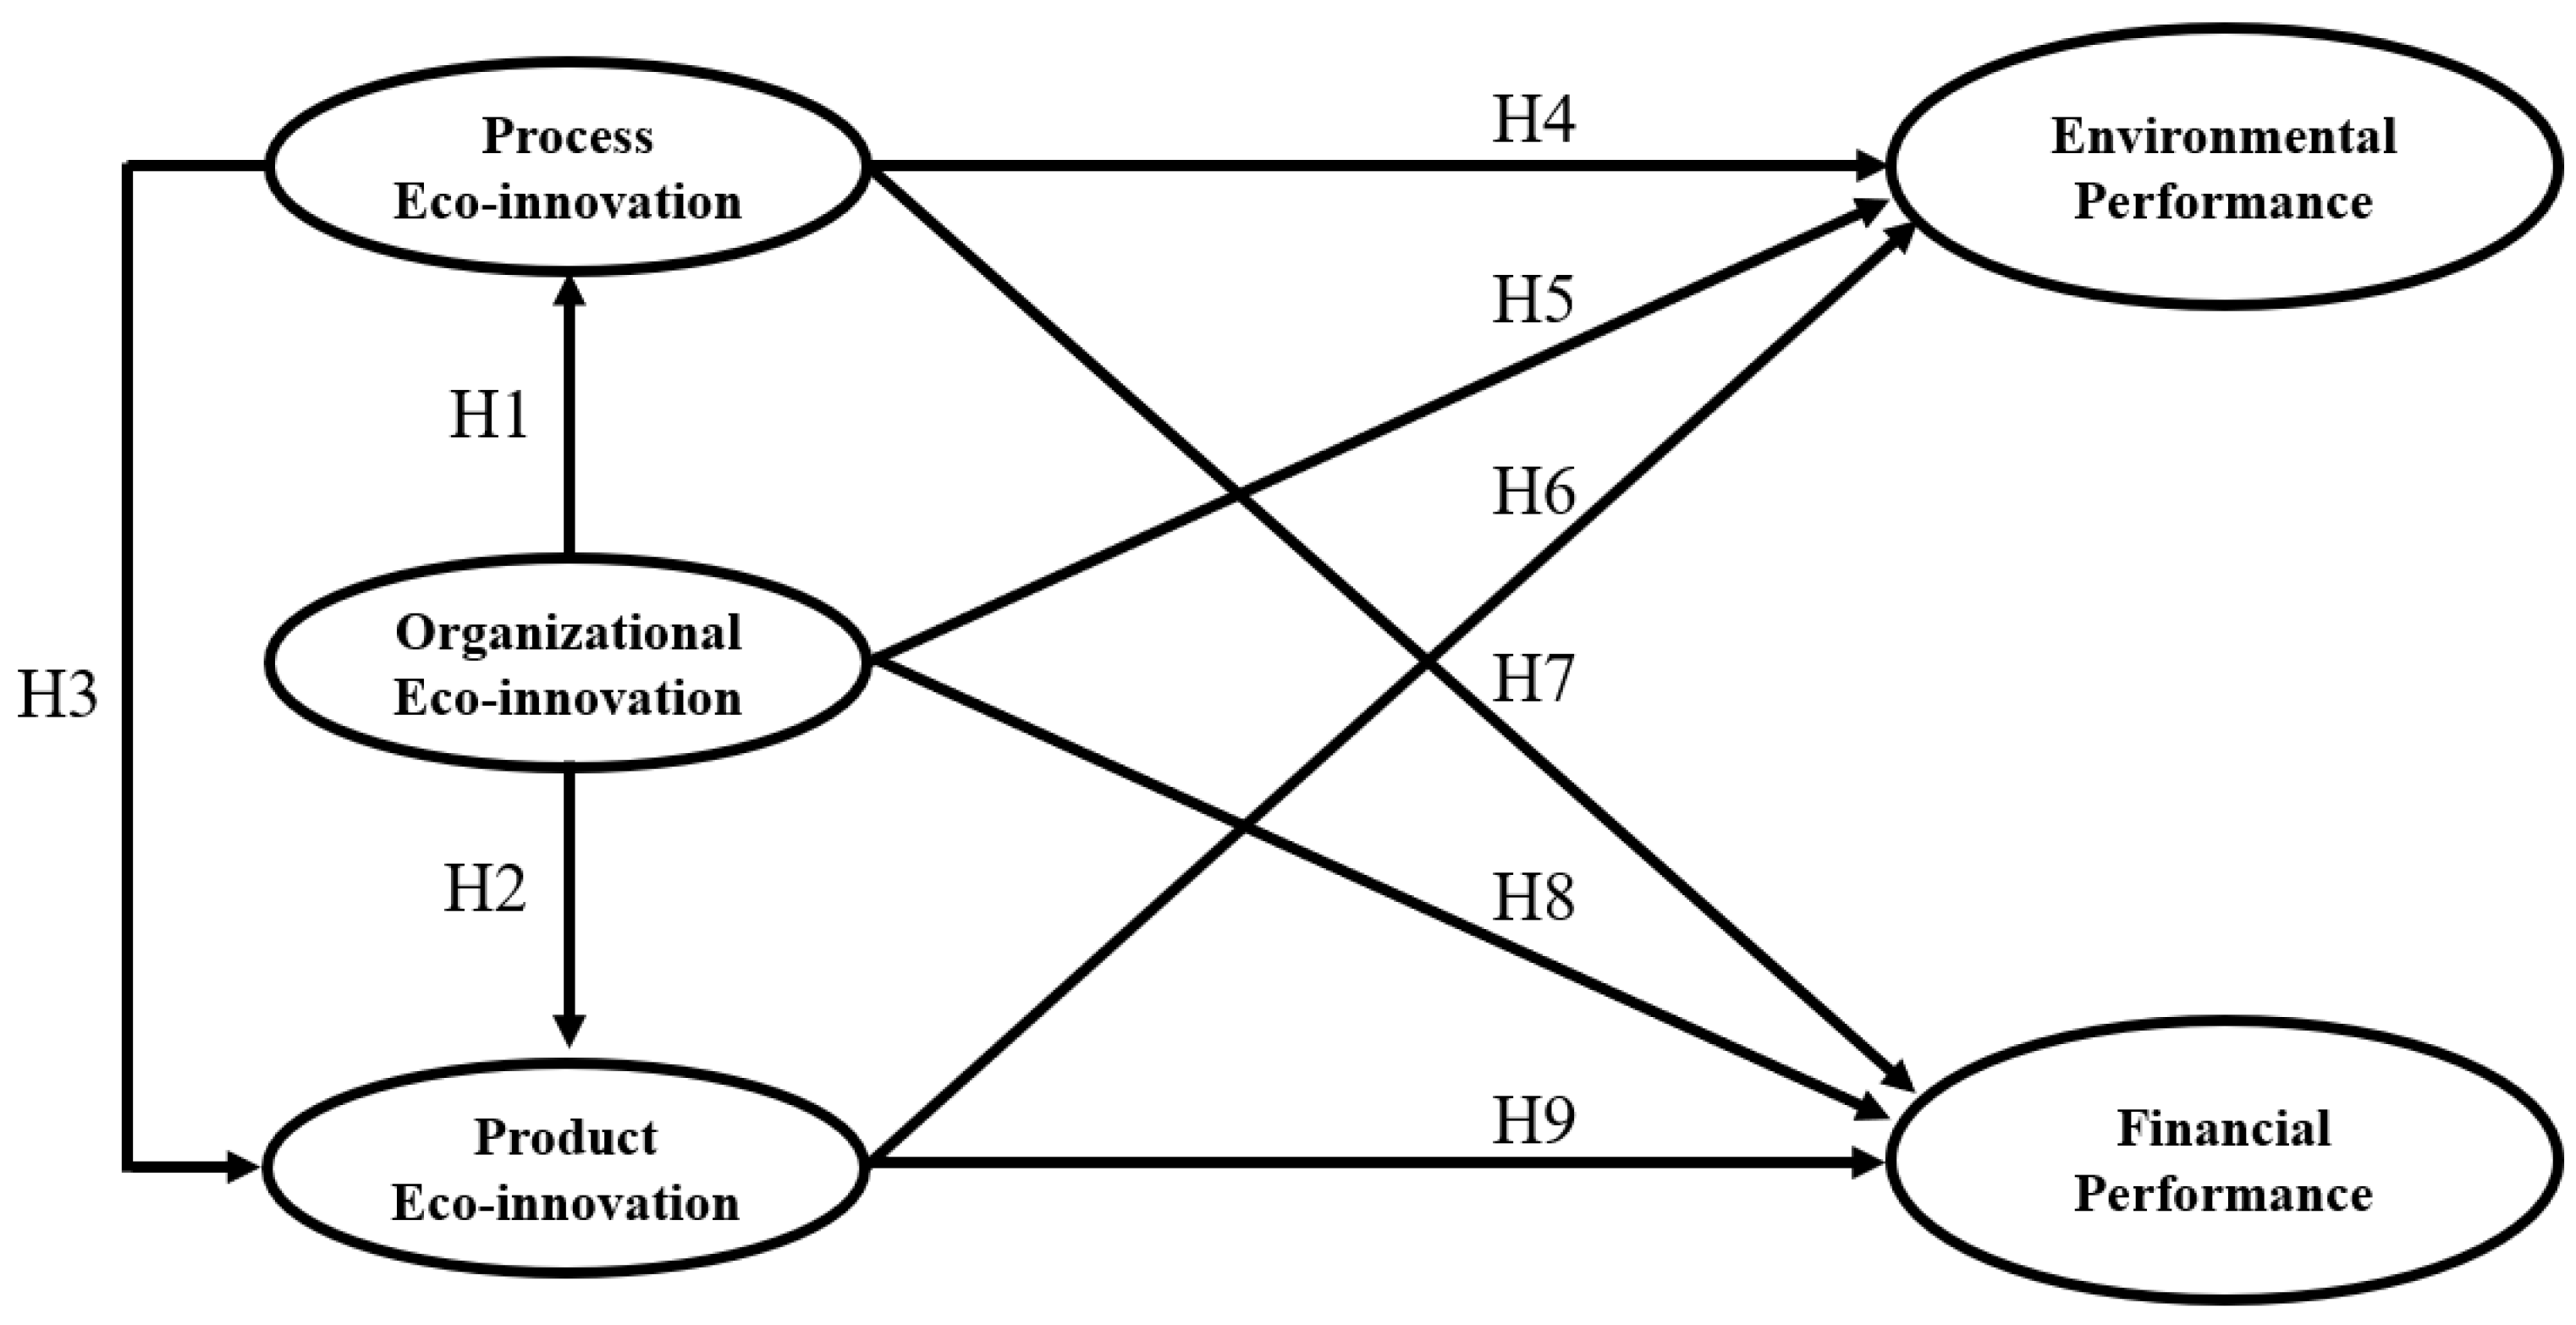
2. Theoretical Framework and Hypotheses Development

To assess the relationship between eco-innovation and the performance of firms, this study used the NRBV proposed by Hart [26], which is an extension of the resource-based view (RBV) theory proposed by Wernerfelt [27]. According to Barney [28], firms may be heterogeneous in terms of the strategic resources they control. Teece et al. [29] defined firm resources as firm-specific assets that are difficult to imitate, and due to their characteristics, these assets are difficult to transfer among companies because of transaction and transfer costs, and because they may contain tacit knowledge. The NRBV suggests that companies achieve sustainable competitive advantage with strategic resources that are rare, valuable, inimitable, and non-substitutable, as well as specific to each firm [30]. If the resources have these attributes, they can generate a competitive advantage to the firms for a long period of time, hence, improving their performance [28]. Since the 1980s, RBV has provided a powerful theoretical framework to understand the role of resources in supporting innovation processes and in creating competitive advantages for a company [31].
Barney et al. [32], using NRBV, cited the work developed by Hart and Dowell [33] that highlights the relationships among environmental strategies, the development of green capabilities, and competitive advantage. They mention that green capabilities are how the company can deploy its resources to achieve a sustainable competitive advantage based on the simultaneous management of the environmental aspects. Along these lines, OE, PCE, and PDE may be considered specific and unique green capabilities that are deployed using valuable company resources to accomplish a competitive advantage and better performance.
According to Damanpour et al. [34], administrative innovation leads to technological innovation. Damanpour et al. [35] found that organizational innovation that leads to organizational renewal is a buffer factor for other types of innovation. Based on this idea, OE can be a catalyst for the implementation of a favorable environment that enables the development of PCE and PDE [19]. De Oliveira Brasil et al. [20] found a positive effect of OE on PCE and PDE in Brazil. Following this finding, then we propose the following hypotheses for this study:
H1. 
Organizational eco-innovation positively influences the firm’s process eco-innovation.
H2. 
Organizational eco-innovation positively influences the firm’s product eco-innovation.
In regard to the association of PCE and PDE, the literature contains opposing results. Chiou et al. [23] argued that if the focus of innovation was on the product, then PDE is an important driver of PCE. In contrast, other studies showed that PCE is an important driver of PDE [36,37]. However, by using advanced technologies and production techniques, PCE improves the ability to add new or better features to products [19]. Based on this, the present study considered PCE to be a driving force of PDE. Using this finding, we propose the following hypothesis:
H3. 
Process eco-innovation has a positive association on the firm’s product eco-innovation.
Otherwise, according to Peng and Liu [38] PCE and PDE can make a considerable influence to environmental performance in the long term. Several prior studies empirically demonstrated that PCE and PDE positively influence on firm’s environmental performance [1,22,23]. At the same time, there is little evidence in the literature concerning the relationship between OE and the environmental performance of firms. Since OE is a catalyst for the development of process and product eco-innovation, and knowing that these two types of eco-innovation influence the firm’s environmental performance, we investigate the following hypotheses:
H4. 
Process eco-innovation has a positive influence on the firm’s environmental performance.
H5. 
Organizational eco-innovation has a positive influence on the firm’s environmental performance.
H6. 
Product eco-innovation has a positive influence on the firm’s environmental performance.
Several studies assessed a positive relationship between eco-innovation and the financial performance of the firms. For instance, Chan et al. [4] empirically demonstrated that PDE is positively related to the firm’s financial performance. Likewise, Hojnik and Ruzzier [39] found a positive effect of PCE on the financial performance of firms, while Weng et al. [8] found that process and product eco-innovation had a positive association on the firm’s financial performance. Finally, other studies found a positive influence of OE on the financial performance of firms [19,20,40]. Thus, we propose the following hypotheses:
H7. 
Process eco-innovation has a positive effect on the firm’s financial performance.
H8. 
Organizational eco-innovation has a positive effect on the firm’s financial performance.
H9. 
Product eco-innovation has a positive effect on the firm’s financial performance.
The proposed conceptual model for this research has been adapted from the model proposed by Cheng et al. [19] and is shown in Figure 1.

3. Material and Methods

3.1. Data Collection

The data for this study was collected using a survey of 214 randomly-chosen manufacturing companies in Colombia, Ecuador, and Peru. These three countries offer an appropriate South American context for this study, since the manufacturing sector is one of the main contributors to the gross domestic product of each country [41]. This sector, which is among those that use the most natural resources, also generates a greater environmental impact, according to OECD [15]. Respondents were managers or directors of environmental management, innovation, R&D, production, marketing, and general administration. The research instrument was pre-tested for validity in two stages. First, an official foreign language expert translated the tool from English to Spanish and four experts with experience and knowledge in the field of research proofread it. Based on the feedback of the experts, we made slight modifications to the original questionnaire, and three managers of environmental management in manufacturing firms reviewed the questionnaire and commented on clarity, possible ambiguities, legibility, and structure. Second, we conducted a pilot test by surveying 27 professionals with management positions in different manufacturing companies who were studying for a master’s degree in industrial eco-efficiency at an Ecuadorian university. In this pilot test, the managers surveyed made no suggestions for changes after reading the questionnaire carefully, so it was used to collect the data. We use a stratified random sample with substitution, because some companies included in the random sample did not want to participate in the study.
We contacted a total of 1522 firms, of which 416 agreed to participate in the research. An invitation letter describing the importance, purpose, and confidentiality of the study was sent by email to the firms that agreed to be part of the study. The companies were also asked for contact information for the manager or director with experience and knowledge on the subject, and a link to the online survey was sent to this person. Only fully answered questionnaires were used, resulting in a final response rate of 14.1%, with 214 companies comprehensively responding to the survey. We performed the statistical analysis of the data and estimated a structural equation model (SEM) by maximum likelihood using the Amos 21 statistical software.

3.2. Characteristics of the Sample

The sample used consisted of medium and large manufacturing companies from the private sector that had an environmental management department, an environmental license, or an ISO 14001 environmental management certification, and that had organizational, process, and product eco-innovation practices. We use Ecuadorian legislation as a reference to classify the companies. The legislation defines a medium-sized company as one that has between 50 and 199 employees, or annual revenue between USD 1-5 million; and large companies as those with more than 199 employees or annual revenues exceeding USD 5 million. Additional characteristics of the sample are reported in Table 1.

3.3. Measurement of the Variables

Five latent variables were included: (a) process eco-innovation, (b) organizational eco-innovation, (c) product eco-innovation, (d) environmental performance, and (e) financial performance. The questionnaire used had six sections. Section 1 collected information on the characteristics of the sample (see Table 1), Section 2 included the EO items, Section 3 included PCE items, Section 4 had PDE items, Section 5 included environmental performance items, and Section 6 included financial performance items. The measurement items for each variable are shown in Table 2. The validity and reliability of the measurements used in the present study were supported by an extensive review of the literature, interviews with experts, and by the pilot test (as reported in Section 3.1). We collected data using Likert scales. The managers of the firms were asked to answer the questionnaire using a 5-point Likert scale, from 1 = “Strongly disagree” to 5 = “Strongly agree.”
Three items were used to measure PCE, four items to measure OE, and four items to measure PDE. To measure the three eco-innovation variables, we adapted the Peng and Liu [38] instrument, which was refined from the tool originally developed by Cheng and Shiu [40] and subsequently used by Cheng et al. [19]. For environmental performance, we used six items adapted from the tool developed by Zhu and Sarkis [42]. Finally, four items were used to measure financial performance by adapting the tool developed by Im and Workman [43].

3.4. Evaluation of Common Method and Non-Response Bias

Since surveys were used with a cross-cutting design and the observation unit was a single manager of each company, the same source of information provided the measurements for independent and dependent variables. Thus, according to Podsakoff et al. [44], a potential for common method bias could be assessed, since the measurements share the variance of the method. To deal with the common method bias, two mechanisms were: (a) the proximal separation between the independent variable and the dependent variables, and (b) the Hartman single factor approach. Regarding the proximal distance, the OE independent variable was placed in Section 2 of the questionnaire, the environmental performance dependent variable in Section 5, and the financial performance variable in Section 6. As for the Hartman factor, the common method bias is severe if all the elements involved in the model of measurement load on a single factor, because the proportion of the variance explained by the method is high [45]. Thus, we carried a factor analysis of the principal components not rotated in SPSS, and the findings showed no factor that represents a majority of the variance [46]. The first factor captures only 46.32% of the variance, which suggests a low risk of common method bias. In any case, this is a limitation of the study.
Regarding the possibility that those participants who agreed to answer the survey were different from those who did not answer it, an evaluation of the non-response bias was performed following the procedure suggested by Armstrong and Overton [47]. Through an ANOVA analysis using the SPSS software, the means of all the variables’ observable items were compared within the group of managers who answered first and the group of managers who answered at the end. The comparisons of pairs of means between the items do not show significant differences, with a 0.05 significance level, suggesting that the bias by non-response does not occur.

3.5. Analysis of Validity and Reliability

The measurement items and latent variables, the items’ standardized loadings, composite reliability, and the average variance extracted are shown in Table 2. The construct validity was assessed by confirmatory factor analysis (CFA) using Amos 21. We obtained the final model of measurement from the use of the modification indices provided by the Amos 21 software and the analysis of the covariance matrix of the standardized residuals, as Jöreskog and Sörbom [48] suggest. According to these authors, a good fit of the model requires the values of the standardized residuals to be less than an absolute value of two. For the present study, item PCE3 of the process eco-innovation variable had a standardized residual of 3.1 with item PDE4 of product eco-innovation, of 2.91 with FP4, of 2.7 with FP1, of 2.58 with FP2, and 2.46 with FP3 of financial performance, and so it was discarded from the final model.
The significance of the item loadings and the model adjustment rates were verified again. The general fit of the model was assessed using multiple adjustment criteria. The goodness of fit indices of the structural model were: χ2 = 268.34, χ2/df = 1.71, GFI = 0.90, AGFI = 0.86, TLI = 0.96, CFI = 0.97, and RMSEA = 0.06. It can be concluded that the goodness of fit indices show a reasonable adjustment to the data and confirm a model from which the parameter estimates can be derived and interpreted reliably. In addition, it can be seen in Table 2 that all factor loadings are greater than 0.5, and that p-values are significant at a level of 0.05. On the other hand, the CR composite reliability of all constructs is greater than 0.7, and the average variance extracted (AVE) is greater than 0.5, so the convergent validity is assured according criteria proposed by Fornell and Larcker [49]. To verify the discriminant validity according to Hair et al. [50], a very rigorous test consists of comparing the values of the average variance extracted for two different constructs with the square of the estimate of the correlation between these two constructs. The average variance extracted that, according to the criteria of Fornell and Larcker [49], must be greater than 0.5 for each construct, must also be greater than the estimate of the squared correlation between two constructs.
Table 3 shows the diagonal matrix of the values of the square root of the AVE for each construct and, outside the diagonal, the correlation can be seen for the values between each pair of constructs provided by the software Amos 21. The diagonal elements of this matrix are larger than the correlations between each pair of constructs, thus providing evidence for the discriminant validity of each of constructs [48].

4. Data Analysis and Results

After examining the constructs’ validity and the goodness of fit of the measurement model, we evaluated the relationships between the latent variables of the structural model, and we tested proposed hypotheses.

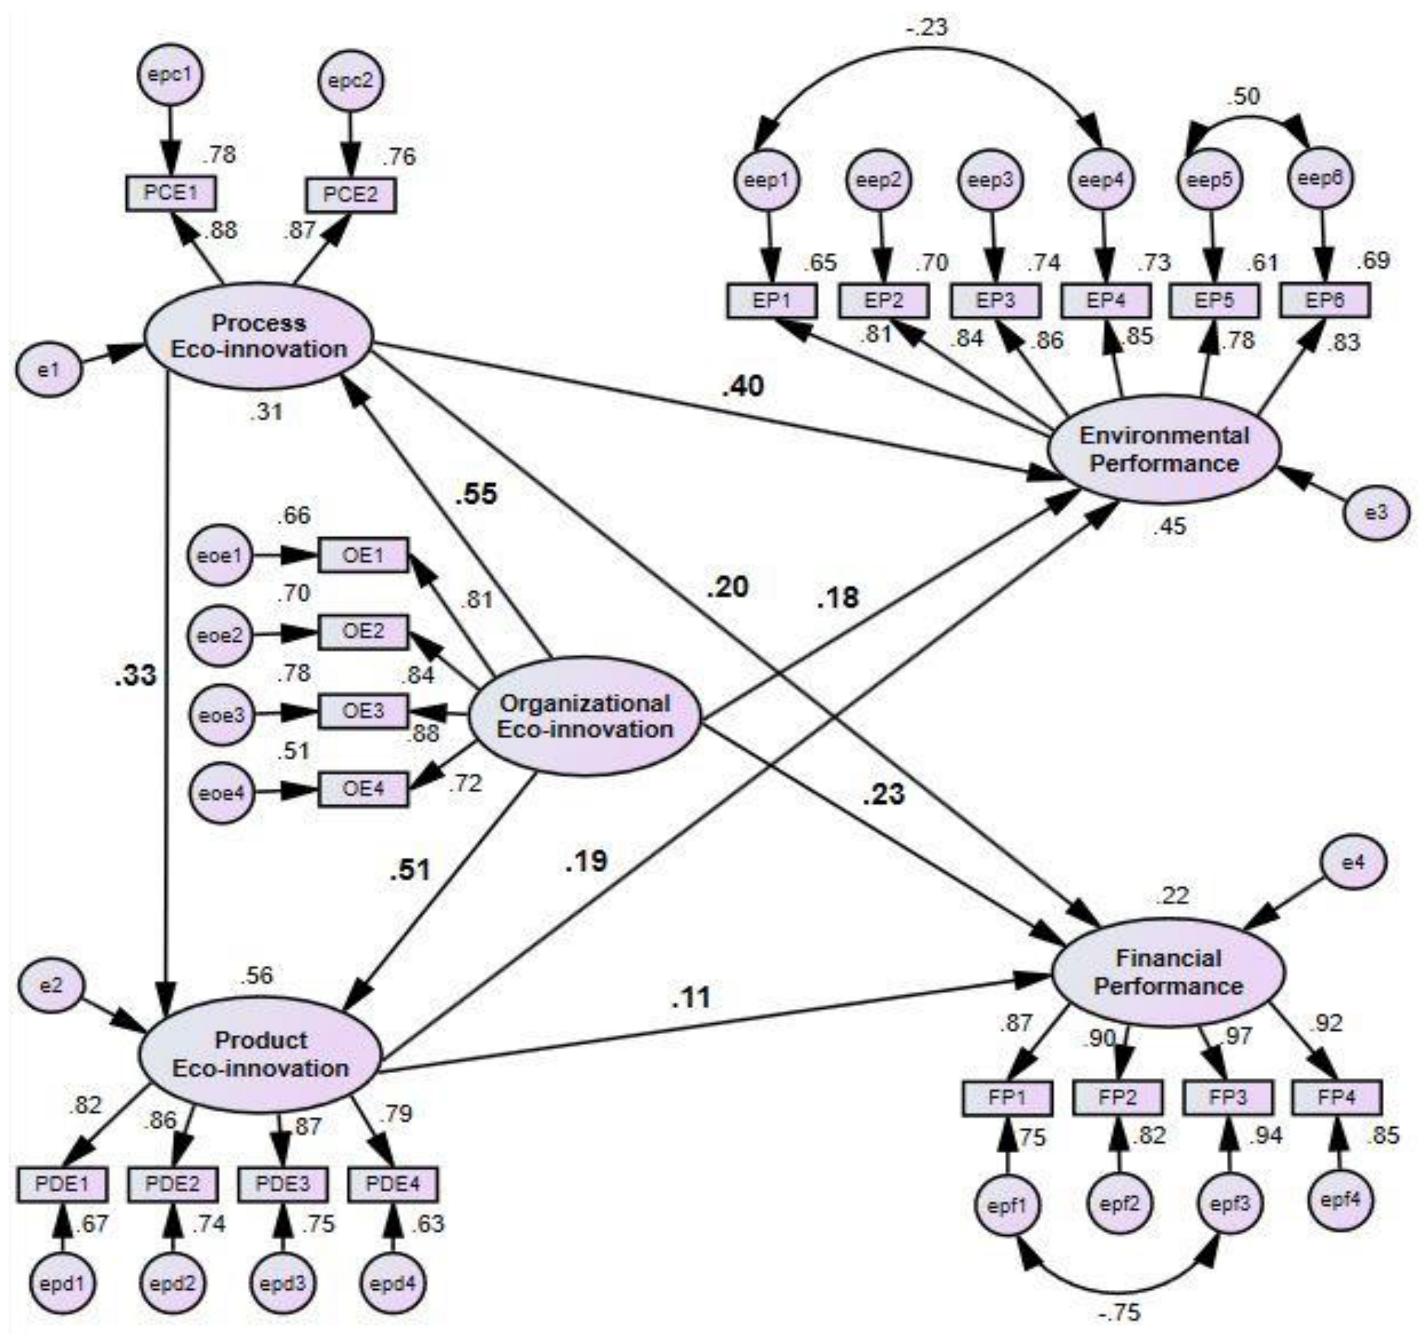
4.1. SEM Analysis and Test of Hypotheses

To assess the proposed hypotheses regarding the effect of eco-innovation on performance, we estimated a structural equation model (SEM). The SEM enables the simultaneous evaluation of a measurement model and the structural model [51].
The structural model defines the relationships between latent variables [52]. In addition, the SEM considers the measurement error in the evaluation of the variables and the relationships [53]. It thus permits the testing of complex hypotheses about the association between the observable items and latent variables through the measurement model, as well as the relationship between latent variables through the structural model.
There are five latent variables in this study, and we used the SEM for hypothesis testing. The final model is shown in Figure 2. The goodness of fit indices of the structural model were: χ2 = 269.8, χ2/df = 1.71, GFI = 0.90, AGFI = 0.86, TLI = 0.96, CFI = 0.97, and RMSEA = 0.06, which show that the model has a good fit with the data and therefore, can be used to test the hypotheses.
Table 4 shows the standardized values of the path coefficients of the structural model and the p-values of the relationships between the latent variables and the situations in the research hypotheses. From the values shown in Table 4, the proposed research hypotheses can be supported. The sign, size, and significance of the model’s path coefficients represent the strengths of the relationships between the latent variables [54].
Of all the relationships between the latent variables, seven relationships are statistically significant, with a significance level of 0.05. The results of the statistical analysis show that hypotheses H1 (β = 0.55, p < 0.001); H2 (β = 0.51, p < 0.001); H3 (β = 0.35, p < 0.001); H4 (β = 0.40, p < 0.001); H5 (β = 0.18, p = 0.046); H7 (β = 0.20, p = 0.032); and H8 (β = 0.23, p = 0.022) were supported. Two relationships were not statistically significant: (a) the influence of PDE on environmental performance (β = 0.19, p = 0.052), and (b) the effect of PDE on financial performance (β = 0.11, p = 0.289); thus, hypotheses H6 and H9 were not supported.

4.2. Direct, Indirect, and Total Effects

According to the estimated values of the path coefficients of the structural model, PCE shows the strongest direct effect on environmental performance, while OE shows the strongest direct effect on financial performance. Despite having a weaker direct effect on environmental performance than PCE, OE shows a total effect that is greater than PCE. Likewise, OE has a total effect on PDE that is greater than its effect on PCE. The direct, indirect, and total effects of OE, PCE, and PDE on the firm’s financial and environmental performance are summarized in Table 5.

5. Discussion

The findings confirmed that organizational and process eco-innovation positively influences the firm’s environmental and financial performance. Therefore, these dimensions of eco-innovation play a crucial role in the performance of manufacturing companies in countries such as Colombia, Ecuador, and Perú. On the other hand, there are statistically significant relationships between OE and PCE, OE and PDE, and between PCE and PDE. However, PDE does not significantly influence the manufacturing companies’ environmental and financial performance.
These results agree almost entirely with the results of the model proposed by Cheng et al. [19], which was applied to 121 manufacturing companies in the electronics sector in Thailand. The findings also coincide, to a lesser extent, with the model proposed by de Oliveira Brasil et al. [20], which was applied to 70 textile-sector manufacturing companies in Brazil, and the model proposed by Larbi-Siaw et al. [9], which was used with 683 manufacturing firms in Ghana, as shown in Table 6. For example, the path coefficient of the structural model that expresses the influence of OE on PCE had a value of 0.59 in the study by Cheng et al. [19], of 0.75 in the study by de Oliveira Brasil et al. [20], and of 0.55 in the present study. The three studies support the hypothesis of the positive relationship between OE and PCE. It is relevant to mention that the original structural equation model proposed by Cheng et al. [19] was tested using the covariance-based method (CB-SEM) for maximum likelihood, while the model proposed by de Oliveira Brasil et al. [20] used the partial least squares method (PLS-SEM). In the present study, we used the covariance-based method (CB-SEM) for maximum likelihood. Despite the difference of the estimation methods for the parameters of the structural model, these results confirm that in the manufacturing companies of the study population, OE has a positive influence on PCE and PDE. Prior research, such as that by Cheng et al. [19], Chen and Shiu [40], and de Oliveira Brasil et al. [20], which were conducted using Taiwanese and Brazilian companies, respectively, showed the same results. This evidence suggests that the results for these relationships are independent of both the industrial sector and the context of the study. On the other hand, there is also a positive influence of OE and PCE on a manufacturing firm’s environmental and financial performance.
In the Brazilian context, de Oliveira Brasil et al. [20] did not obtain a significant influence of the PCE on the financial performance of the company; this result agrees with what Larbi-Siaw [9] found in the Ghanaian context. However, this result contrasts with the result obtained by Cheng et al. [19] and with what we found in this study. Although the construct used by the authors of [20] to measure financial performance is the same as that used in the present work, there is a slight difference in the number of items used to measure PCE. While de Oliveira Brasil et al. [20] used a first order reflective construct with six items, this work used a reflective construct with three items. This may explain the difference in the results, but a common taxonomy should be used to make the results perfectly comparable. Likewise, these authors conducted their research with a sample of 70 manufacturing companies in the Brazilian textile sector, while we used 214 companies from various industrial sectors in the present research. Another difference is that these authors performed the method of estimating the structural equation model using partial least squares (PLS-SEM), while the model of the present work was estimated using the covariance-based method (CB-SEM). Although the methodology used is appropriate for each study, the population of the study may be a possible explanation for the difference in the results.
According to the results of this research, PDE did not have a significant influence on financial performance, which is in line with Amores-Salvadó et al. [55] and Larbi-Siaw [9], but in contrast to the results obtained by Przychodzen and Przychodzen [56] and by de Oliveira Brasil et al. [20]. While the latter authors used a first-order reflective construct with ten items, the present investigation used a four-item reflective construct. Although the study’s context and the number of items of each construct may be factors that explain the substantial differences in the results, this evidence suggests that in a specific industrial sector, such as the textile sector in the Brazilian study, PDE is aimed at the product life cycle and generates a positive impact on the financial performance, while in the present study, this impact is not significant for manufacturing companies in a variety of industrial sectors.
The present study also confirmed that PCE positively influences the firm’s environmental performance. This evidence corroborates the findings of Weng et al. [8]. On the other hand, this research provides new evidence supporting that OE has a positive and significant effect on the firm’s environmental performance. This research, however, does not confirm that PDE has a substantial influence on environmental performance, which is in contrast to the findings of Chiou et al. [23] and Lin et al. [11]. The type of constructs used by these authors to measure PCE and environmental performance in their research conducted in Taiwan and China, respectively, differs from that used in the present study, which is a factor that may explain the divergence in the results.
The results of this research are essential for countries such as Colombia, Ecuador, and Perú, since the analysis of the direct, indirect, and total effects of each type of eco-innovation on a manufacturing firm’s environmental and financial performance provides helpful information for the development of eco-innovation programs.

6. Conclusions

Several conclusions were generated through the findings of this study. First, the results supported the research hypotheses H1, H2, H3, H4, H5, H7, and H8, but hypotheses H6 and H9 were not supported. Second, the results revealed that OE and PCE positively influence the firm’s financial performance. Along these same lines, this study empirically proved that OE directly and positively affects the firm´s environmental performance. Third, the total effect of OE on environmental performance is greater than the direct effect of PCE on this performance. Fourth, in contrast to the studies of Cheng et al. [19] and de Oliveira Brasil [20], there was no statistically significant impact of PDE on financial and environmental performance in this research. Fifth, this last result suggests that eco-innovation is context specific, as stated by Kemp and Oltra [25]; therefore, it is necessary to conduct more empirical and case studies in different countries, as proposed by Maçaneiro et al. [57].

6.1. Limitations, Strengths, and Future Research

The study has some limitations and strengths. Concerning the limitations, first, self-reported scales were used to measure the variables of interest, including subjective indicators for financial and environmental performances. Objective data, or a combination of subjective and objective data, could be used in the future to overcome common method bias. Second, the design was cross-sectional, so this approach does not permit the analysis of how specific dimensions of eco-innovation influence firm performance over time. Third, the present research has only studied the impact of three dimensions of eco-innovation (EO, PCE, and PDE) on the two dimensions of performance. A more comprehensive vision of eco-innovation must include the dimension of marketing eco-innovation [15].
Among its strengths, what stands out is that this study is one of the few, to our best knowledge, that addresses the influence of organizational eco-innovation on the firm’s financial and environmental performance. Second, the study uses a sample of medium and large manufacturing companies in all industrial sectors in Colombia, Ecuador, and Perú and evaluates them according to their economic capacity to develop green capabilities as eco-innovation. Third, this study validates the scales used to collect data in the South American context. Fourth, this work confirms a theoretical model for its application in developing countries, with three types of eco-innovation (OE, PCE, and PDE) and two kinds of performance (financial and environmental).
Future research should include the dimension of marketing eco-innovation in the theoretical model, achieving a more comprehensive vision of eco-innovation. In addition, future research could involve moderating variables that can influence the magnitude and significance of the relationship between eco-innovation and performance. Furthermore, future studies could replicate the proposed model in specific industrial sectors, such as food and beverages, plastics, textiles, machinery, etc., to determine the influence of each type of eco-innovation on the performance of each industrial sector. Similarly, qualitative research, such as the in-depth case study suggested by Maçaneiro et al. [57], is needed to deepen the knowledge of this area of research. Likewise, future studies, with a longitudinal design, are necessary to comprehend the evolution of this relationship over time. Finally, future research should consider the meso and macro levels of analysis to broaden the results, especially using public policy tools and regulations, as well as eco-innovation clusters.

6.2. Implications for Theory and Practice

These findings also offer several implications, both theoretical and practical. First, manufacturing company managers must understand the benefits of each type of eco-innovation in performance improvement. More than PDE, OE and PCE can directly help improve the firm’s environmental and financial performance. However, OE and PCE can contribute even more to performance due to their direct influence on PDE. As a result, manufacturing company managers should pay special attention to OE and PCE.
Second, the results of this study indicate that companies should implement OE practices that support the improvement of PCE and PDE. Although managers often think that OE has little impact on performance and are inclined to place more emphasis on PCE or PDE, this research suggests a paradigm shift. OE has a total influence on the firm’s environmental and financial performance that is greater than the influence of PCE and PDE. Therefore, if there is no investment in the management systems and procedures of OE, the implementation of PCE and PDE will not have the same effect.
Third, managers working on eco-innovation practice implementation should pay special attention to PDE, which focuses on the product life cycle. This may involve a closer collaboration with universities and research institutions so that the potential knowledge generated in these academic centers is transferred to the employees of the companies, and subsequently, the PDE is developed more rapidly.
Fourth, the findings of this research can guide public sector authorities in making decisions concerning sustainable and ecological industrial development policies, guidelines on the design of OE and PCE programs, and the management of effective environmental regulations in the three countries of the study, mainly in the case of micro and small companies, where the lack of resources—especially financial resources—hinders the development of eco-innovation [58].

Author Contributions

Conceptualization, R.E.C.; Formal analysis, M.I.P.-A.; Methodology, H.R.B.M.; Project administration, H.R.B.M.; Supervision, R.G.; Validation, H.R.B.M., R.E.C. and M.I.P.-A.; Writing—original draft, H.R.B.M.; Writing—review & editing, R.G. All authors have read and agreed to the published version of the manuscript.

Funding

This research corresponds to project CIEC-03-2018, developed by the Faculty of Social and Humanistic Sciences. It was funded by the Research Deanship of ESPOL.

Institutional Review Board Statement

The study was conducted in accordance with the Declaration of Helsinki, and approved by Faculty of Social and Humanistic Sciences (Approval code: CIEC-03-2018; Date: 1 January 2018).

Informed Consent Statement

Informed consent was obtained from all personas who participated in this research.

Data Availability Statement

The data presented in this study are available on request to the corresponding authors. The data are not publicly available due to privacy concerns.

Conflicts of Interest

The authors declare no conflict of interest.

References

  1. Cai, W.; Li, G. The drivers of eco-innovation and its impact on performance: Evidence from China. J. Clean. Prod. 2018, 176, 110–118. [Google Scholar] [CrossRef]
  2. Hojnik, J.; Ruzzier, M. What drives eco-innovation? A review of an emerging literature. Environ. Innov. Soc. Transit. 2015, 19, 31–41. [Google Scholar] [CrossRef]
  3. Kemp, R.; Pearson, P.P. Final Report MEI Project about Measuring Eco-Innovation; UM Merit: Maastricht, The Netherlands, 2007; Volume 10. [Google Scholar]
  4. Chan, H.K.; Yee, R.W.Y.; Dai, J.; Lim, M.K. The moderating effect of environmental dynamism on green product innovation and performance. Int. J. Prod. Econ. 2016, 181, 384–391. [Google Scholar] [CrossRef]
  5. Li, Y. Environmental innovation practices and performance: Moderating effect of resource commitment. J. Clean. Prod. 2014, 66, 450–458. [Google Scholar] [CrossRef]
  6. Bag, S.; Dhamija, P.; Bryde, D.J.; Singh, R.K. Effect of eco-innovation on green supply chain management, circular economy capability, and performance of small and medium enterprises. J. Bus. Res. 2022, 141, 60–72. [Google Scholar] [CrossRef]
  7. Cai, W.; Zhou, X. On the drivers of eco-innovation: Empirical evidence from China. J. Clean. Prod. 2014, 79, 239–248. [Google Scholar] [CrossRef]
  8. Weng, H.-H.; Chen, J.-S.; Chen, P.-C. Effects of Green Innovation on Environmental and Corporate Performance: A Stakeholder Perspective. Sustainability 2015, 7, 4997–5026. [Google Scholar] [CrossRef] [Green Version]
  9. Larbi-Siaw, O.; Xuhua, H.; Owusu, E.; Owusu-Agyeman, A.; Fulgence, B.E.; Frimpong, S.A. Eco-innovation, sustainable business performance and market turbulence moderation in emerging economies. Technol. Soc. 2022, 68, 101899. [Google Scholar] [CrossRef]
  10. Doran, J.; Ryan, G. The Importance of the Diverse Drivers and Types of Environmental Innovation for Firm Performance: Eco-Innovation Drivers and Firm Performance. Bus. Strategy Environ. 2016, 25, 102–119. [Google Scholar] [CrossRef]
  11. Lin, R.-J.; Tan, K.-H.; Geng, Y. Market demand, green product innovation, and firm performance: Evidence from Vietnam motorcycle industry. J. Clean. Prod. 2013, 40, 101–107. [Google Scholar] [CrossRef]
  12. Johl, S.K.; Toha, M.A. The Nexus between Proactive Eco-Innovation and Firm Financial Performance: A Circular Economy Perspective. Sustainability 2021, 13, 6253. [Google Scholar] [CrossRef]
  13. Bossle, M.B.; Dutra de Barcellos, M.; Vieira, L.M.; Sauvée, L. The drivers for adoption of eco-innovation. J. Clean. Prod. 2016, 113, 861–872. [Google Scholar] [CrossRef]
  14. OECD. Oslo Manual: Guidelines for Collecting and Interpreting Technological Innovation Data; Organisation for Economic Co-operation and Development: Paris, France; Statistical Office of the European Communities: Paris, France, 2005; ISBN 978-92-64-01310-0. [Google Scholar]
  15. OECD (Ed.). Eco-Innovation in Industry: Enabling Green Growth; OECD Innovation Strategy; OECD: Paris, France, 2009; ISBN 978-92-64-07722-5. [Google Scholar]
  16. Bocken, N.M.P.; Farracho, M.; Bosworth, R.; Kemp, R. The front-end of eco-innovation for eco-innovative small and medium sized companies. J. Eng. Technol. Manag. 2014, 31, 43–57. [Google Scholar] [CrossRef] [Green Version]
  17. Lin, H.; Zeng, S.X.; Ma, H.Y.; Qi, G.Y.; Tam, V.W.Y. Can political capital drive corporate green innovation? Lessons from China. J. Clean. Prod. 2014, 64, 63–72. [Google Scholar] [CrossRef]
  18. Ar, I.M. The Impact of Green Product Innovation on Firm Performance and Competitive Capability: The Moderating Role of Managerial Environmental Concern. Procedia—Soc. Behav. Sci. 2012, 62, 854–864. [Google Scholar] [CrossRef] [Green Version]
  19. Cheng, C.C.; Yang, C.; Sheu, C. The link between eco-innovation and business performance: A Taiwanese industry context. J. Clean. Prod. 2014, 64, 81–90. [Google Scholar] [CrossRef] [Green Version]
  20. de Oliveira Brasil, M.V.; Sá de Abreu, M.C.; da Silva Filho, J.C.L.; Leocádio, A.L. Relationship between eco-innovations and the impact on business performance: An empirical survey research on the Brazilian textile industry. Rev. Adm. 2016, 51, 276–287. [Google Scholar] [CrossRef] [Green Version]
  21. Ryszko, A. Proactive Environmental Strategy, Technological Eco-Innovation and Firm Performance—Case of Poland. Sustainability 2016, 8, 156. [Google Scholar] [CrossRef] [Green Version]
  22. Küçükoğlu, M.T.; Pinar, R.İ. Positive Influences of Green Innovation on Company Performance. Procedia—Soc. Behav. Sci. 2015, 195, 1232–1237. [Google Scholar] [CrossRef] [Green Version]
  23. Chiou, T.-Y.; Chan, H.K.; Lettice, F.; Chung, S.H. The influence of greening the suppliers and green innovation on environmental performance and competitive advantage in Taiwan. Transp. Res. Part E Logist. Transp. Rev. 2011, 47, 822–836. [Google Scholar] [CrossRef]
  24. Diaz-García, C.; Gonzalez-Moreno, A.; Saenz-Martinez, F.J. Eco-innovation: Insights from a literature review. Innov. Manag. Policy Pract. 2015, 17, 6–23. [Google Scholar] [CrossRef]
  25. Kemp, R.; Oltra, V. Research Insights and Challenges on Eco-Innovation Dynamics. Ind. Innov. 2011, 18, 249–253. [Google Scholar] [CrossRef]
  26. Hart, S. A Natural-Resource-Based View of the Firm. Acad. Manage. Rev. 1995, 20, 986–1014. [Google Scholar] [CrossRef] [Green Version]
  27. Wernerfelt, B. A Resource-Based View of the Firm. Strateg. Manag. J. 1984, 5, 171–180. [Google Scholar] [CrossRef]
  28. Barney Firm Resources and Sustained Competitive Advantage. J. Manag. 1991, 17, 99–120. [CrossRef]
  29. Teece, D.; Pisano, G.; Amy, S. Dynamic capabilities and strategic management. Strateg. Manag. J. 1997, 18, 509–533. [Google Scholar] [CrossRef]
  30. Makadok, R. Toward a synthesis of the resource-based and dynamic-capability views of rent creation. Strateg. Manag. J. 2001, 22, 387–401. [Google Scholar] [CrossRef]
  31. Cainelli, G.; De Marchi, V.; Grandinetti, R. Does the development of environmental innovation require different resources? Evidence from Spanish manufacturing firms. J. Clean. Prod. 2015, 94, 211–220. [Google Scholar] [CrossRef]
  32. Barney, J.B.; Ketchen, D.J.; Wright, M. The Future of Resource-Based Theory: Revitalization or Decline? J. Manag. 2011, 37, 1299–1315. [Google Scholar] [CrossRef]
  33. Hart, S.L.; Dowell, G. Invited Editorial: A Natural-Resource-Based View of the Firm: Fifteen Years After. J. Manag. 2011, 37, 1464–1479. [Google Scholar] [CrossRef]
  34. Damanpour, F.; Szabat, K.A.; Evan, W.M. The relationship between types of innovation and organizational performance. J. Manag. Stud. 1989, 26, 587–602. [Google Scholar] [CrossRef]
  35. Damanpour, F.; Walker, R.M.; Avellaneda, C.N. Combinative Effects of Innovation Types and Organizational Performance: A Longitudinal Study of Service Organizations. J. Manag. Stud. 2009, 46, 650–675. [Google Scholar] [CrossRef]
  36. Gunday, G.; Ulusoy, G.; Kilic, K.; Alpkan, L. Effects of innovation types on firm performance. Int. J. Prod. Econ. 2011, 133, 662–676. [Google Scholar] [CrossRef] [Green Version]
  37. Raymond, L.; St-Pierre, J. R&D as a determinant of innovation in manufacturing SMEs: An attempt at empirical clarification. Technovation 2010, 30, 48–56. [Google Scholar] [CrossRef]
  38. Peng, X.; Liu, Y. Behind eco-innovation: Managerial environmental awareness and external resource acquisition. J. Clean. Prod. 2016, 139, 347–360. [Google Scholar] [CrossRef]
  39. Hojnik, J.; Ruzzier, M. The driving forces of process eco-innovation and its impact on performance: Insights from Slovenia. J. Clean. Prod. 2016, 133, 812–825. [Google Scholar] [CrossRef]
  40. Cheng, C.C.; Shiu, E.C. Validation of a proposed instrument for measuring eco-innovation: An implementation perspective. Technovation 2012, 32, 329–344. [Google Scholar] [CrossRef]
  41. CEPAL. Bases de Datos y Publicaciones Estadísticas; CEPAL: Santiago, Chile, 2020. [Google Scholar]
  42. Zhu, Q.; Sarkis, J. Relationships between operational practices and performance among early adopters of green supply chain management practices in Chinese manufacturing enterprises. J. Oper. Manag. 2004, 22, 265–289. [Google Scholar] [CrossRef]
  43. Im, S.; Workman, J.P. Market Orientation, Creativity, and New Product Performance in High-Technology Firms. J. Mark. 2004, 68, 114–132. [Google Scholar] [CrossRef] [Green Version]
  44. Podsakoff, P.M.; MacKenzie, S.B.; Lee, J.-Y.; Podsakoff, N.P. Common method biases in behavioral research: A critical review of the literature and recommended remedies. J. Appl. Psychol. 2003, 88, 879–903. [Google Scholar] [CrossRef] [PubMed]
  45. Podsakoff, P.M.; Organ, D.W. Self-Reports in Organizational Research: Problems and Prospects. J. Manag. 1986, 12, 531–544. [Google Scholar] [CrossRef]
  46. Podsakoff, P.M.; Todor, W.D.; Grover, R.A.; Huber, V.L. Situational moderators of leader reward and punishment behaviors: Fact or fiction? Organ. Behav. Hum. Perform. 1984, 34, 21–63. [Google Scholar] [CrossRef]
  47. Armstrong, J.S.; Overton, T.S. Estimating Nonresponse Bias in Mail Surveys. J. Mark. Res. 1977, 14, 396. [Google Scholar] [CrossRef] [Green Version]
  48. Jöreskog, K.G.; Sörbom, D. LISREL 8: Structural Equation Modeling with the SIMPLIS Command Language; 4. Print. (With Foreword and Computer Exercises); Erlbaum: Hillsdale, NJ, USA, 1998; ISBN 978-0-89498-033-6. [Google Scholar]
  49. Fornell, C.; Larcker, D.F. Structural Equation Models with Unobservable Variables and Measurement Error: Algebra and Statistics. J. Mark. Res. 1981, 18, 382. [Google Scholar] [CrossRef]
  50. Hair, J.F.; Black, W.C.; Babin, B.J.; Anderson, R.E. Multivariate Data Analysis, 8th ed.; Cengage: Andover, UK, 2019; ISBN 978-1-4737-5654-0. [Google Scholar]
  51. Bartholomew, D.J. Analysis of Multivariate Social Science Data; CRC Press: Boca Raton, FL, USA, 2011; ISBN 978-1-58488-961-8. [Google Scholar]
  52. Byrne, B.M. Structural Equation Modeling with AMOS: Basic Concepts, Applications, and Programming, 2nd ed.; Multivariate Applications Series; Routledge: New York, NY, USA, 2010; ISBN 978-0-8058-6372-7. [Google Scholar]
  53. Hair, J.F. (Ed.) Multivariate Data Analysis, 7th ed.; Pearson Custom Library; Pearson New International Edition; Pearson: Harlow, UK, 2014; ISBN 978-1-292-02190-4. [Google Scholar]
  54. Chion, S.J.; Vincent, C. Analítica de Datos para la Modelación Estructural; Pearson: Lima, Peru, 2016; ISBN 978-612-4149-39-9. [Google Scholar]
  55. Amores-Salvadó, J.; Martín-de Castro, G.; Navas-López, J.E. The importance of the complementarity between environmental management systems and environmental innovation capabilities: A firm level approach to environmental and business performance benefits. Technol. Forecast. Soc. Chang. 2015, 96, 288–297. [Google Scholar] [CrossRef]
  56. Przychodzen, J.; Przychodzen, W. Relationships between eco-innovation and financial performance—Evidence from publicly traded companies in Poland and Hungary. J. Clean. Prod. 2015, 90, 253–263. [Google Scholar] [CrossRef]
  57. Maçaneiro, M.B.; da Cunha, S.K.; Balbinot, Z. Drivers of the Adoption of Eco-Innovations in the Pulp, Paper, and Paper Products Industry in Brazil. Lat. Am. Bus. Rev. 2013, 14, 179–208. [Google Scholar] [CrossRef]
  58. del Brío, J.Á.; Junquera, B. A review of the literature on environmental innovation management in SMEs: Implications for public policies. Technovation 2003, 23, 939–948. [Google Scholar] [CrossRef]
Figure 1. Conceptual model, adapted from the research in [19].
Sustainability 14 09579 g001
Figure 2. Final research model with standardized structural path coefficients.
Sustainability 14 09579 g002
Table 1. Characteristics of the sample.
Characteristics Number of FirmsPercentage of Firms
SizeMedium11855.1%
Large9644.9%
CountryColombia8238.3%
Ecuador 7434.6%
Peru5827.1%
Firm ageLess than 5 years21%
Between 5 and 10 years84%
Over 10 years20495%
CertificationISO 140015927.6%
ISO 9001188.4%
Other 2813.1%
None10950.9%
IndustryFood and beverage5425.2%
Chemical and chemical products3114.5%
Metals and metal products2511.7%
Textiles, leather, and apparel2310.7%
Pharmaceutical products157%
Paper and paper products157%
Electrical equipment and machinery157%
Wood and wood products104.7%
Motor vehicles and transport equipment20.9%
Coke and refined petroleum products20.9%
Computer, electronic, and optical products10.5%
Other219.8%
Table 2. Standardized factor loadings, ccomposite reliability, and average variance extracted from CFA.
Measurement ItemsFLCRAVE
Organizational Eco-Innovation (OE) 0.8870.664
OE1Our firm often innovatively uses novel systems to manage eco-innovation.0.81
OE2Our firm often innovatively collects and shares information on eco-innovation trends. 0.84
OE3Our firm often actively engages in eco-innovation activities. 0.88
OE4Our firm often invests a high ratio of R&D in eco-innovation.0.72
Process eco-innovation (PCE) 0.8700.769
PCE1Our firm often innovatively updates manufacturing processes to protect against contamination.0.88
PCE2Our firm often innovatively updates manufacturing processes to meet standards of environmental law. 0.87
Product eco-innovation (PDE) 0.9030.699
PDE1Our firm often places emphasis on developing new eco-products through new technologies to simplify their construction and packaging.0.82
PDE2Our firm often places emphasis on developing new eco-products through new technologies to easily recycle their components.0.86
PDE3Our firm often places emphasis on developing new eco-products through new technologies to easily decompose their materials. 0.87
PDE4Our firm often places emphasis on developing new eco-products through new technologies to use as little energy as possible.0.79
Financial performance (FP) 0.9540.839
FP1Market share.0.87
FP2Return on investment.0.90
FP3Profits.0.97
FP4Sales.0.92
Environmental performance (EP) 0.9300.688
EP1Reduction of air emission. 0.81
EP2Reduction of waste water. 0.84
EP3Reduction of solid wastes. 0.86
EP4Decrease of consumption for hazardous/harmful/toxic materials.0.85
EP5Decrease of frequency of environmental accidents. 0.78
EP6Improvement in enterprise’s environmental situation.0.83
Note: FL: factor loading; CR: composite reliability; AVE: average variance extracted. All factor loadings are statistically significant at a p-value < 0.05.
Table 3. Convergent and discriminant validity of the constructs.
ConstructsAVECorrelations
PDEPCEOEFPEP
1. Product eco-innovation (PDE)0.6990.836
2. Process eco-innovation (PCE)0.7690.6140.877
3. Organizational eco-innovation (OE)0.6640.6920.5540.815
4. Financial Performance (FP)0.8390.3950.3920.4200.916
5. Environmental Performance (EP)0.6880.5630.6180.5350.3690.830
Note: AVE: average variance extracted. The square root of the AVE is shown on the diagonal.
Table 4. Standardized path coefficients of structural model and research hypotheses.
RelationStandardized Valuep-ValueHypothesis
Organizational eco-innovation→Process eco-innovation0.554***H1 supported
Organizational eco-innovation→Product eco-innovation0.507***H2 supported
Process eco-innovation→Product eco-innovation0.333***H3 supported
Process eco-innovation→Environmental performance0.402***H4 supported
Organizational eco-innovation→Environmental performance0.1830.046 **H5 supported
Product eco-innovation→Environmental performance0.1900.052 *H6 not supported
Process eco-innovation→Financial performance0.1990.031 **H7 supported
Organizational eco-innovation→Financial performance0.2320.022 **H8 supported
Product eco-innovation→Financial performance0.1140.289H9 not supported
Note: *** p < 0.001; ** p < 0.05; * p < 0.10.
Table 5. Direct, indirect, and total effects among the model variables.
Direct EffectIndirect EffectTotal Effect
OEPCEPDEOEPCEPDEOEPCEPDE
PCE0.482 **-----0.482 **--
PDE0.458 **0.346 **-0.167 **--0.625 **0.346 **-
EP0.168 **0.424 **0.1940.326 **0.067 *-0.494 **0.491 *0.194
FP0.212 **0.209 **0.1150.173 **0.040-0.385 **0.2490.115
Note: ** p < 0.05; * p < 0.10.
Table 6. Comparison between different studies using path coefficient results.
Region/Country
Reference
Relations
(1)
Thailand
Status(2)
Brazil
Status(3)
Ghana
Status(4)
C, E, and P
StatusCommon Findings with 4
OE→PCE0.59HS0.75HS--0.55HS1, 2
OE→PDE0.46HS0.46HS--0.51HS1, 2
PCE→PDE0.41HS0.40HS--0.33HS1, 2
PCE→FP0.42HS0.15HNS0.22HNS0.20HS1
OE→FP0.51HS0.42HS0.04HNS0.23HS1, 2
PDE→FP0.36HS0.46HS0.24HNS0.11HNS3
PCE→EP- - 0.04HS0.40HS3
OE→EP- - 0.22HS0.18HS3
PDE→EP- - 0.31HS0.19HNS-
Note: C, E, and P = Colombia, Ecuador and Perú; HS = hypothesis supported; HNS = hypothesis not supported.
Publisher’s Note: MDPI stays neutral with regard to jurisdictional claims in published maps and institutional affiliations.

