
Landscape Analysis of Cobalt Mining Activities from 2009 to 2021 Using Very High Resolution Satellite Data (Democratic Republic of the Congo)


Abstract
1. Introduction
“Take immediate and effective measures to eradicate forced labour, end modern slavery and human trafficking and secure the prohibition and elimination of the worst forms of child labour, including recruitment and use of child soldiers, and by 2025 end child labour in all its forms”.[39]
2. Materials and Methods
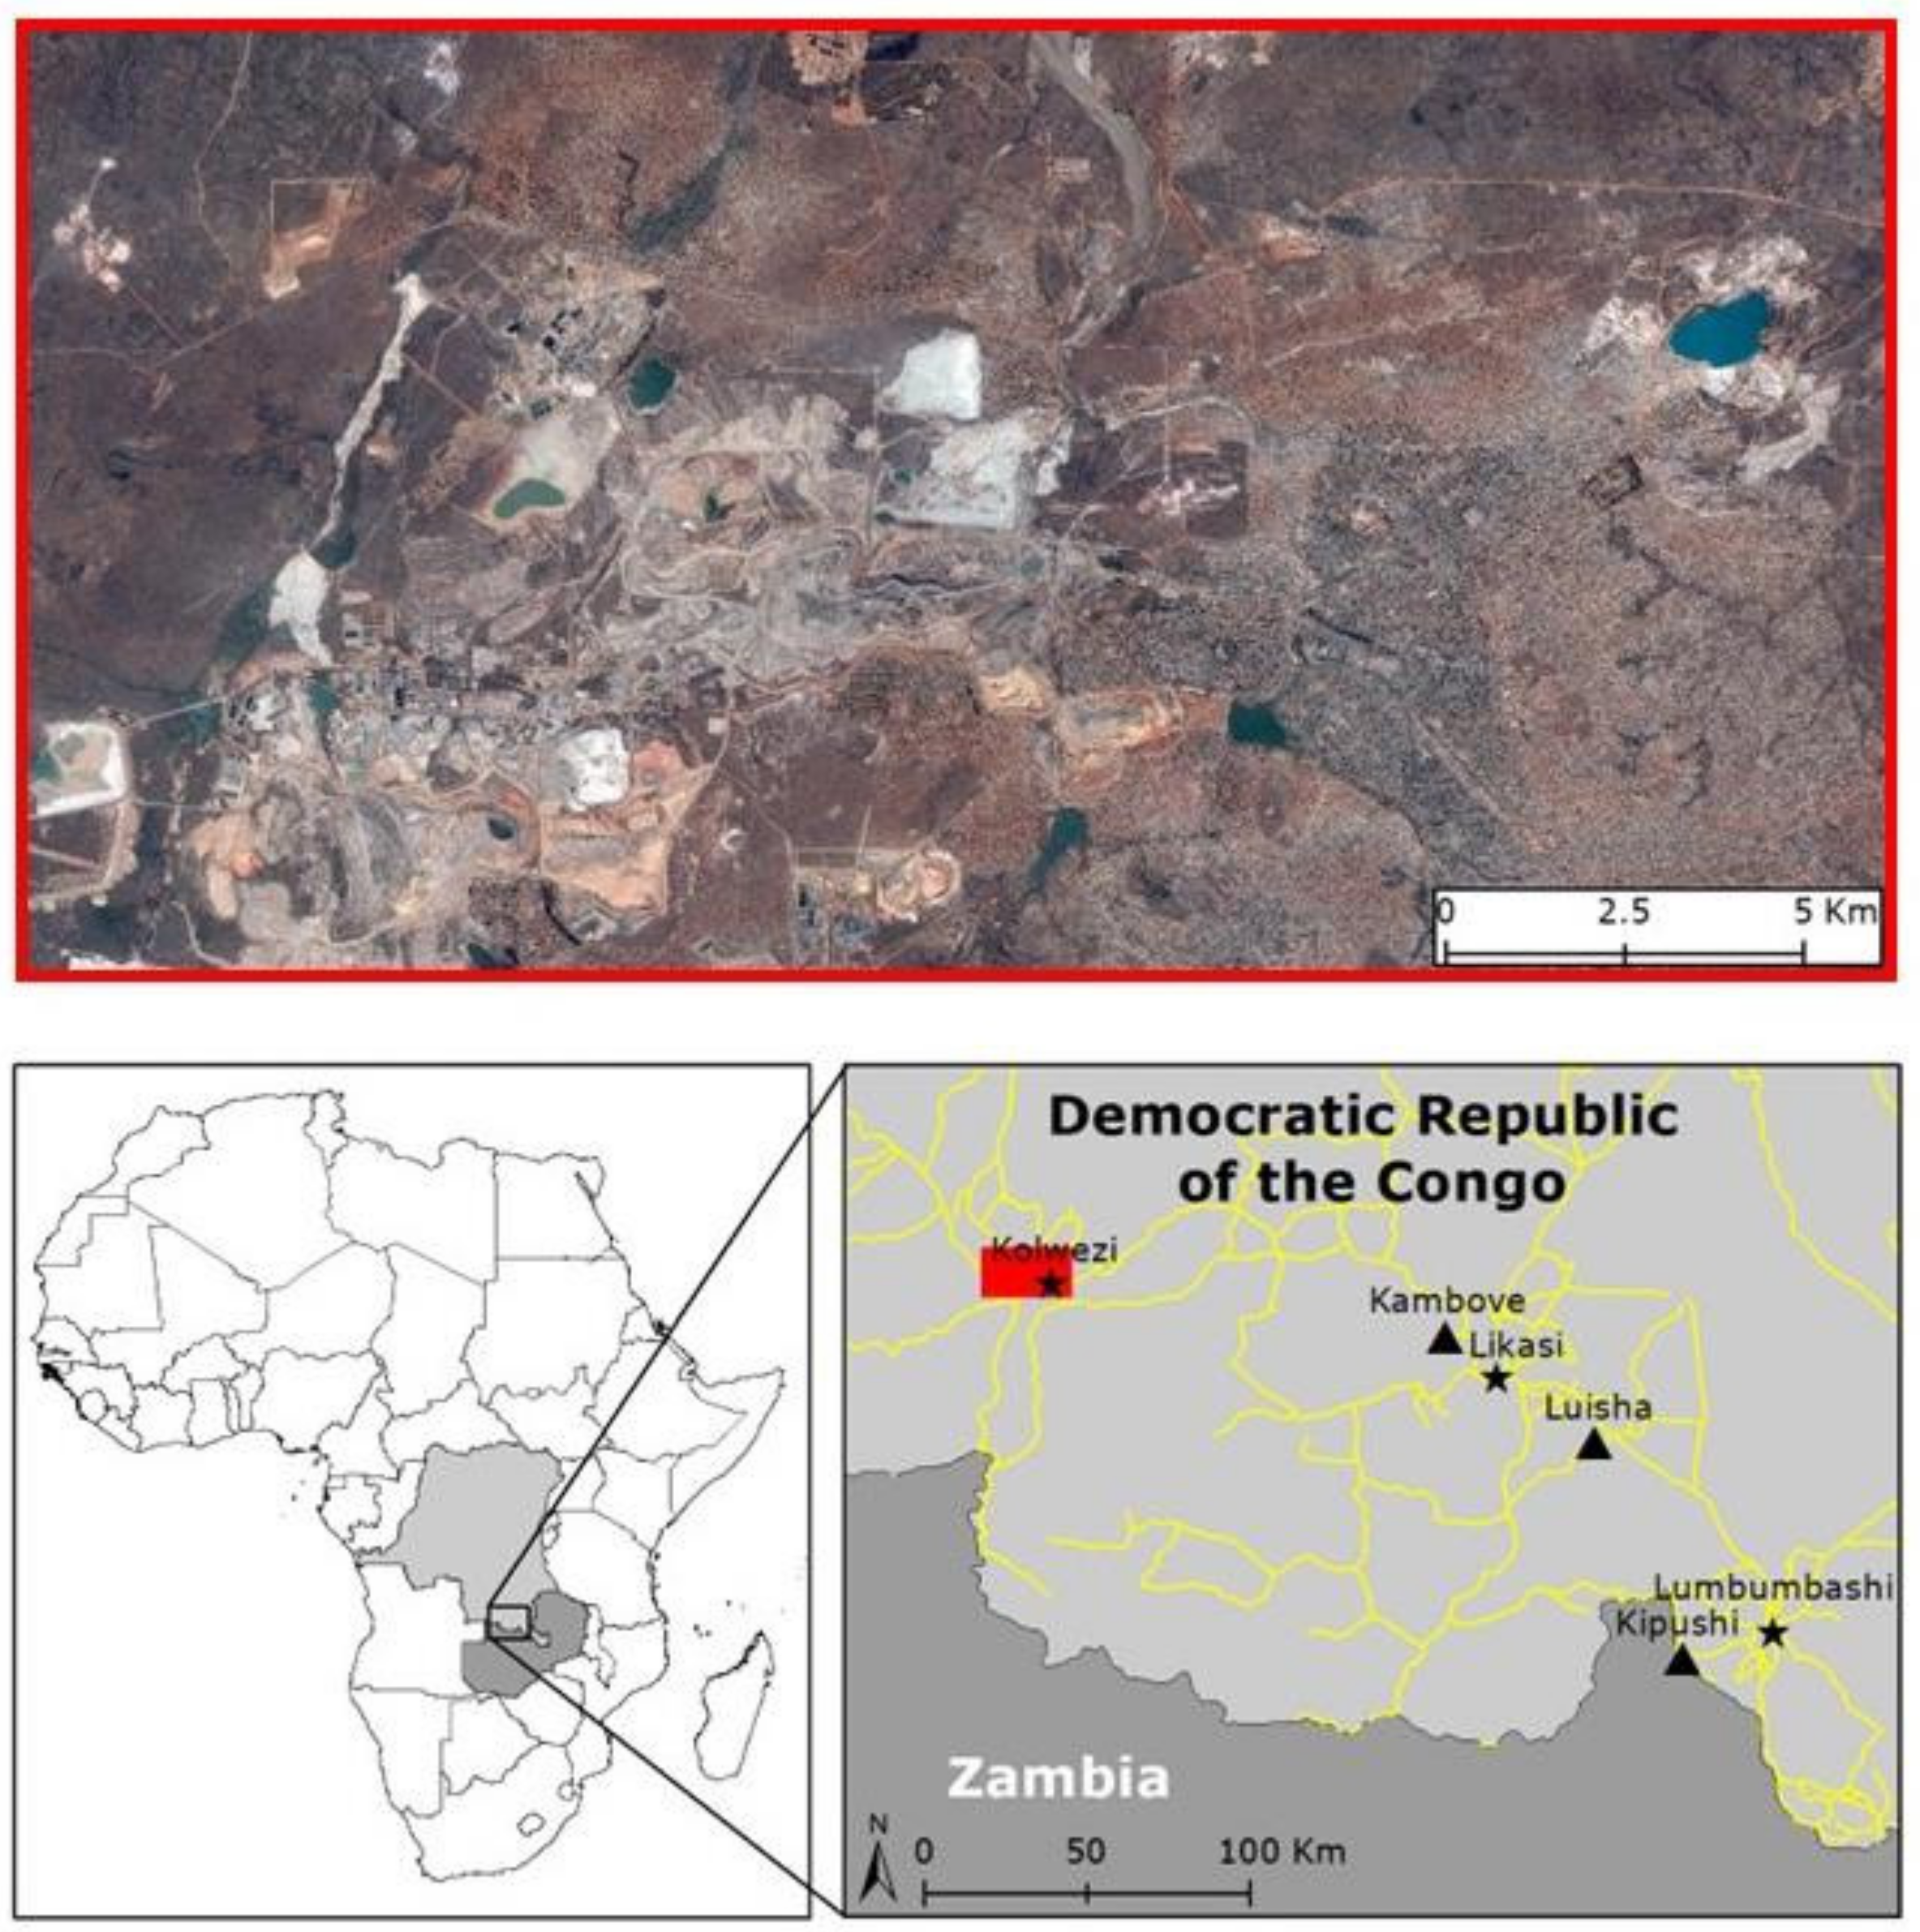
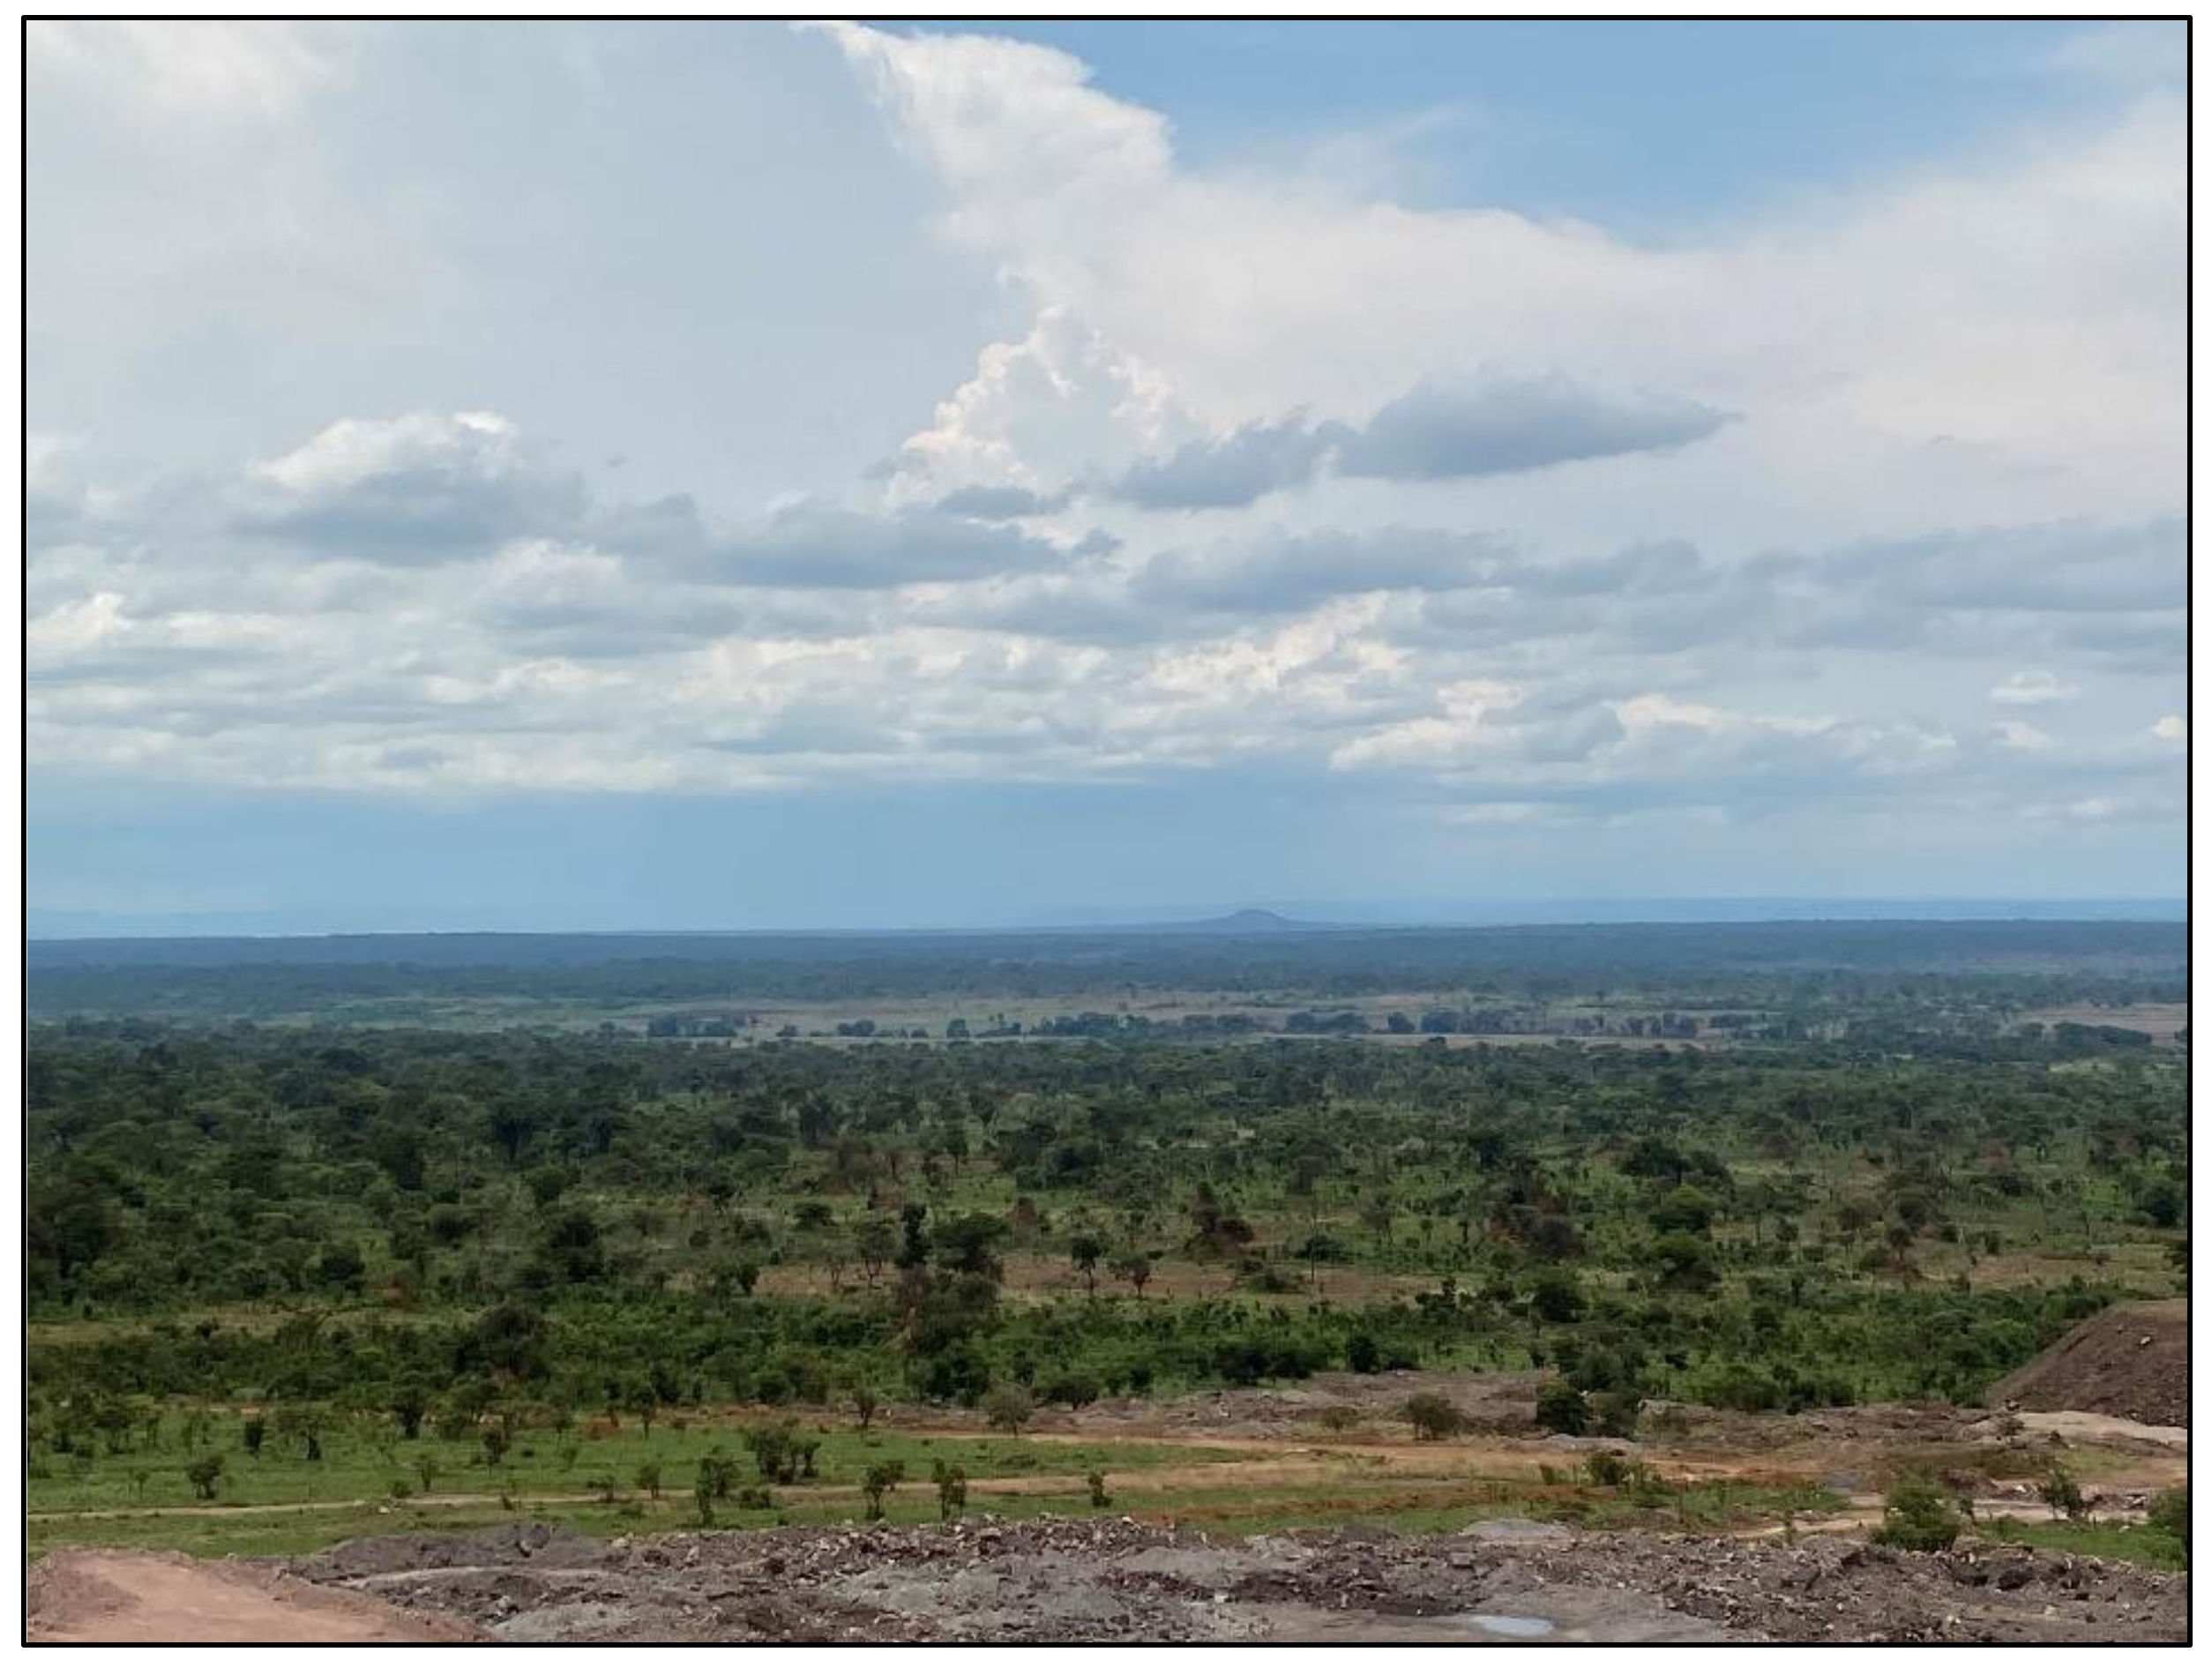
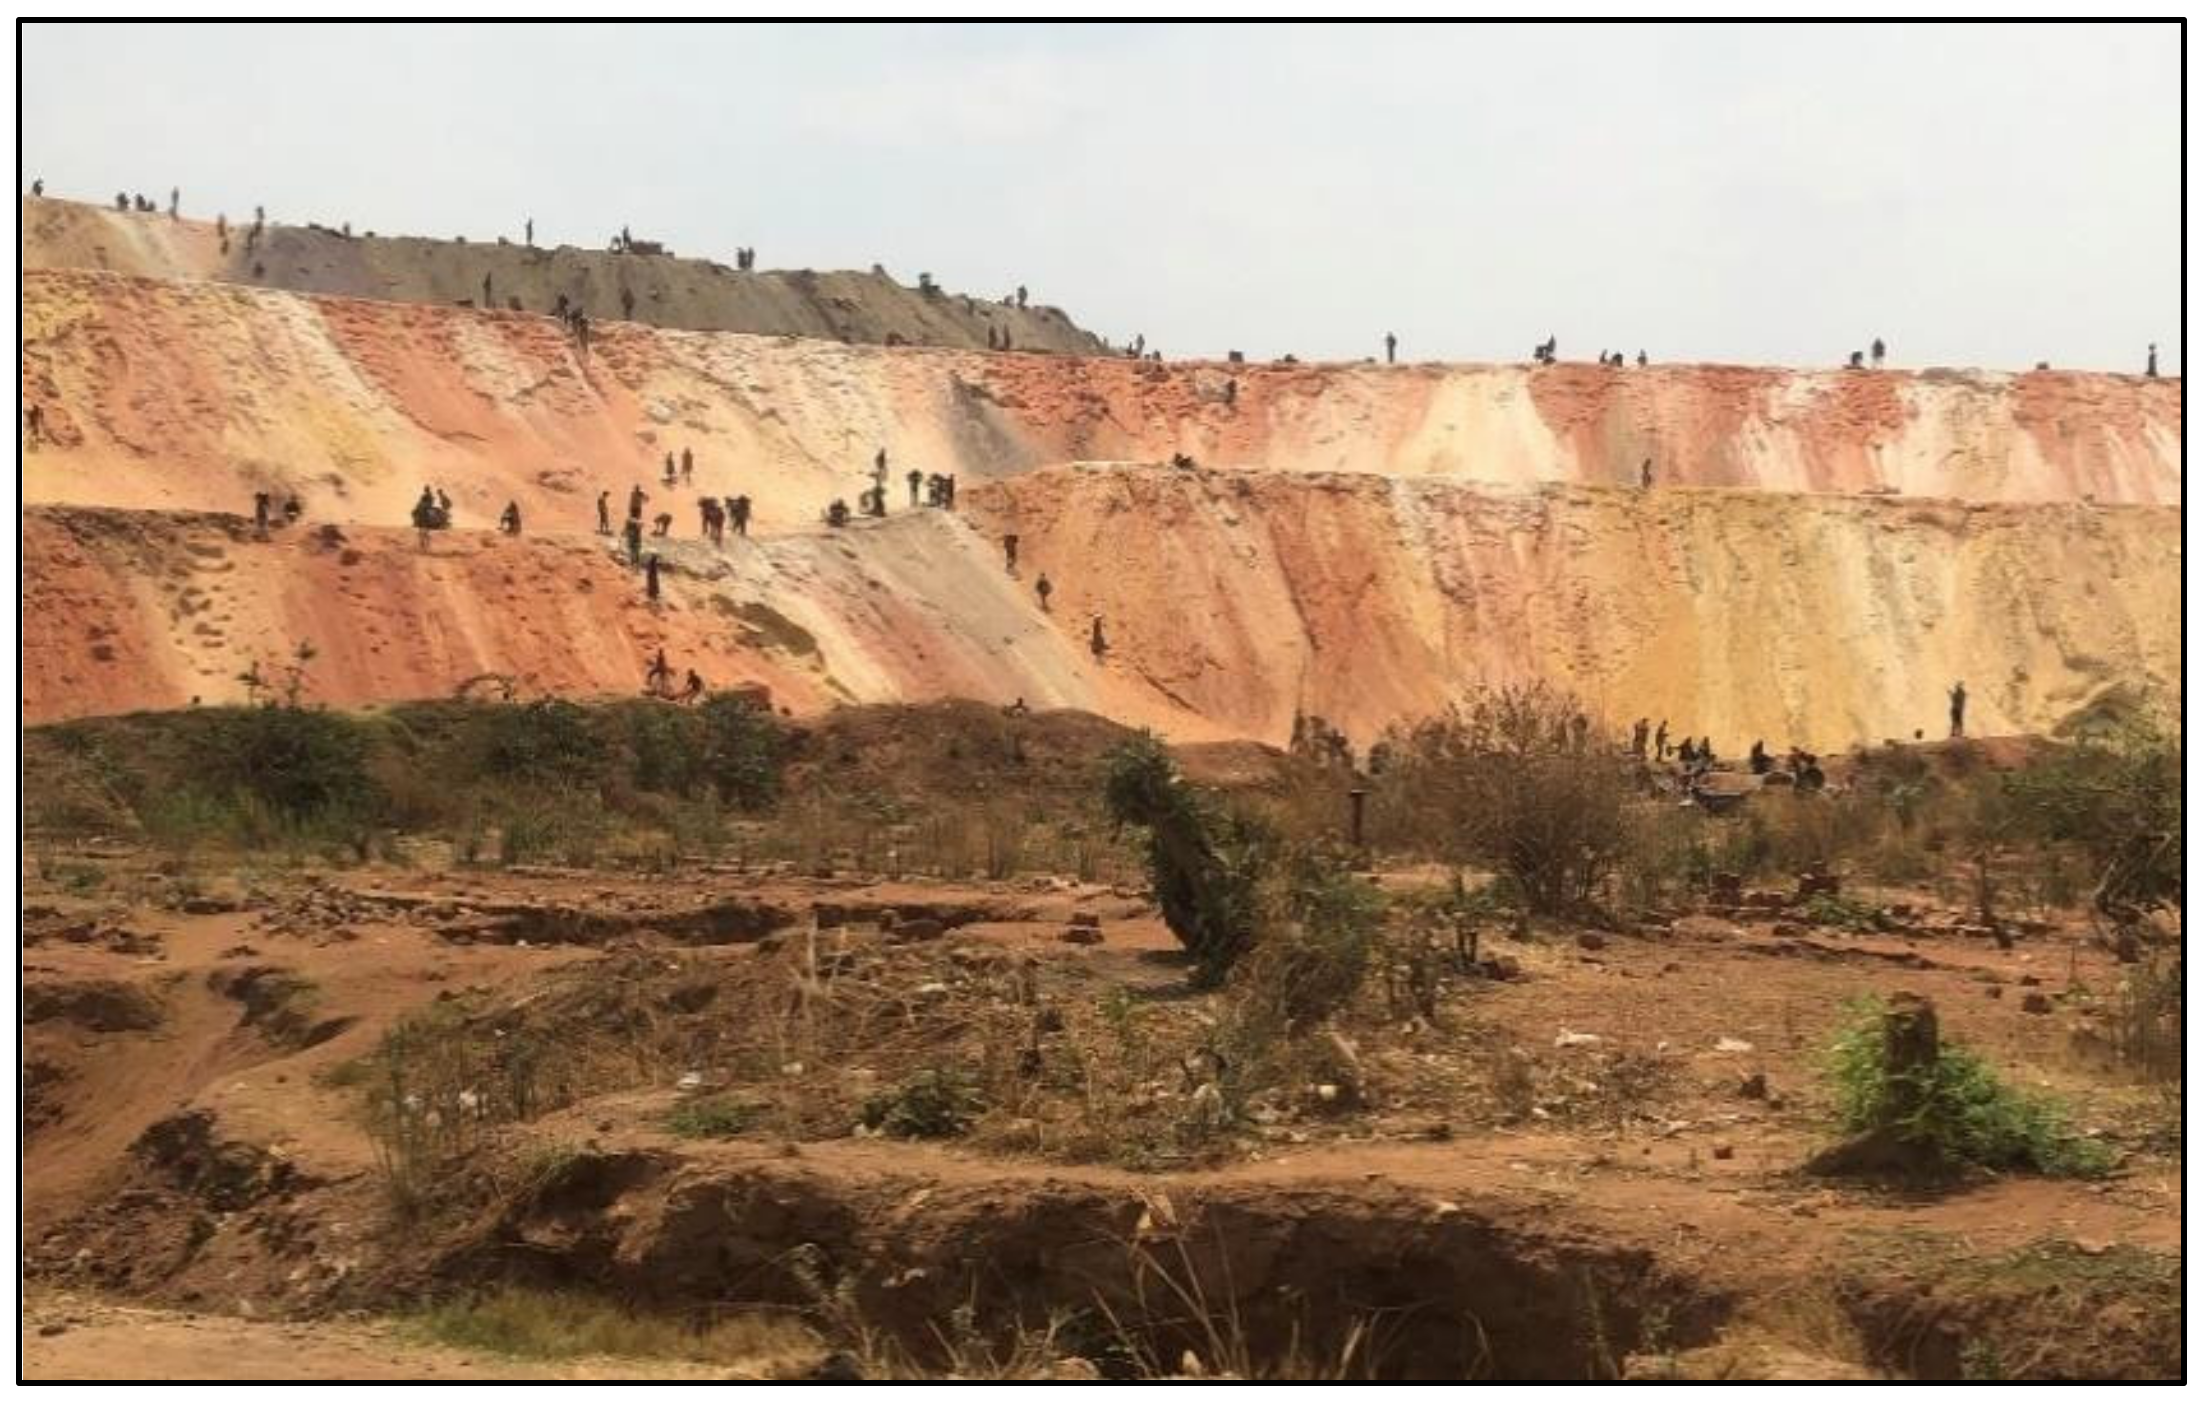
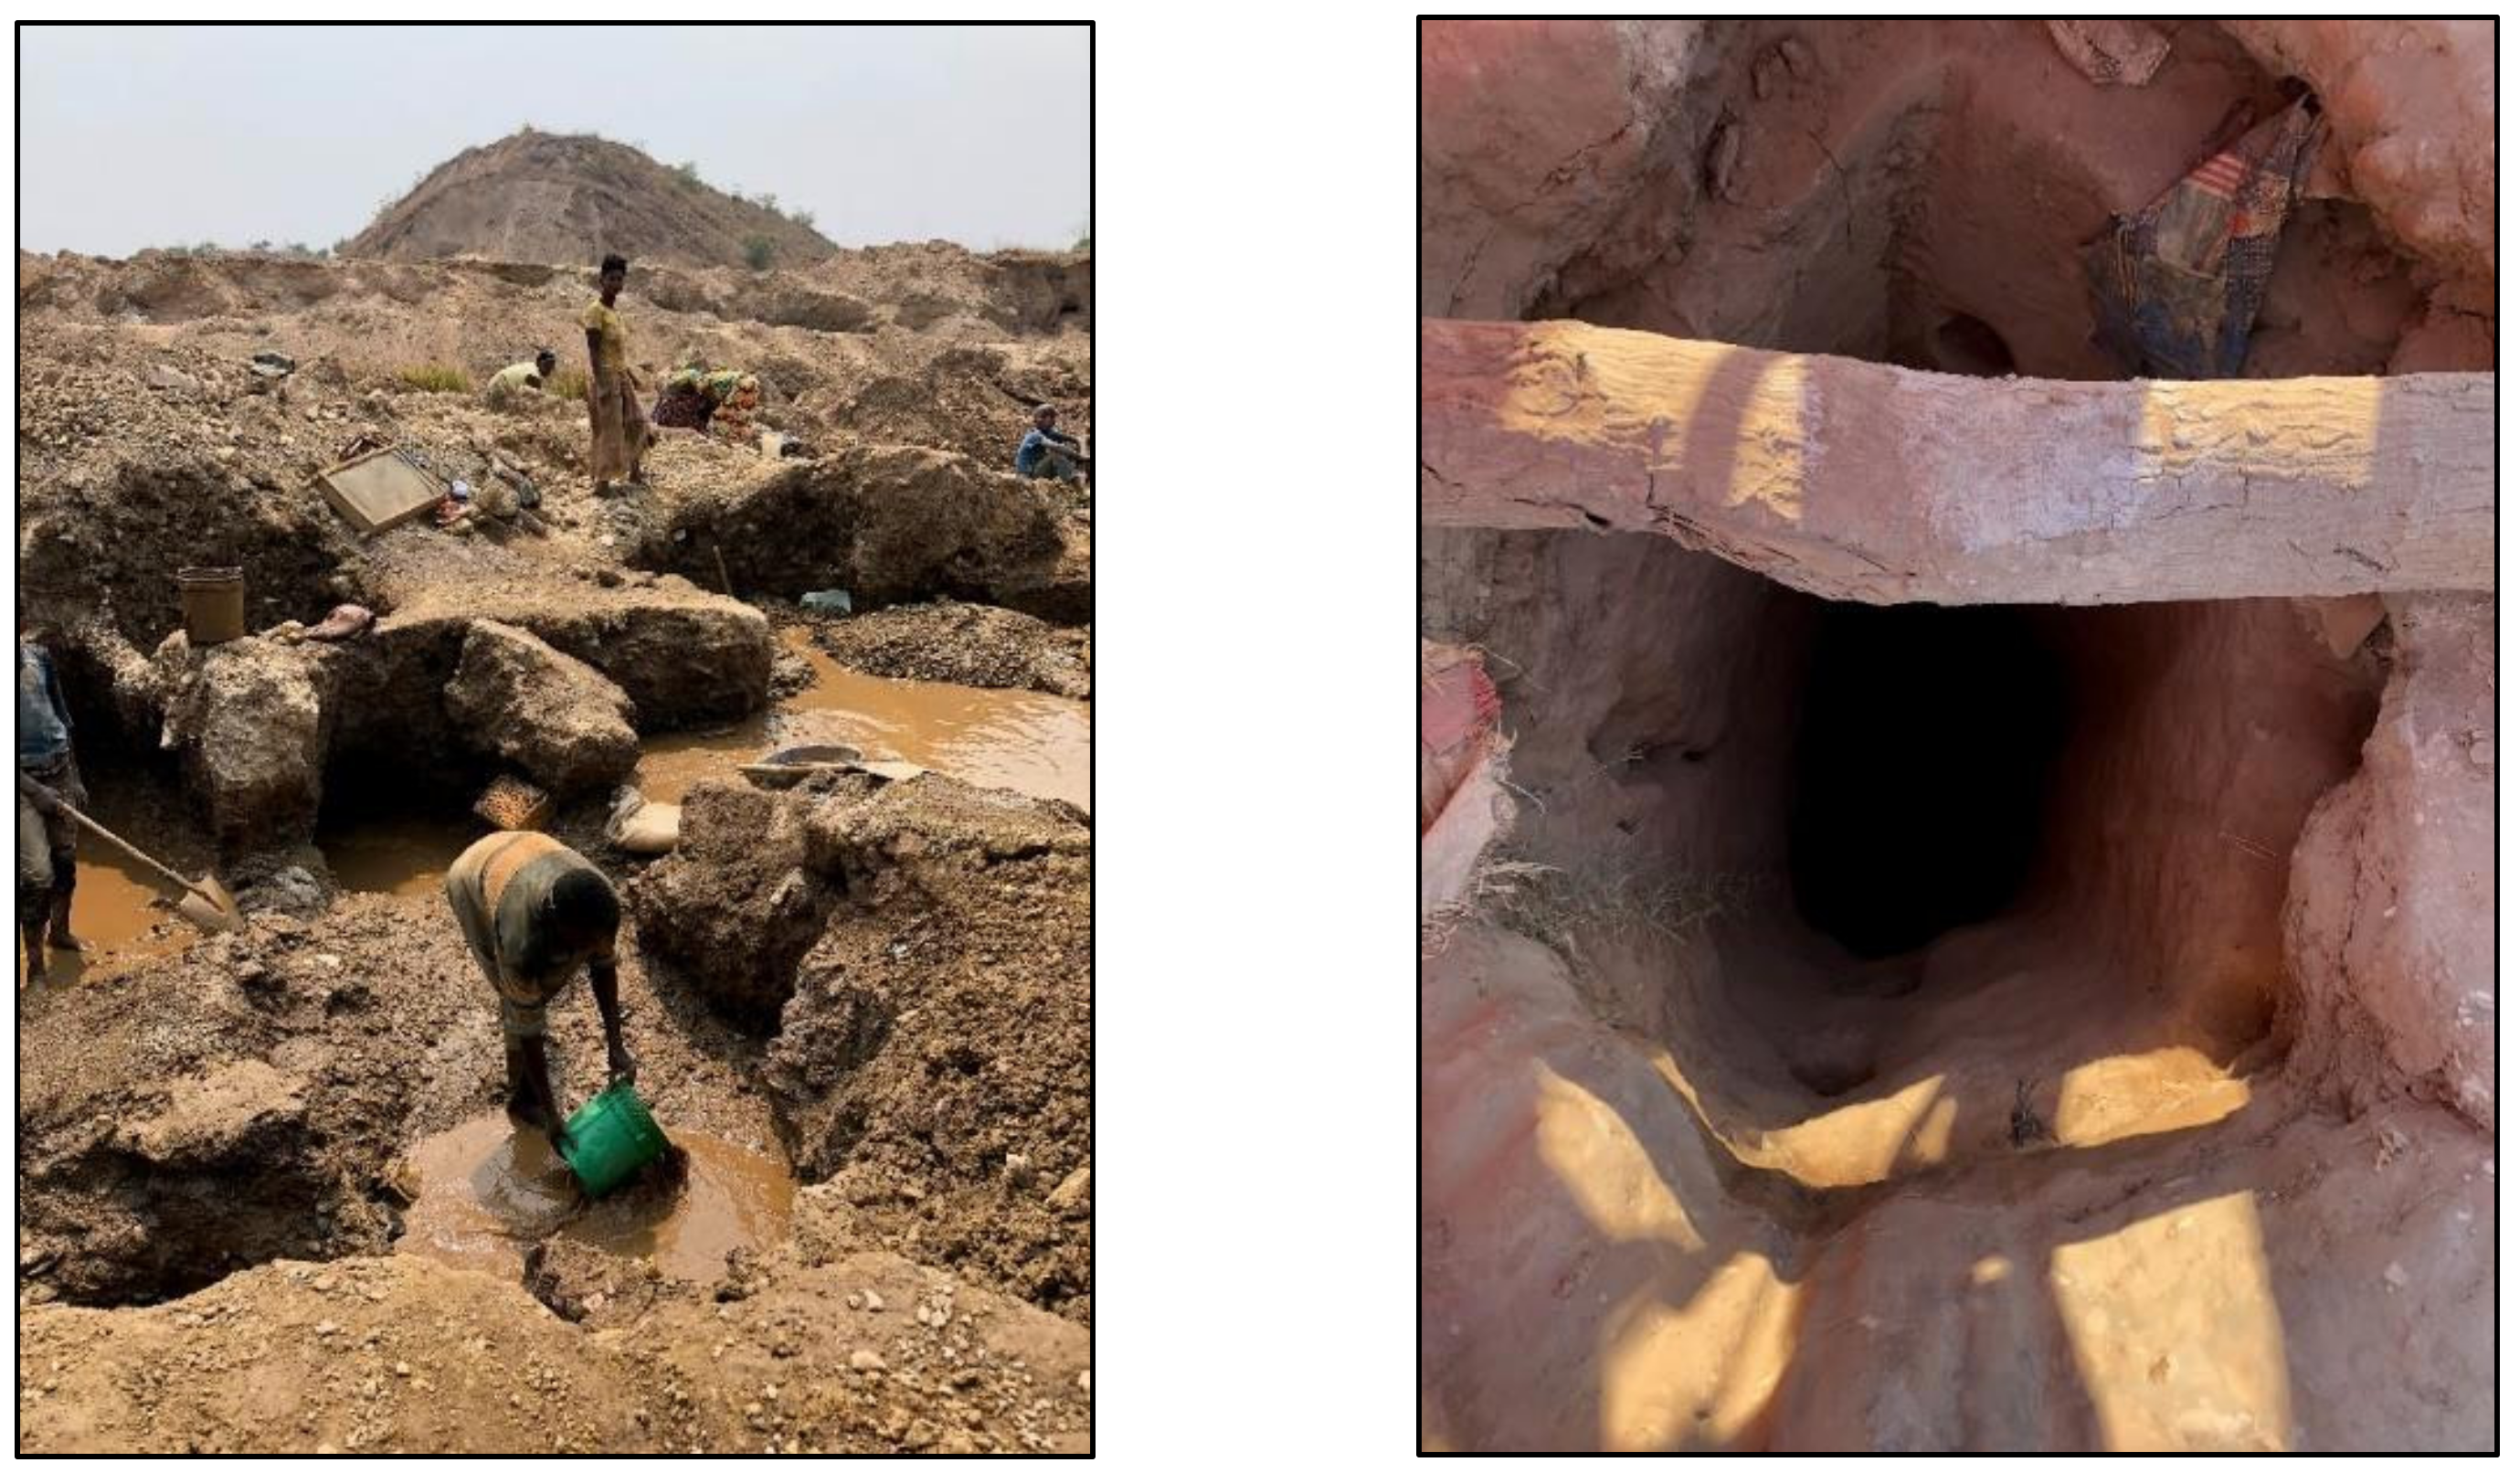
2.1. Study Area
2.2. Satellite EO Time Series
2.3. Land Cover Classification
2.4. Visual Assessment
3. Results
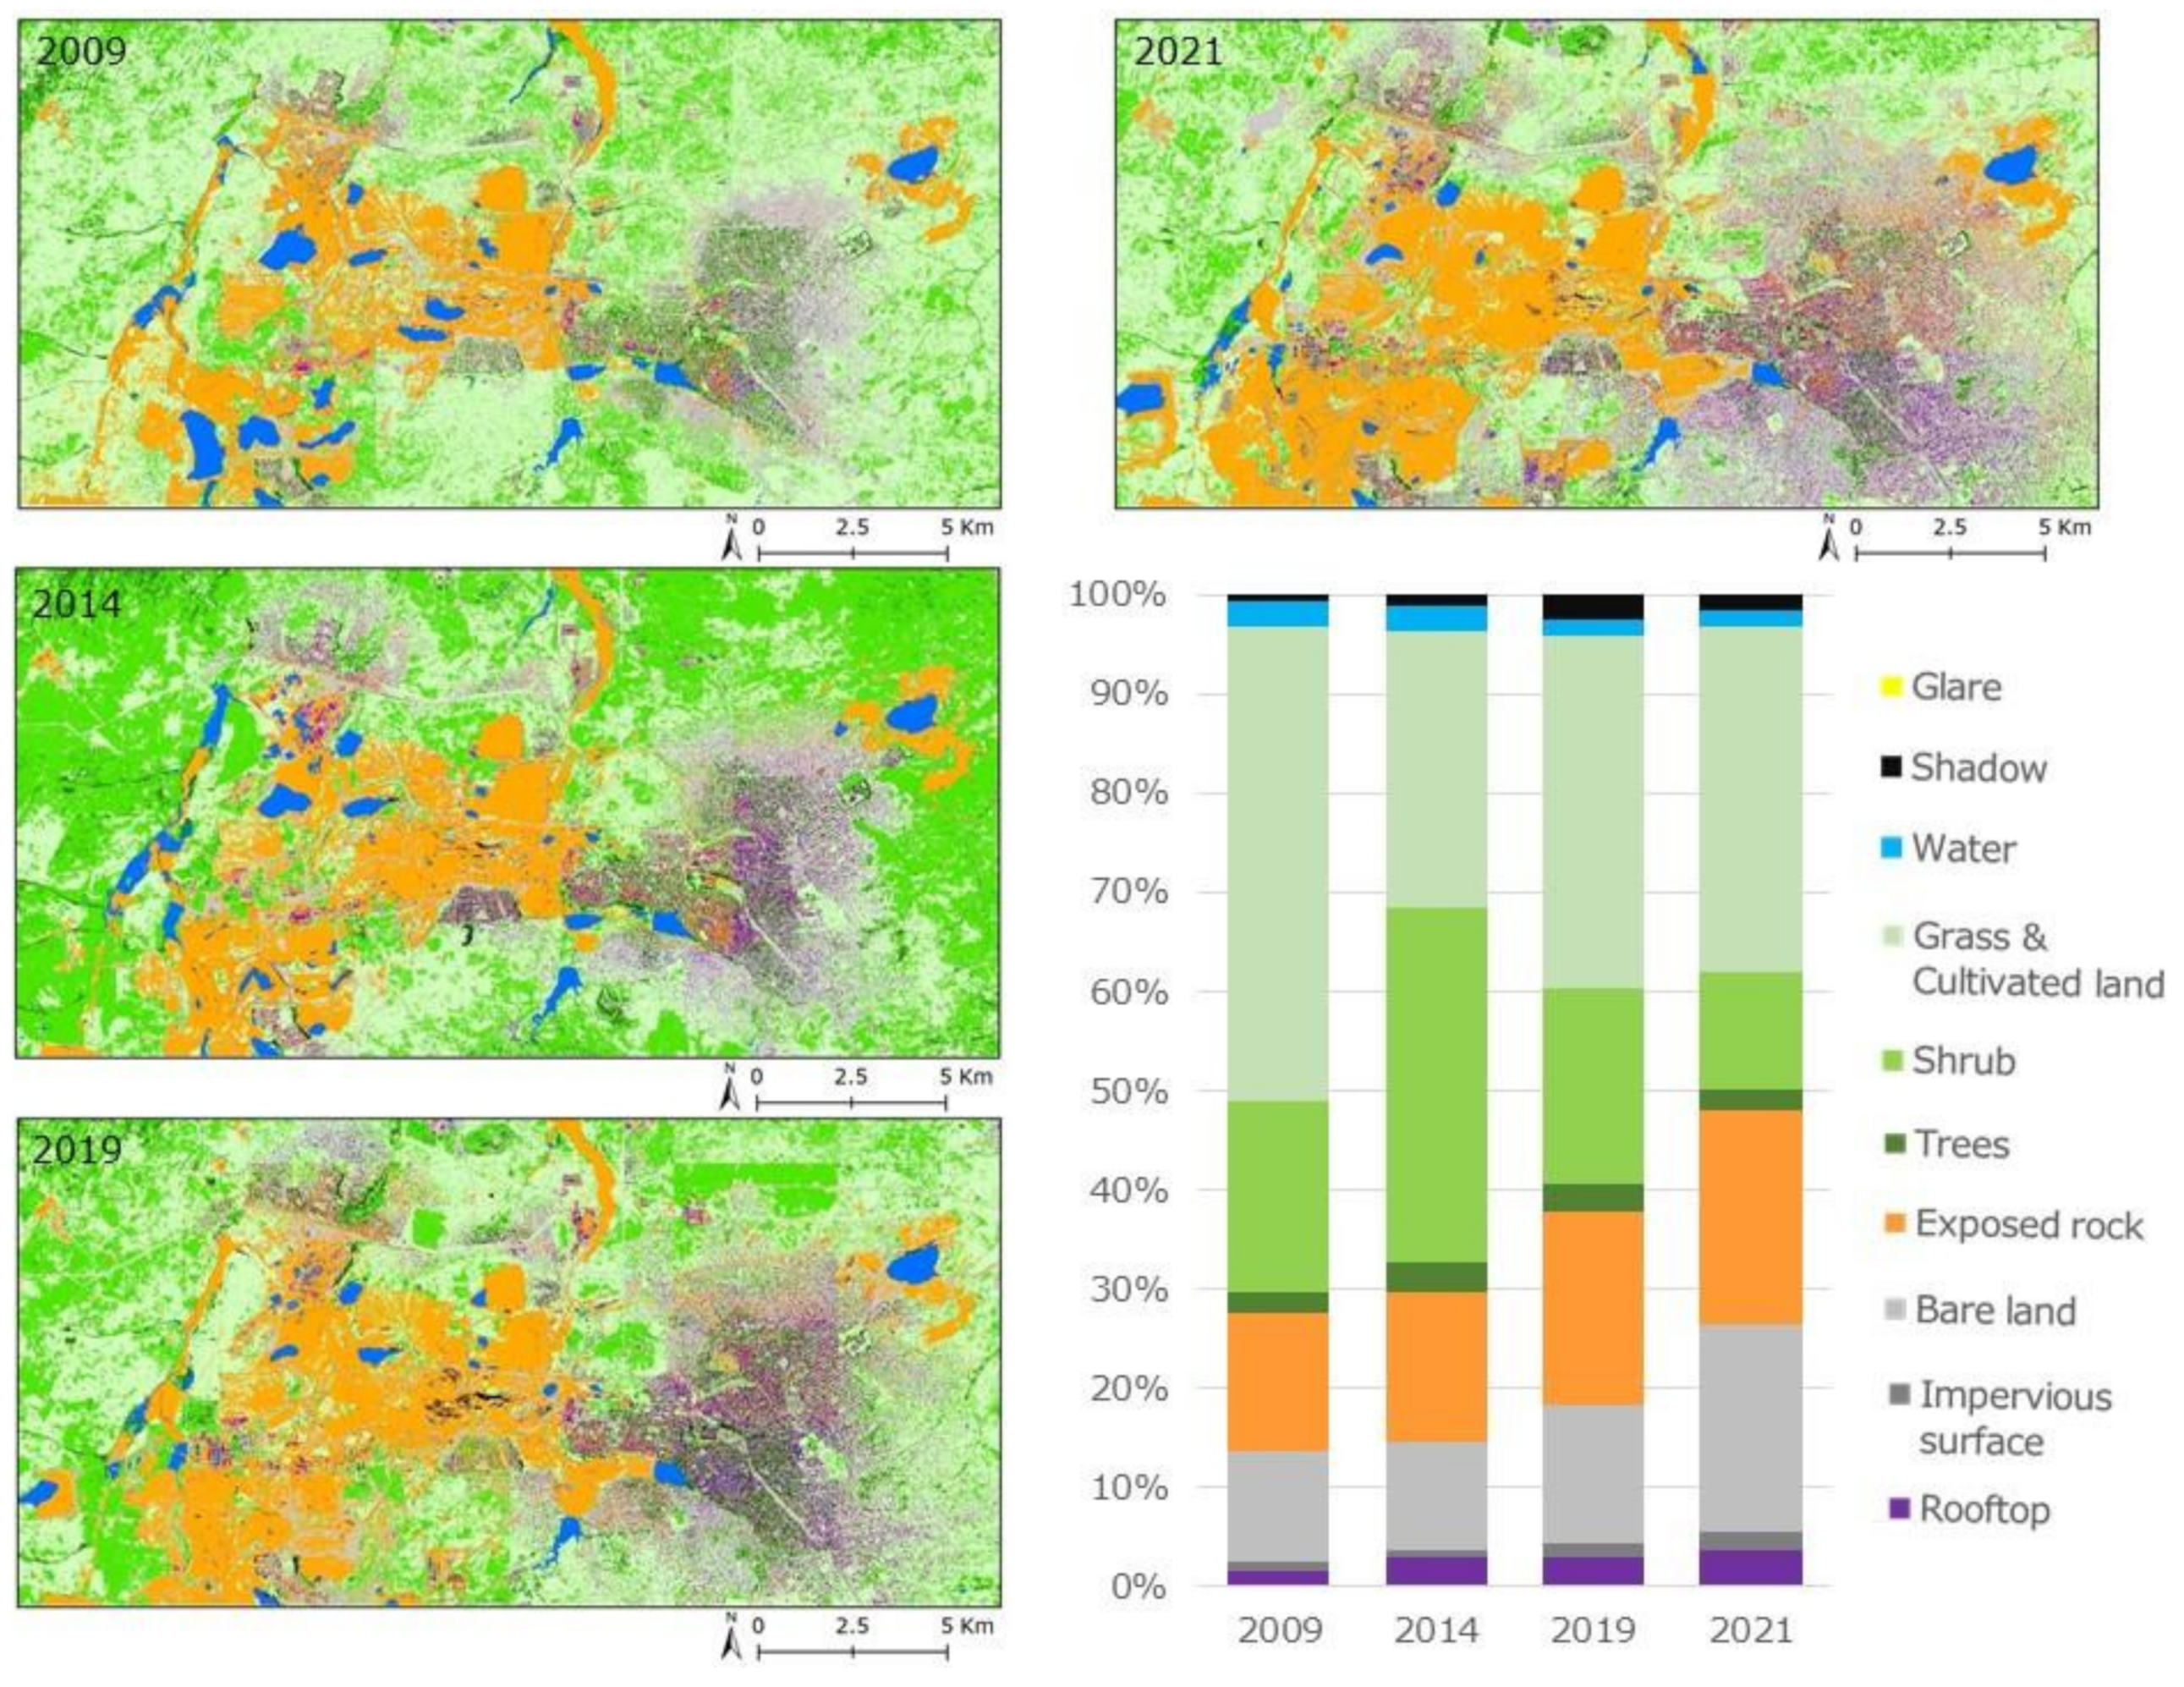
3.1. Land Cover
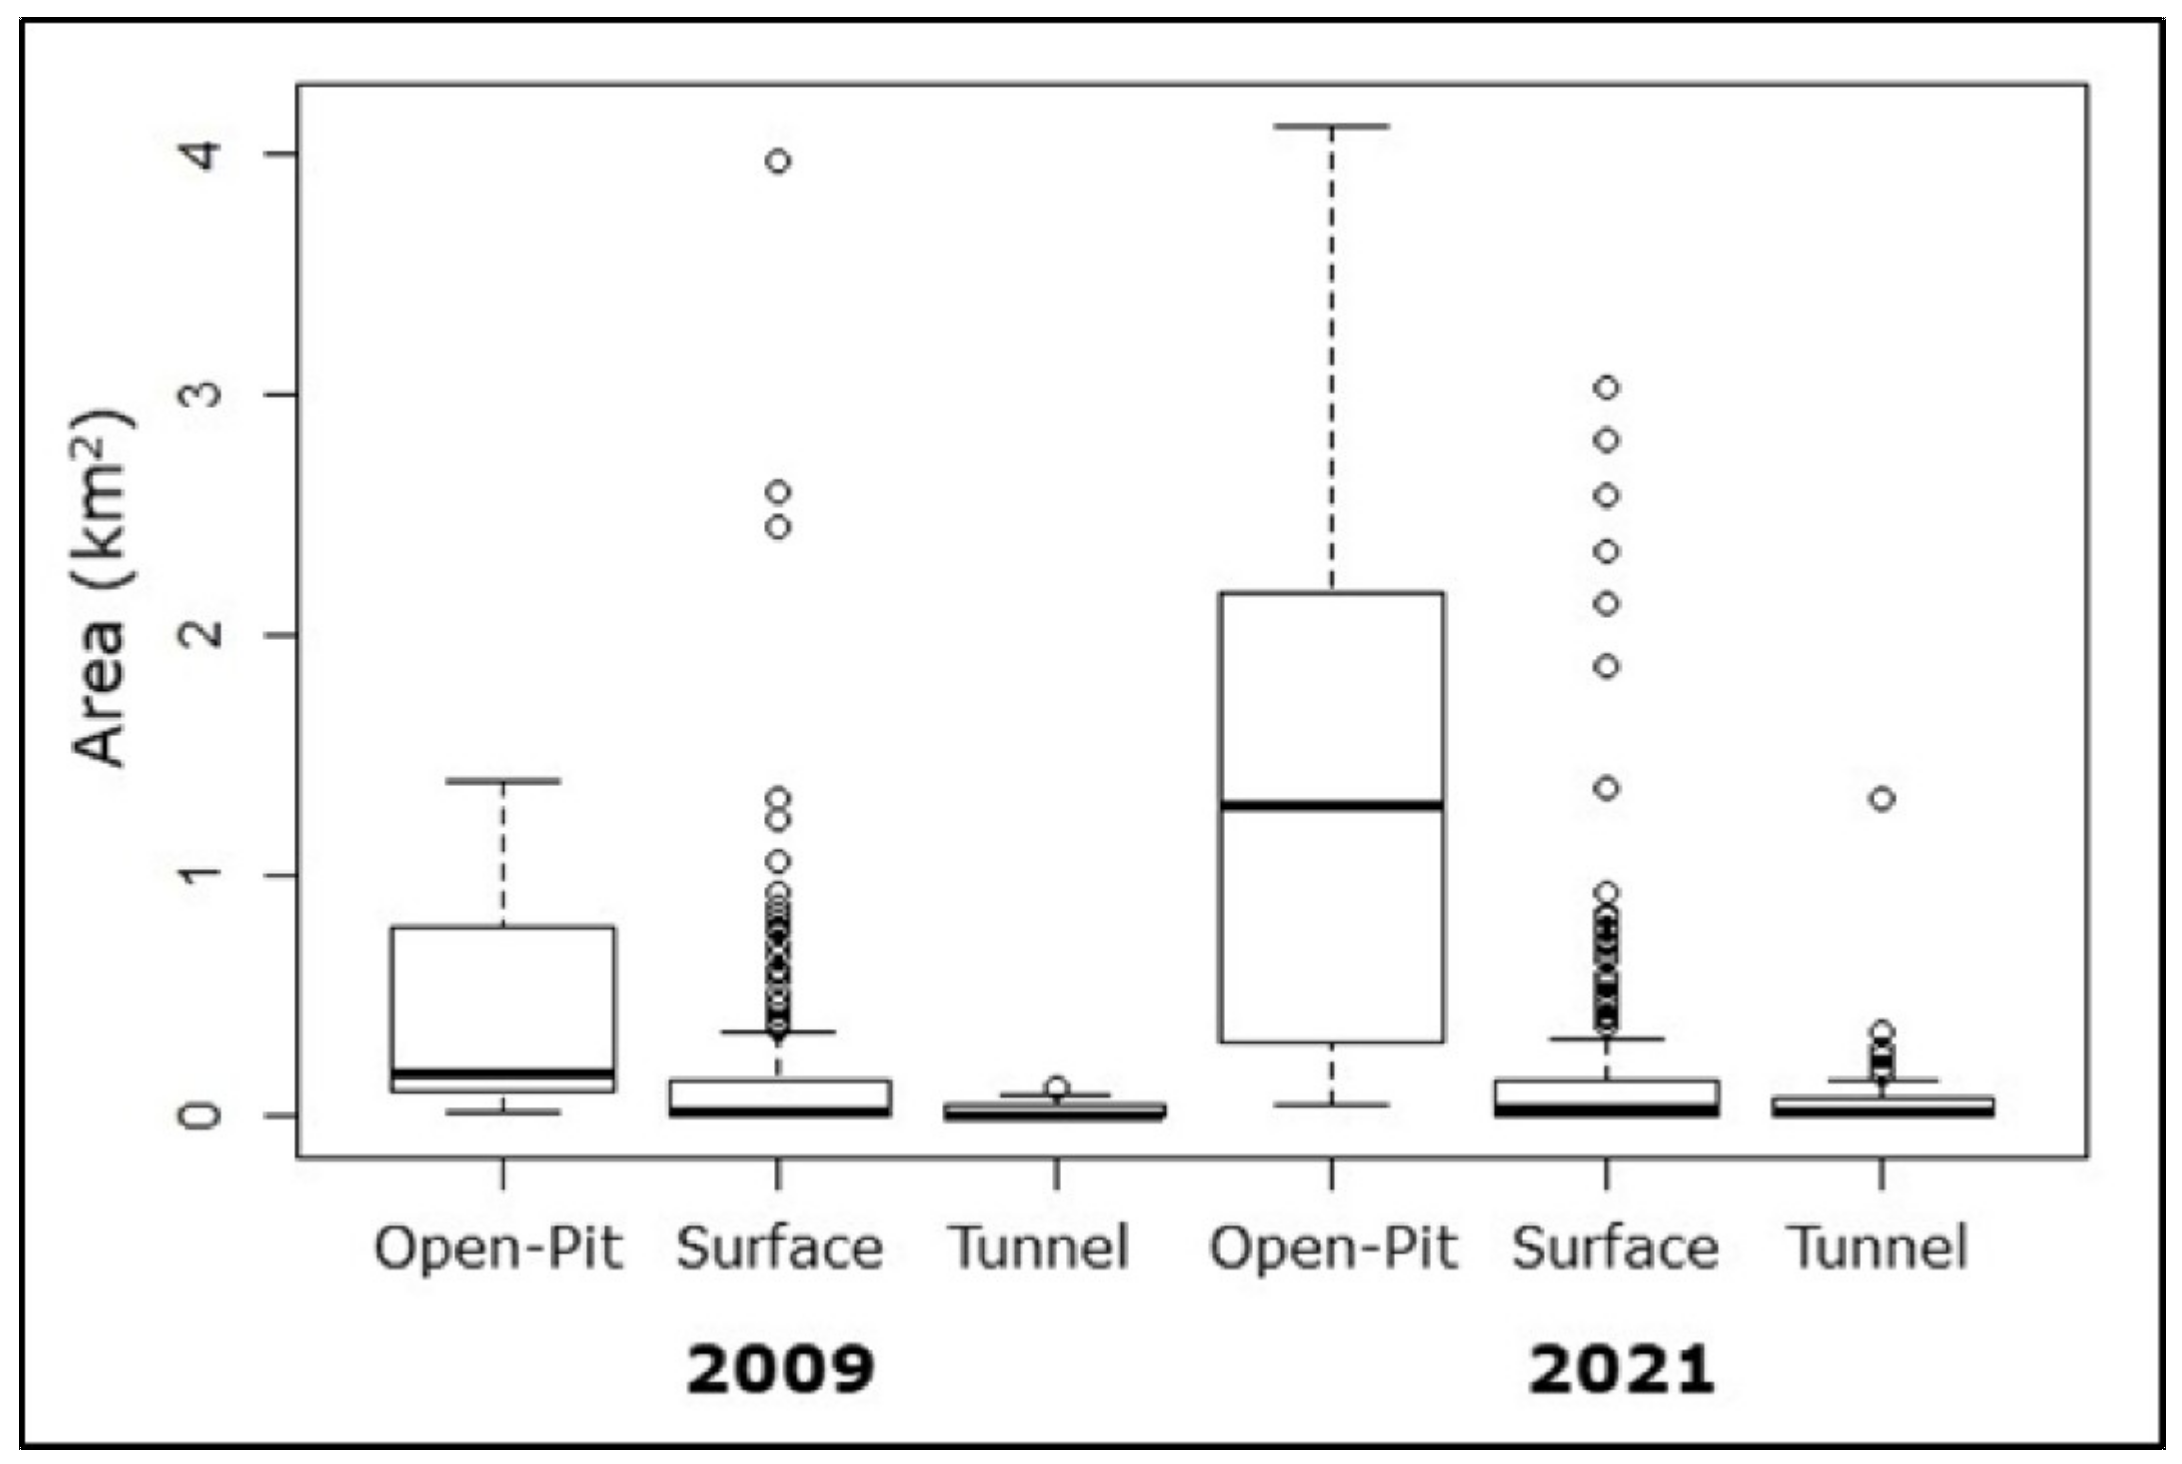
3.2. Mining Features
4. Discussion
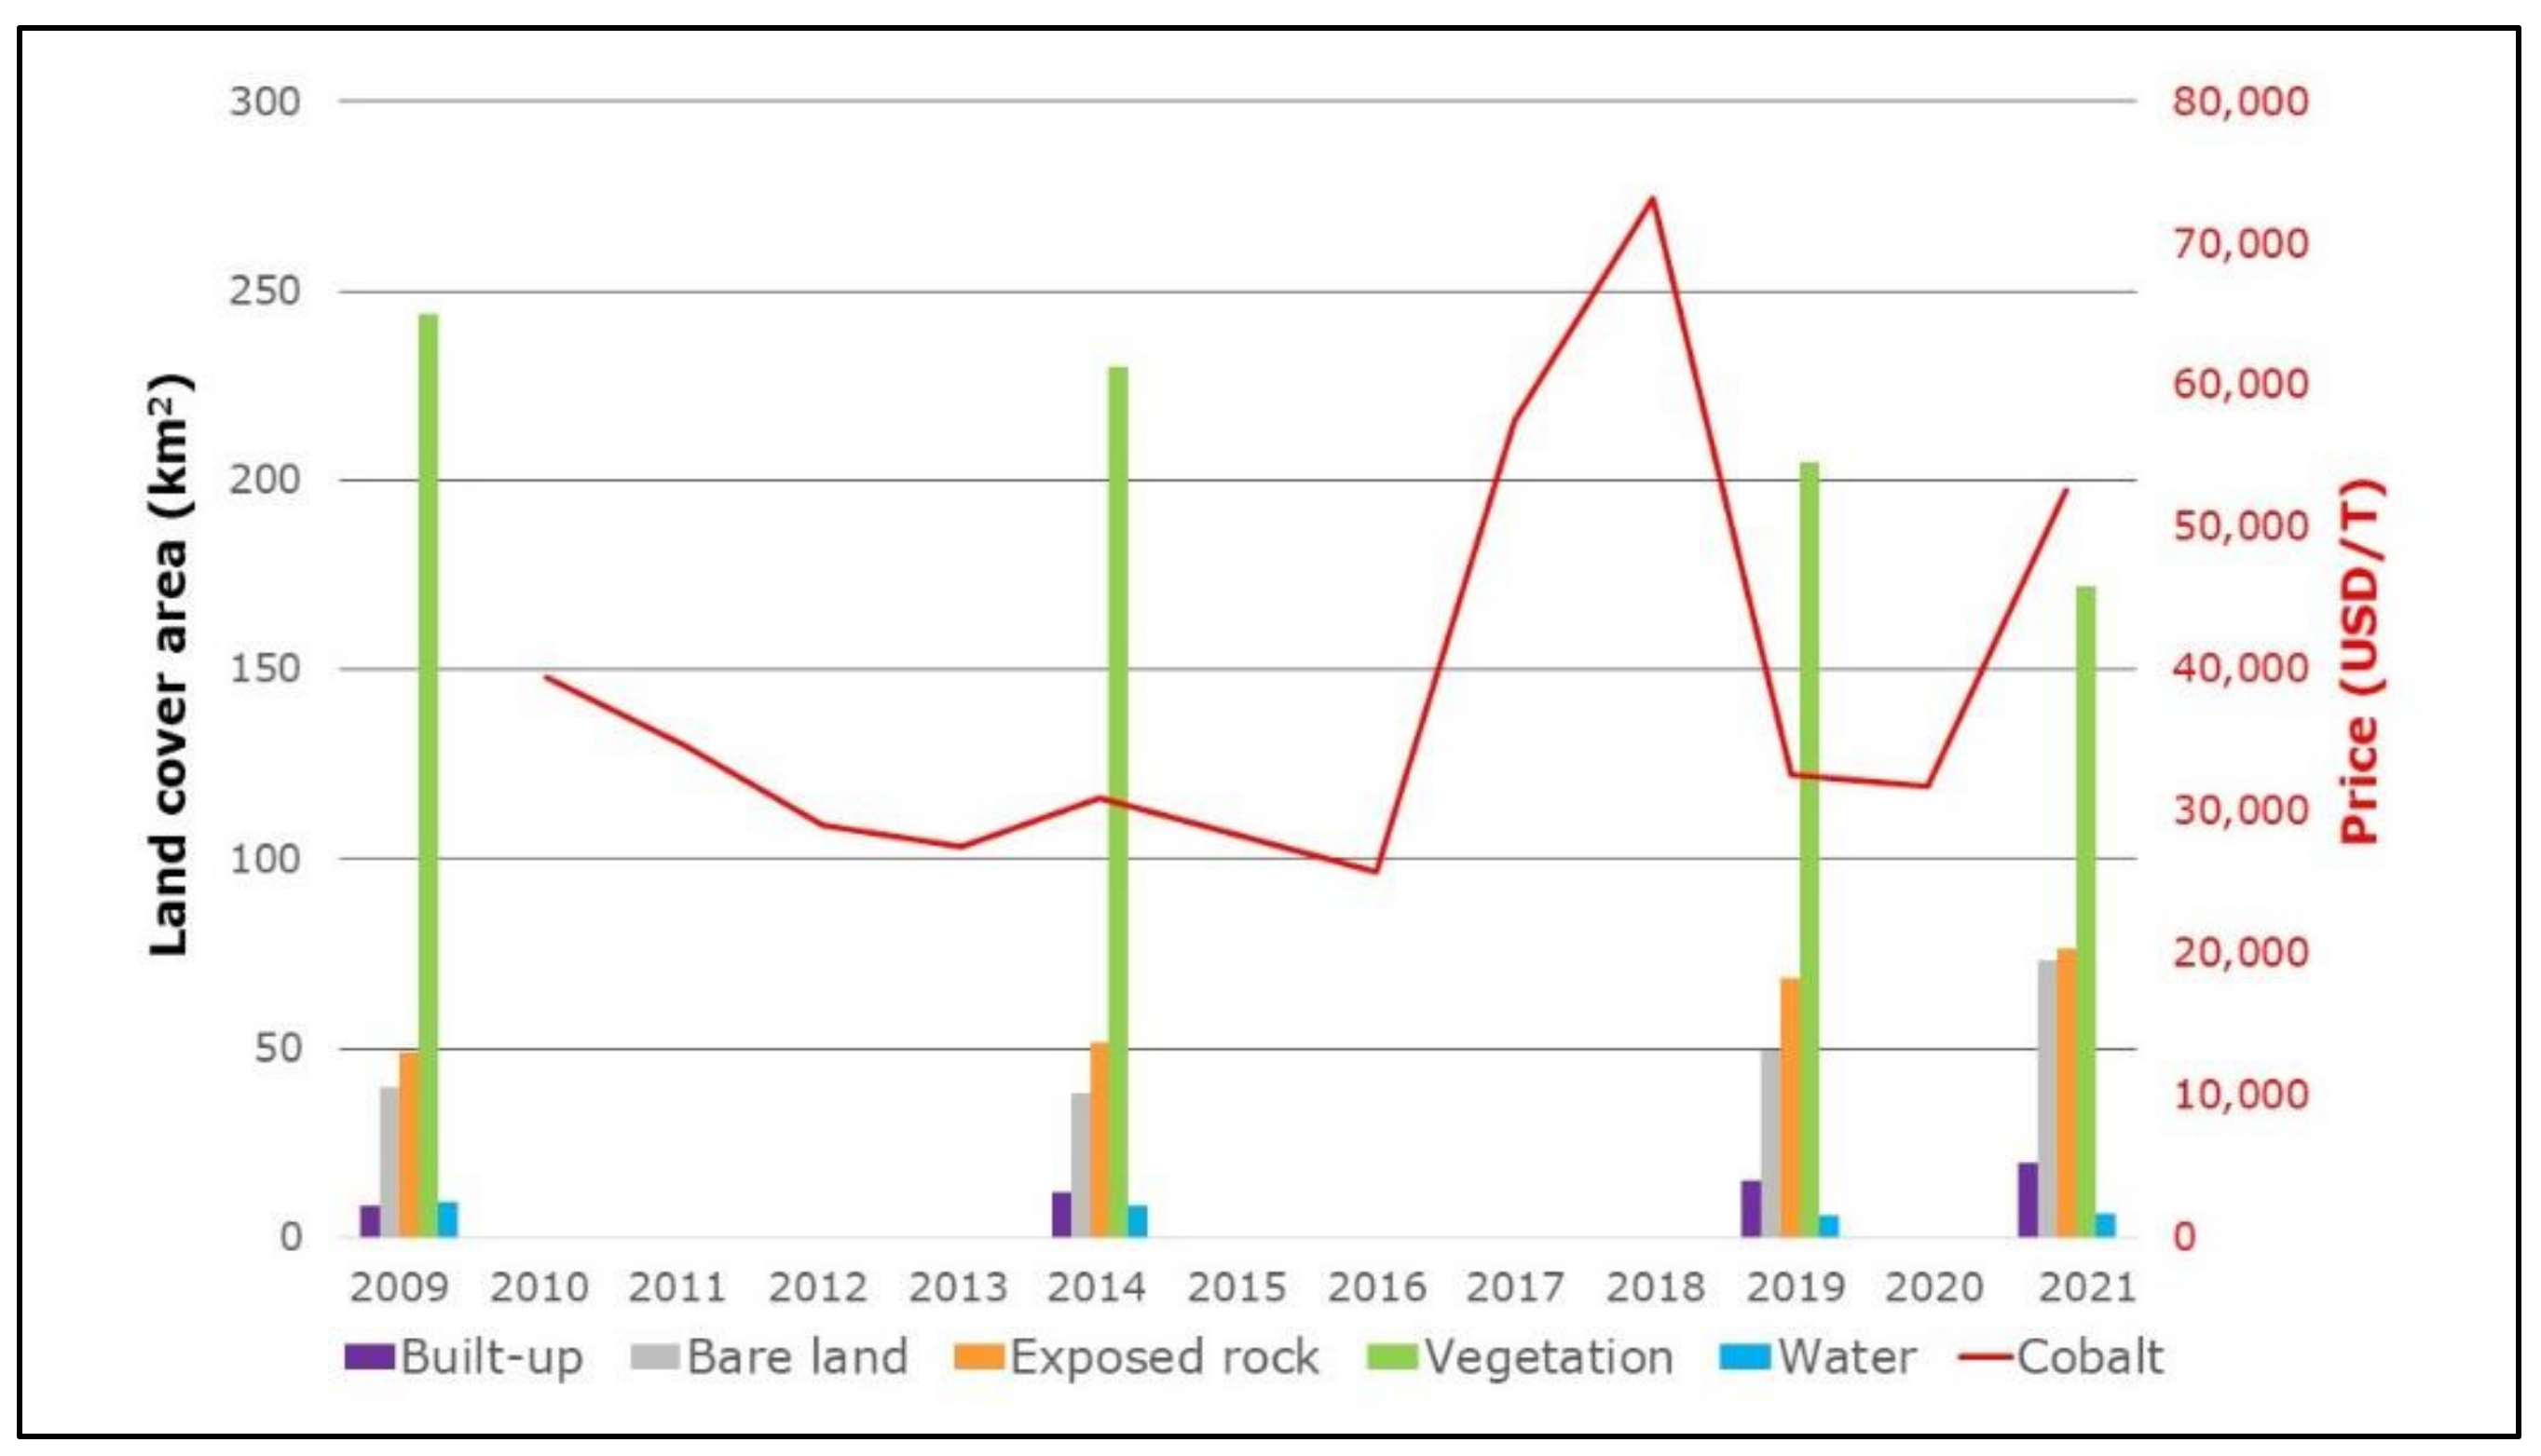
4.1. Land Cover vs. Cobalt Price
4.2. Spatial Analysis of the Social, Health, and Environmental Impacts
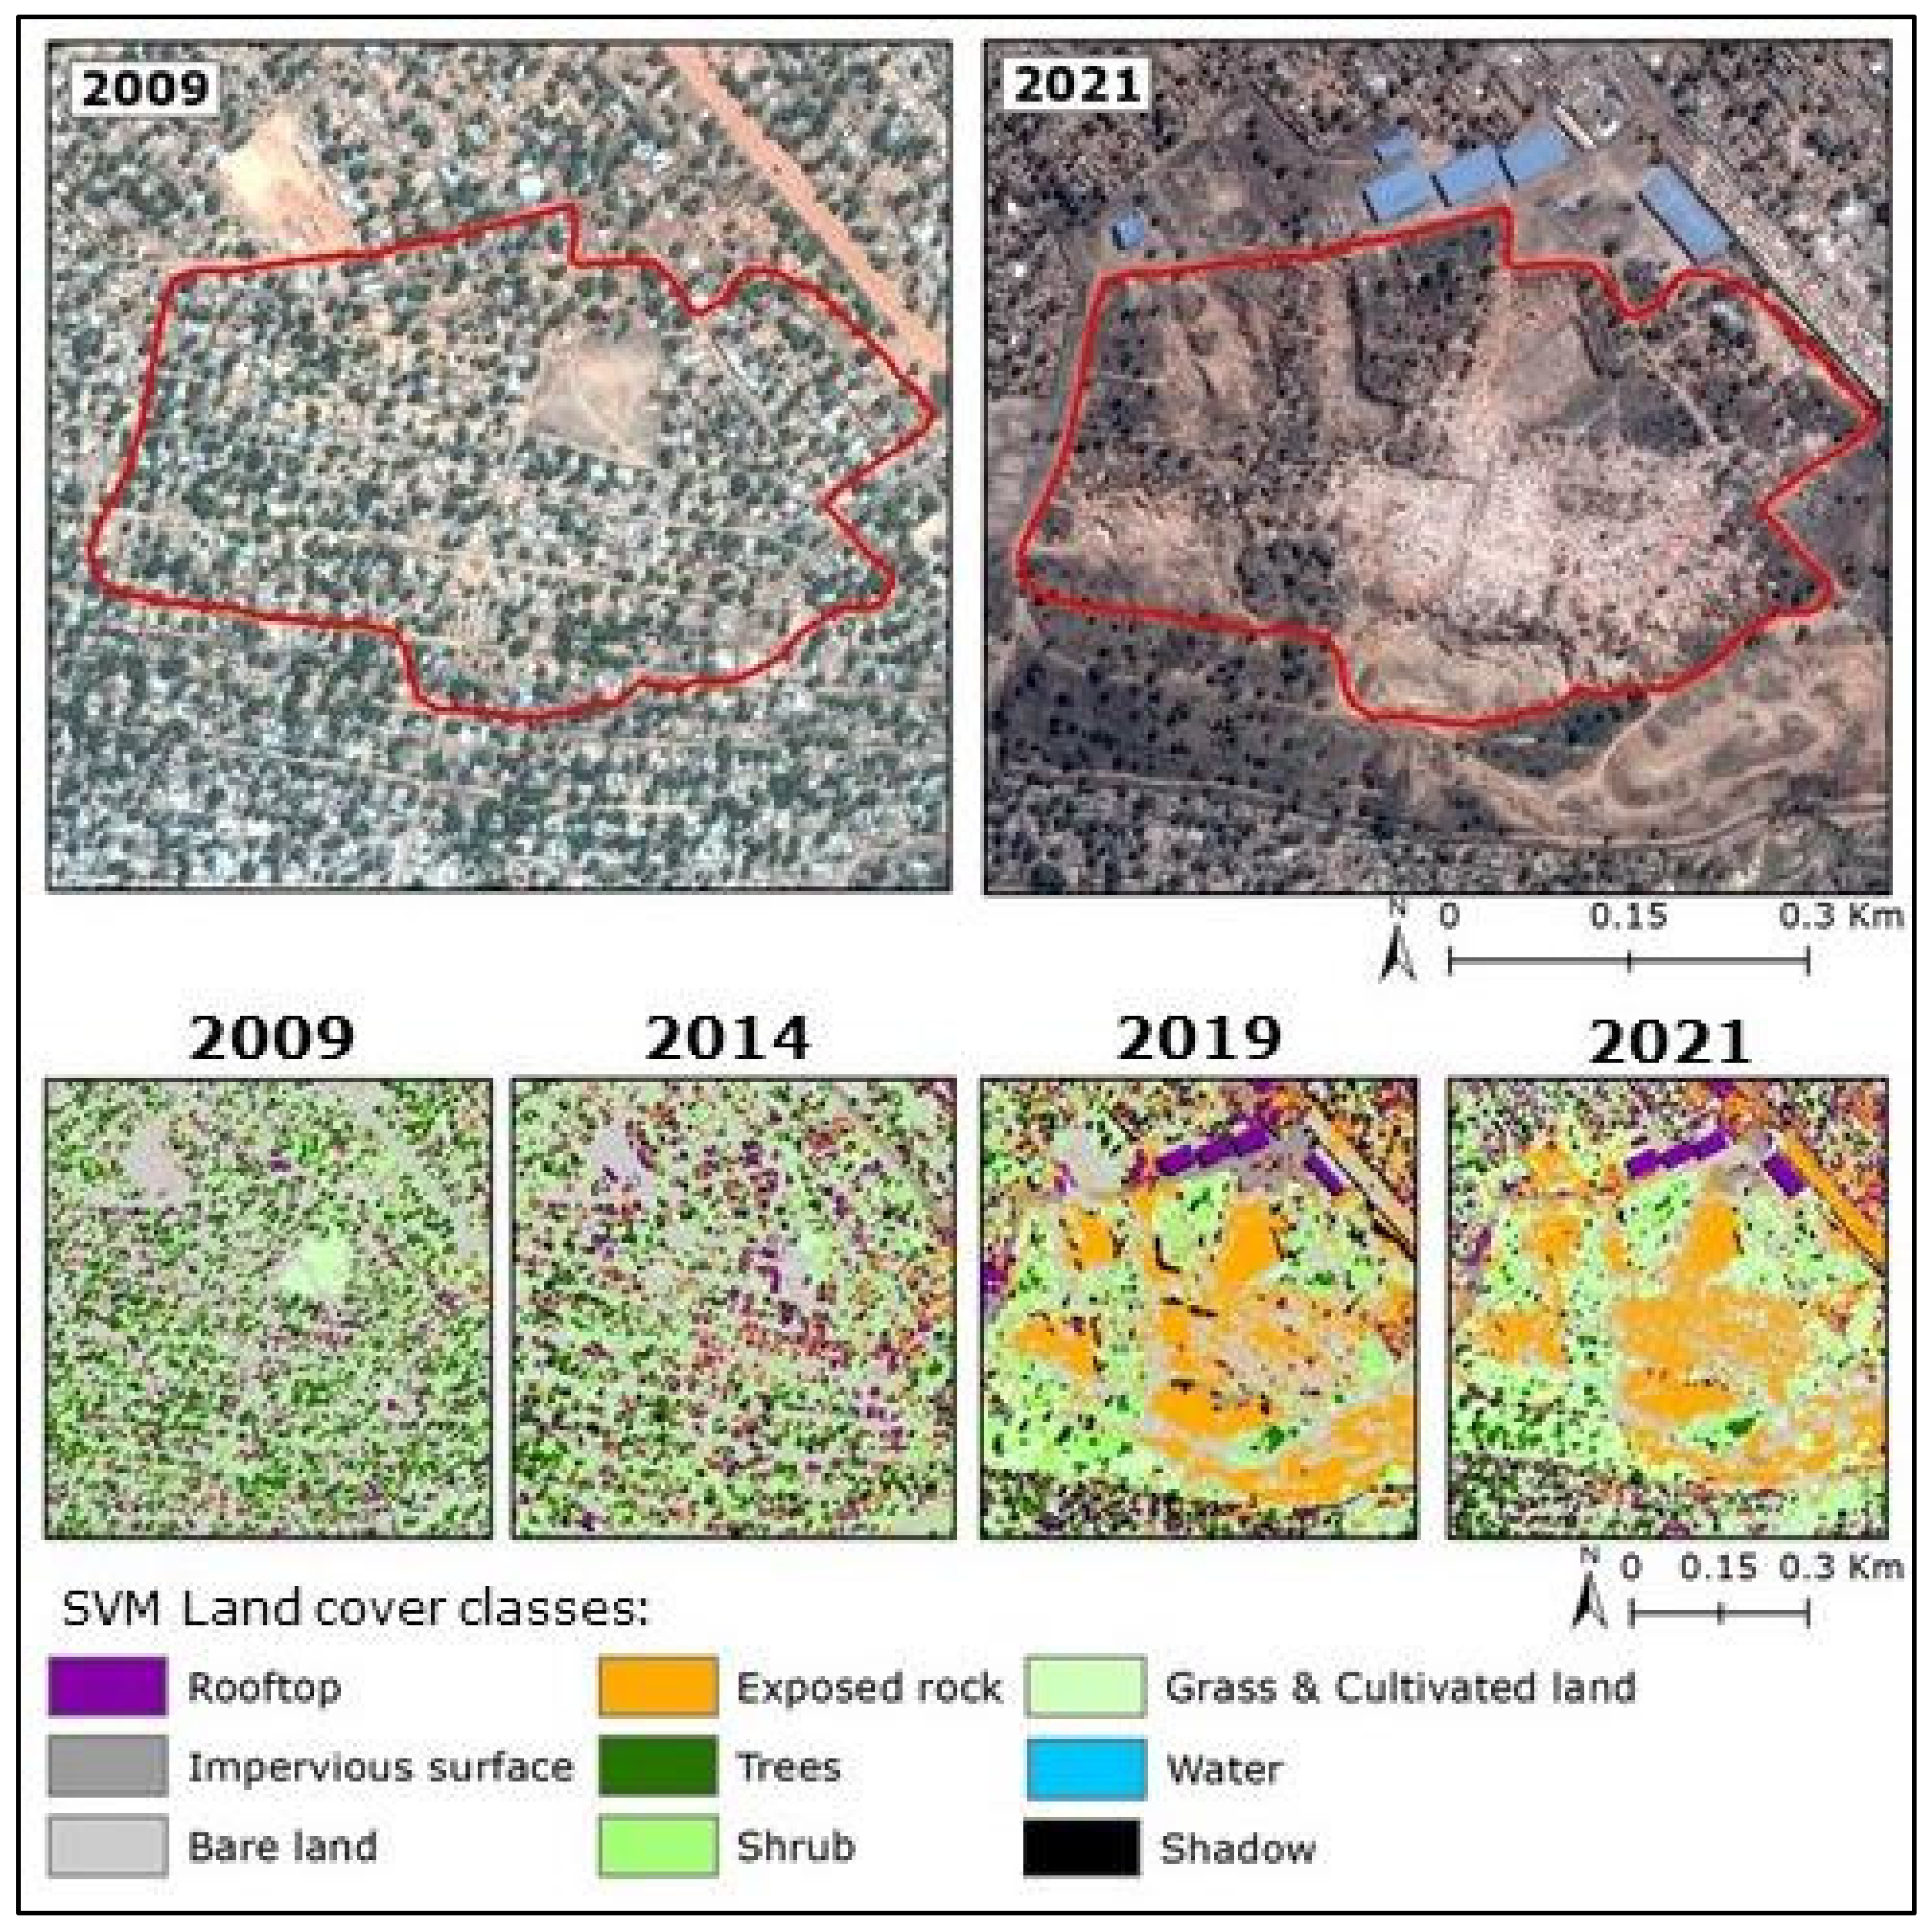
4.3. Case Study: Kasulo
4.4. Future Sustainable Resource Management
5. Conclusions
Author Contributions
Funding
Institutional Review Board Statement
Informed Consent Statement
Acknowledgments
Conflicts of Interest
References
- United Nations. Framework Convention on Climate Change. Conference of the Parties Serving as the Meeting of the Parties to the Paris Agreement. Glasgow Climate Pact. 2021. Available online: https://unfccc.int/sites/default/files/resource/cma2021_L16_adv.pdf (accessed on 23 May 2022).
- United Nations. Framework Convention on Climate Change. Adoption of the Paris Agreement. In Proceedings of the 21st Conference of the Parties, Paris, France, 30 November–11 December 2015; Available online: https://unfccc.int/resource/docs/2015/cop21/eng/l09r01.pdf (accessed on 23 May 2022).
- IPCC. Climate Change and Land: An IPCC Special Report on Climate Change, Desertification, Land Degradation, Sustainable Land Management, Food Security, and Greenhouse Gas Fluxes in Terrestrial Ecosystems; Shukla, P.R., Skea, J., Buendia, E.C., Masson-Delmotte, V., Pörtner, H.-O., Roberts, D.C., Zhai, P., Slade, R., Connors, S., van Diemen, R., et al., Eds.; IPCC: Geneva, Switzerland, 2019. [Google Scholar]
- IPCC. Climate Change 2021: The Physical Science Basis. In Contribution of Working Group I to the Sixth Assessment Report of the Intergovernmental Panel on Climate Change; Masson-Delmotte, V., Zhai, P., Pirani, A., Connors, S.L., Péan, C., Berger, S., Caud, N., Chen, Y., Goldfarb, L., Gomis, M.I., et al., Eds.; Cambridge University Press: Cambridge, UK; New York, NY, USA, 2021. [Google Scholar] [CrossRef]
- IPCC. Climate Change 2022: Impacts, Adaptation, and Vulnerability. In Contribution of Working Group II to the Sixth Assessment Report of the Intergovernmental Panel on Climate Change; Pörtner, H.-O., Roberts, D.C., Tignor, M., Poloczanska, E.S., Mintenbeck, K., Alegría, A., Craig, M., Langsdorf, S., Löschke, S., Möller, V., et al., Eds.; Cambridge University Press: Cambridge, UK, 2022. [Google Scholar]
- World Bank. Climate-Smart Mining: Minerals for Climate Action (Infographic). 2019. Available online: https://www.worldbank.org/en/news/infographic/2019/02/26/climate-smart-mining (accessed on 24 May 2022).
- Cobalt Institute. Cobalt Market Report 2021. 2022. Available online: https://www.cobaltinstitute.org/wp-content/uploads/2022/05/FINAL_Cobalt-Market-Report-2021_Cobalt-Institute-1.pdf (accessed on 24 May 2022).
- Energy Capital & Power. Africa Energy Series, DRC Special Report 2020. 2020. Available online: https://energycapitalpower.com/report/drc-special-report-2020/ (accessed on 31 May 2022).
- Diouf, A. Opinion: We Need to Change the Management of Natural Resources in the Democratic Republic of Congo, Business & Human Rights Resource Centre. 2018. Available online: https://www.business-humanrights.org/en/blog/we-need-to-change-the-management-of-natural-resources-in-the-democratic-republic-of-congo/ (accessed on 31 May 2022).
- Keowen, C. Rich in Resources, but Why is the Democratic Republic of the Congo Poor? The Borgen Project. 2017. Available online: https://borgenproject.org/why-is-the-democratic-republic-of-congo-poor/ (accessed on 31 May 2022).
- World Bank. The World Bank in DRC: Overview. 2022. Available online: https://www.worldbank.org/en/country/drc/overview#1 (accessed on 25 May 2022).
- Okenda, J.P. Democratic Republic of the Congo (DRC): Updated Assessment of the Impact of the Coronavirus Pandemic on the Extractive Sector and Resource Governance; Natural Resource Governance Institute: New York, NY, USA, 2020. [Google Scholar]
- International Monetary Fund. Democratic Republic of the Congo: Technical Assistance Report–Governance and Anti-Corruption Assessment; Country Report No. 2021/095; International Monetary Fund: Washington, DC, USA, 2021. [Google Scholar]
- Faber, B.; Krause, B.; de la Sierra, R.S. Artisanal Mining, Livelihoods, and Child Labor in the Cobalt Supply Chain of the Democratic Republic of Congo; Center for Effective Global Action: Berkeley, CA, USA, 2017. [Google Scholar]
- Sovacool, B.K. When subterranean slavery supports sustainability transitions? power, patriarchy, and child labor in artisanal Congolese cobalt mining. Extr. Ind. Soc. 2021, 8, 271–293. [Google Scholar] [CrossRef]
- Katz-Lavigne, S. Artisanal copper mining and conflict at the intersection of property rights and corporate strategies in the Democratic Republic of Congo. Extr. Ind. Soc. 2019, 6, 399–406. [Google Scholar] [CrossRef]
- Sanderson, H.; Hume, N.; Financial Times. Dozens Die on Congo Mine Accident. 2019. Available online: https://www.ft.com/content/aea51eb0-98c7-11e9-8cfb-30c211dcd229 (accessed on 1 May 2022).
- Lindberg, S.; Anderson, U. Blood Batteries, So High is the Price for the Technology of the Future. Available online: https://special.aftonbladet.se/blodsbatterier/ (accessed on 16 February 2020).
- Elenge, M.M.; De Brouwer, C. Identification of hazards in the workplaces of artisanal mining in Katanga. Int. J. Occup. Med. Environ. Health 2011, 24, 57–66. [Google Scholar] [CrossRef]
- Nwaila, G.T.; Ghorbani, Y.; Zhang, S.E.; Tolmay, L.C.; Rose, D.H.; Nwaila, P.C.; Bourdeau, J.E.; Frimmel, H.E. Valorisation of mine waste-Part II: Resource evaluation for consolidated and mineralised mine waste using the Central African Copperbelt as an example. J. Environ. Manag. 2021, 299, 113553. [Google Scholar] [CrossRef] [PubMed]
- Pourret, O.; Lange, B.; Bonhoure, J.; Colinet, G.; Decrée, S.; Mahy, G.; Séleck, M.; Shutcha, M.; Faucon, M.-P. Assessment of soil metal distribution and environmental impact of mining in Katanga (Democratic Republic of Congo). Appl. Geochem. 2016, 64, 43–55. [Google Scholar] [CrossRef]
- Smolders, E.; Roels, L.; Kuhangana, T.C.; Coorevits, K.; Vassilieva, E.; Nemery, B.; Nkulu, C.B.L. Unprecedentedly High Dust Ingestion Estimates for the General Population in a Mining District of DR Congo. Environ. Sci. Technol. 2019, 53, 7851–7858. [Google Scholar] [CrossRef]
- Nkulu, C.B.L.; Casas, L.; Haufroid, V.; De Putter, T.; Saenen, N.D.; Kayembe-Kitenge, T.; Obadia, P.M.; Wa Mukoma, D.K.; Ilunga, J.-M.L.; Nawrot, T.; et al. Sustainability of artisanal mining of cobalt in DR Congo. Nat. Sustain. 2018, 1, 495–504. [Google Scholar] [CrossRef] [PubMed]
- Cheyns, K.; Nkulu, C.B.L.; Ngombe, L.K.; Asosa, J.N.; Haufroid, V.; De Putter, T.; Nawrot, T.; Kimpanga, C.M.; Numbi, O.L.; Ilunga, B.K.; et al. Pathways of human exposure to cobalt in Katanga, a mining area of the D.R. Congo. Sci. Total Environ. 2014, 490, 313–321. [Google Scholar] [CrossRef] [PubMed]
- Banza, C.L.N.; Nawrot, T.S.; Haufroid, V.; Decrée, S.; De Putter, T.; Smolders, E.; Kabyla, B.I.; Luboya, O.N.; Ilunga, A.N.; Mutombo, A.M.; et al. High human exposure to cobalt and other metals in Katanga, a mining area of the Democratic Republic of Congo. Environ. Res. 2009, 109, 745–752. [Google Scholar] [CrossRef]
- OECD. Interconnected Supply Chains: A Comprehensive Look at Due Diligence Challenges and Opportunities SOURCING Cobalt and Copper from the Democratic Republic of the Congo. Available online: https://mneguidelines.oecd.org/interconnected-supply-chains-a-comprehensive-look-atdue-diligence-challenges-and-opportunities-sourcing-cobalt-and-copper-from-the-drc.htm (accessed on 4 April 2022).
- Amnesty International. “This is whatWe Die For”: Human Rights Abuses in the Democratic Republic of the Congo Power the Global Trade in Cobalt. 2016. Available online: https://www.amnesty.org/en/documents/afr62/3183/2016/en/ (accessed on 4 April 2022).
- Amnesty International. Time to Recharge: Corporate Action and Inaction to Tackle Abuses in the Cobalt Supply Chain. 2017. Available online: https://www.amnesty.org/en/documents/afr62/7395/2017/en/ (accessed on 4 April 2022).
- Crasford, A. Meet Dorsen, 8, Who Mines Cobalt to Make Your Smartphone Work. Sky News. 2017. Available online: https://news.sky.com/story/meet-dorsen-8-who-mines-cobalt-to-make-your-smartphone-work-10784120 (accessed on 3 June 2022).
- Niarchos, N. The Dark Side of Congo’s Cobalt Rush. The New Yorker. 2021. Available online: https://www.newyorker.com/magazine/2021/05/31/the-dark-side-of-congos-cobalt-rush (accessed on 23 May 2022).
- Guardian. “Is Your Phone Tainted by the Misery of the 35,000 Children in Congo’s Mines?”. 2019. Available online: https://www.theguardian.com/global-development/2018/oct/12/phone-misery-children-congo-cobalt-mines-drc (accessed on 22 May 2022).
- Financial Times. Congo, Child Labour and Your Electric Car. 2019. Available online: https://www.ft.com/content/c6909812-9ce4-11e9-9c06-a4640c9feebb (accessed on 22 May 2022).
- The Wall Street Journal. Despite Cleanup Vows, Smartphones and Electric Cars Still Keep Miners Digging by Hand in Congo. 2019. Available online: https://www.wsj.com/articles/smartphones-electric-cars-keep-miners-digging-by-hand-in-congo-1536835334 (accessed on 23 May 2022).
- Kavanagh, M.F. ‘This Is Our Land’. The New York Times. 2019. Available online: https://www.nytimes.com/2019/01/26/opinion/sunday/congo-mining-election-fraud.html (accessed on 23 May 2022).
- Walt, V.; Meyer, S. Blood, Sweat, and Batteries. Available online: https://pulitzercenter.org/reporting/blood-sweat-and-batteries (accessed on 21 May 2022).
- Glencore. 2019. Available online: https://www.glencore.com/media-and-insights/news/umicore-and-glencore-develop-partnership-for-sustainable-cobalt-supply-in-battery-materials (accessed on 10 April 2022).
- Rights and Accountability in Development (RAID) and Centre d’Aide Juridico-Judiciaire (CAJJ). The Road to Ruin? 2021. Available online: https://www.raid-uk.org/sites/default/files/report_road_to_ruin_evs_cobalt_workers_nov_2021.pdf (accessed on 20 May 2022).
- Pattisson, P. ‘Like Slave and Master’: DRC Miners Toil for 30p an Hour to Fuel Electric Cars. 2021. Available online: https://www.theguardian.com/global-development/2021/nov/08/cobalt-drc-miners-toil-for-30p-an-hour-to-fuel-electric-cars (accessed on 8 November 2021).
- United Nations. SDG 8: Promote Sustained, Inclusive and Sustainable Economic Growth, Full and Productive Employment and Decent Work for All. 2022. Available online: https://sdgs.un.org/goals/goal8 (accessed on 4 June 2022).
- Alliance 8.7. DRC Country Profile. 2022. Available online: https://www.alliance87.org/pathfinder_countries/democratic-republic-of-congo/ (accessed on 4 June 2022).
- Alliance 8.7. International Year for the Elimination of Child Labour: 5 Pledge Makers Against Child Labour in Mining. 2022. Available online: https://endchildlabour2021.org/5-pledge-makers-against-child-labour-in-mining/ (accessed on 4 June 2022).
- Bureau of International Labor Affairs. Combatting Child Labor in the Democratic Republic of the Congo’s Cobalt Industry (COTECCO). 2022. Available online: https://www.dol.gov/agencies/ilab/combatting-child-labor-democratic-republic-congos-cobalt-industry-cotecco (accessed on 4 June 2022).
- Skopeliti, C. UK Expected to Ban Sale of New Petrol and Diesel Cars From 2030. Guardian. 2020. Available online: https://www.theguardian.com/environment/2020/nov/14/uk-expected-to-ban-sale-of-new-petrol-and-diesel-cars-from-2030 (accessed on 4 June 2022).
- Kamga, M.A.; Nguemhe Fils, S.C.; Ayodele, M.O.; Olatubara, C.O.; Nzali, S.; Adenikinju, A.; Khalifa, M. Evaluation of land use/land cover changes due to gold mining activities from 1987 to 2017 using landsat imagery, East Cameroon. GeoJournal 2020, 85, 1097–1114. [Google Scholar] [CrossRef]
- Obodai, J.; Adjei, K.A.; Odai, S.N.; Lumor, M. Land use/land cover dynamics using landsat data in a gold mining basin-the Ankobra, Ghana. Remote Sens. Appl. Soc. Environ. 2018, 13, 247–256. [Google Scholar] [CrossRef]
- Ngom, N.M.; Mbaye, M.; Baratoux, D.; Catry, T.; Dessay, N.; Faye, G.; Sow, E.H.; Delaitre, E. Mapping Artisanal and Small-Scale Gold Mining in Senegal Using Sentinel 2 Data. GeoHealth 2020, 4, e2020GH000310. [Google Scholar] [CrossRef]
- DeWitt, J.D.; Chirico, P.G.; Bergstresser, S.E.; Warner, T.A. Multi-scale 46-year remote sensing change detection of diamond mining and land cover in a conflict and post-conflict setting. Remote Sens. Appl. Soc. Environ. 2017, 8, 126–139. [Google Scholar] [CrossRef]
- Dupin, L.; Nkono, C.; Burlet, C.; Muhashi, F.; Vanbrabant, Y. Land Cover Fragmentation Using Multi-Temporal Remote Sensing on Major Mine Sites in Southern Katanga (Democratic Republic of Congo). Adv. Remote Sens. 2013, 2, 127–139. [Google Scholar] [CrossRef][Green Version]
- Kranz, O.; Lang, S.; Schoepfer, E. 2.5D change detection from satellite imagery to monitor small-scale mining activities in the Democratic Republic of the Congo. Int. J. Appl. Earth Obs. Geoinf. ITC J. 2017, 61, 81–91. [Google Scholar] [CrossRef]
- Kusimi, J.M. Assessing land use and land cover change in the Wassa West District of Ghana using remote sensing. GeoJournal 2008, 71, 249–259. [Google Scholar] [CrossRef]
- Elmes, A.; Ipanaqué, J.G.Y.; Rogan, J.; Cuba, N.; Bebbington, A. Mapping licit and illicit mining activity in the Madre de Dios region of Peru. Remote Sens. Lett. 2014, 5, 882–891. [Google Scholar] [CrossRef]
- Myint, S.W.; Gober, P.; Brazel, A.; Grossman-Clarke, S.; Weng, Q. Per-pixel vs. object-based classification of urban land cover extraction using high spatial resolution imagery. Remote Sens. Environ. 2011, 115, 1145–1161. [Google Scholar] [CrossRef]
- Qian, Y.; Zhou, W.; Yan, J.; Li, W.; Han, L. Comparing machine learning classifiers for object-based land cover classification using very high resolution imagery. Remote Sens. 2014, 7, 153–168. [Google Scholar] [CrossRef]
- Thanh Noi, P.; Kappas, M. Comparison of Random Forest, k-Nearest Neighbor, and Support Vector Machine Classifiers for Land Cover Classification Using Sentinel-2 Imagery. Sensors 2018, 18, 18. [Google Scholar] [CrossRef]
- Atibu, E.K.; Oliveira, J.M.; Malta, M.; Santos, M.; Mulaji, C.K.; Mpiana, P.T.; Carvalho, F.P. Assessment of Natural Radioactivity in Rivers Sediment and Soil from the Copper Belt Artisanal Mining Region, Democratic Republic of the Congo. J. Geosci. Environ. Prot. 2021, 9, 1–20. [Google Scholar] [CrossRef]
- Mthembu-Salter, G. Natural Resource Governance, Boom and Bust: The Case of Kolwezi in the DRC; South African Institute of International Affairs: Johannesburg, South Africa, 2009. [Google Scholar]
- Faucon, M.-P.; Le Stradic, S.; Boisson, S.; Ilunga, E.I.W.; Séleck, M.; Lange, B.; Guillaume, D.; Shutcha, M.N.; Pourret, O.; Meerts, P.; et al. Implication of plant-soil relationships for conservation and restoration of copper-cobalt ecosystems. Plant Soil 2016, 403, 153–165. [Google Scholar] [CrossRef]
- Rouse, J.W.; Haas, R.H.; Schell, J.A.; Deering, D.W. Monitoring vegetation systems in the Great Plains with ERTS. NASA Spec. Publ. 1974, 351, 309. [Google Scholar]
- McFeeters, S.K. The use of the Normalized Difference Water Index (NDWI) in the delineation of open water features. Int. J. Remote Sens. 1996, 17, 1425–1432. [Google Scholar] [CrossRef]
- Hijmans, R.J. Raster: Geographic Data Analysis and Modeling; R Package Version 3.0-2; The R Project for Statistical Computing: Vienna, Austria, 2019. [Google Scholar]
- Liu, D.; Xia, F. Assessing object-based classification: Advantages and limitations. Remote Sens. Lett. 2010, 1, 187–194. [Google Scholar] [CrossRef]
- Tian, J.; Chen, D.M. Optimization in multi-scale segmentation of high-resolution satellite images for artificial feature recognition. Int. J. Remote Sens. 2007, 28, 4625–4644. [Google Scholar] [CrossRef]
- ENVI. ENVI-Zoom; ENVI User Guide; ITT: Denver, CO, USA, 2010. [Google Scholar]
- Petropoulos, G.P.; Kalaitzidis, C.; Vadrevu, K.P. Support vector machines and object-based classification for obtaining land-use/cover cartography from Hyperion hyperspectral imagery. Comput. Geosci. 2012, 41, 99–107. [Google Scholar] [CrossRef]
- United Nations Environment Programme. Sustainability Reporting in the Mining Sector. Current Status and Future Trends. 2020. Available online: https://www.unep.org/resources/report/sustainability-reporting-mining-sector (accessed on 10 May 2022).
- World Economic Forum. Mapping Mining to the Sustainable Empowered Lives. Resilient Nations. Development Goals: An Atlas. 2016. Available online: https://www.undp.org/publications/mapping-mining-sdgs-atlas (accessed on 10 May 2022).
- Glencore. Annual Report 2017. 2017. Available online: https://www.annualreports.com/HostedData/AnnualReportArchive/g/LSE_GLEN_2017.pdf (accessed on 12 May 2022).
- Hu, T. Analysts Expect Long-Term Cobalt Price Support in China Amid Stockpiling Reports. S&P Global Market Intelligence. 2020. Available online: https://www.spglobal.com/marketintelligence/en/news-insights/latest-news-headlines/analysts-expect-long-term-cobalt-price-support-in-china-amid-stockpiling-reports-60543257 (accessed on 12 May 2022).
- Trading Economic. Cobalt 2022 Data-2010–2021 Historical-2023 Forecast-Price-Quote–Chart. Available online: https://tradingeconomics.com/commodity/cobalt (accessed on 11 May 2022).
- Blacksmith Institute. The World’s Worst Polluted Places: The Top Ten of the Dirty Thirty; Final Report; Blacksmith Institute: New York, NY, USA, 2007. [Google Scholar]
- D’Souza, K. Artisanal Mining in the DRC: Key Issues, Challenges and Opportunities; Communities and Small-Scale Mining; World Bank: Washington, DC, USA, 2007. [Google Scholar]
- Muimba-Kankolongo, A.; Nkulu, C.B.L.; Mwitwa, J.; Kampemba, F.M.; Nabuyanda, M.M.; Haufroid, V.; Smolders, E.; Nemery, B. Contamination of water and food crops by trace elements in the African Copperbelt: A collaborative cross-border study in Zambia and the Democratic Republic of Congo. Environ. Adv. 2021, 6, 100103. [Google Scholar] [CrossRef]
- World Health Organization. Guidelines for Drinking-Water Quality: First Addendum to the Fourth Edition. 2017. Available online: https://www.who.int/publications/i/item/9789241549950 (accessed on 5 May 2022).
- Nemery, B.; Nkulu, C.B.L. Assessing exposure to metals using biomonitoring: Achievements and challenges experienced through surveys in low-and middle-income countries. Toxicol. Lett. 2018, 298, 13–18. [Google Scholar] [CrossRef]
- Lison, D. Cobalt. In Handbook on the Toxicology of Metals; Academic Press: Cambridge, MA, USA, 2015; pp. 743–763. [Google Scholar]
- Van Brusselen, D.; Kayembe-Kitenge, T.; Mbuyi-Musanzayi, S.; Kasole, T.L.; Ngombe, L.K.; Obadia, P.M.; Mukoma, D.K.; Van Herck, K.; Avonts, D.; Devriendt, K.; et al. Metal mining and birth defects: A case-control study in Lubumbashi, Democratic Republic of the Congo. Lancet Planet. Health 2020, 4, e158–e167. [Google Scholar] [CrossRef]
- Obadia, P.M.; Kayembe-Kitenge, T.; Haufroid, V.; Nkulu, C.B.L.; Nemery, B. Preeclampsia and blood lead (and other metals) in Lubumbashi, DR Congo. Environ. Res. 2018, 167, 468–471. [Google Scholar] [CrossRef] [PubMed]
- Malpede, M. The Dark Side of Batteries: Education and Cobalt Mining in the Democratic Republic of the Congo. 2021. Available online: https://papers.ssrn.com/sol3/papers.cfm?abstract_id=3680730 (accessed on 5 May 2022).
- Mwitwa, J.; German, L.; Muimba-Kankolongo, A.; Puntodewo, A. Governance and sustainability challenges in landscapes shaped by mining: Mining-forestry linkages and impacts in the Copper Belt of Zambia and the DR Congo. For. Policy Econ. 2012, 25, 19–30. [Google Scholar] [CrossRef]
- Vick, S.G. Planning, Design, and Analysis of Tailings Dams; BiTech Publishers Ltd.: Richmond, BC, Canada, 1990. [Google Scholar]
- Hofmann, U.; Juergensen, O. Leaving No One Behind: Mine Action and the Sustainable Development Goals, GICHD–UNDP, Geneva, June 2017; ISBN: 978-2-940369-60-7. 2017. Available online: https://www.gichd.org/fileadmin/GICHD-resources/rec-documents/Leaving_no_one_behind-Mine_Action_and_SDGs.pdf (accessed on 5 May 2022).
- Brown, C.; Daniels, A.; Boyd, D.; Sowter, A.; Foody, G.; Kara, S. Investigating the Potential of Radar Interferometry for Monitoring Rural Artisanal Cobalt Mines in the Democratic Republic of the Congo. Sustainability 2020, 12, 9834. [Google Scholar] [CrossRef]


| Satellite | Acquisition Date | Spatial Resolution | Spectral Bands |
|---|---|---|---|
| GeoEye-1 | 7 July 2009 | 0.46 m (Panchromatic) | Panchromatic: 450–800 nm Blue: 450–510 nm |
| Green: 510–580 nm | |||
| Red: 655–690 nm | |||
| Near Infrared: 780–920 nm | |||
| Pléiades | 16 May 2014 | 0.5 m (Panchromatic) | Panchromatic: 480–830 nm Blue: 430–550 nm |
| Green: 490–610 nm | |||
| Red: 600–720 nm | |||
| Near Infrared: 750–950 nm | |||
| WorldView-2 | 25 June 2019 | 0.46 m (Panchromatic) | Coastal blue: 400–450 nm Blue: 450–510 nm |
| Green: 510–580 nm | |||
| Yellow: 585–625 nm | |||
| Red: 630–690 nm | |||
| Red-edge:705–745 nm | |||
| Near Infrared 1: 770–895 nm | |||
| Near Infrared 2: 860–1040 nm | |||
| Pléiades | 30 July 2021 | 0.5 m (Panchromatic) | Panchromatic: 480–830 nm Blue: 430–550 nm |
| Green: 490–610 nm | |||
| Red: 600–720 nm | |||
| Near Infrared: 750–950 nm |
| Class | Description |
|---|---|
| Rooftop | Includes: metal, clay, concreate building materials |
| Impervious surface | Includes: asphalt, low-albedo surfaces |
| Bare land | Includes: dirt track, construction sites, sediment deposits, bare soil |
| Exposed rock | Includes: mine pits, rock piles, tailings, smelt waste, natural rockslides |
| Trees | Includes: mature tree growth |
| Shrub | Includes: woody shrub species |
| Grass and Cultivated land | Includes: mixed grassland, cultivate land, low-cover herbaceous species |
| Water | Includes: rivers, lakes, ponds, water retention areas, streams |
| Shadow | Includes: shadowed areas |
| Glare | Includes: bright solar reflection |
| Feature | Description |
|---|---|
| Open-pit | Includes: uniform, terraced platform structures |
| Surface | Includes: artisanal surface mines (irregular lunar surface texture); storage areas of excavated minerals or earth, for example: ore, tailings, smelt waste, or gangue material from mineral processing |
| Tunnel | Includes: locations with tunnel mine entrances (1–2 m in diameter) and/or pink tarp tents (covering tunnel mine entrances) |
| 2009 | 2014 | 2019 | 2021 | |||||
|---|---|---|---|---|---|---|---|---|
| Classes | Area (km2) | % Area | Area (km2) | % Area | Area (km2) | % Area | Area (km2) | % Area |
| Rooftop | 5.23 | 1.49 | 9.82 | 2.85 | 10.19 | 2.89 | 12.93 | 3.66 |
| Impervious surface | 3.20 | 0.91 | 2.20 | 0.64 | 4.78 | 1.36 | 6.55 | 1.86 |
| Bare land | 39.60 | 11.23 | 38.03 | 11.05 | 49.55 | 14.06 | 73.41 | 20.8 |
| Exposed rock | 48.86 | 13.86 | 51.60 | 14.99 | 68.38 | 19.4 | 76.32 | 21.63 |
| Trees | 7.61 | 2.16 | 10.53 | 3.06 | 10.05 | 2.85 | 7.27 | 2.06 |
| Shrub | 67.75 | 19.22 | 123.12 | 35.76 | 69.80 | 19.8 | 41.71 | 11.82 |
| Grass and Cultivated land | 168.59 | 47.82 | 96.33 | 27.99 | 124.79 | 35.41 | 122.94 | 34.84 |
| Water | 9.49 | 2.69 | 8.53 | 2.48 | 5.76 | 1.64 | 6.21 | 1.76 |
| Shadow | 2.16 | 0.61 | 4.05 | 1.18 | 8.83 | 2.51 | 5.43 | 1.54 |
| Glare | 0.04 | 0.01 | 0.00 | 0 | 0.30 | 0.08 | 0.10 | 0.03 |
| Year | Overall Accuracy Score (%) |
|---|---|
| 2009 | 90.4 |
| 2014 | 85.2 |
| 2019 | 89.4 |
| 2021 | 90.2 |
| Year | Mine Type | Number | Mean Area (km2) | Minimum Area (km2) | Maximum Area (km2) |
|---|---|---|---|---|---|
| 2009 | Open-Pit | 3 | 0.53 | 0.02 | 1.39 |
| Surface | 183 | 0.18 | 0.0002 | 3.97 | |
| Tunnel | 24 | 0.03 | 0.00005 | 0.12 | |
| 2021 | Open-Pit | 7 | 1.49 | 0.05 | 4.12 |
| Surface | 177 | 0.21 | 0.001 | 3.03 | |
| Tunnel | 41 | 0.09 | 0.00009 | 1.32 |
| Year | Land Cover Class | 500 m | 1 km |
|---|---|---|---|
| 2009 | Built-up | 46.2% | 64.4% |
| Water | 79.2% | 88.2% | |
| 2021 | Built-up | 45.7% | 71.6% |
| Water | 68.3% | 91.6% |
| Pollution Source |
|---|
|
Publisher’s Note: MDPI stays neutral with regard to jurisdictional claims in published maps and institutional affiliations. |
© 2022 by the authors. Licensee MDPI, Basel, Switzerland. This article is an open access article distributed under the terms and conditions of the Creative Commons Attribution (CC BY) license (https://creativecommons.org/licenses/by/4.0/).
Share and Cite
Brown, C.; Boyd, D.S.; Kara, S. Landscape Analysis of Cobalt Mining Activities from 2009 to 2021 Using Very High Resolution Satellite Data (Democratic Republic of the Congo). Sustainability 2022, 14, 9545. https://doi.org/10.3390/su14159545
Brown C, Boyd DS, Kara S. Landscape Analysis of Cobalt Mining Activities from 2009 to 2021 Using Very High Resolution Satellite Data (Democratic Republic of the Congo). Sustainability. 2022; 14(15):9545. https://doi.org/10.3390/su14159545
Chicago/Turabian StyleBrown, Chloe, Doreen S. Boyd, and Siddharth Kara. 2022. "Landscape Analysis of Cobalt Mining Activities from 2009 to 2021 Using Very High Resolution Satellite Data (Democratic Republic of the Congo)" Sustainability 14, no. 15: 9545. https://doi.org/10.3390/su14159545
APA StyleBrown, C., Boyd, D. S., & Kara, S. (2022). Landscape Analysis of Cobalt Mining Activities from 2009 to 2021 Using Very High Resolution Satellite Data (Democratic Republic of the Congo). Sustainability, 14(15), 9545. https://doi.org/10.3390/su14159545