Article

Effect of Rising Temperature and Carbon Dioxide on the Growth, Photophysiology, and Elemental Ratios of Marine Synechococcus: A Multistressor Approach

by
Samarpita Basu
1,* and
Katherine R. M. Mackey
1,2
1
Earth System Science, University of California Irvine, Irvine, CA 92697, USA
2
Ecology and Evolutionary Biology, University of California Irvine, Irvine, CA 92697, USA
*
Author to whom correspondence should be addressed.
Sustainability 2022, 14(15), 9508; https://doi.org/10.3390/su14159508
Submission received: 9 June 2022 / Revised: 20 July 2022 / Accepted: 30 July 2022 / Published: 3 August 2022
(This article belongs to the Topic Climate Change and Environmental Sustainability)

Abstract

:
Marine picocyanobacteria belonging to the genus Synechococcus are one of the most abundant photosynthetic organisms on Earth. They are often exposed to large fluctuations in temperature and CO2 concentrations in the ocean, which are expected to further change in the coming decades due to ocean acidification and warming resulting from rising atmospheric CO2 levels. To decipher the effect of changing temperature and CO2 levels on Synechococcus, six Synechococcus strains previously isolated from various coastal and open ocean sites were exposed to a matrix of three different temperatures (22 °C, 24 °C and 26 °C) and CO2 levels (400 ppm, 600 ppm and 800 ppm). Thereafter, the specific growth rates, photophysiological parameters (σPSII and Fv/Fm), C/N (mol/mol) ratios and the nitrogen stable isotopic composition (δ15N (‰)) of the strains were measured. Temperature was found to be a stronger driver of the changes in specific growth rates and photophysiology in the Synechococcus strains. Carbon-concentrating mechanisms (CCM) operational in these strains that shield the photosynthetic machinery from directly sensing ambient changes in CO2 possibly played a major role in causing minimal changes in the specific growth rates under the varying CO2 levels.

1. Introduction

Fossil fuel burning, tropical deforestation and altered land use have resulted in drastic increases in atmospheric CO2 levels, from 280 ppm before the Industrial Revolution [1] to a present-day level of 421 ppm [2], and the level is further expected to reach up to 800–1000 ppm by the end of this century [3]. Oceans serve as a major sink for atmospheric CO2 and currently account for the removal of nearly one third of the anthropogenically generated CO2 [3]. The dissolution of CO2 in the ocean results in the formation of carbonic acid and leads to ocean acidification, which has already caused a 0.1 pH unit decline since the end of the Industrial Revolution [3], and is predicted to continue to lower pH by an additional 0.2 to 0.3 pH units by the end of the century [4]. The atmospheric CO2 increase also results in an increase in the average global air temperature, subsequently causing ocean warming [5]. This is evident from an increase in the global average surface temperature of the ocean by 0.6 ± 0.2 °C over the last century [6]. Predictive models further suggest that climate warming will increase the surface temperature of the ocean by 1–7 °C by the year 2100 [5]. This will induce stratification and shoaling of the upper mixed layer (UML), thereby restricting the injection of nutrients from deeper layers, and will also increase the average irradiance exposure to photosynthetic phytoplankton, such as picocyanobacteria dwelling in the UML [1].
Marine picocyanobacteria are the most abundant oxygenic photosynthetic organisms on Earth [7]. Despite being small (<2 µm diameter) and unicellular, they contribute up to 40–80% of the gross primary production in tropical and subtropical seas [7]. Two genera of picocyanobacteria, Prochlorococcus and Synechococcus, numerically dominate most oceanic waters, occupying complementary though overlapping niches [8]. The focus of our study was on the picocyanobacteria, Synechococcus, which has an extensive oceanic distribution, ranging from coastal to open ocean habitats that extend deep into temperate climate zones [8,9]. They are 0.6–2 µm in diameter and possess light-harvesting pigment–protein complexes called phycobilisomes [10,11]. As a component of the picophytoplankton, Synechococcus accounts for 40% of global ocean primary productivity and can be temporally or regionally important contributors to carbon fixation owing to their seasonal dominance [12,13].
In spite of their significant role in the biogeochemical cycling of carbon, very little is known about the growth and physiological response of Synechococcus to future global change, such as the concomitant rise in CO2 and temperature, and, to date, only one laboratory study has investigated the combined effect of temperature and CO2 on a strain of Synechococcus (strain WH7803) [5]. Another laboratory study by Bao and Gao [14] showed the interactive effect of elevated CO2 concentration and light on the Synechococcus strain WH7803. In fact, most ocean acidification studies to date have focused on the bloom-forming diazotrophic cyanobacteria, Trichodesmium [15,16,17,18], other diazotrophic cyanobacteria, such as Cyanothece sp., Nodularia sp., Calothrix sp. and Crocosphaera sp. [19,20], diatoms, such as Phaeodactylum sp., Thalassiosira sp. and Skeletonema sp. [3,21,22], and the coccolithophore, Emiliania huxleyi [23,24]. Additionally, studies have been conducted on the green alga, Ulva fasciata [25,26], to determine ocean-acidification-induced changes in the alga for its application in aquaculture. Ocean acidification studies have also been conducted on various natural phytoplankton communities. For instance, Keys et al. [27] studied the effect of elevated CO2 and temperature on the autumn phytoplankton community in the western English Channel. Lomas et al. [28] studied the short-term physiological and acclimation responses of natural picocyanobacteria populations in the subtropical North Atlantic to changes in oceanic partial pressure of CO2 (pCO2). Similarly, Paulino et al. [24] reported the transient population dynamic response of an osmotrophic community in mesocosms exposed to different pCO2 levels. However, such incubation experiments use oceanographic techniques that measure characteristics of entire phytoplankton communities rather than individual taxa, which limits their ability to detect potential ecological responses to CO2 variation at the taxon level [29]. Lab culture studies, on the other hand, facilitate investigation of global change effects, such as ocean acidification and increased temperature, on organisms at the species or strain level, thereby enabling the elucidation of carbonate system-driven changes in growth rates and elemental composition of individual picocyanobacteria strains [5]. Therefore, culture studies can shed light on how global change will affect the succession and dominance of individual picocyanobacteria strains in the future ocean and how this will, in turn, influence marine food web structure and the ocean’s biological carbon pump [5,30]. The biological carbon pump plays a key role in the global carbon cycle by transporting carbon from the atmosphere to the deep sea, where it is concentrated and sequestered for centuries. Hence, the biological carbon pump takes carbon out of contact with the atmosphere for long periods and maintains atmospheric CO2 at significantly lower levels than would be the case if it did not exist [30,31].
Because oceanic pCO2 (partial pressure of CO2) and temperature affect picocyanobacteria simultaneously in natural populations, it is important to understand if their interactive effects are additive, synergistic or antagonistic. In line with this, the ocean acidification research community has identified the necessity for studying multiple-driver impacts on marine organisms and ecosystems [32]. Therefore, in the present study, the effect of concomitant changes in CO2 and temperature (predicted to co-occur by the year 2100) were investigated on the specific growth rate, photophysiology and elemental composition of six Synechococcus strains isolated from various coastal and open ocean sites. King et al. [21] characterized seven coastal and oceanic phytoplankton species using CO2 manipulation experiments and studied their specific growth rates under varying pCO2 levels. They suggested that specific growth rate is a strong determining factor in the context of phytoplankton community structure and the projected success of species under different CO2 levels, and thus can be considered as a metric of evolutionary fitness. Therefore, the present study aimed at determining the specific growth rates of the Synechococcus strains under concomitant changes in pCO2 and temperature. Additionally, because phytoplankton, including picocyanobacteria, provide organic matter to support the marine food web, the elemental composition of phytoplankton is of key importance to consumers, such as copepods, fish and shrimp [3,21,33]. Slight changes in the nutritional quality of phytoplankton (such as a higher C:N ratio) can result in reduced growth rates and fecundity at higher trophic levels [21]. Therefore, one of the goals of the present study was to determine the elemental composition of the Synechococcus strains under varying levels of pCO2 and temperature. Furthermore, Synechococcus strains encompassing both coastal and open ocean habitats were used in this study because coastal isolates often experience large diel/seasonal pCO2 fluctuations as compared to oceanic isolates owing to coastal upwelling of high pCO2 waters and low pCO2 post-bloom periods [21], and so they might respond differently to pCO2 and temperature variations than their oceanic counterparts. Studying the effect of ocean acidification on both coastal and oceanic isolates of picocyanobacteria might enable us to understand the potential variability in oceanic primary production on various temporal and spatial scales in the future ocean.

2. Materials and Methods

2.1. Strains and Culturing Conditions

Synechococcus strains WH7803, WH8020, WH8102 and WH8109 were provided by the Waterbury and Mincer laboratories at the Woods Hole Oceanographic Institution, and the Synechococcus strains RCC 555 and RCC 2673 were provided by the Roscoff Culture Collection, France. The taxonomy and isolation site for the strains are outlined in Table 1. The cultures were maintained in dilute, semi-continuous batch culture in a temperature-controlled walk-in incubator (22 °C) under continuous cool-white light provided by fluorescent (Vita-Brite, model F32T8) and LED light bulbs (Commercial Electric, model E351861). Modified SN medium [34] was used in this study, which consisted of the following nutrients and trace metals (L−1): 9 mM NaNO3, 0.099 mM K2HPO4, 0.015 mM EDTA disodium salt, 0.1 mM Na2CO3, 0.738 nM cyanocobalamin (vitamin B12), 0.0325 mM citric acid, 0.0117 mM FeCl3, 7.08 µM MnCl2, 1.61 µM Na2MoO4, 0.772 µM ZnSO4 and 0.0859 µM CoCl2. To prepare the culture media, 75% coastal seawater (collected from Kerckhoff Marine Laboratory, Newport Beach, CA) and 25% Milli Q water were mixed in a polycarbonate bottle and filtered through 0.2 µm filter (Corning 431174). This mixture was sterilized using a microwave prior to use. The mixture was allowed to cool and, thereafter, filter-sterilized SN media nutrients were added to the sterilized seawater aseptically.

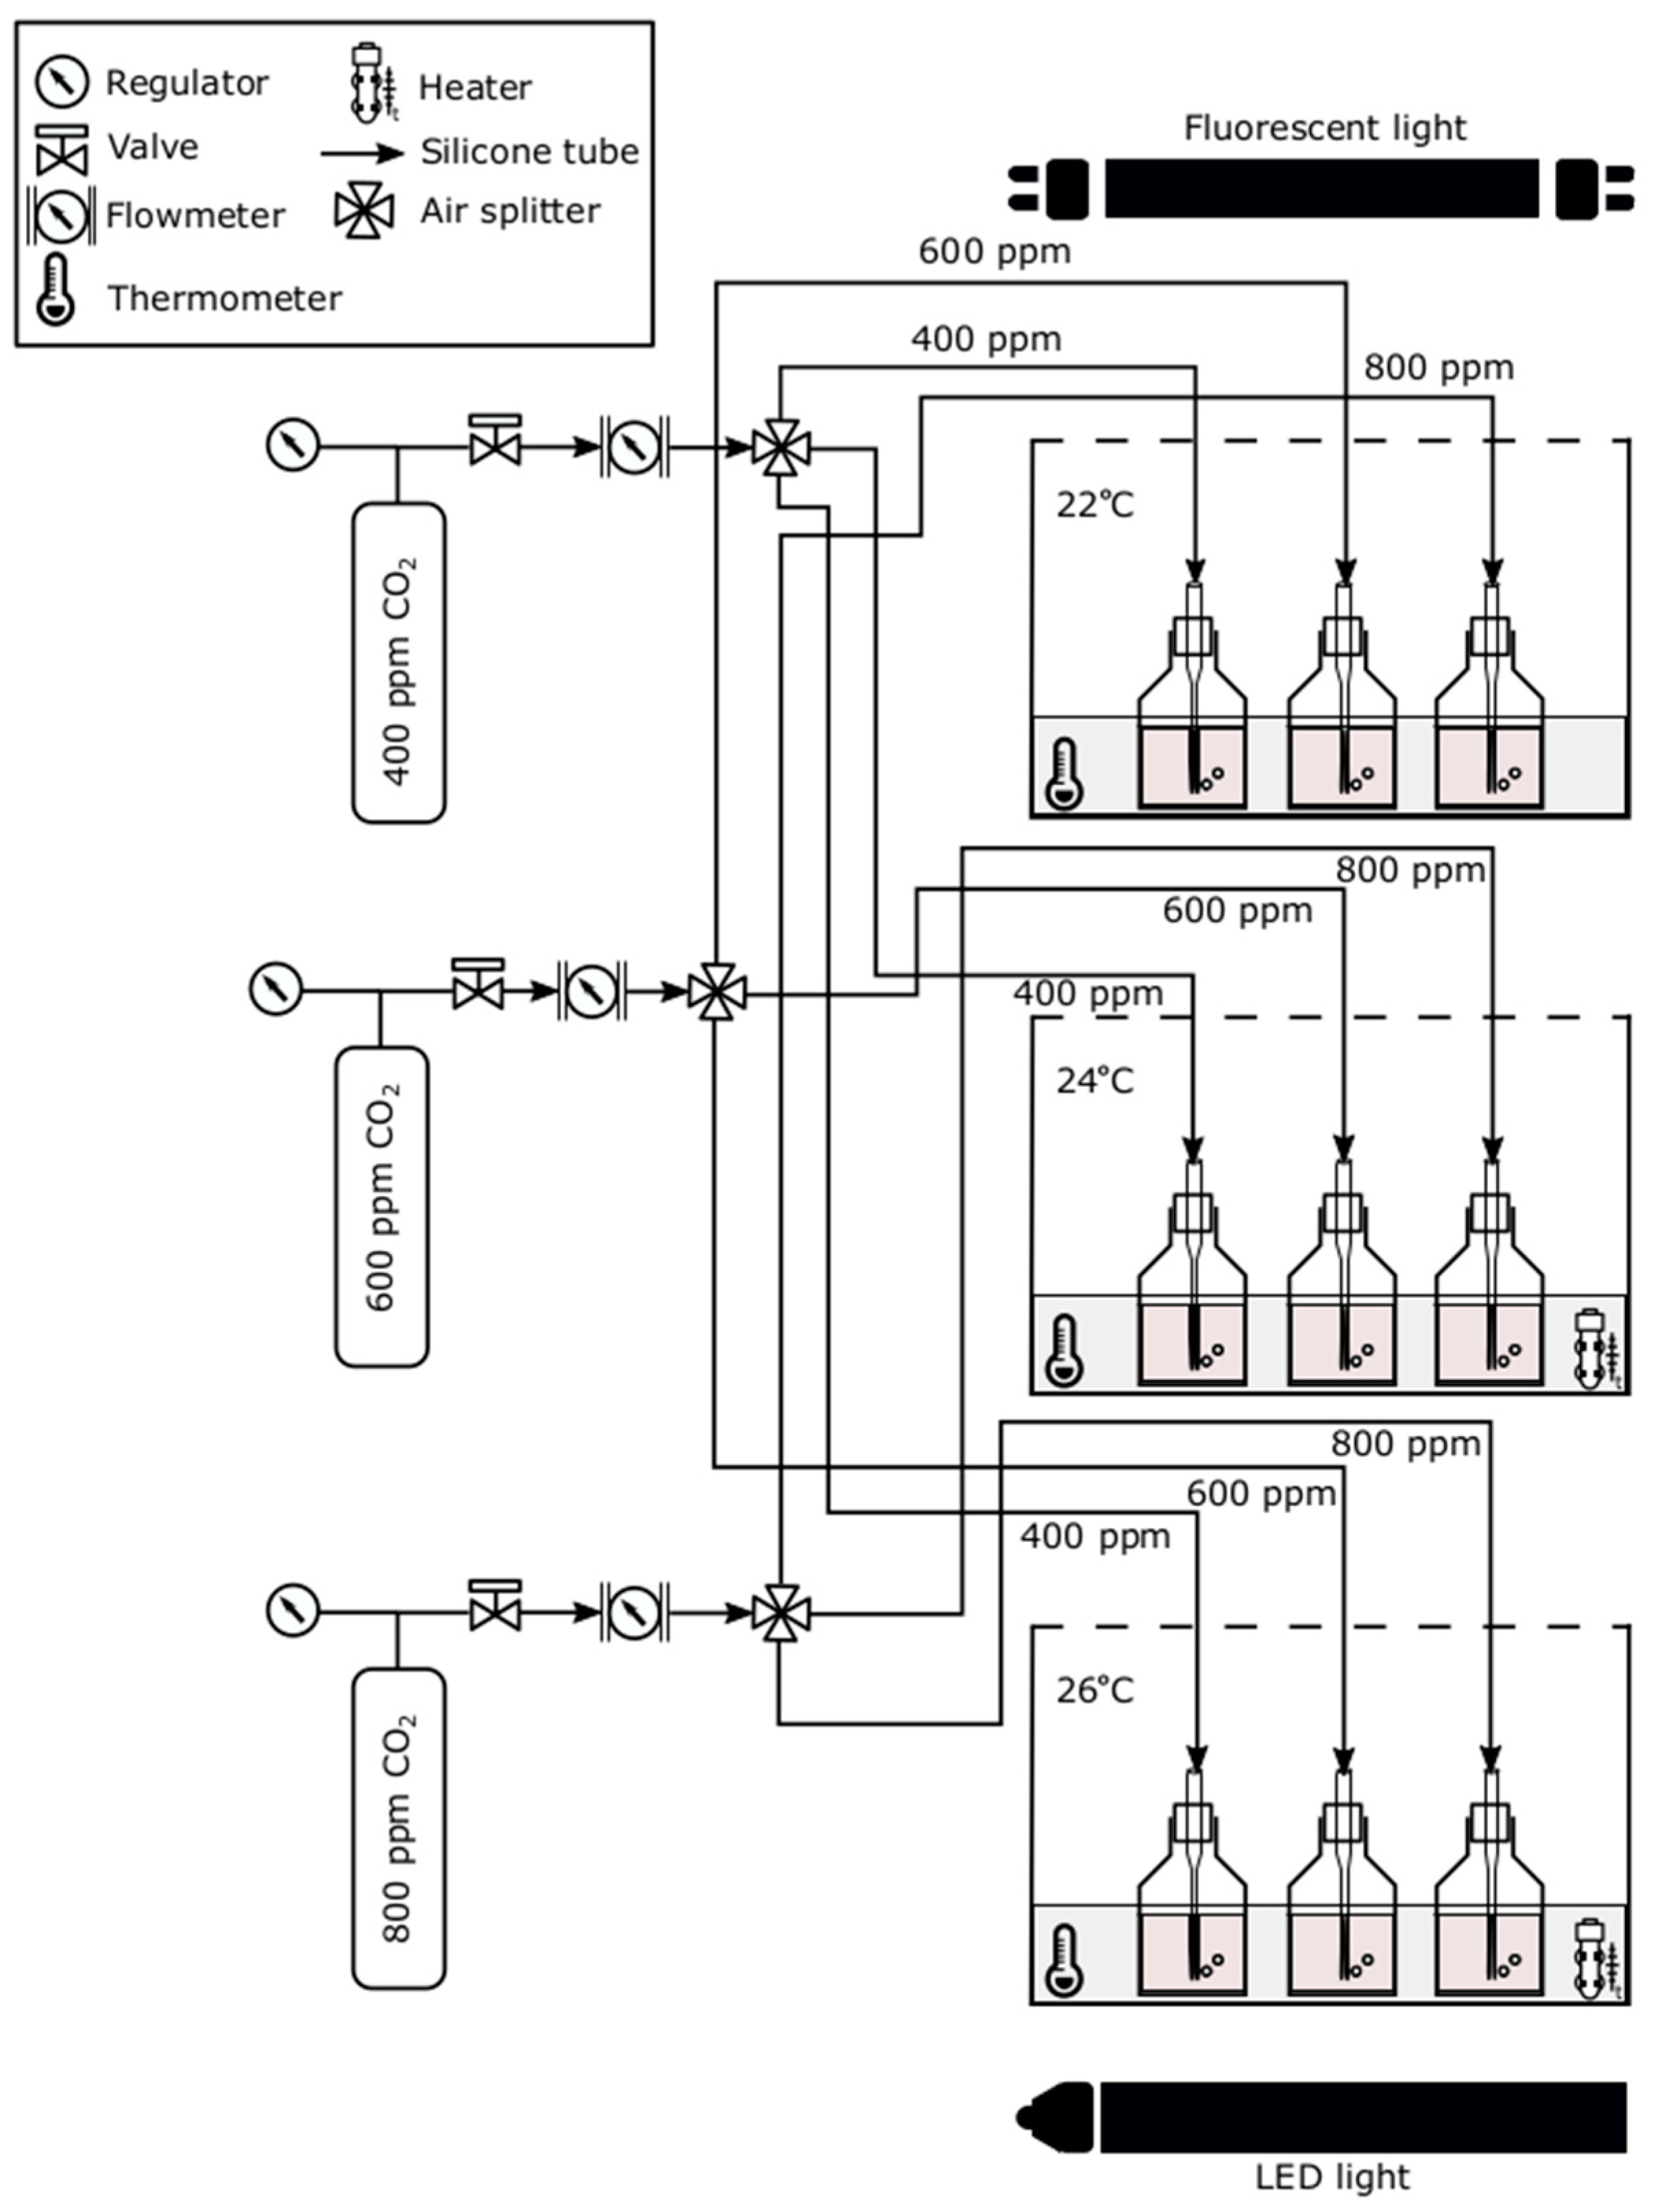
2.2. Experimental Set-Up and Procedure

The experimental set-up (Figure 1) consisted of three gas cylinders with the following gas mixture composition: 0.04% (400 ppm) CO2, 21% O2 and 78.96% N2; 0.06% (600 ppm) CO2, 21% O2 and 78.94% N2; and 0.08% (800 ppm) CO2, 21% O2 and 78.92% N2. Flowmeters (model Y21B1501HA-AG) were connected to the cylinder regulators to control the flow rate of the output gas. An output gas flow rate of 17.7 mL/min was maintained during the experiments. The cylinders (primary standard: +/−5% blend tolerance) and the flowmeters were procured from Airgas USA, LLC. Silicone tubes were connected to the flowmeter outlets to channel the gas mixtures to three air splitters. The control valves of the air splitters were regulated to gradually discharge the gas mixtures to the respective cultures, maintained in polycarbonate bottles. The cultures were placed in temperature-controlled water baths inside three glass tanks (10 L). The tanks were filled with deionized water until the cultures were fully submerged. Aquarium heaters with thermostat (EHEIM JAGER model 3612090) were installed in two of the tanks to maintain the water temperature at 24 °C and 26 °C, respectively. The water temperature of the third tank was the same as the ambient temperature of the walk-in incubator (22 °C). A thermometer was placed in each tank to monitor the water temperature.
Cultures were grown under 20 µmol quanta m−2 s−1 continuous cool-white light and were simultaneously exposed to the respective temperature and CO2 treatments. The irradiance level was measured using a quantum/radiometer/photometer (LI-COR Inc., model LI-250A, Lincoln, NE, USA). For acclimation of the cultures to each treatment condition, single culture bottles were maintained under each treatment condition for at least 10 generations in semi-continuous batch culture before mid-log phase sampling. Three culture bottles/treatment (inoculated with cultures acclimated to the respective temperature and CO2 level) were, thereafter, set up in the tanks for conducting the triplicate experiments. The treatment combinations used in this study were as follows: 22 °C temperature and 400 ppm CO2, 22 °C temperature and 600 ppm CO2, 22 °C temperature and 800 ppm CO2, 24 °C temperature and 400 ppm CO2, 24 °C temperature and 600 ppm CO2, 24 °C temperature and 800 ppm CO2, 26 °C temperature and 400 ppm CO2, 26 °C temperature and 600 ppm CO2, and 26 °C temperature and 800 ppm CO2. The cultures were bubbled to saturation with the respective CO2 concentrations and the biomass levels were kept low at each treatment condition to maintain the pH.

2.3. Fluorescence Measurements

Growth of the cultures was monitored via raw chlorophyll fluorescence measurements using a Turner Fluorometer (Turner Designs Trilogy, model 7200, San Jose, CA, USA). The chlorophyll in vivo module (blue module model 7200-043) was used for the measurements [10]. Chlorophyll fluorescence analysis facilitates near instantaneous measurement of prime aspects of photosynthetic light capture and electron transport [35]. Briefly, it depends on the phenomenon that, when a pigment enters an excited electronic state by absorbing the energy of a photon, there are mainly four routes for the return to ground state: (i) photochemical reactions (wherein the excited electron leaves the pigment molecule and enters an electron transport chain); (ii) heat dissipation (wherein excited electron returns to ground state by releasing heat); (iii) transfer of the excitation energy to an adjacent pigment; and (iv) emission of a fluorescence photon, having a wavelength longer than the photon initially absorbed [35]. Fluorescence analysis also aids in understanding the efficiency of photochemistry on the basis of changes in photosystem II (PSII) fluorescence under a range of different light treatments [9,36]. This enables the determination of several key photosynthetic parameters, such as Fv/Fm and σPSII2), as described below (see Mackey et al., 2008 [36] for a detailed description of the parameters).
PSII fluorescence was measured using a FIRe Fluorometer [9] with FIReview software (custom made, M.Gorbunov, Rutgers University, East Brunswick, NJ, USA) and blue excitation light (450 nm with 30 nm bandwidth). The dark-adapted photosynthetic efficiency (Fv/Fm) and the functional absorption cross-section of PSII in the dark-adapted state (σPSII) were measured on cultures following 3-min dark adaptation in the sample chamber. The curve-fitting program in FIRePro was used for these measurements.

2.4. Determination of Specific Growth Rate

Specific growth rate µ (d−1) was determined from the raw chlorophyll fluorescence measurements using the following equation [10,14]:
μ = ln ( X 1 / X 0 ) t 1 t 0
where X1 and X0 are the fluorescence values obtained on days t1 and t0, respectively. For each strain and treatment, the specific growth rate was calculated using two time points from within the exponential phase of the growth curve.

2.5. Determination of Elemental Carbon and Nitrogen Content and Nitrogen Stable Isotopic Composition

For each strain and treatment, samples for the measurement of elemental carbon and nitrogen content were prepared following the overall approach described by Li et al. [3] with the following modifications: the sample biomass was pelleted down at the final time point (the mid-log phase) of the triplicate experiments using a centrifuge (Thermo Scientific, Sorvall Legend XTR, Waltham, MA, USA) at 4700 rpm. The pellets were then dried in a desiccator (Sanplatec Corp., Santa Clara, CA, USA) using drierite (mesh size 8) as a desiccant, until a constant weight was achieved. The dried pellets were then weighed in an ultra-microbalance (Sartorius SE2, Göttingen, Germany) and encapsulated into 5 × 9 mm2 tin capsules (Costech Analytical Technologies, Inc., Valencia, CA, USA). The tins containing the dried pellets were crimped into compact cubic shapes and were loaded into prelabelled 96-well plates. The elemental carbon and nitrogen content and the 15N stable isotopic composition (hereafter referred to as δ15N (‰)) analysis of the dried pellets were conducted in an elemental analyzer interfaced to a continuous flow isotope ratio mass spectrometer (IRMS) at the Stable Isotope Facility at UC Davis following Barrie et al. [37]. Triplicate measurements of elemental carbon and nitrogen content and nitrogen stable isotopic composition could not be performed in the strain WH8109 because low biomass concentration was obtained in this strain after the experimental treatments.
During the course of this study, several batches of seawater collected at different times of the year were used to prepare the growth media in order to support the growth of multiple generations of the strains and to conduct multiple experimental treatments. Because each strain was grown on a different batch of seawater, it was possible to study the δ15N trends for different treatments within each strain but not across strains.

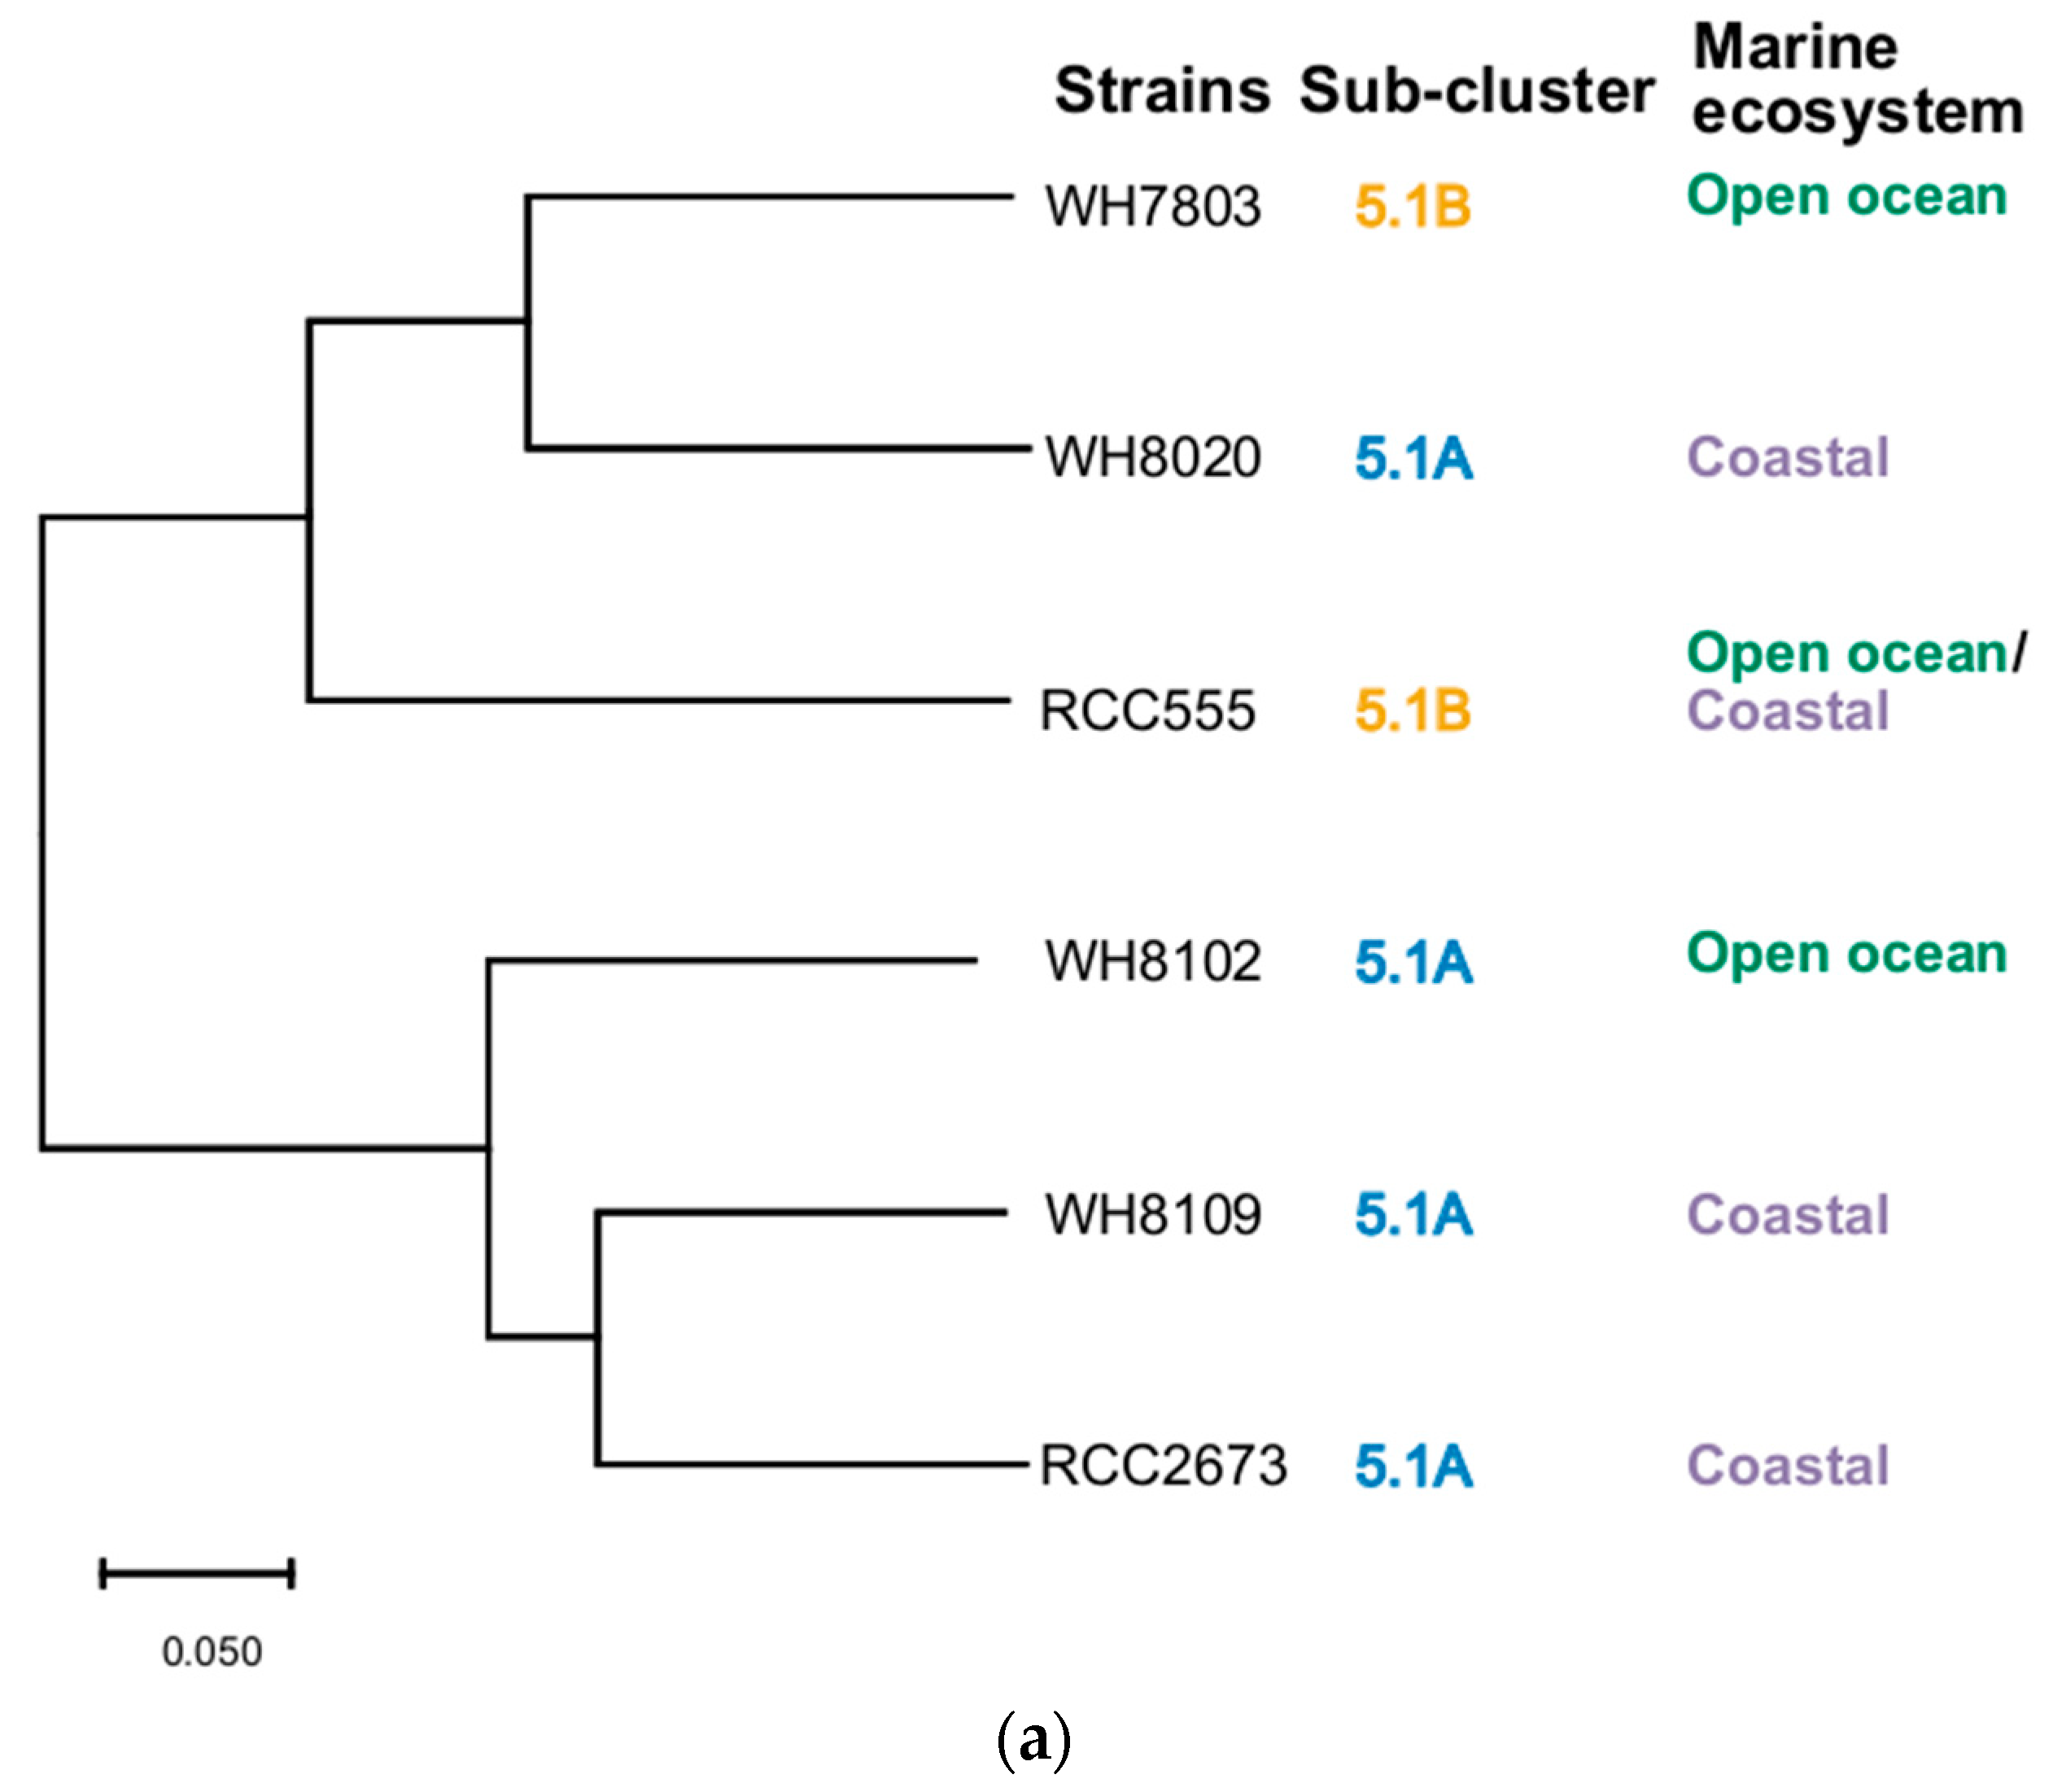
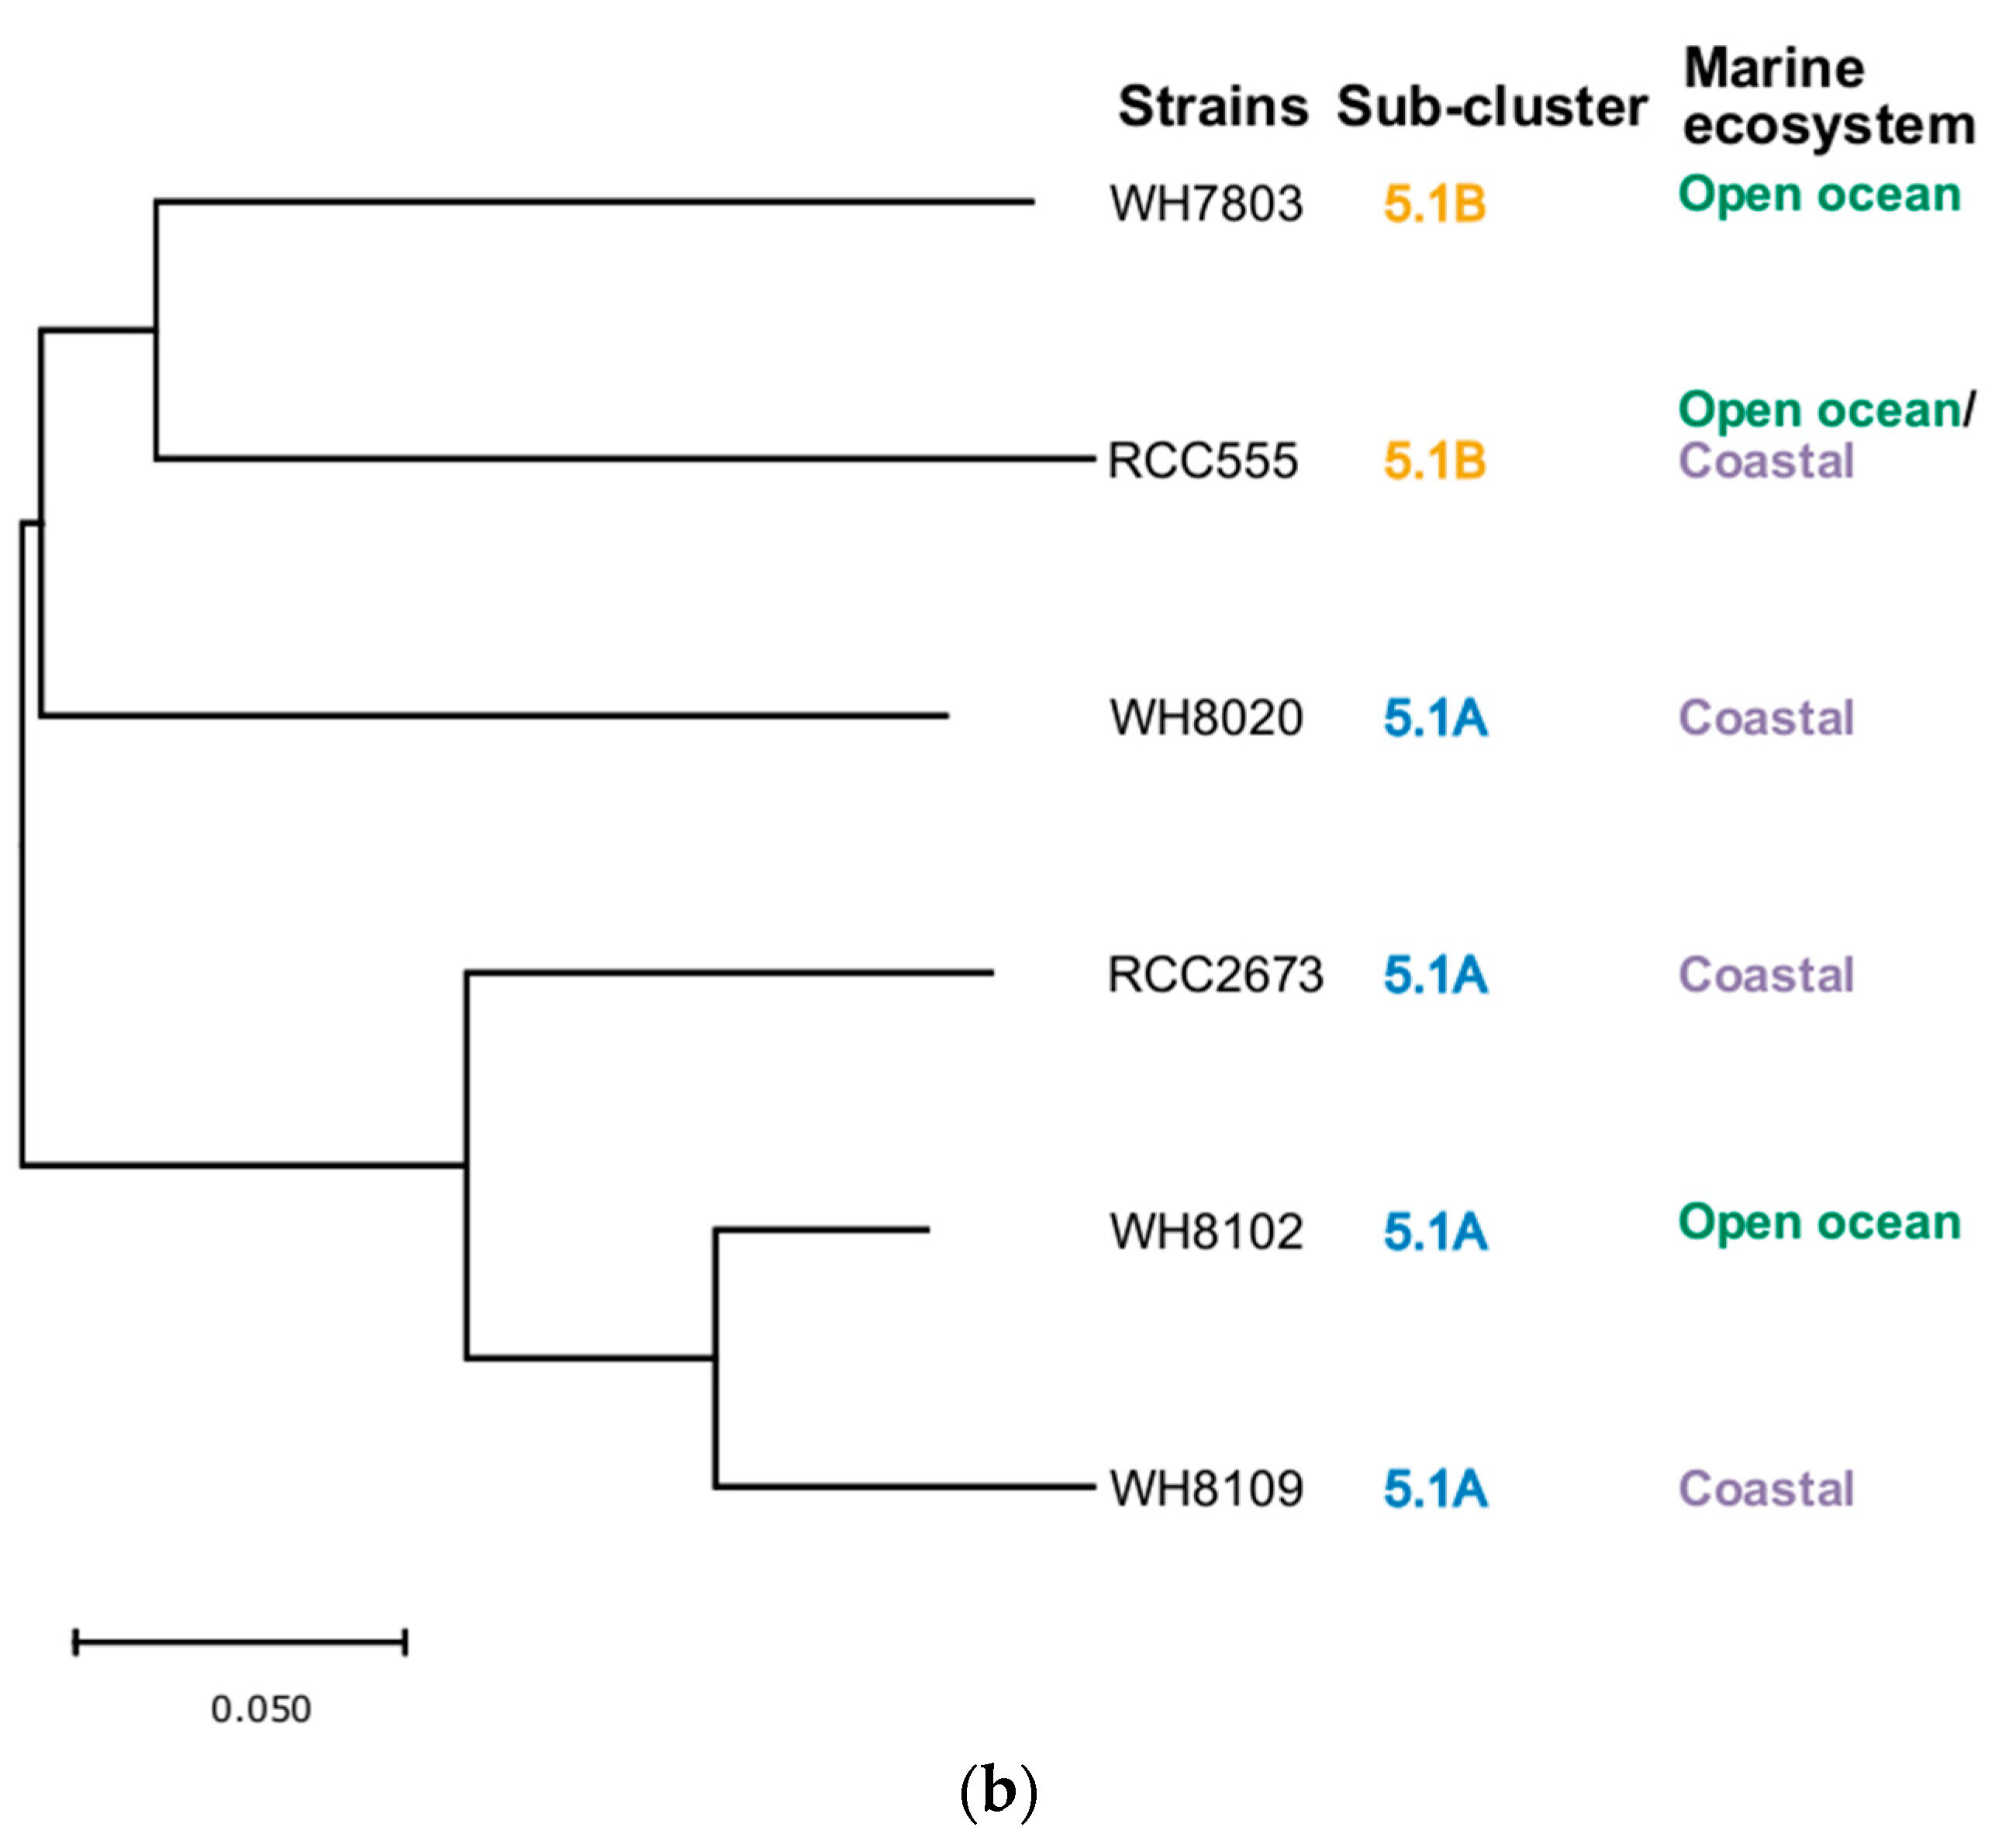
2.6. Construction of Phylogenetic Trees

Cyanobacteria have evolved adaptations known as CO2-concentrating mechanism (CCM) that improve their photosynthetic performance and survival when CO2 concentration is limiting [38]. The two key components of the CCM in cyanobacteria are the presence of active uptake systems for both CO2 and HCO3, and the presence of a carboxysome compartment where CO2 is generated in close proximity to the primary CO2-fixing enzyme, ribulose bisphosphate carboxylase oxygenase (Rubisco) (see Section 4) [38]. To test whether the evolutionary relationship of the CCM proteins of the picocyanobacterial strains govern their responses to changes in pCO2 and temperature, we investigated the phylogenetic relationship of two key CCM proteins, BicA and ChpX. The CCM protein BicA (bicarbonate transporter protein) is a Na+-dependent HCO3 transporter protein that belongs to a large family of eukaryotic and prokaryotic transporters [38]. ChpX (CO2 hydration protein) is a CO2 hydration protein that is part of the constitutively expressed NDH-14 complex in cyanobacteria. NDH-1 is a modified nicotinamide adenine dinucleotide phosphate (NADPH) complex, which is an active facilitator involved in the passive entry of CO2 into the cyanobacterial cell [38].
To construct the phylogenetic tree for BicA and ChpX, protein sequence of BicA for the strain WH8020 and protein sequence of ChpX for the strain WH8102 were downloaded from NCBI Protein database. These sequences were used as query sequence to find their orthologs in the other strains using protein blast (blastp). The NCBI IDs for the six strains that produced significant alignments for the respective proteins are shown in Table S1 (Supplementary Data). These protein sequences were aligned using the MUSCLE algorithm [39] as implemented in the software Molecular Evolutionary Genetics Analysis (MEGA X) [40] and the multiple protein alignments, involving 568 amino acids of BicA and 382 amino acids of ChpX, were then used to build two phylogenetic trees using the maximum likelihood method and JTT matrix-based model [41], as implemented in MEGA X.

2.7. Statistical Analysis

All the experiments were carried out in triplicates. The error bars in the graphs represent the standard error of the mean. To test for significant interactions between the effects of CO2 and temperature on the specific growth rates, two-way ANOVA was performed in R (version 3.6.3, Vienna, Austria) using the model growth rate ~CO2 concentration × temperature in the aov function. When significant interactions were detected between the main effects, Tukey’s HSD post hoc test was performed in R using the TukeyHSD function to determine the particular interactions that changed the specific growth rates significantly. The Pearson’s correlation coefficients for the specific growth rates and δ15N (‰) correlation plots were calculated in R using the cor.test function and using the “pearson” method.

3. Results

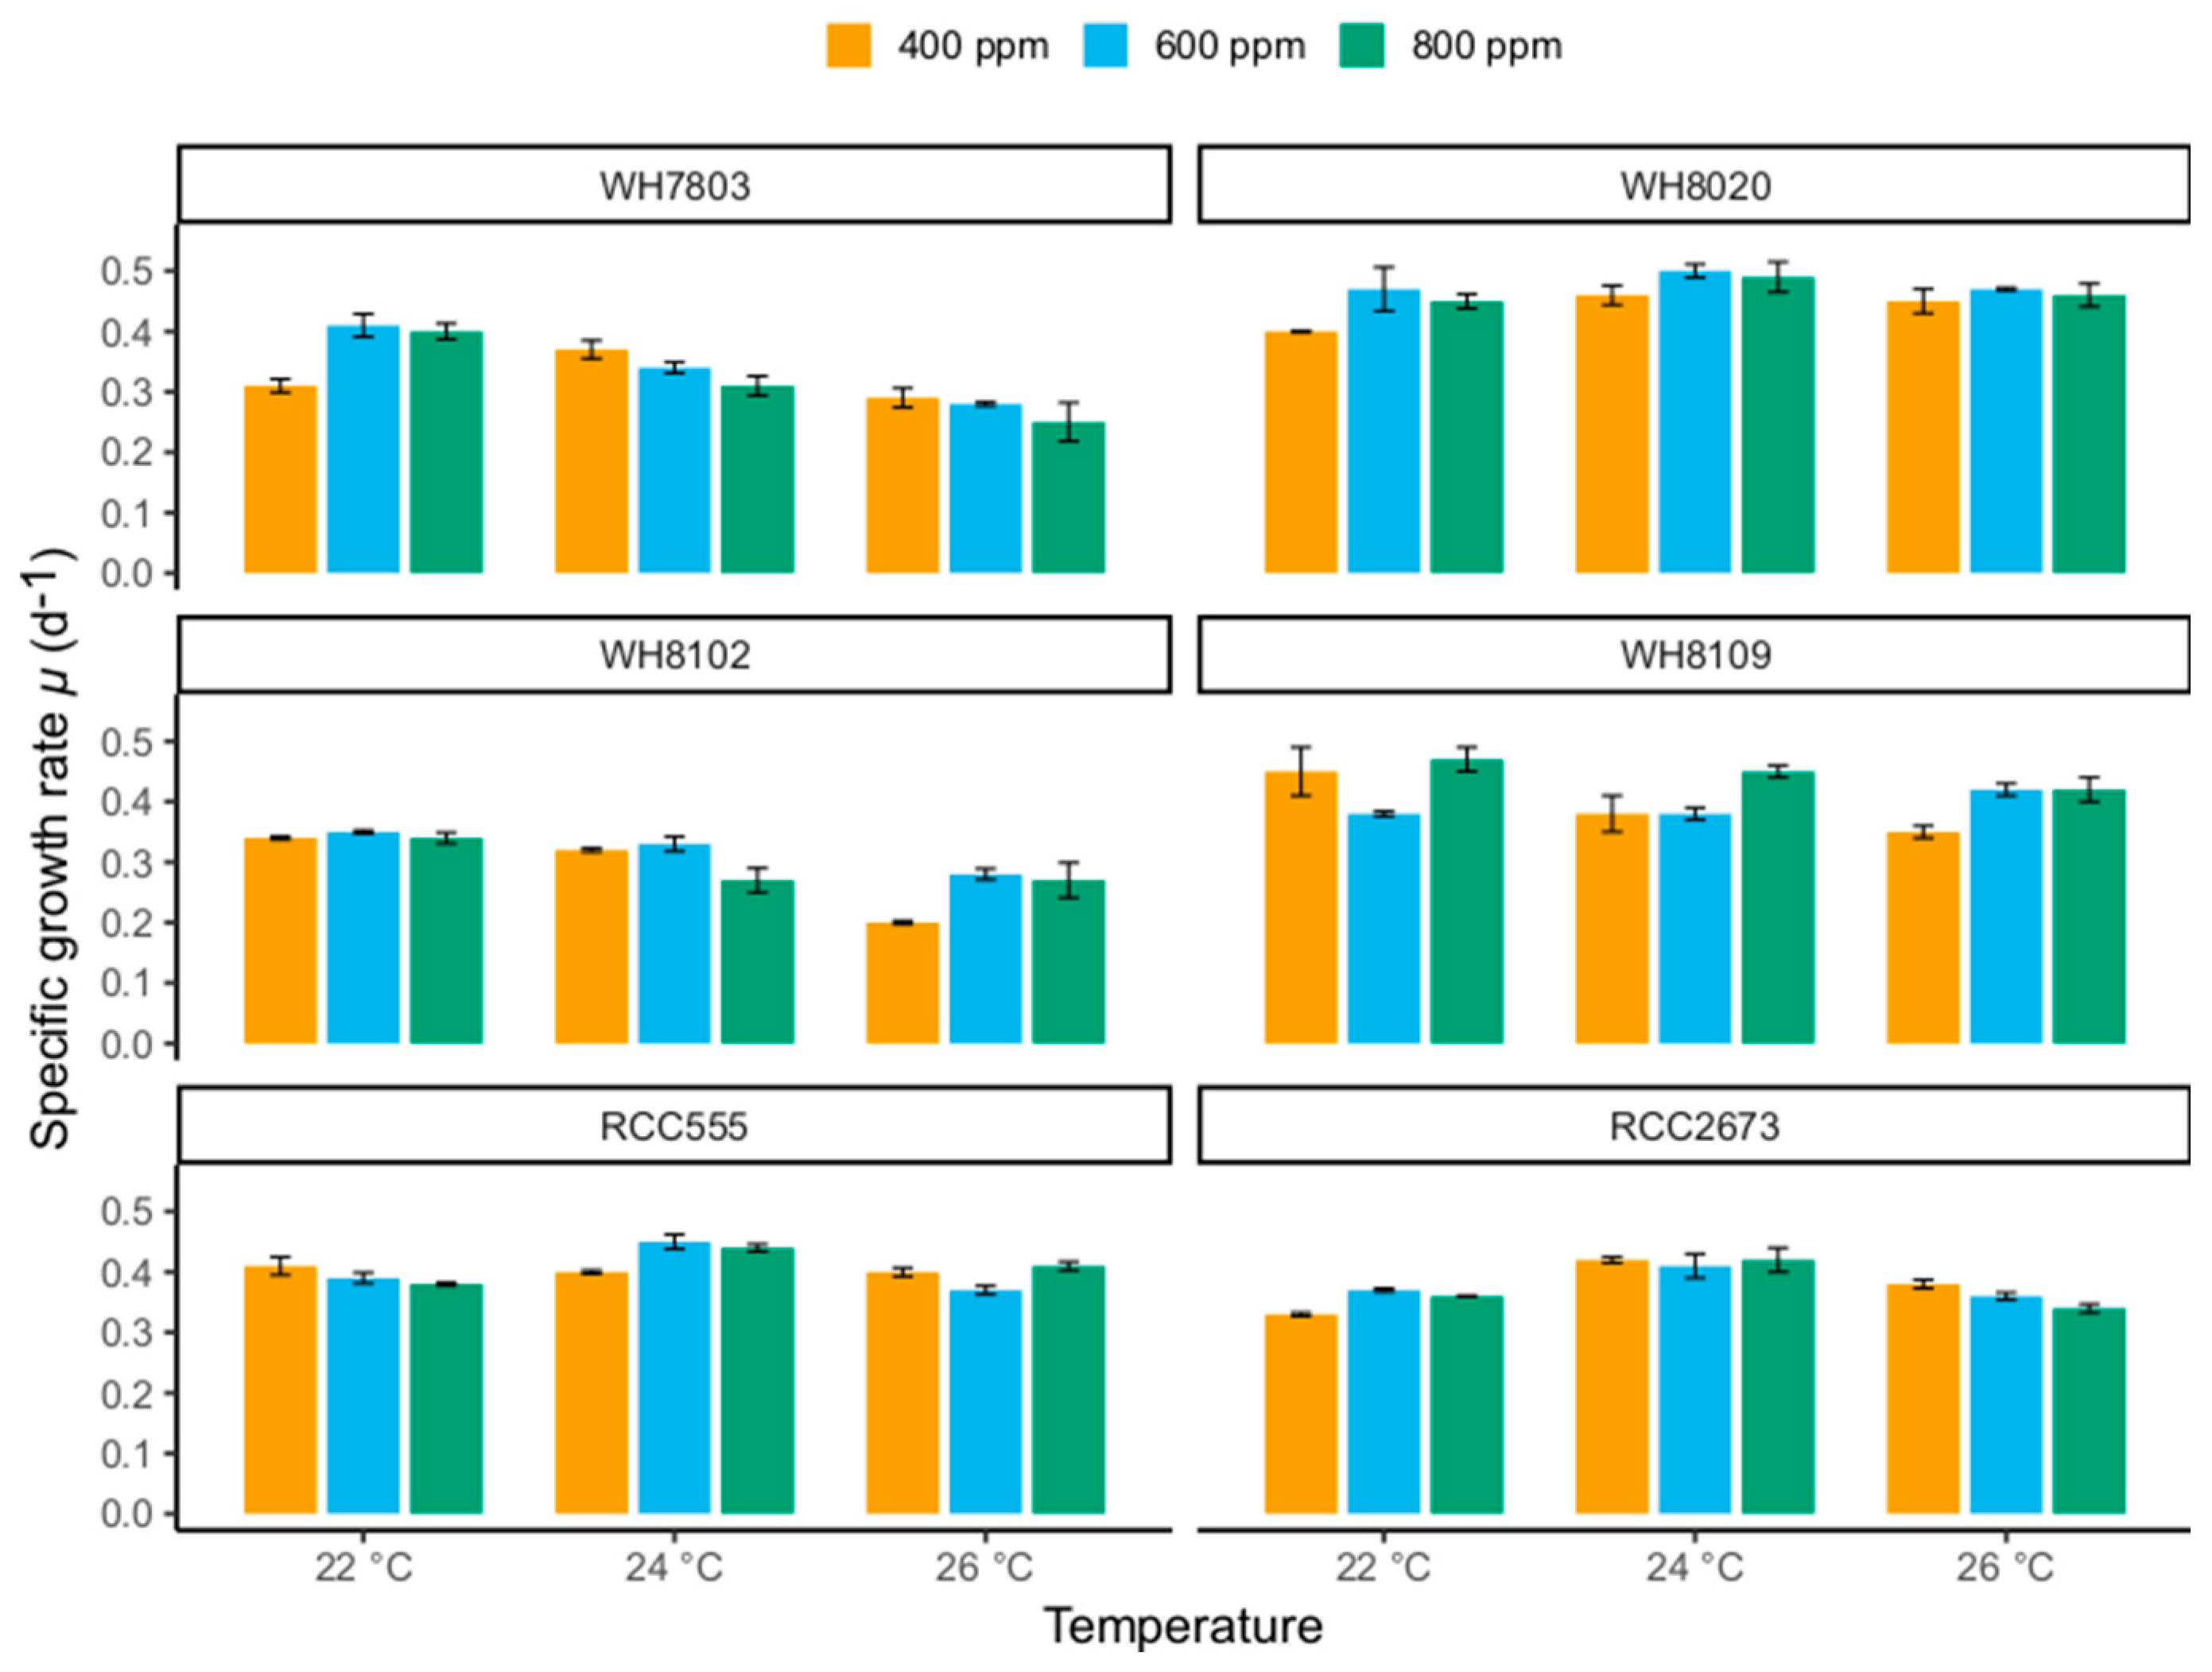
3.1. Specific Growth Rates

Individual Synechococcus strains showed different specific growth rate µ (d−1) responses when subjected to simultaneous changes in CO2 and temperature levels (Figure 2). However, the specific growth rate patterns obtained appeared to be related to the oceanic origin sites (coastal/open ocean) of the strains. These patterns are discussed below.

3.1.1. Specific Growth Rate Responses in WH7803 and WH8102

In the open ocean strains, WH7803 and WH8102, the specific growth rates decreased significantly with increase in temperature, while the effect of the CO2 levels on the specific growth rates were less prominent. The lowest specific growth rate of 0.25 d−1 was observed at 26 °C, 800 ppm in WH7803, while the lowest specific growth rate value of 0.2 d−1 was observed at 26 °C, 400 ppm in WH8102. Two-way ANOVA revealed significant interaction between CO2 and temperature in WH7803 and WH8102 (p values were 0.001 and 0.002, respectively). Please see Table S2 (Supplementary Data) for Tukey’s HSD test results for the significant interaction effects observed in the Synechococcus strains. Thus, though both strains tolerated a temperature of 26 °C, they grew optimally at ~22 °C.

3.1.2. Specific Growth Rate Responses in RCC555 and RCC2673

Both RCC555 (which has characteristics of both open ocean and coastal isolates) and the coastal strain RCC2673 grew optimally at 24 °C. In RCC555, the highest specific growth rate values were obtained at 24 °C, 600 ppm CO2 and 24 °C, 800 ppm CO2 treatments. These values were 0.45 d−1 and 0.44 d−1, respectively. The specific growth rates were lower at 22 °C and 26 °C than at 24 °C for most of the CO2 treatments. Similarly, in RCC2673, the specific growth rates were significantly higher at 24 °C and decreased at 22 °C and 26 °C for all the CO2 treatments. The highest specific growth rate values of 0.42 d−1 were observed at 24 °C, 400 ppm and 800 ppm CO2 levels, respectively. Two-way ANOVA showed significant interaction between CO2 and temperature in RCC555 and RCC2673 (p values were 0.0003 and 0.001, respectively). Also, similar to the pattern observed in WH7803 and WH8102, the effect of temperature on the growth rates was more pronounced than the effect of variations in the CO2 levels in both these strains, despite significant interaction between CO2 and temperature.

3.1.3. Specific Growth Rate Responses in WH8020 and WH8109

Increased temperatures did not have a significant effect on the specific growth rates in the coastal strains WH8020 and WH8109. In WH8020, the highest specific growth rate of 0.5 d−1 was observed at 24 °C, 600 ppm CO2 level, while the lowest specific growth rate of 0.4 d−1 was obtained at 22 °C, 400 ppm CO2 level. The specific growth rates at 600 ppm CO2 were significantly higher (p = 0.04) than those at 400 ppm CO2 level at 22 °C and 24 °C treatments. In WH8109, the highest specific growth rate of 0.47 d−1 was obtained at 22 °C, 800 ppm CO2 treatment, while the lowest specific growth rate of 0.35 d−1 was observed at 26 °C, 400 ppm CO2 treatment. There was significant interaction between CO2 and temperature (p = 0.04) in WH8109, as in most of the other Syechococcus strains.

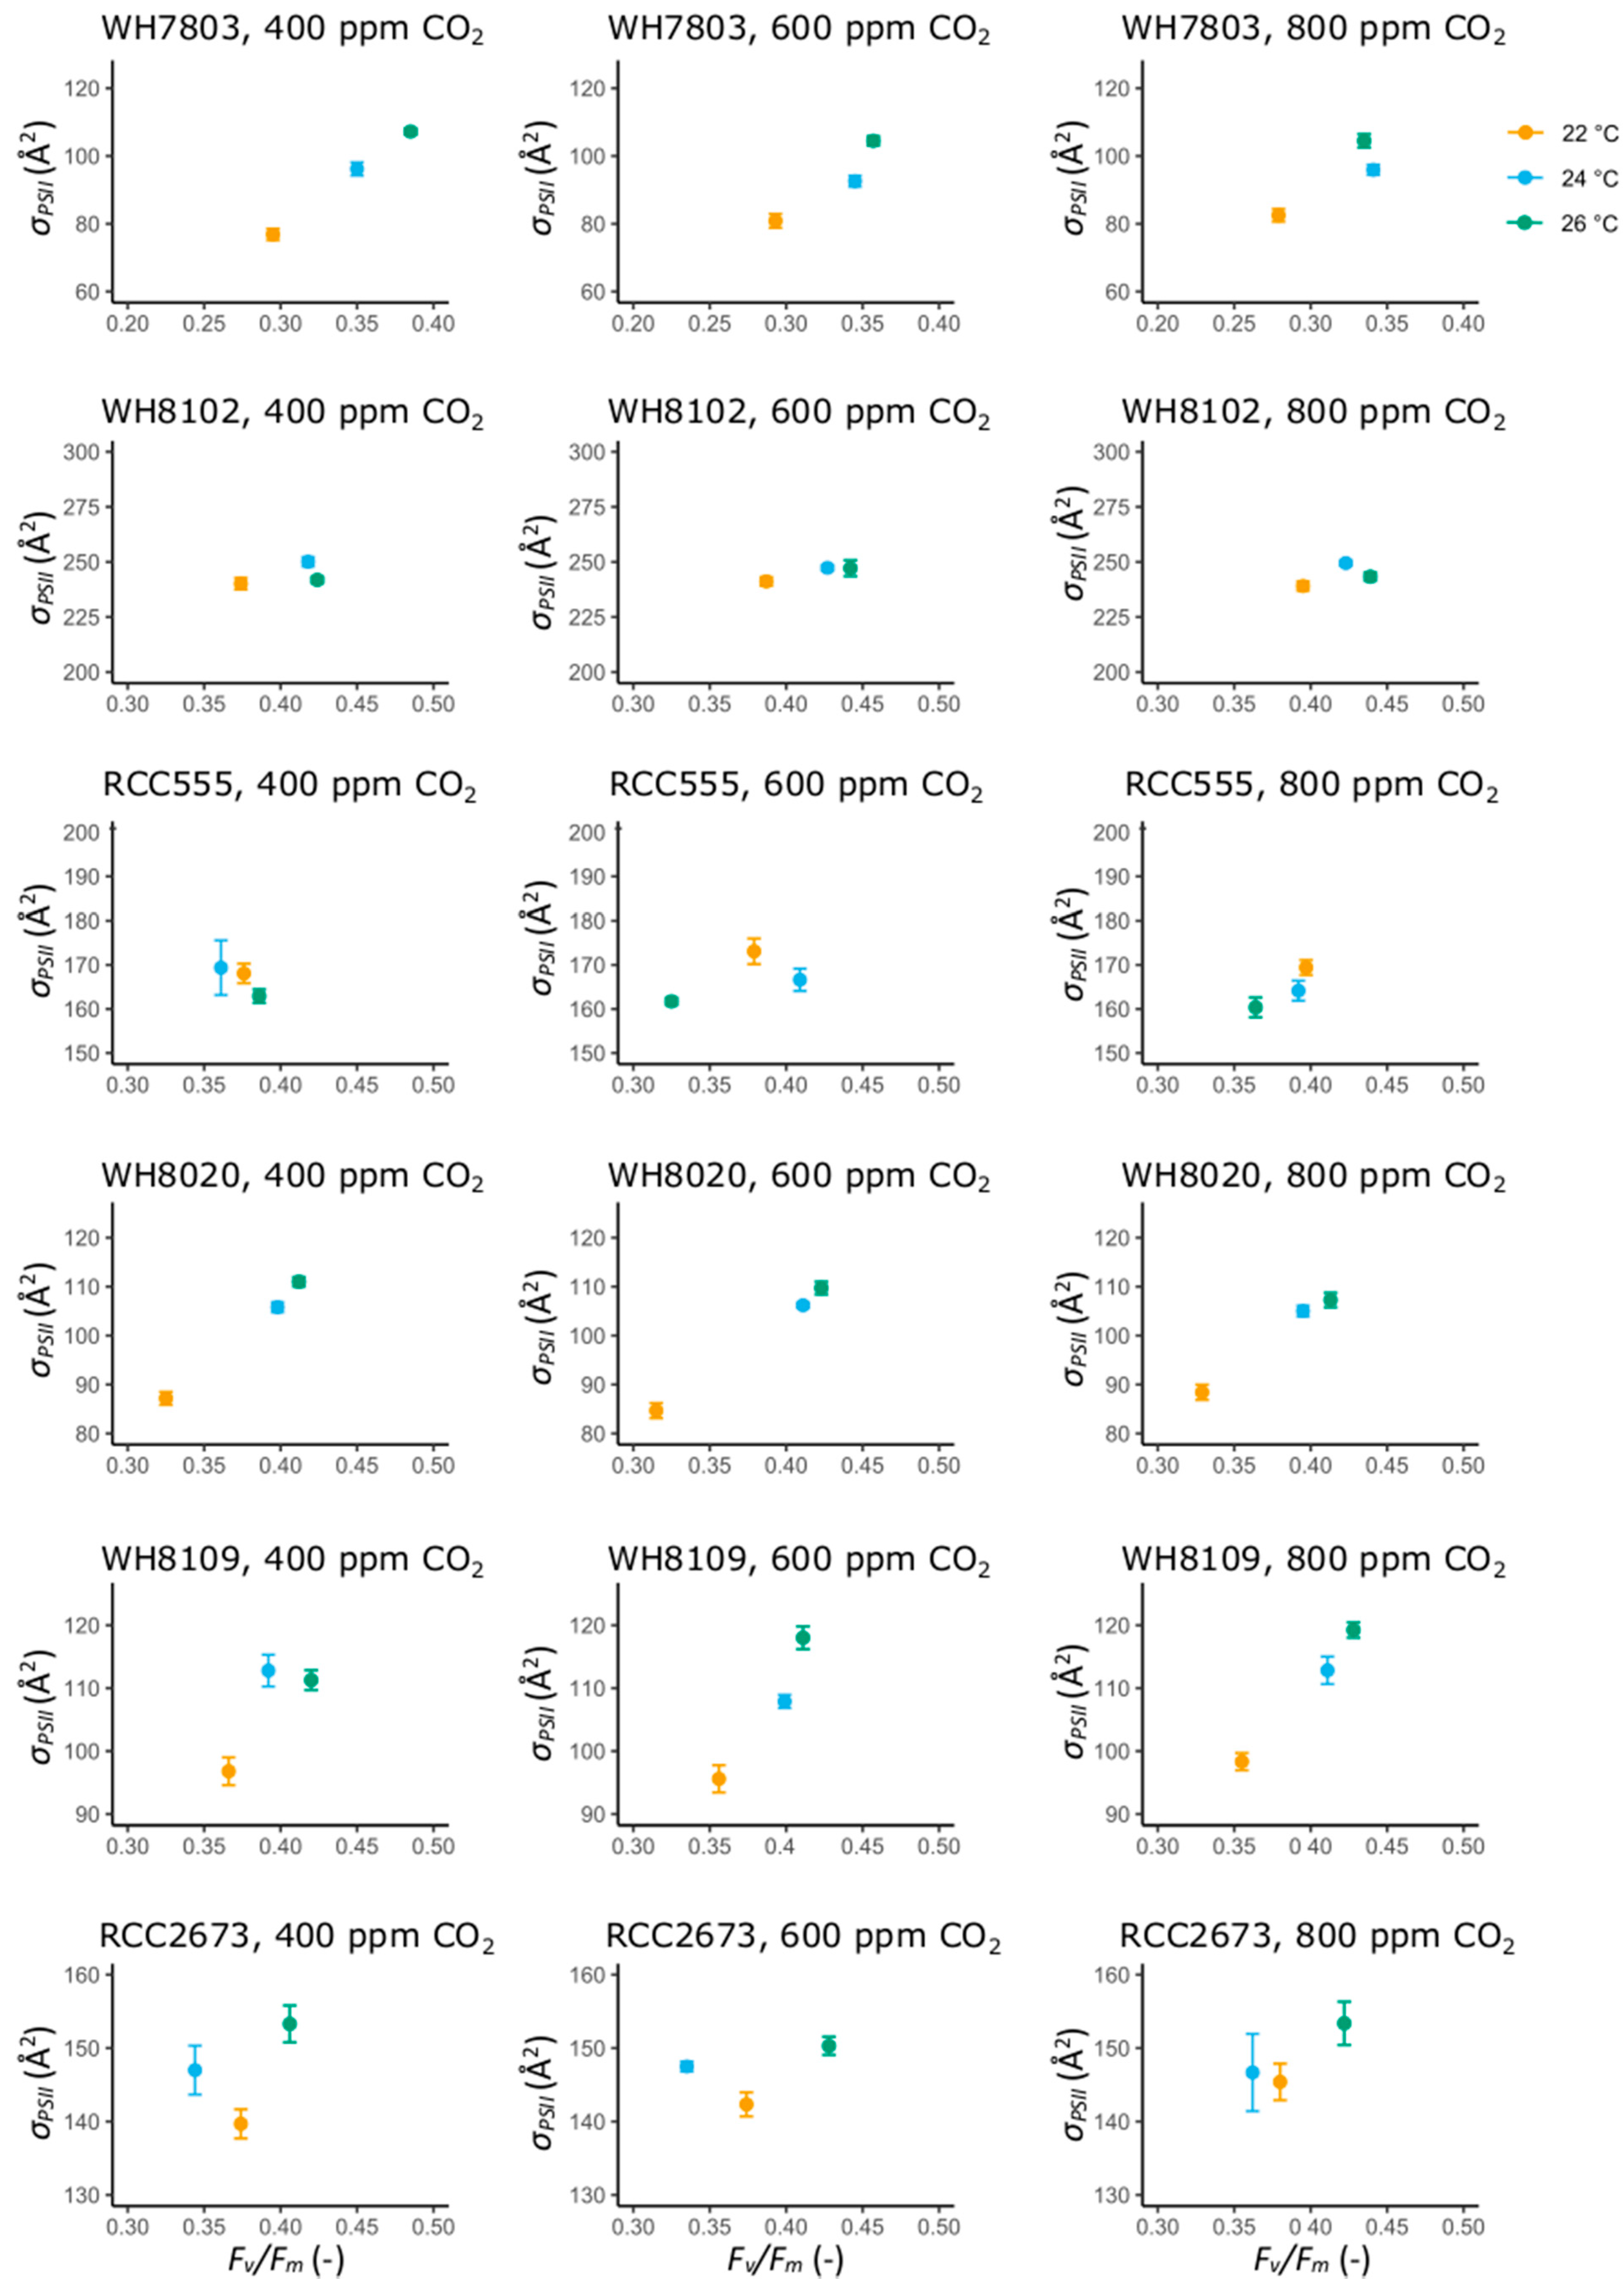
3.2. Photosynthetic Performance Parameters

Figure 3 shows the variation in the photosynthetic performance parameters Fv/Fm (-) and σPSII2) in the strains under the different experimental treatments in the exponential phase of growth. Fv/Fm reflects the maximum photochemical efficiency of PSII in the dark-adapted state, while σPSII represents the functional absorption cross-section of PSII, also in the dark-adapted state [36]. In most of the Synechococcus strains, Fv/Fm and σPSII values were lowest at 22 °C and increased at higher temperatures. The effect of the CO2 variations on Fv/Fm and σPSII was less pronounced than the temperature variations. The photosynthetic performance parameters obtained under the different experimental treatments in the Synechococcus isolates based on their site of isolation (open ocean/coastal) are discussed below.

3.2.1. Photosynthetic Performance Parameters in the Open Ocean Isolates WH7803 and WH8102

In the strain WH7803, which was isolated from the Sargasso Sea (Table 1), σPSII increased with increase in temperature from 22 °C to 26 °C. The σPSII values were ~1.3 times higher at 26 °C as compared to that at 22 °C under all the CO2 treatments (Figure 3). Fv/Fm values were also lowest at 22 °C and showed a ~1.2-fold increase at 24 °C. The Fv/Fm values obtained at 26 °C, however, were similar to those obtained at 24 °C. Temperature variations had a stronger effect on σPSII and Fv/Fm than the varying CO2 levels. In WH8102 (Figure 3), another isolate from the Sargasso Sea, the σPSII values under all the experimental treatments were 2–3 times higher than those observed in WH7803. The highest σPSII values were obtained at 24 °C, while the highest Fv/Fm values were obtained at 26 °C under all the CO2 treatments. Similar to the trend observed in WH7803, there was no significant effect of the CO2 treatments on σPSII and Fv/Fm in WH8102.

3.2.2. Photosynthetic Performance Parameters in RCC555

Unlike WH7803 and WH8102, where temperature was a stronger driver of the photosynthetic performance parameters, in the strain RCC555, neither the temperature nor the CO2 treatments had any marked effect on σPSII or Fv/Fm values. The σPSII values in this strain ranged from 160.35 at 26 °C, 800 ppm CO2 level, to 173.08 at 22 °C, 600 ppm CO2 level. The Fv/Fm values varied from 0.325 at 26 °C, 600 ppm CO2 level, to 0.409 at 24 °C, 600 ppm CO2 level (Figure 3).

3.2.3. Photosynthetic Performance Parameters in the Coastal Isolates WH8020, WH8109 and RCC2673

In WH8020, the σPSII and Fv/Fm values showed a similar trend as in WH7803 and WH8102 (increased with experimental temperature increase). The σPSII values were ~1.2 times higher at 24 °C than at 22 °C under all the CO2 treatments (Figure 3). The Fv/Fm values were highest at 26 °C (~1.3-fold higher than that at 22 °C under all the CO2 treatments). Similarly, in the strain WH8109, both σPSII and Fv/Fm values increased with increase in temperature. The highest values of σPSII and Fv/Fm were obtained at 26 °C, 800 ppm CO2 treatment. These values were 1.2 times higher than those obtained at 22 °C, 800 ppm CO2 treatment (Figure 3). Also, the effect of the temperature treatments on σPSII and Fv/Fm was more pronounced than the effect caused by the varying CO2 levels both in WH8020 and WH8109. In RCC2673, the highest values of σPSII and Fv/Fm were obtained at 26 °C under all the CO2 treatments (Figure 3). Also, similar to the other strains, the experimental temperature treatments played a stronger role in the variation in the photosynthetic parameters.
The variation in Fv/Fm and σPSII with the specific growth rates µ (d−1) in the six strains are shown in Figures S1 and S2, respectively (Supplementary Data).

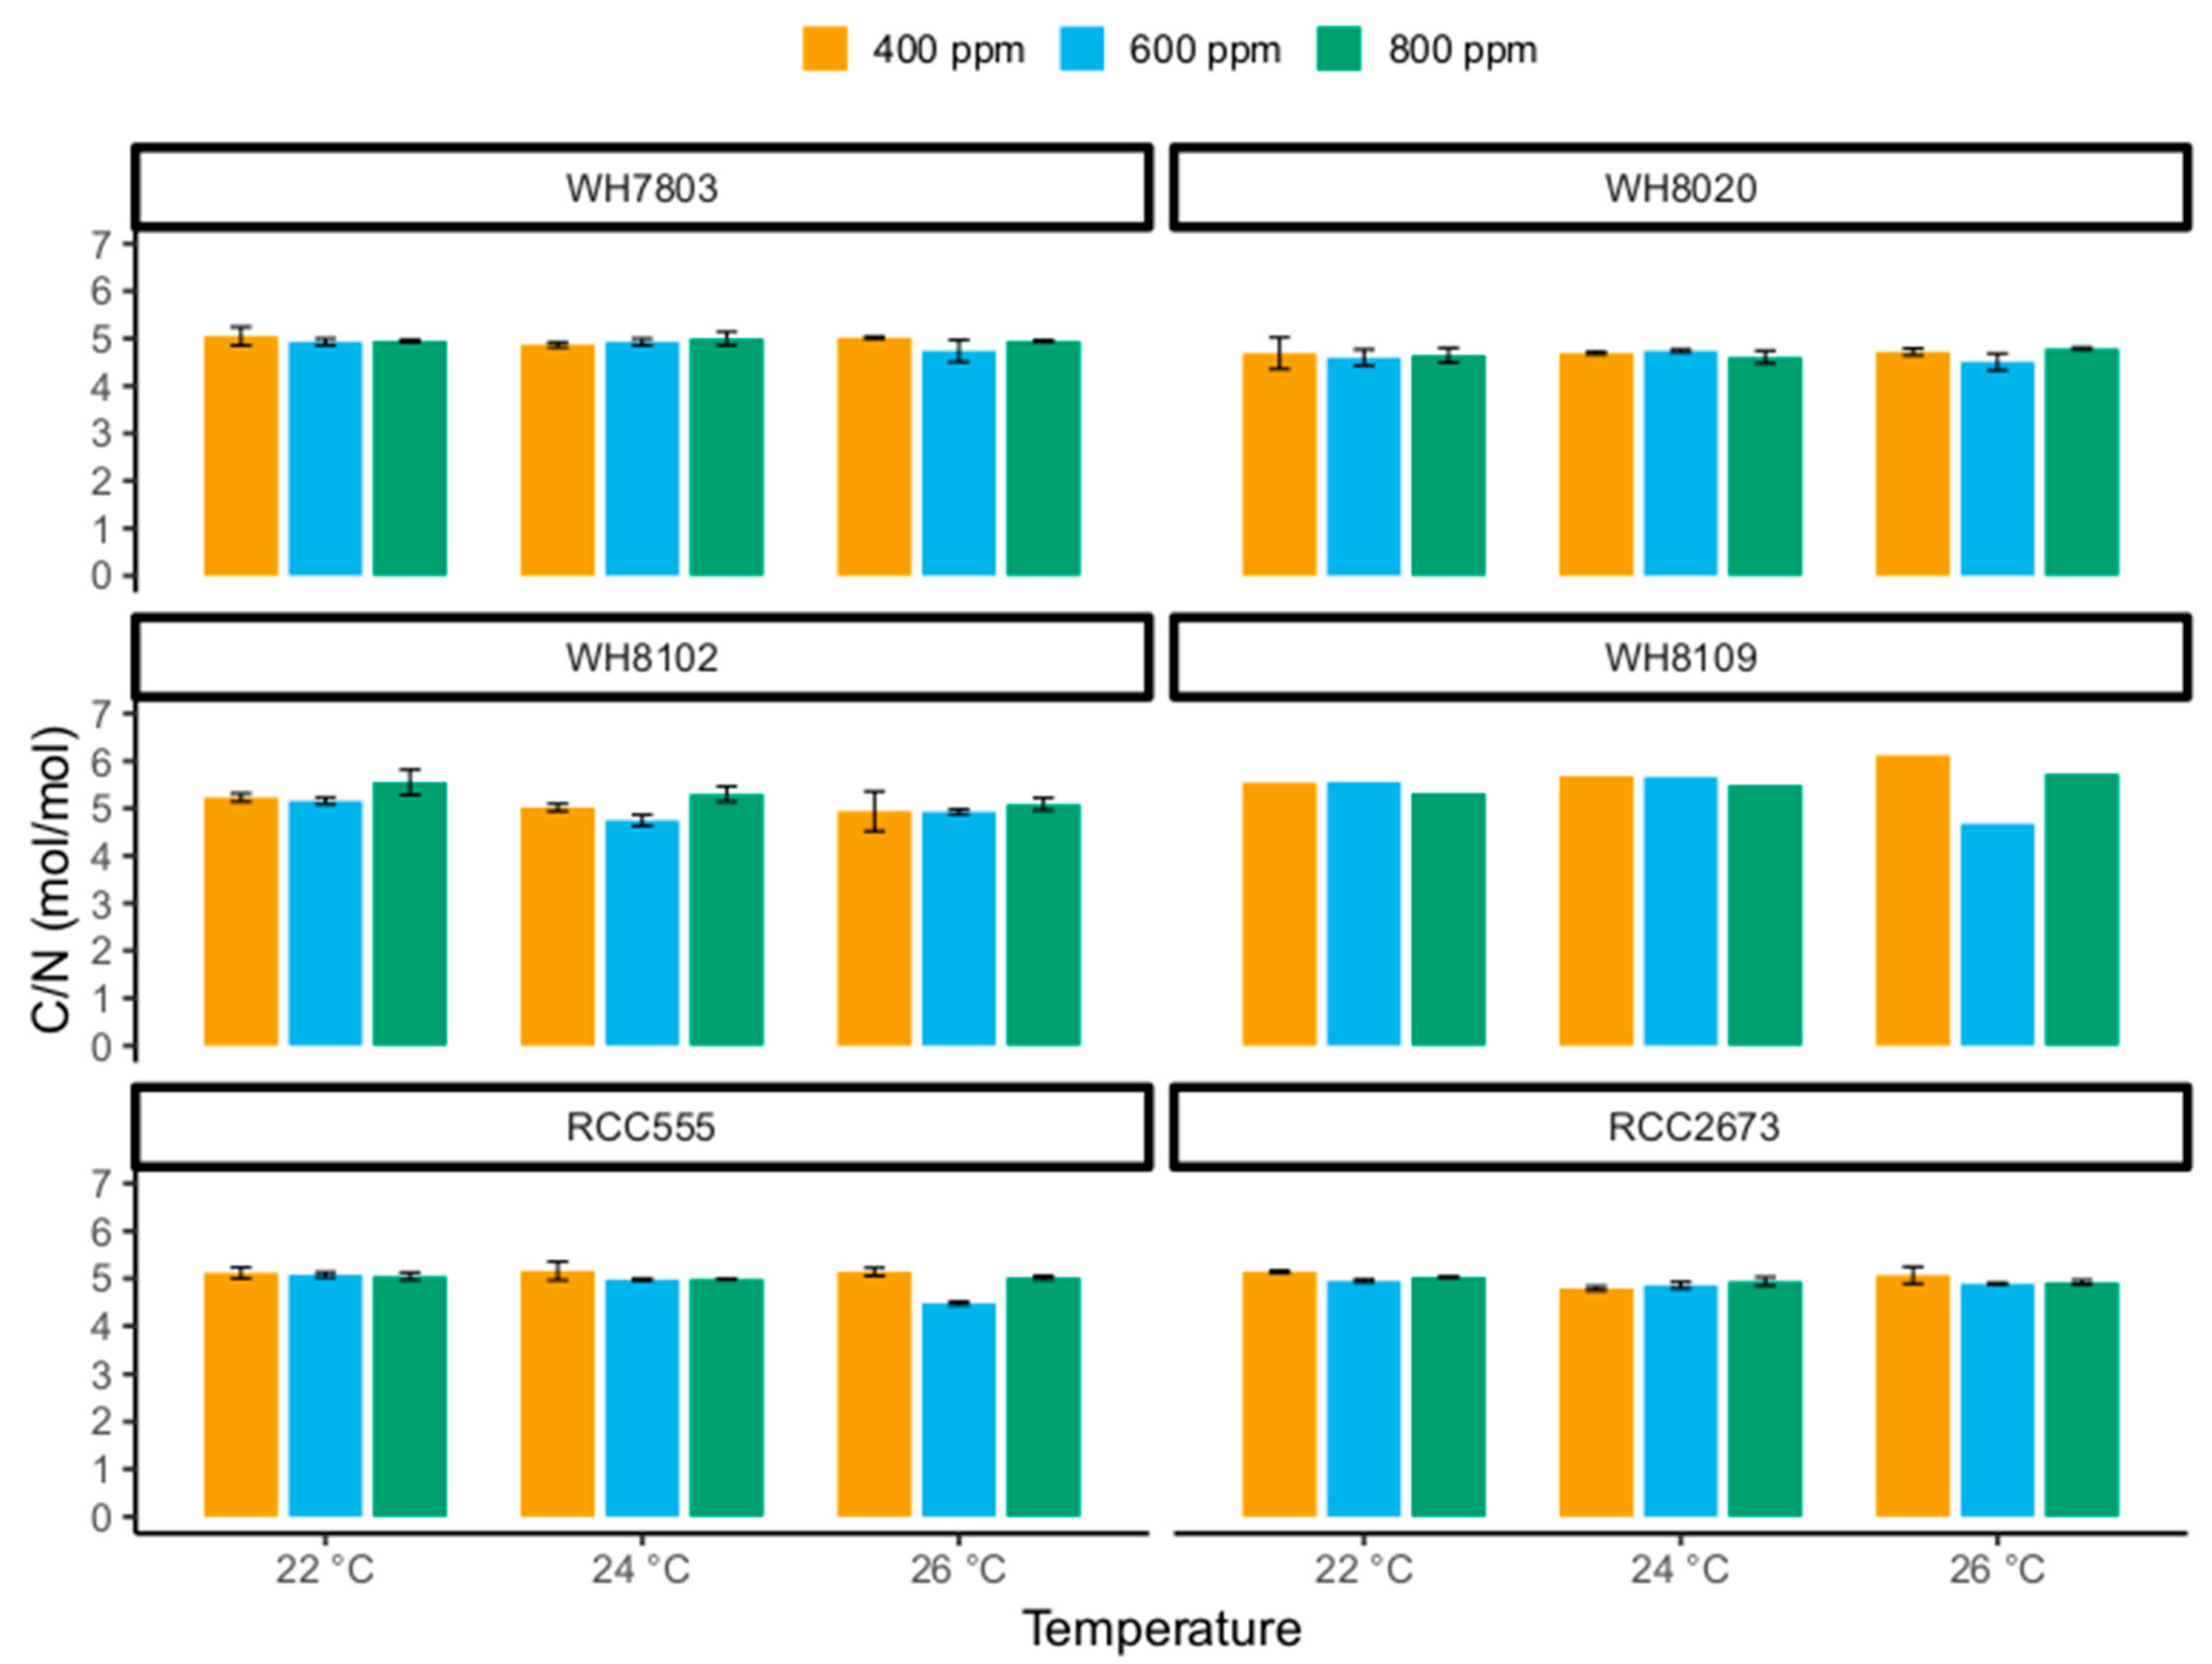
3.3. Carbon-to-Nitrogen Ratios

Neither the experimental temperature nor the experimental CO2 variations had any significant effect on the carbon-to-nitrogen (C/N) ratios in the open ocean isolates WH7803 and WH8102 or in the coastal isolates WH8020 and WH8109 (Figure 4).
In WH7803, the mean C/N ratios (mol/mol) ranged from 4.74 at 26 °C and 600 ppm CO2 to 5.05 at 22 °C and 400 ppm CO2. For the strains WH8020 and WH8102, the C/N ratios (mol/mol) showed similar trends as those observed in WH7803. The mean C/N ratios (mol/mol) ranged from 4.51 to 4.79 in WH8020 (Figure 4) and from 4.75 to 5.55 in WH8102 (Figure 4). In WH8109, the lowest mean C/N (mol/mol) of 4.68 was obtained at 26 °C and 600 ppm CO2 and the highest mean C/N (mol/mol) of 6.12 was obtained at 26 °C and 400 ppm CO2 (Figure 4). Under the rest of the CO2 and temperature treatments, the mean C/N (mol/mol) values ranged from 5.32 (at 22 °C, 800 ppm CO2) to 5.73 (at 26 °C, 800 ppm CO2) in WH8109.
In the strain RCC555, which has the characteristics of both coastal and open ocean isolates, the mean C/N ratios (mol/mol) varied between 4.48 and 5.16 between the different CO2 and temperature treatments (Figure 4). Two-way ANOVA revealed significant interaction (p = 0.01) between CO2 and temperature in RCC555. Tukey’s HSD test (Table S3, Supplementary Data) showed that the C/N (mol/mol) ratios at 26 °C, 600 ppm, was significantly lower than the C/N ratios at 22 °C and 24 °C under all the CO2 levels. At 26 °C, 600 ppm, the C/N ratio was also significantly lower than the C/N ratio at 26 °C, 400 ppm, and at 26 °C, 800 ppm.
In the coastal isolate, RCC2673, the mean C/N ratios (mol/mol) ranged from 4.79 at 24 °C, 400 ppm, to 5.14 at 22 °C, 400 ppm (Figure 4). Two-way ANOVA revealed that temperature had a significant effect (p = 0.03) on the C/N (mol/mol) ratios in RCC2673. Tukey’s HSD test showed that the C/N (mol/mol) ratios at 22 °C were significantly higher than those at 24 °C (p = 0.03).

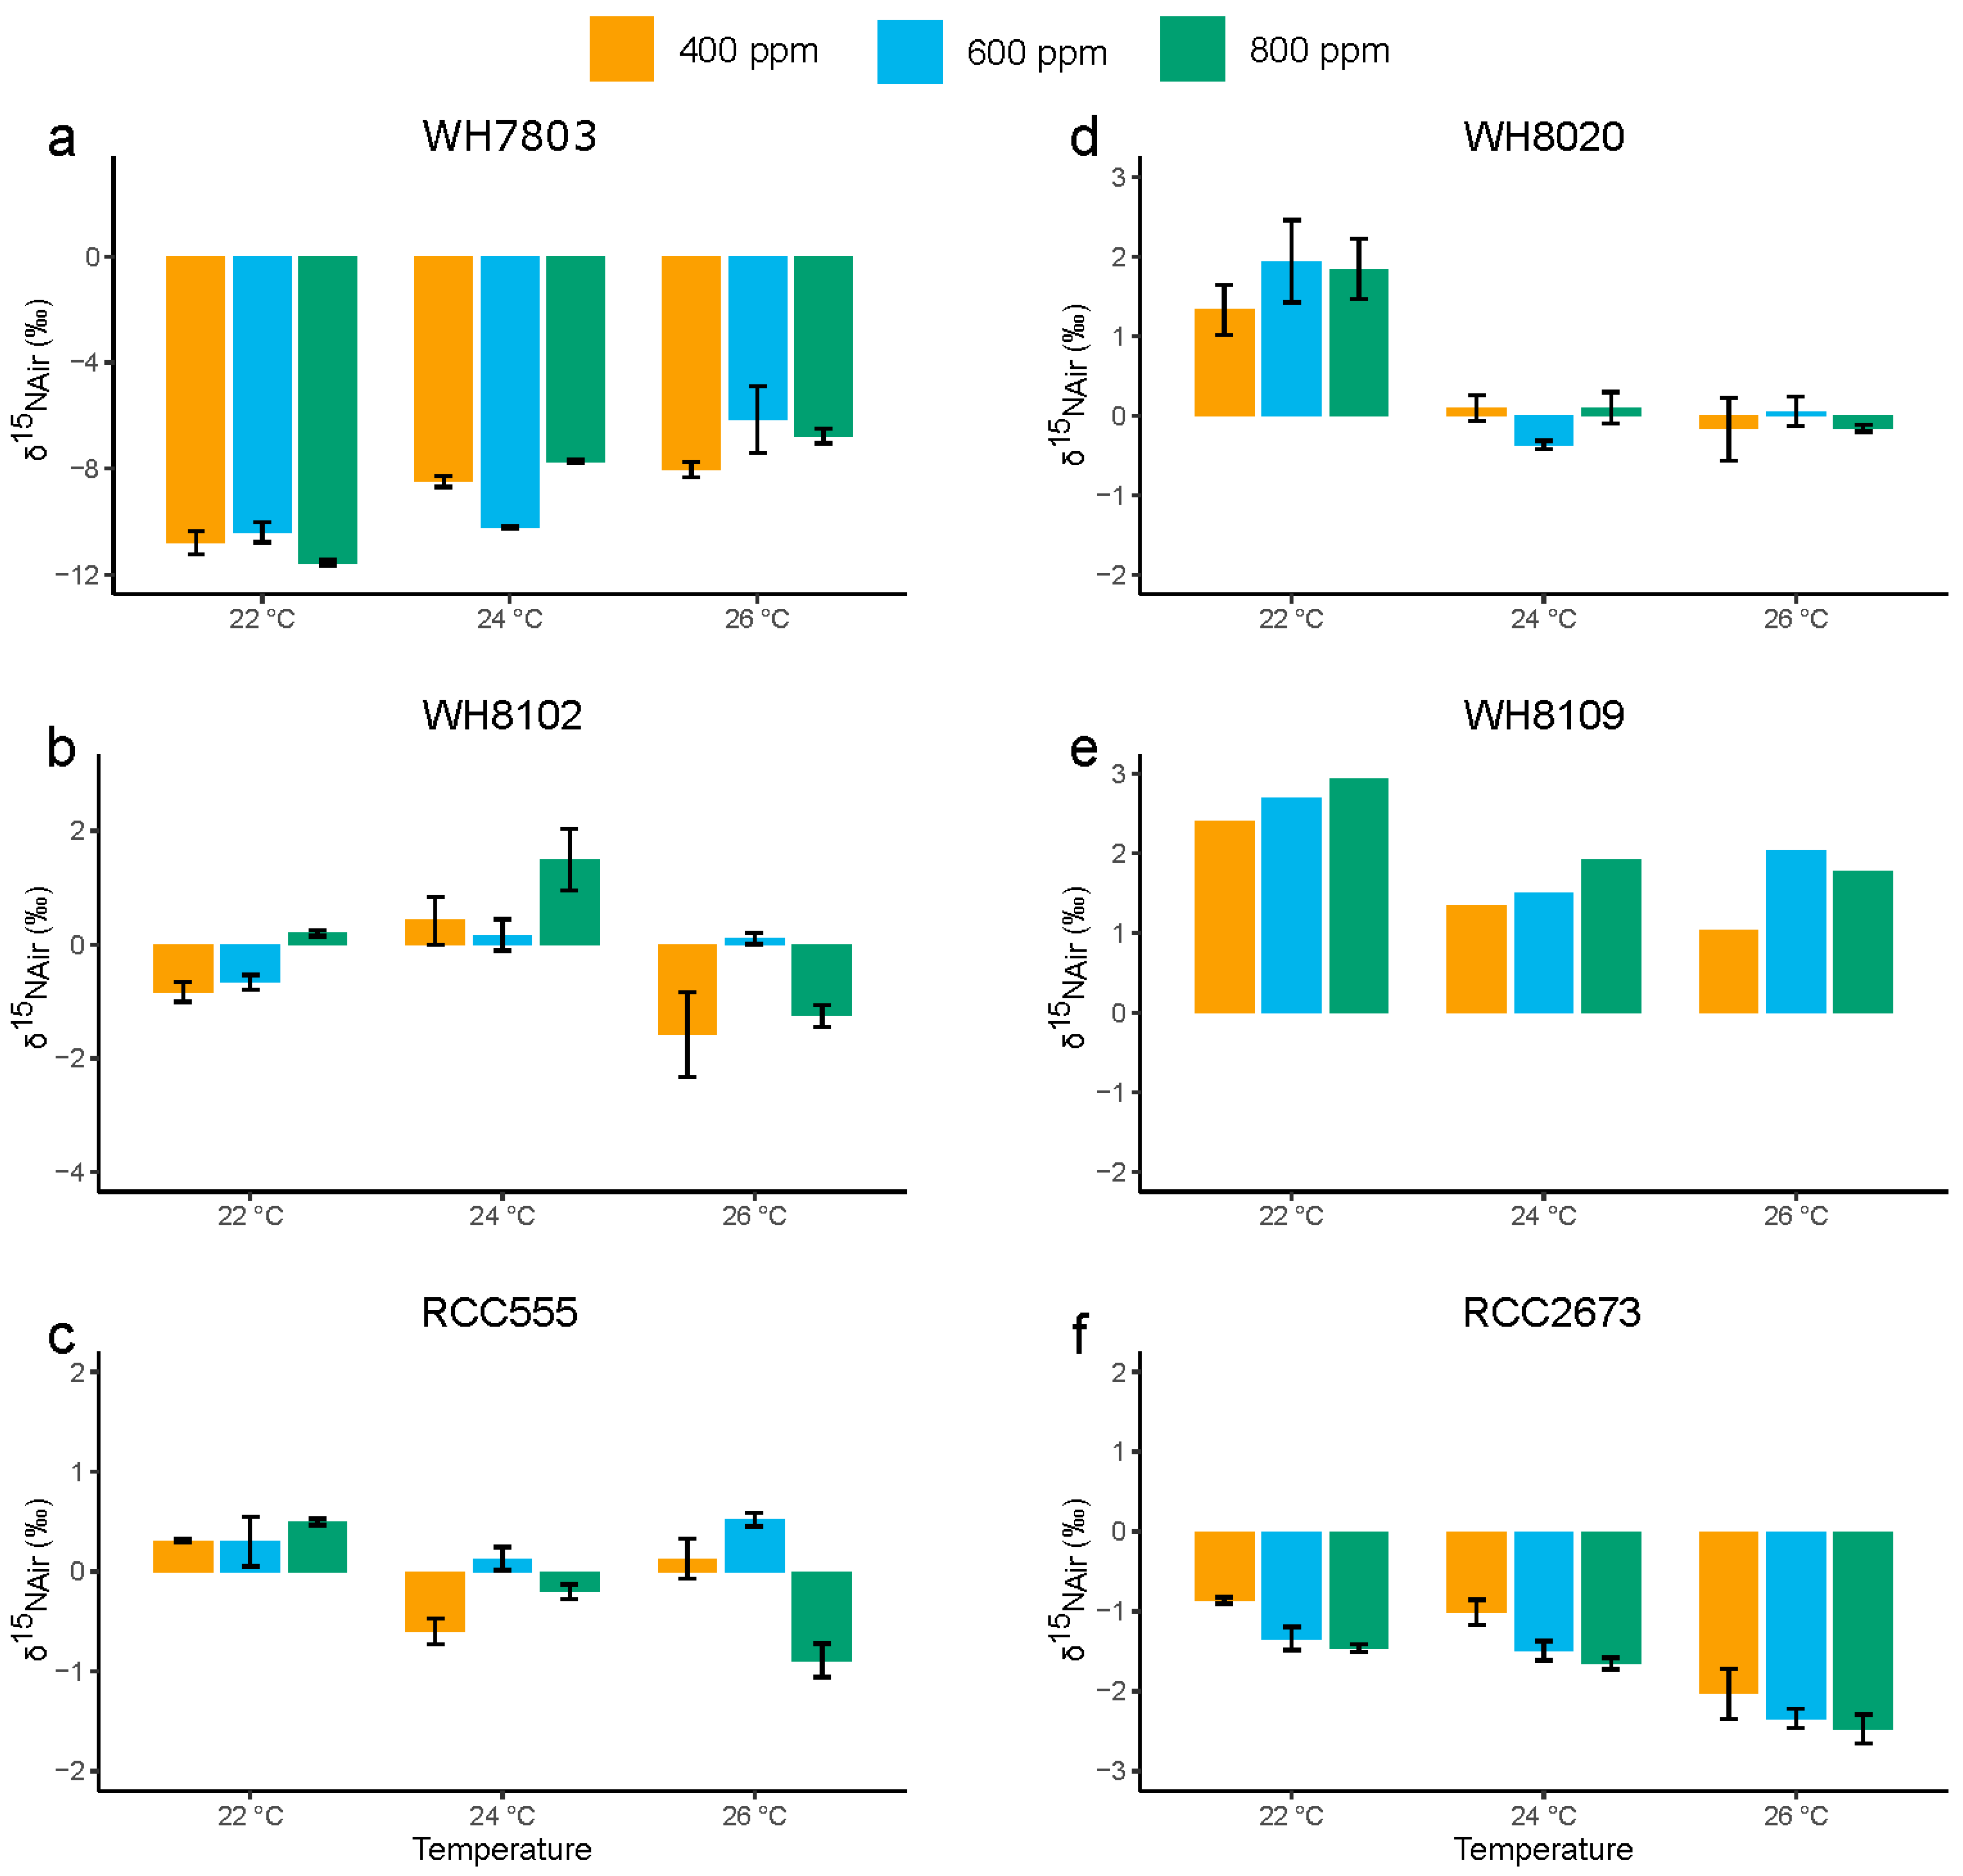
3.4. Nitrogen Stable Isotopic Composition

Nitrogen stable isotopic composition, δ15N (‰), varied widely between the Synechococcus strains. However, similar δ15N (‰) patterns were obtained in the coastal isolates WH8020, WH8109 and RCC2673 (Figure 5). The δ15N (‰) values in these strains were highest at 22 °C and decreased at higher temperatures. The opposite pattern in δ15N (‰) was observed in the open ocean isolate WH7803, where the δ15N (‰) increased with increase in the incubation temperature. These patterns are discussed below.

3.4.1. Nitrogen Stable Isotopic Composition in the Open Ocean Isolates WH7803 and WH8102

δ15N (‰) in WH7803 ranged from −11.56 at 22 °C, 800 ppm CO2, to −6.15 at 26 °C, 600 ppm CO2 (Figure 5a). Two-way ANOVA showed significant interaction (p = 0.004) between CO2 and temperature in WH7803. Tukey’s HSD test (Table S4, Supplementary Data) showed that the δ15N at 26 °C and 24 °C were significantly higher than that at 22 °C for most of the CO2 treatments. This result was contrary to the specific growth rate patterns in WH7803, which decreased significantly at higher temperatures of 24 °C and 26 °C. In accordance with this observation, WH7803 showed a significant (p = 0.02) negative correlation (r = −0.75) between the specific growth rates and the δ15N under the different treatments (Table 2).
In the strain WH8102, the highest mean δ15N (‰) of 1.49 was obtained for the 24 °C, 800 ppm CO2 treatment. The lowest mean δ15N of −1.58 was obtained at 26 °C, 400 ppm CO2 (Figure 5b). Two-way ANOVA revealed a significant interactive effect (p = 0.02) between the CO2 and temperature treatments in this strain. Tukey’s HSD test (Table S4, Supplementary Data) showed that the δ15N (‰) at 24 °C, 800 ppm CO2, was significantly higher than that at 22 °C, 400 ppm, and 22 °C, 600 ppm, with p values of 0.007 and 0.013, respectively. The δ15N at 24 °C, 800 ppm CO2, was also significantly higher than that at 26 °C, 400 ppm, and 26 °C, 800 ppm (with p values of 0.0003 and 0.001, respectively).

3.4.2. Nitrogen Stable Isotopic Composition in RCC555

In the strain RCC555, δ15N was highest (0.52) at 26 °C, 600 ppm CO2 level, followed by a value of 0.5 at 22 °C, 800 ppm CO2 (Figure 5c). The lowest value of −0.89 was obtained at 26 °C, 800 ppm CO2. Two-way ANOVA revealed a significant interactive effect (p < 0.05) between the CO2 and temperature treatments in this strain. Tukey’s HSD test (Table S4, Supplementary Data) showed that the δ15N at 26 °C, 800 ppm CO2, was significantly lower than the δ15N values at 22 °C under all the CO2 treatments, at 24 °C, 600 ppm, and 24 °C, 800 ppm CO2 levels. The δ15N at 26 °C, 800 ppm CO2, was also significantly lower than the δ15N values at 26 °C, 400 ppm, and 26 °C, 600 ppm CO2 levels.

3.4.3. Nitrogen Stable Isotopic Composition in the Coastal Isolates WH8020, WH8109 and RCC2673

In the strain WH8020, the highest mean values of δ15N were obtained at 22 °C (Figure 5d). The δ15N values were significantly lower (p < 0.05) at 24 °C and 26 °C as compared to those at 22 °C. The lowest value (−0.37) of δ15N was observed at 24 °C, 600 ppm CO2, and the highest value (1.94) was observed at 22 °C, 600 ppm CO2.
In the strain WH8109, the highest δ15N of 2.94 was obtained at 22 °C, 800 ppm CO2. The δ15N in WH8109 decreased with increase in temperature from 22 °C to 26 °C. Also, the δ15N value was lowest at 400 ppm CO2 level under all the temperature levels and increased at higher CO2 levels (Figure 5e). Unlike the negative correlation of the δ15N values and growth rates obtained in WH7803, WH8109 showed a positive correlation (r = 0.68) between the growth rates and the δ15N values under the different experimental conditions. The correlation obtained was significant, with a p value of 0.04 (Table 2).
In the strain RCC2673, the variation in the δ15N pattern was similar to that observed in WH8109: lower δ15N values at higher temperatures. Also, the δ15N decreased with increase in CO2 level under all the temperature treatments (Figure 5f). Two-way ANOVA showed that the effect of CO2 and temperature were significant (p < 0.05) in RCC2673. The δ15N values obtained at 400 ppm were significantly higher than that obtained at 600 ppm (p = 0.02) and at 800 ppm (p = 0.002). Also, the δ15N values at 22 °C and at 24 °C were significantly higher than that at 26 °C (p < 0.05).

3.5. Phylogenetic Analysis

The phylogenetic tree based on the CCM proteins BicA and ChpX showed that WH7803 (sub-cluster 5.1B), WH8020 (sub-cluster 5.1A) and RCC555 (sub-cluster 5.1B) are more closely related among each other than the group consisting of the strains WH8102, WH8109 and RCC2673, belonging to sub-cluster 5.1A (Figure 6a,b). However, within each group, the evolutionary relationship between BiCA and ChpX proteins of the three strains differed. For example, the ChpX proteins of WH7803 and RCC555 were more closely related than ChpX of WH8020, while the BicA proteins of WH7803 and WH8020 were more closely related than the BicA protein of RCC555. However, even though WH7803, WH8020 and RCC555 are more closely related, the specific growth rates, C/N ratios (mol/mol) and δ15N patterns of the strains WH7803, WH8020 and RCC555 are not similar to each other (see Figure 2, Figure 4 and Figure 5). This pattern also holds true for the other group of more closely related strains WH8102, WH8109 and RCC2673. Also, the evolutionary relatedness did not correlate with the isolation site of the strains (Figure 6a,b).

4. Discussion

The response of six marine Synechococcus strains isolated from different coastal and open ocean environments were characterized by varying the levels of CO2 and temperature, with the goal of understanding the simultaneous effect of increased CO2 and temperature, predicted to co-occur by the year 2100. Our studies on the specific growth rate responses of the Synechococcus strains showed that, even though the two experimental parameters (CO2 levels and temperature) had a significant interactive effect on the strains, temperature was a stronger driver of the changes in the specific growth rates in Synechococcus. In particular, an increase in the experimental temperature to 26 °C resulted in a significant reduction in specific growth rates in most of the strains. Our result was in accordance with the study of Fu et al. [5] who investigated the effect of “greenhouse” conditions (24 °C and 750 ppm CO2) on the growth rate of the Synechococcus strain WH7803. They found that temperature had a marked effect on the growth rate of WH7803, while the effect of increased CO2 on the growth rate of this strain was modest and not statistically significant. In another ocean acidification lab-based study using the diatom, Phaeodactylum tricornutum, Li et al. [3] found that cell size, pigmentation, growth rate and effective quantum yield of P. tricornutum was not affected by enhanced dissolved CO2 and lowered pH.
Our findings also correlated with various field incubation experiments performed on entire phytoplankton communities including picocyanobacteria. Tortell et al. [29] conducted a field incubation experiment and showed a substantial shift in the taxonomic composition of Equatorial Pacific phytoplankton assemblages exposed to CO2 levels of 150 and 750 ppm. However, they found that, despite significant changes in taxonomic composition, primary productivity and total biomass did not differ significantly between the CO2 treatments at any sampling point during the incubation. Hare et al. [6] incubated phytoplankton communities from two Bering Sea regimes under conditions of elevated sea surface temperature and/or pCO2 levels similar to end of the century values. In their “greenhouse ocean” simulations, the phytoplankton community composition shifted from diatoms to nanophytoplankton. They found that this change in community composition was driven largely by elevated temperature, with secondary effects from increased pCO2. Finally, Lomas et al. [28] studied the short-term physiological and acclimation responses of natural picocyanobacterial populations to changes in pCO2. They did not observe a clear response of C-fixation rates to changes in pCO2 in these populations. Moreover, they also showed that changes in cell size and pigment content in picocyanobacteria were minor and did not change consistently with changes in pCO2.
Similar to the specific growth rate observations, temperature had a stronger influence on the photosynthetic performance parameters, Fv/Fm and σPSII, in the Synechococcus strains. Phytoplankton, such as microalgae and cyanobacteria, face several challenges in acquiring CO2 from the environment [42]. One of the major challenges is presented due to the properties of the primary CO2-fixing enzyme, Rubisco, which has a low catalytic turnover rate and is inhibited by oxygen [43]. Phytoplankton have adapted to this challenge through the development of a CO2-concentrating-mechanism (CCM), which confers them the ability to survive under limiting CO2 concentrations [38,42]. CCM aids in the transport and accumulation of inorganic carbon (Ci; HCO3, and CO2) actively within the cell. This Ci pool is, thereafter, utilized to provide elevated CO2 levels around Rubisco, thereby increasing the CO2 fixation efficiency [38]. Therefore, although CO2 is a substrate for photosynthesis, CCM adds an extra regulatory step that shields the photosynthetic machinery from directly sensing ambient changes in CO2 [44]. In the presence of a CCM, photosynthetic rates may not respond directly to ambient changes in CO2, and the cyanobacterial cell may be carbon-saturated even at low ambient CO2 levels [44]. We hypothesized that the presence of a CCM led to nonsignificant effects of the variations in the experimental CO2 concentrations on the growth rates and the photosynthetic performance parameters in our strains.
Oxygenic photosynthesis, the process that converts CO2 to organic carbon, is remarkably conserved among plants, algae and cyanobacteria. Photosynthetic reactions are comprised of light-dependent and light-independent sections (also referred to as light and dark reactions). The light-dependent reactions of photosynthesis generate energy required to fuel the light-independent reaction, as well as the CCM [44]. Also, light-saturated C-fixation rates are enzymatically controlled and photosynthetic enzymes, such as Rubisco, have temperature-dependent kinetics [5,44] and are independent of the cell’s CCM. Increasing temperature increases the substrate-saturated reaction rate of Rubisco [5]. In addition, the enzymatic dark reactions of photosynthesis are sensitive not only to CO2, but also to temperature [5]. Mackey et al. [45] studied how temperature affects growth and photosynthesis in 10 Synechococcus strains isolated from both coastal and oceanic regions of the world’s oceans. They showed that photosynthetic efficiency and photosynthetic protein abundance in Synechococcus are highly sensitive to temperature. Specifically, in Synechococcus WH8102, the abundance of photosynthetic pigment proteins and proteins associated with the photosynthetic electron transport chain (ETC) increased with increasing temperature, an acclimation response that would support higher photosynthetic rates, allow the ETC to remain more oxidized to avoid photodamage, and generate additional NADPH needed in the light-independent reactions to fix carbon. These physiological observations provide a mechanistic explanation that further supports our experimental finding as to why temperature has a stronger influence on the photosynthetic performance parameters and specific growth rates in Synechococcus than the variations in the CO2 levels.
Our results also showed that the highest values of the maximum photochemical efficiency of PSII in the dark-adapted state (Fv/Fm) were obtained at a culture temperature of 26 °C. However, the specific growth rates of the strains were significantly lower at 26 °C than at lower culture temperatures. This observation possibly indicates that the photosynthetic exudates released were used to balance electron flow due to high photosynthetic rates at higher temperatures, rather than being used for the doubling of cells. In line with our observation, Hare et al. [6] found that increased temperature enhanced the maximum potential carbon fixation rates in nanophytoplankton, even though it resulted in an overall lower algal biomass (measured as chlorophyll a). They indicated that the diversion of the photosynthate from particulate to dissolved organic carbon production at elevated temperatures could possibly have led to their finding.
The elemental composition, including the C/N ratios of marine picocyanobacteria, is critically important for consumers, such as ciliates, copepods, fish and shrimp, because food nutritional quality influences energy flow through marine food chains [3]. The C/N (mol/mol) ratios for most of the strains in our study were not affected by the experimental changes in temperature or CO2 level. Our C/N result in the strain WH7803 was in accordance to that of Fu et al. [5], who reported negligible change in C/N ratio in the same strain under high CO2 concentration, as well as a nonsignificant change in the elemental ratios in WH7803 at the different temperature levels. Bertilsson et al. [46] showed that the C/N molar ratios in the Synechococcus strains WH8103 and WH8102 ranged from 5.0 to 5.4 under nutrient-repleted conditions. Additionally, Lopez et al. [47] observed C/N molar ratios of 5.15–6.05 in the Synechococcus strain WH8102. The C/N (mol/mol) ratios of our strains also fell within these ranges under the different experimental treatments. Our C/N (mol/mol) results also showed that phylogenetic relatedness of the strains did not influence the C/N molar ratio patterns in the strains. Consistent with our observation, in their study using 30 strains of eukaryotic phytoplankton, Garcia et al. [48] showed that phylogeny and elemental stoichiometry are not related. Though we observed significant interaction between CO2 and temperature in the strain RCC555, our overall C/N molar ratios for the strains did not show a significant effect of either CO2 or temperature alone or in combination. Therefore, we can speculate that the nutritional quality of Synechococcus, at least for certain strains under nutrient-repleted conditions, will not be strongly affected in the future. However, the effect of CO2 and temperature on picophytoplankton (picocyanobacteria, as well as picoeukaryotes) elemental composition and their food nutritional quality for higher trophic levels is relatively understudied as compared to other larger phytoplankton, such as diatoms, chlorophytes and N2 fixers [19,21,48].
Future studies on how the elemental ratios of picoeukaryotes and picocyanobacteria are impacted by ocean acidification and other environmental factors affected by global change might improve our understanding of the food nutritional quality of picophytoplankton in the future ocean. Specifically, cellular stoichiometry is controlled by a number of cellular and biogeochemical factors. Moreno and Martiny [33] argue that specific physiological mechanisms have a strong impact on plankton and community stoichiometry in nutrient-rich environments, whereas biogeochemical interactions are important for the stoichiometry of the oligotrophic gyres. Elemental stoichiometry in phytoplankton is strongly linked to nutrient availability, with oligotrophic environments showing higher C/N ratios compared to high-nutrient regions [49]. Because sea surface temperature warming is expected to intensify nutrient limitation in the future as the oligotrophic gyres expand, it is likely that nutrient availability will be a significant driver of changes to Synechococcus elemental stoichiometry in the future, with temperature and possibly pCO2 having secondary effects. Future multi-stressor studies conducted under nutrient-limited conditions would be helpful in understanding these interactions among simultaneously occurring global change variables.
The nitrogen isotopic composition, δ15N (‰), of the strains were highly variable under the different treatment conditions. Because different batches of seawater were used to prepare the growth media (see methods) for the different strains, we could not directly compare values between strains but rather looked for similar trends among the treatments. In WH7803, the δ15N values were lowest at 22 °C and increased significantly with increase in temperature. Contrary to WH7803, in WH8020, δ15N values were highest at 22 °C and were significantly lower at 24 °C and 26 °C. Similar to WH8020, in WH8109 and RCC2673, the δ15N values were highest at 22 °C and decreased with increase in temperature. In addition, the δ15N values (−2.47 to −0.86) in RCC2673 were in the same range as the δ15N values (−3.6 to −0.8) observed by Bauersachs et al. [50] in Synechococcus sp. grown on nitrate as a source of nitrogen. Bauersachs et al. [50] also observed a high variability in the nitrogen isotopic composition of nitrate-utilizing cyanobacteria, even for strains belonging to the same genus and when grown under the same experimental conditions. They attributed this large variability in δ15N to nitrate limitation occurring during the growth of nitrate-utilizing cyanobacteria. Because we maintained low biomass levels during our experiments, nitrate limitation should not have caused the δ15N variability in our strains. We attributed the δ15N variability to the different metabolic processes operational in the strains due to the presence of different enzymes. For instance, it has been previously reported that the Synechococcus strains belonging to sub-cluster 5.1 A (Table 1) have significantly fewer enzymes that sense and respond to the environment than those strains belonging to sub-cluster 5.1 B (Table 1) [11].
Garcia et al. [48] reported that the effects of growth rate on elemental stoichiometry may be important in recognizing relationships between phylogeny and elemental stoichiometry. In our study, the phylogenetically similar strains (WH7803, WH8020 and RCC555) showed a negative correlation between δ15N and growth rates under the different experimental treatments (Figure S3, Supplementary Data). As reported by Bauersachs et al. [50], proteins and chlorophyll have recently been shown to have lower 15N as compared to the isotopic composition of the entire cell. Increased growth rates would mean an increased production of the molecules depleted in 15N, such as proteins and chlorophyll, and this might have resulted in a decrease in the bulk δ15N values at higher growth rates in our strains. However, in the strain WH8109, δ15N and the growth rates showed a significant positive correlation. Because of the lack of triplicate samples in WH8109, we could not conclusively determine the relationship between the bulk δ15N values and growth rates in this strain.
Six Synechococcus strains from coastal and open ocean environments were selected to determine their degree of diversity in responses to increasing temperature and pCO2. Inclusion of diverse strains is important in characterizing the potential responses of Synechococccus as a genus to future global change, given the relatively high intergeneric genetic diversity of the strains. Moreover, prior studies have shown divergent responses of coastal and oceanic Synechococcus strains to environmental factors, including light [9], temperature [45] and iron availability [51]. These differences among strains may be due, in part, to the evolution of different acclimation strategies in coastal environments, which tend to be more biogeochemically dynamic, versus oceanic environments, which tend to be more stable.
In this study, it was found that the growth and photophysiological responses of the six strains in response to increased temperature and pCO2 were similar in that temperature had a larger effect than pCO2, possibly due to the presence of CCMs. This observation is important because Synechococcus as a genus is distributed globally over a large range of latitudes, from the equator to the polar circle [52,53]; hence, strains are expected to have different temperature optima and will experience different increases in temperature in the future depending on latitude, given that high-latitude regions will warm more quickly and to a greater degree than low-latitude regions. The strains used in this study were predominantly isolated from tropical and subtropical waters, so additional experiments with high-latitude strains may reveal additional and/or divergent responses to temperature.
pCO2 did not cause strong responses in the coastal or oceanic strains tested here. Coastal environments are generally characterized by greater variations in pCO2 compared to the open ocean owing to processes such as upwelling, which brings CO2-enriched deep water to the surface [54], and algal blooms, which deplete the water of CO2 as the cells consume it during photosynthesis. Based on this, it might be expected that coastal strains would be more resilient to changes in pCO2 relative to oceanic strains. However, the lack of differentiated responses among strains tested here suggests that the CCM of Synechococcus across the genus confers lower sensitivity of cells to ambient pCO2, regardless of the site of origin.
In the ocean, temperature and pH are not entirely independent variables, which is one reason why using a factorial multi-stressor experimental design is beneficial. Temperature influences pH directly due to the temperature dependence of seawater carbonate system chemistry, and indirectly by affecting the air–sea exchange of CO2 [4]. These two processes work in opposition, with warmer temperatures tending to decrease pH due to chemical kinetics and increase pH due to physical kinetics. As a result, there is only a small latitudinal gradient in sea surface pH that is weakly correlated with sea surface temperature [4]. Accordingly, in contrast to temperature, which has a strong latitudinal gradient and influences Synechococcus growth and photophysiology, it is less likely that differences in cellular growth and photophysiological responses to future changes in pCO2 would vary appreciably with latitude with all other variables being equal. However, cellular elemental stoichiometry is strongly influenced by latitudinal variability in ecosystem biogeochemistry [49] and may be more sensitive to future changes in temperature and pCO2 than growth rate and photophysiology. Future multi-stressor studies with diverse strains of Synechococcus should include additional variables that are expected to change in the future, such as nutrient availability, irradiance and spectral quality, to determine their potential interactive effects with temperature and pCO2.

5. Conclusions

The experimental data showed that the temperature variations had a stronger influence than CO2 on the specific growth rates and the photosynthetic performance parameters, Fv/Fm and σPSII, in the marine Synechococcus strains. It was concluded that the CO2-concentrating mechanism (CCM) operational in the strains, which shields the photosynthetic machinery from directly sensing ambient changes in CO2, may have been responsible for this observation. Moreover, because photosynthetic enzymes have temperature-dependent kinetics and are independent of the cyanobacterial CCM, temperature rather than pCO2 is the more significant factor governing the specific growth rates and the photosynthetic parameters in Synechococcus. Thus, ocean temperature is more likely to affect the growth rates, and, therefore, the distribution, of marine Synechoccus strains in the future. However, further studies are needed to determine how other global change variables, such as irradiance and nutrient concentrations, in combination with oceanic pCO2 and temperature variations might impact marine picocyanobacteria on a global scale.

Supplementary Materials

The following supporting information can be downloaded at: https://www.mdpi.com/article/10.3390/su14159508/s1, Figures S1–S3 and Tables S1–S4 are included as supplementary materials.

Author Contributions

S.B. and K.R.M.M. jointly conceived the experiment, planned the design, performed the analyses, and wrote the paper. S.B. conducted the laboratory experiments. All authors have read and agreed to the published version of the manuscript.

Funding

This work was supported by a Turner Research and Travel Award from Turner Designs to S.B., a Clare Boothe Luce endowment from the Henry Luce Foundation to K.R.M.M., and a Simons Early Career Award in Marine Microbial Ecology and Evolution to K.R.M.M.

Institutional Review Board Statement

Not applicable.

Informed Consent Statement

Not applicable.

Data Availability Statement

The data collected during the experiments will be available upon request.

Acknowledgments

We thank P. Haigh, T. Tran, and S. Yamamoto for assistance in conducting the experiments.

Conflicts of Interest

The authors declare that the research was conducted in the absence of any commercial or financial relationship that could be construed as a potential conflict of interest.

References

  1. Gao, K.; Beardall, J.; Häder, D.-P.; Hall-Spencer, J.M.; Gao, G.; Hutchins, D.A. Effects of Ocean Acidification on Marine Photosynthetic Organisms under the Concurrent Influences of Warming, UV Radiation, and Deoxygenation. Front. Mar. Sci. 2019, 6, 322. [Google Scholar] [CrossRef]
  2. Carbon Dioxide Now More than 50% Higher than Pre-Industrial Levels. Available online: https://www.noaa.gov/news-release/carbon-dioxide-now-more-than-50-higher-than-pre-industrial-levels#:~:text=Carbon%20dioxide%20measured%20at%20NOAA’s,of%20California%20San%20Diego%20announced (accessed on 17 July 2022).
  3. Li, W.; Gao, K.; Beardall, J. Interactive effects of ocean acidification and nitrogen-limitation on the diatom Phaeodactylum tricornutum. PLoS ONE 2012, 7, e51590. [Google Scholar] [CrossRef] [Green Version]
  4. Jiang, L.-Q.; Carter, B.R.; Feely, R.A.; Lauvset, S.K.; Olsen, A. Surface ocean pH and buffer capacity: Past, present and future. Sci. Rep. 2019, 9, 18624. [Google Scholar] [CrossRef] [PubMed]
  5. Fu, F.-X.; Warner, M.E.; Zhang, Y.; Feng, Y.; Hutchins, D.A. Effects of increased temperature and CO2 on photosynthesis, growth, and elemental ratios in marine Synechococcus and Prochlorococcus (cyanobacteria)1. J. Phycol. 2007, 43, 485–496. [Google Scholar] [CrossRef]
  6. Hare, C.E.; Leblanc, K.; Ditullio, G.R.; Kudela, R.; Zhang, Y.; Lee, P.A.; Riseman, S.; Hutchins, D.A. Consequences of increased temperature and CO2 for phytoplankton community structure in the Bering Sea. Mar. Ecol. Prog. Ser. 2007, 352, 9–16. [Google Scholar] [CrossRef] [Green Version]
  7. Flombaum, P.; Gallegos, J.L.; Gordillo, R.A.; Rincon, J.; Zabala, L.L.; Jiao, N.A.Z.; Karl, D.M.; Li, W.K.W.; Lomas, M.W.; Veneziano, D.; et al. Present and future global distributions of the marine Cyanobacteria Prochlorococcus and Synechococcus. Proc. Natl. Acad. Sci. USA 2013, 110, 9824–9829. [Google Scholar] [CrossRef] [Green Version]
  8. Scanlan, D.J.; Ostrowski, M.; Mazard, S.; Dufresne, A.; Garczarek, L.; Hess, W.R.; Post, A.F.; Hagemann, M.; Paulsen, I.; Partensky, F. Ecological Genomics of Marine Picocyanobacteria. Microbiol. Mol. Biol. Rev. 2009, 73, 249. [Google Scholar] [CrossRef] [Green Version]
  9. Mackey, K.R.M.; Post, A.F.; McIlvin, M.R.; Saito, M.A. Physiological and proteomic characterization of light adaptations in marine Synechococcus. Environ. Microbiol. 2017, 19, 2348–2365. [Google Scholar] [CrossRef]
  10. Lovindeer, R.; Abbott, L.; Medina, H.; Mackey, K.R.M. Costs and Limitations of Marine Synechococcus Blue-Green Chromatic Acclimation. Front. Mar. Sci. 2021, 8, 1198. [Google Scholar] [CrossRef]
  11. Sohm, J.A.; Ahlgren, N.A.; Thomson, Z.J.; Williams, C.; Moffett, J.W.; Saito, M.A.; Webb, E.A.; Rocap, G. Co-occurring Synechococcus ecotypes occupy four major oceanic regimes defined by temperature, macronutrients and iron. ISME J. 2016, 10, 333–345. [Google Scholar] [CrossRef] [Green Version]
  12. Tai, V.; Palenik, B. Temporal variation of Synechococcus clades at a coastal Pacific Ocean monitoring site. ISME J. 2009, 3, 903–915. [Google Scholar] [CrossRef] [Green Version]
  13. DuRand, M.D.; Olson, R.J.; Chisholm, S.W. Phytoplankton population dynamics at the Bermuda Atlantic Time-series station in the Sargasso Sea. Deep. Sea Res. Part II Top. Stud. Oceanogr. 2001, 48, 1983–2003. [Google Scholar] [CrossRef]
  14. Bao, N.; Gao, K. Interactive Effects of Elevated CO2 Concentration and Light on the Picophytoplankton Synechococcus. Front. Mar. Sci. 2021, 8, 634189. [Google Scholar] [CrossRef]
  15. Barcelos e Ramos, J.; Biswas, H.; Schulz, K.G.; LaRoche, J.; Riebesell, U. Effect of rising atmospheric carbon dioxide on the marine nitrogen fixer Trichodesmium. Glob. Biogeochem. Cycles 2007, 21, GB2028. [Google Scholar] [CrossRef] [Green Version]
  16. Hutchins, D.A.; Fu, F.-X.; Zhang, Y.; Warner, M.E.; Feng, Y.; Portune, K.; Bernhardt, P.W.; Mulholland, M.R. CO2 control of Trichodesmium N2 fixation, photosynthesis, growth rates, and elemental ratios: Implications for past, present, and future ocean biogeochemistry. Limnol. Oceanogr. 2007, 52, 1293–1304. [Google Scholar] [CrossRef] [Green Version]
  17. Kranz, S.A.; Eichner, M.; Rost, B. Interactions between CCM and N2 fixation in Trichodesmium. Photosynth. Res. 2011, 109, 73–84. [Google Scholar] [CrossRef] [Green Version]
  18. Levitan, O.; Rosenberg, G.; Setlik, I.; SetlikovA, E.; Grigel, J.; Klepetar, J.; Prasil, O.; Berman-Frank, I. Elevated CO2 enhances nitrogen fixation and growth in the marine cyanobacterium Trichodesmium. Glob. Chang. Biol. 2007, 13, 531–538. [Google Scholar] [CrossRef]
  19. Eichner, M.; Rost, B.; Kranz, S.A. Diversity of ocean acidification effects on marine N2 fixers. J. Exp. Mar. Biol. Ecol. 2014, 457, 199–207. [Google Scholar] [CrossRef] [Green Version]
  20. Garcia, N.S.; Fu, F.-X.; Breene, C.L.; Yu, E.K.; Bernhardt, P.W.; Mulholland, M.R.; Hutchins, D.A. Combined effects of CO2 and light on large and small isolates of the unicellular N2-fixing cyanobacterium Crocosphaera watsonii from the western tropical Atlantic Ocean. Eur. J. Phycol. 2013, 48, 128–139. [Google Scholar] [CrossRef]
  21. King, A.L.; Jenkins, B.D.; Wallace, J.R.; Liu, Y.; Wikfors, G.H.; Milke, L.M.; Meseck, S.L. Effects of CO2 on growth rate, C:N:P, and fatty acid composition of seven marine phytoplankton species. Mar. Ecol. Prog. Ser. 2015, 537, 59–69. [Google Scholar] [CrossRef] [Green Version]
  22. Xie, L.; Macken, A.; Johnsen, B.; Norli, M.; Skogan, O.A.S.; Tollefsen, K.E. The MicroClimate Screen—A microscale climate exposure system for assessing the effect of CO2, temperature and UV on marine microalgae. Mar. Environ. Res. 2022, 179, 105670. [Google Scholar] [CrossRef] [PubMed]
  23. Delille, B.; Harlay, J.; Zondervan, I.; Jacquet, S.; Chou, L.; Wollast, R.; Bellerby, R.G.J.; Frankignoulle, M.; Borges, A.V.; Riebesell, U.; et al. Response of primary production and calcification to changes of pCO2 during experimental blooms of the coccolithophorid Emiliania huxleyi. Glob. Biogeochem. Cycles 2005, 19, GB2023. [Google Scholar] [CrossRef] [Green Version]
  24. Paulino, A.I.; Egge, J.K.; Larsen, A. Effects of increased atmospheric CO2 on small and intermediate sized osmotrophs during a nutrient induced phytoplankton bloom. Biogeosciences 2008, 5, 739–748. [Google Scholar] [CrossRef] [Green Version]
  25. Barakat, K.M.; El-Sayed, H.S.; Khairy, H.M.; El-Sheikh, M.A.; Al-Rashed, S.A.; Arif, I.A.; Elshobary, M.E. Effects of ocean acidification on the growth and biochemical composition of a green alga (Ulva fasciata) and its associated microbiota. Saudi. J. Biol. Sci. 2021, 28, 5106–5114. [Google Scholar] [CrossRef] [PubMed]
  26. El-Sayed, H.S.; Elshobary, M.E.; Barakat, K.M.; Khairy, H.M.; El-Sheikh, M.A.; Czaja, R.; Allam, B.; Senousy, H.H. Ocean acidification induced changes in Ulva fasciata biochemistry may improve Dicentrarchus labrax aquaculture via enhanced antimicrobial activity. Aquaculture 2022, 560, 738474. [Google Scholar] [CrossRef]
  27. Keys, M.; Tilstone, G.; Findlay, H.S.; Widdicombe, C.E.; Lawson, T. Effects of elevated CO2 and temperature on phytoplankton community biomass, species composition and photosynthesis during an experimentally induced autumn bloom in the western English Channel. Biogeosciences 2018, 15, 3203–3222. [Google Scholar] [CrossRef] [Green Version]
  28. Lomas, M.; Hopkinson, B.; Losh, J.; Ryan, D.; Shi, D.; Xu, Y.; Morel, F. Effect of ocean acidification on cyanobacteria in the subtropical North Atlantic. Aquat. Microb. Ecol. 2012, 66, 211–222. [Google Scholar] [CrossRef] [Green Version]
  29. Tortell, P.D.; DiTullio, G.; Sigman, D.; Morel, F.M.M.; Tortell, P.D.; DiTullio, G.R.; Sigman, D.M.; Morel, F.M.M. CO2 effects on taxonomic composition and nutrient utilization in an Equatorial Pacific phytoplankton assemblage. Mar. Ecol. Prog. Ser. 2002, 236, 37–43. [Google Scholar] [CrossRef]
  30. Basu, S.; Mackey, K. Phytoplankton as Key Mediators of the Biological Carbon Pump: Their Responses to a Changing Climate. Sustainability 2018, 10, 869. [Google Scholar] [CrossRef] [Green Version]
  31. DeVries, T.; Primeau, F.; Deutsch, C. The sequestration efficiency of the biological pump. Geophys. Res. Lett. 2012, 39, L13601. [Google Scholar] [CrossRef] [Green Version]
  32. Andersson, A.J.; Kline, D.I.; Edmunds, P.J.; Archer, S.D.; Bednaršek, N.; Carpenter, R.C.; Chadsey, M.; Goldstein, P.; Grottoli, A.G.; Hurst, T.P.; et al. Understanding ocean acidification impacts on organismal to ecological scales. Oceanography 2015, 28, 16–27. [Google Scholar] [CrossRef] [Green Version]
  33. Moreno, A.R.; Martiny, A.C. Ecological Stoichiometry of Ocean Plankton. Annu. Rev. Mar. Sci. 2018, 10, 43–69. [Google Scholar] [CrossRef] [PubMed]
  34. Waterbury, J.B.; Watson, S.W.; Valois, F.W.; Franks, D.G. Biological and ecological characterization of the marine unicellular cyanobacterium Synechococcus. Can. Bull. Fish Aquat. Sci. 1986, 214, 71–120. [Google Scholar]
  35. Campbell, D.; Hurry, V.; Clarke, A.K.; Gustafsson, P.; Oquist, G. Chlorophyll fluorescence analysis of cyanobacterial photosynthesis and acclimation. Microbiol. Mol. Biol. Rev. 1998, 62, 667–683. [Google Scholar] [CrossRef] [Green Version]
  36. Mackey, K.R.M.; Paytan, A.; Grossman, A.R.; Bailey, S. A photosynthetic strategy for coping in a high-light, low-nutrient environment. Limnol. Oceanogr. 2008, 53, 900–913. [Google Scholar] [CrossRef] [Green Version]
  37. Barrie, A.; Davies, J.E.; Park, A.J.; Workman, C.T. Continuous-flow stable isotope analysis for biologists. Spectroscopy 1989, 4, 42–52. [Google Scholar]
  38. Price, G.D.; Badger, M.R.; Woodger, F.J.; Long, B.M. Advances in understanding the cyanobacterial CO2-concentrating-mechanism (CCM): Functional components, Ci transporters, diversity, genetic regulation and prospects for engineering into plants. J. Exp. Bot. 2008, 59, 1441–1461. [Google Scholar] [CrossRef]
  39. Edgar, R.C. MUSCLE: Multiple sequence alignment with high accuracy and high throughput. Nucleic Acids Res. 2004, 32, 1792–1797. [Google Scholar] [CrossRef] [PubMed] [Green Version]
  40. Kumar, S.; Stecher, G.; Li, M.; Knyaz, C.; Tamura, K. MEGA X: Molecular Evolutionary Genetics Analysis across Computing Platforms. Mol. Biol. Evol. 2018, 35, 1547–1549. [Google Scholar] [CrossRef] [PubMed]
  41. Jones, D.T.; Taylor, W.R.; Thornton, J.M. The rapid generation of mutation data matrices from protein sequences. Comput. Appl. Biosci. 1992, 8, 275–282. [Google Scholar] [CrossRef] [PubMed]
  42. Basu, S.; Roy, A.S.; Mohanty, K.; Ghoshal, A.K. CO2 biofixation and carbonic anhydrase activity in Scenedesmus obliquus SA1 cultivated in large scale open system. Bioresour. Technol. 2014, 164, 323–330. [Google Scholar] [CrossRef] [PubMed]
  43. Satagopan, S.; Huening, K.A.; Tabita, F.R. Selection of cyanobacterial (Synechococcus sp. strain PCC 6301) RubisCO variants with improved functional properties that confer enhanced CO2-dependent growth of Rhodobacter capsulatus, a photosynthetic bacterium. Mol. Biol. Physiol. 2019, 10, e01537-19. [Google Scholar] [CrossRef] [Green Version]
  44. Mackey, K.R.M.; Morris, J.J.; Morel, F.M.M.; Kranz, S.A. Response of Photosynthesis to Ocean Acidification. Oceanography 2015, 28, 74–91. [Google Scholar] [CrossRef]
  45. Mackey, K.R.M.; Paytan, A.; Caldeira, K.; Grossman, A.R.; Moran, D.; McIlvin, M.; Saito, M.A. Effect of temperature on photosynthesis and growth in marine Synechococcus spp. Plant Physiol. 2013, 163, 815–829. [Google Scholar] [CrossRef] [Green Version]
  46. Bertilsson, S.; Berglund, O.; Karl, D.M.; Chisholm, S.W. Elemental composition of marine Prochlorococcus and Synechococcus: Implications for the ecological stoichiometry of the sea. Limnol. Oceanogr. 2003, 48, 1721–1731. [Google Scholar] [CrossRef]
  47. Lopez, J.S.; Garcia, N.S.; Talmy, D.; Martiny, A.C. Diel variability in the elemental composition of the marine cyanobacterium Synechococcus. J. Plankton Res. 2016, 38, 1052–1061. [Google Scholar] [CrossRef] [Green Version]
  48. Garcia, N.S.; Sexton, J.; Riggins, T.; Brown, J.; Lomas, M.W.; Martiny, A.C. High Variability in Cellular Stoichiometry of Carbon, Nitrogen, and Phosphorus within Classes of Marine Eukaryotic Phytoplankton under Sufficient Nutrient Conditions. Front. Microbiol. 2018, 9, 543. [Google Scholar] [CrossRef] [PubMed] [Green Version]
  49. Martiny, A.C.; Pham, C.T.A.; Primeau, F.W.; Vrugt, J.A.; Moore, J.K.; Levin, S.A.; Lomas, M.W. Strong latitudinal patterns in the elemental ratios of marine plankton and organic matter. Nat. Geosci. 2013, 6, 279–283. [Google Scholar] [CrossRef]
  50. Bauersachs, T.; Schouten, S.; Compaoré, J.; Wollenzien, U.; Stal, L.J.; Sinninghe Damsteé, J.S. Nitrogen isotopic fractionation associated with growth on dinitrogen gas and nitrate by cyanobacteria. Limnol. Oceanogr. 2009, 54, 1403–1411. [Google Scholar] [CrossRef]
  51. Mackey, K.R.M.; Post, A.F.; McIlvin, M.R.; Cutter, G.A.; John, S.G.; Saito, M.A. Divergent responses of Atlantic coastal and oceanic Synechococcus to iron limitation. Proc. Natl. Acad. Sci. USA 2015, 112, 9944–9949. [Google Scholar] [CrossRef] [Green Version]
  52. Zwirglmaier, K.; Jardillier, L.; Ostrowski, M.; Mazard, S.; Garczarek, L.; Vaulot, D.; Not, F.; Massana, R.; Ulloa, O.; Scanlan, D.J. Global phylogeography of marine Synechococcus and Prochlorococcus reveals a distinct partitioning of lineages among oceanic biomes. Environ. Microbiol. 2008, 10, 147–161. [Google Scholar] [CrossRef] [PubMed]
  53. Huang, S.; Wilhelm, S.; Harvey, H.; Taylor, K.; Jiao, N.; Chen, F. Novel lineages of Prochlorococcus and Synechococcus in the global oceans. ISME J. 2011, 6, 285–297. [Google Scholar] [CrossRef] [PubMed] [Green Version]
  54. Hauri, C.; Gruber, N.; Plattner, G.-K.; Alin, S.; Feely, R.; Hales, B.; Wheeler, P. Ocean Acidification in the California Current System. Oceanography 2009, 22, 60–71. [Google Scholar] [CrossRef] [Green Version]
Figure 1. Schematic of the experimental set-up used in this study.
Sustainability 14 09508 g001
Figure 2. Specific growth rates µ (d−1) of the Synechococcus strains under the different temperature and CO2 treatments. X axes represent the temperature treatments used (22 °C, 24 °C and 26 °C) and Y axes represent the specific growth rates µ (d−1) obtained. The legend (on the top) represents the three CO2 levels (400 ppm, 600 ppm and 800 ppm) used in this study. Error bars denote SE.
Sustainability 14 09508 g002
Figure 3. The dark-adapted photosynthetic efficiency (Fv/Fm) and the functional absorption cross-section of PSII in the dark-adapted state (σPSII) of the Synechococcus strains under the different temperature and CO2 treatments. X axes show the Fv/Fm (-) values and Y axes show the σPSII2). The legend on the right represents the three temperature levels (22 °C, 24 °C and 26 °C) used in this study. Error bars denote SE.
Sustainability 14 09508 g003
Figure 4. The C/N ratios (mol/mol) of the Synechococcus strains under the different temperature and CO2 treatments. X axes represent the temperature treatments used (22 °C, 24 °C and 26 °C) and Y axes represent the C/N ratios (mol/mol) obtained. The legend (on the top) represents the three CO2 levels (400 ppm, 600 ppm and 800 ppm) used in this study. Error bars denote SE. Triplicate measurements of elemental carbon and nitrogen content could not be performed in the strain WH8109 because low biomass concentration was obtained in this strain after the experimental treatments.
Sustainability 14 09508 g004
Figure 5. The nitrogen stable isotopic composition, δ15NAir (‰) of the Synechococcus strains (af) under the different temperature and CO2 treatments. X axes represent the temperature treatments used (22 °C, 24 °C and 26 °C) and Y axes represent the δ15NAir (‰) obtained. The legend (on the top) represents the three CO2 levels (400 ppm, 600 ppm and 800 ppm) used in this study. Error bars denote SE. Triplicate measurements of nitrogen stable isotopic composition could not be performed in the strain WH8109 because low biomass concentration was obtained in this strain after the experimental treatments.
Sustainability 14 09508 g005
Figure 6. The phylogeny of the Synechococcus strains based on the CCM proteins BicA (a) and ChpX (b). The columns on the right show the marine sub-cluster the strains belong to the marine ecosystem they were isolated from. The maximum likelihood method and JTT matrix-based model (Jones et al., 1992 [41]), as implemented in the software MEGA X, were used to construct the phylogenetic trees. The trees are drawn to scale, with branch lengths measured in the number of substitutions per site.
Sustainability 14 09508 g006aSustainability 14 09508 g006b
Table 1. Taxonomy and isolation site for the Synechococcus strains tested in this study [9].
StrainTaxonomyIsolation Details
WH7803Marine sub-cluster
5.1B, clade V
33.7423° N 67.4913° W;
25 m depth; Sargasso
Sea, North Atlantic
Ocean; 1978
WH8020Marine sub-cluster
5.1A, clade Ia
38.68° N, 69.3° W; 50 m
depth; northwestern
Atlantic Ocean slope
water; 26 June 1980
WH8102Marine sub-cluster
5.1A, clade, IIIa
22.495° N, 65.6° W; surface;
Sargasso Sea,
North Atlantic, from
Oceanus cruise 92;
15 March 1981
WH8109Marine sub-cluster
5.1A, clade IIa
39.47° N, 70.45° W; northwestern
Atlantic Ocean
slope water; June 1981
RCC555Marine sub-cluster
5.1B, clade IX
29.47° N 34.92° E;
10 m depth;Gulf of Aqaba; Red Sea; 1999
RCC2673Marine sub-cluster
5.1A, clade IV
32.87° N–117.26° W;
5 m depth; California current;
Pacific Ocean; 1999
Table 2. Pearson’s product-moment correlation between the nitrogen stable isotopic composition δ15NAir (‰) and the specific growth rates µ (d−1) of the Synechococcus strains (* indicates p < 0.05).
StrainPearson’s Product–Moment Correlation between δ15NAir (‰) and µ (d−1)
WH7803−0.75 (p = 0.02) *
WH8020−0.45 (p = 0.23)
WH81020.28 (p = 0.47)
WH81090.68 (p = 0.04) *
RCC555−0.36 (p = 0.34)
RCC26730.21 (p = 0.59)
Publisher’s Note: MDPI stays neutral with regard to jurisdictional claims in published maps and institutional affiliations.

