1. Introduction
Greenhouse gas emissions, represented by carbon dioxide, exceed the ecological loading capacity and are the direct cause of global warming [
1]. To cope with the increasing atmospheric carbon concentration and sound the alarm for environmental protection, in 2018, the IPCC released the Special Report on Global Warming of 1.5 °C, which proposed two targets: temperature rise control target and carbon emission control target. In 2013, China emitted 10 billion tons of carbon dioxide, accounting for 27.8% of global carbon emissions; in 2019, China’s primary-energy-consumption-generated carbon emissions increased by 3.2% from the previous year [
2]. The “Belt and Road” strategy has promoted economic and trade development along its routes, and the logistics industry has played a role in promoting economic and trade development. As a high carbon emission industry, the logistics industry has a negative impact on the ecological environment due to its high energy consumption and emission characteristics. Therefore, reducing energy consumption and carbon emissions in the logistics industry is of great significance for promoting regional sustainable development and low-carbon economy [
3].
From the perspective of low-carbon economy and regional sustainability, this paper responds to the “One Belt and One Road” strategy; selects 17 provinces and cities along the “One Belt and One Road” in China as the research object; divides them into four regions; takes carbon emissions from the logistics industry as nonexpected output; measures the efficiency of the logistics industry; conducts comparative analysis in three dimensions, which are overall, regional, and provincial; and gives suggestions for efficiency improvement, which helps to further clarify the concept of logistics efficiency, enriches the theoretical system of low-carbon logistics efficiency and sustainable development to a certain extent, and improves the research content and method of logistics industry efficiency measurement [
4].
With the rapid development of the “Belt and Road” construction, China’s logistics industry is facing unprecedented favorable conditions, while the large gap in the development of the logistics industry among the provinces and cities along the route has caused a certain impact on the development of cooperation between regions. This paper considers the nonexpected output indexes in the evaluation system, understands the differences of carbon emissions of the logistics industry in each province and city along the route through empirical analysis, and evaluates the low-carbon logistics efficiency in the route from two perspectives, static and dynamic, which provides scientific and effective data support and theoretical basis for the low-carbon development of the logistics industry along the “Belt and Road” route. It also provides a scientific and effective data support and theoretical basis for the low-carbon development of the logistics industry along the “Belt and Road”, and provides a decision basis for the government to formulate regional emission reduction plans and implement the carbon emission assessment system.
The study in this paper is divided into seven parts. The first part is the introduction. It introduces the research background of this paper in detail, proposes the research topic, and explains the significance of this paper. The second part illustrates the problems of regional logistics efficiency along the “Belt and Road” at present, and collates existing references to determine the research object of this paper and explore the suitable research method. The third part presents the research model. The IPCC carbon emission calculation model, the principal component analysis, the SBM model, the Malmquist model, and the Tobit model are introduced to lay the foundation for the subsequent empirical analysis. Part 4 is the measurement and analysis of regional logistics efficiency along the route. This chapter first constructs the index system and conducts data processing, then measures the indicators related to the efficiency of the logistics industry along the route under the SBM model and Malmquist model, and evaluates and analyzes the efficiency of the logistics industry along the route from two directions, which are static and dynamic, and three perspectives, which are overall, regional, and provincial. Part 5 is the study of the factors influencing the efficiency of the logistics industry. This chapter first sorts out the possible influencing factors of low-carbon logistics efficiency, determines the set of influencing factors, constructs a Tobit regression model of low-carbon logistics efficiency based on this, and investigates the mechanism and degree of influence of each factor through empirical analysis. Part 6 presents the practical and theoretical implications and suggestions of this paper. Part 7 presents the conclusions to promote the improvement of low-carbon logistics efficiency in the regions along the Belt and Road.
2. Literature Review
Measuring the efficiency of the logistics industry first requires the selection of logistics efficiency evaluation indicators, and research on logistics efficiency evaluation indicators is relatively mature. Existing studies tend to select investment indicators from three main perspectives, which are human, material, and financial resources [
5], and output indicators from both quantitative and qualitative aspects [
6], and the input and output indicators used in past studies include the number of employees in the logistics industry, road mileage and traffic flow, the stock of fixed assets in the logistics industry [
7], the number of postal outlets, and the added value of the logistics industry [
8]. However, in the past, when conducting logistics efficiency studies, only capital and labor factors were often considered, and environmental indicators were rarely considered [
9]. In the past few years, under pressure to restore green and sustainable development, the logistics industry has been given the requirement to reduce energy consumption and carbon emissions. Therefore, in recent years, carbon emission indicators have become undesired outputs in efficiency evaluation [
10], and performance evaluation indicator systems considering carbon emissions in the logistics industry have started to be established [
11]. To avoid the subjectivity of indicator selection, principal component analysis can be used for dimensionality reduction to obtain comprehensive and objective indicators, and then efficiency evaluation and analysis can be performed [
12]. Shuai Bin and Du Wen first proposed to combine DEA and PCA for comprehensive analysis and quantitative assessment of the logistics industry [
13]. This combined approach was widely used to measure logistics efficiency [
14], and several studies obtained objective evaluation results from it, thus proving the scientificity and feasibility of this combined approach [
15].
DEA has the advantages of being able to calculate data directly without pre-estimating parameters, unifying indicator units, or determining indicator weights compared with other efficiency evaluation methods. Therefore, it is more suitable for solving complex multiple-input and multiple-output efficiency assessment problems [
16], and it has been widely used in logistics efficiency assessment at present. Many scholars have assessed logistics efficiency from different perspectives, such as the assessment of national logistics efficiency based on global perspective [
17], the assessment of port logistics efficiency [
18], the study of sustainability of national logistics efficiency [
19], and the study of logistics performance evaluation [
20].
However, with the in-depth study of DEA models, the traditional radial DEA models, represented by the BCC and CCR models, suffer from the problem of neglecting efficiency improvement, which may lead to inaccurate calculation results. Therefore, in 2001, Tone made some modifications to the DEA model and proposed a nonradial SBM model with the addition of slack variables. The SBM-DEA model considering undesired output can clarify the significance of slack in both undesired and desired output and define the optimal efficiency as maximizing desired output and minimizing undesired output for a fixed input level [
21].
There are several current examples of SBM-DEA models applied in port logistics efficiency studies as well as in other areas. Tan et al. used the Super-SBM model to assess sustainable logistics efficiency in China considering inputs and desired and undesired outputs [
22]; Qian Qiming et al. assessed regional differences in green economy efficiency in China and compared the CCR and SBM models under DEA [
23]. It was found that the SBM-DEA model was more applicable and distinguishable in the evaluation; Wang Zhaofeng et al. used the SBM-DEA model to study the spatial and temporal differences of carbon emission efficiency and its influencing factors in Hunan [
24].
In addition, a two-stage DEA model combining the SBM model and Tobit regression is proposed to further analyze the macro drivers of low-carbon logistics efficiency and provide scientific references for the formulation of relevant policies, the improvement of logistics industry quality, and the application of green development and sustainable development concepts. For example, Liu et al. used the SBM-DEA model and Tobit model to study the logistics efficiency and its influencing factors in the middle reaches of the Yangtze River economic zone, indicating that the combination of the SBM-DEA and Tobit models is a reliable method to reflect the efficiency of the logistics industry [
25].
The “One Belt and One Road” initiative has been attracting much attention since its introduction. Many scholars have used the DEA method to measure and analyze the efficiency of the logistics industry in countries and regions along the “Belt and Road”. Wang Qinmei et al. used the DEA model to obtain the comprehensive technical efficiency of different countries and provinces, and decomposed it into pure technical efficiency and scale efficiency to evaluate the efficiency of the logistics industry in the core region of “One Belt and One Road” [
26]. Zheng Xiujuan used DEA to evaluate the efficiency of the logistics industry in the national, eastern, central, and western regions [
27]. Meng Kui used a three-stage DEA to investigate the logistics efficiency in the central region of China under the dual constraints of energy consumption and carbon emissions [
28]. Xueqing Zhang used the DEA model to analyze the changes of regional logistics efficiency along the “Belt and Road”, regional differences, and their main causes [
29].
With the vision of sustainable development in the “Belt and Road” strategy, some scholars have started to consider the impact of carbon emissions when measuring the efficiency of the logistics industry. Among them, Yao Shanji et al. used the DEA model and Malmquist index model to measure and analyze the efficiency of the logistics industry in each province along the “Belt and Road” region in both static and dynamic aspects [
30]. Zhang Yunning et al. used a three-stage DEA model to measure the logistics efficiency in the Yangtze River protection area, and used the Tobit model to investigate the degree of influence of environmental factors on the efficiency of the logistics industry, taking carbon emissions into account [
31]. Carbon logistics efficiency was measured and dynamically analyzed using the Malmquist index model [
32].
3. Methodology and Models
In our study, based on the priors, first, the nondesired output (i.e., carbon emission) in the index system is calculated by using the IPCC coefficient –method [
33,
34,
35]. Second, principal component analysis is used to extract the principal components and use them as input indicators, and after the two input indicators and two output indicators are obtained, the static and dynamic analyses of the low-carbon logistics efficiency along the regional route are substituted into the SBM-DEA model and Malmquist model, respectively. Finally, the Tobit model is used to conduct regression analysis on four influencing factors: level of economic development, energy consumption, industrial structure, and government expenditures. The main research models and their applications are shown in
Figure 1.
3.1. IPCC Factor Method
Since there is no specific statistical measure of CO
2 emissions, estimates are usually based on energy consumption. The IPCC (2006) reports that 95% of carbon emissions come from the combustion of traditional fossil fuels, so carbon emissions can be measured by converting energy consumption into standard calories [
36]. In our study, eight types of logistics energy are used to estimate the carbon emissions of the logistics industry in China along the “Belt and Road” to contribute to the sustainable development of the regions along the route. According to the IPCC (2006), the calculation model of carbon emissions from each energy source is as follows:
where
denotes total carbon emissions,
denotes energy consumption,
denotes the carbon emission factor,
denotes the average low-level calorific value,
denotes the carbon content per unit calorific value, and
denotes the carbon oxidation rate.
3.2. Principal Component Analysis Method
Principal component analysis is a statistical process that enables the interpretation of the covariance structure of a set of variables through orthogonal transformations, followed by the selection of the best subset of variables and simplified data as a way to explain the relationship between variables [
37]. Therefore, the final principal component is superior to the original data and its ability to reduce the complexity of multidimensional problems and improve the efficiency of the analysis. The main algorithmic steps of PCA are as follows.
- (1)
Use
denoting the observed value of the jth indicator for the ith province/municipality, denoting the standardized index value, and and denoting the sample mean and standard variance of the jth indicator, respectively.
- (2)
Construct the covariance matrix of the target data , and ensure that the computed eigenvalues , and calculate the corresponding orthogonalized unit eigenvectors u1, u2, u3u6.
- (3)
Calculate the cumulative variance contribution. , when , the smallest integer value of m is the number of principal components.
- (4)
The first m principal components are next extracted .
- (5)
Finally, the composite evaluation value of each indicator is calculated based on the sum of the variance contribution rate and the weighting coefficient , where denotes the kth principal component, and denotes the variance contribution rate of the kth principal component.
3.3. SBM-DEA Model
Depending on whether returns to scale are variable, DEA can be classified as CCR or BCC, both of which are radial models. However, both models have been found to overestimate the efficiency of the assessment unit when there are redundant inputs and insufficient outputs, and because they are angle-based DEA methods, they cannot consider both inputs and outputs when measuring efficiency, which can lead to inaccurate efficiency results. To address these issues, the SBM model was proposed, which avoids the problem of scaling down the input factors by adding slack variables and addresses the shortcomings of biased measurements in traditional DEA models [
38]. The model is widely used in efficiency assessment.
When the logistics industry is considered as a whole, as a nonradial DEA model, the slack variable-based measurement (SBM) model can effectively identify inefficient resources in DMUs by identifying excess inputs and insufficient outputs in logistics efficiency to obtain the maximum slack variables. Therefore, the SBM-DEA model is selected for measurement in this paper. The expression of the SBM-DEA model in this paper is as follows:
where
n denotes the number of independent DMUs;
and
correspond to the residual and slack variables, respectively;
m and
q correspond to the number of inputs and outputs, respectively;
denotes the vector of optimal weights; and
denotes the efficiency value of the
jth evaluated DMU.
3.4. Malmquist Index Model
Sten Malmquist first proposed the Malmquist index in 1953, after which Fare R et al. first proposed a method for calculating the Malmquist index using DEA in 1992, that is, decomposing the Malmquist index into the index of change in the technical efficiency of the evaluated unit in adjacent periods and the index of change in technical progress, provided that the payoff of scale is a constant index of change, the formula expressed as:
Fare R et al. [
39] improved on the earlier one by decomposing the technical efficiency change (EC) into a scale efficiency change (SEC) subject to variable scale efficiency (VRS) and a pure technical efficiency change (PEC); the method is called FGNZ decomposition, and the formula is expressed as:
where PEC and SEC denote the indices of change in the pure technical efficiency and scale efficiency of the decision unit from t to t + 1, respectively. When MI > 1, it indicates that the comprehensive production efficiency has improved; when EC > 1, it indicates that the technical efficiency has improved; when TC > 1, it indicates that the production technology has improved; when PEC > 1, it indicates that the pure technical efficiency change shows an upward trend; when SEC > 1, it indicates that the scale efficiency change has increased. Conversely, when each of these indices is less than 1, it indicates a downward trend in the corresponding efficiency.
The FGNZ decomposition is shown schematically in
Figure 2.
3.5. Tobit Model
As research on the efficiency of the logistics industry continues to deepen, the empirical analysis adopted in previous studies gradually changes from a single to a comprehensive approach. The combination of the DEA and Tobit models can not only measure the efficiency of the logistics industry more comprehensively, but also study the specific factors influencing logistics efficiency. Based on this, this paper uses the Tobit regression model to empirically analyze the correlation between logistics efficiency and the influencing factors. Since the upper and lower bounds of the relative efficiency scores obtained from DEA analysis were reviewed and ranged from 0.0 to 1.0, the Tobit model is a valid tool for the second stage of DEA analysis with the following latent linear model:
where
denotes the truncated logistics efficiency dependent variables for data envelopment analysis;
denotes the explanatory variables for the efficiency impact factors;
is a constant;
is a variable reflecting the explanatory variables
and the underlying variable
, a random variable that reflects the relationship between the explanatory variables and the underlying variables; and
denotes a disturbance term that obeys a normal distribution.
4. Analysis of Regional Logistics Efficiency along the Route
4.1. Selection of Indicators and Data Sources
4.1.1. Construction of the Indicator System
The construction of a scientific index system is the basis for scientific and efficient efficiency measurement. Therefore, based on prior research, this paper establishes a systematic and quantifiable index system around human, capital, and infrastructure investment, with the goal of obtaining higher logistics output and as little carbon emission as possible with less human, capital, and infrastructure investment. The logistics evaluation index system is shown in
Table 1.
- (1)
Mileage transported in logistics (X1): the transportation methods used in the logistics industry are mainly roads and railroads, so the sum of the construction mileage of roads and railroads is used to express this indicator to reflect the investment in infrastructure construction in the logistics industry.
- (2)
The number of road freight vehicles (X2): road transport as the main mode of transport, this indicator can better reflect the logistics industry in the infrastructure construction of investment.
- (3)
The number of postal outlets (X3): the postal industry is an important component of the logistics industry as defined in this paper, so this indicator is a better one to reflect the investment in infrastructure construction in the logistics industry.
- (4)
Fixed asset investment in logistics (X4): this indicator can well reflect the investment in capital factors in the logistics industry.
- (5)
Employment in the logistics industry (X5): the employment in this industry mainly includes employees in the railroad, road, water, aviation, pipeline, loading and unloading, transport agency, warehousing, and postal industry, which can better reflect the input of the logistics industry to labor factors.
The output of the logistics industry is the final output generated by the consumption of labor, assets, and infrastructure; therefore, the construction of the output indicator system should consider not only the expected output reflecting the logistics performance and development, but also the unintended output generated due to the impact of logistics activities on the environment.
- (1)
Gross value of the logistics industry (Y1): the gross value of the logistics industry in each province along the region can well measure the economic output of the logistics industry.
- (2)
Carbon emissions from logistics (Y2): Under the low-carbon constraint, this paper considers the eight main energy sources used in the logistics industry and follows the guidance of the Guidelines for National Greenhouse Gas Emissions Inventories issued by the IPCC to calculate the carbon emissions of each province and city along the route region, which is used to measure the environmental output of the route region.
4.1.2. Data Sources
According to the principle of data availability, our study selects the remaining 17 provinces and cities along the route except Tibet as the research object. At the same time, the data related to the logistics industry involved in our study are adopted by default as a substitute for the data of the transportation, storage, and postal industry. Among them, the initial input–output index data of the 17 provinces and cities are obtained from the China Statistical Yearbook (2007–2020).
Since there are no direct statistics on carbon emissions from the logistics industry, carbon emissions need to be valued based on the consumption of each energy source. In our study, eight energy sources, namely, raw coal, coke, gasoline, crude oil, diesel, kerosene, fuel oil, and natural gas, are selected to participate in the calculation of carbon emissions from the logistics industry, and the data required in the calculation process are obtained from the China Energy Statistical Yearbook for 2006–2021.
Our study takes 2006 as the base period and treats the gross value of the logistics industry involved, in accordance with the GDP deflator, and the fixed asset investment in the logistics industry involved, in accordance with the perpetual inventory system. Since the process of carbon emission measurement involves the transformation of energy data dimensions, the data related to the average low calorific value, unit calorific value emissions, carbon oxidation rate, and carbon emission coefficient involved in the process are obtained from IPCC statistics, the Guidelines for the Preparation of Provincial Greenhouse Gas Inventories (NDRC Climate (2011) No. 1041), and the General Rules for Calculating Comprehensive Energy Consumption (GB/T 2589-2020).
4.1.3. Regional Division along China’s “Belt and Road” Route
The “Belt and Road” Initiative released in March 2015 to promote the development of the “Belt and Road” divides the regions into five in China. According to the principle of data availability, our study studies the remaining 17 provinces along the “Belt and Road” except for the Tibet Autonomous Region. As there is only one decision-making unit in the inland region, Chongqing is included in the southwest region for the convenience of overall analysis, and the regional division is shown in
Table 2.
4.2. Data Processing
4.2.1. Accounting for Capital Stock
In the study of fixed asset inputs in the logistics industry, in order to eliminate the interference of price factors, our study uses the perpetual inventory system for the estimation of capital stock and treats it as a capital input. The calculation formula is as follows:
where
denotes the capital stock of province
i in year
t,
denotes the capital stock of province
i in year
t − 1,
denotes the investment flow, and
denotes the capital depreciation rate. Integrating the study of Zhang et al., our study takes the depreciation rate
= 9.6% [
40]. For the investment flow
, since the time range of our study’s research is from 2006 to 2020, our study takes 2006 as the base period for the fixed asset investment in the logistics industry involved in our study, and price deflating treatment is performed as the investment flow. The capital stock of the base period
calculation, after a comprehensive comparison of existing studies, chooses to draw on WU’s estimation method [
41]. The amount of investment in period
t can be expressed as:
Taking logarithms on both sides of the equation simultaneously yields:
The regression analysis of the above equation yields
and
, from which the base period capital stock can be calculated as:
4.2.2. Carbon Emission Measurement Results and Analysis of the Logistics Industry in the Coastal Region
The carbon emission factors of the eight energy sources studied in our study can be found through information search and calculation, as shown in
Table 3.
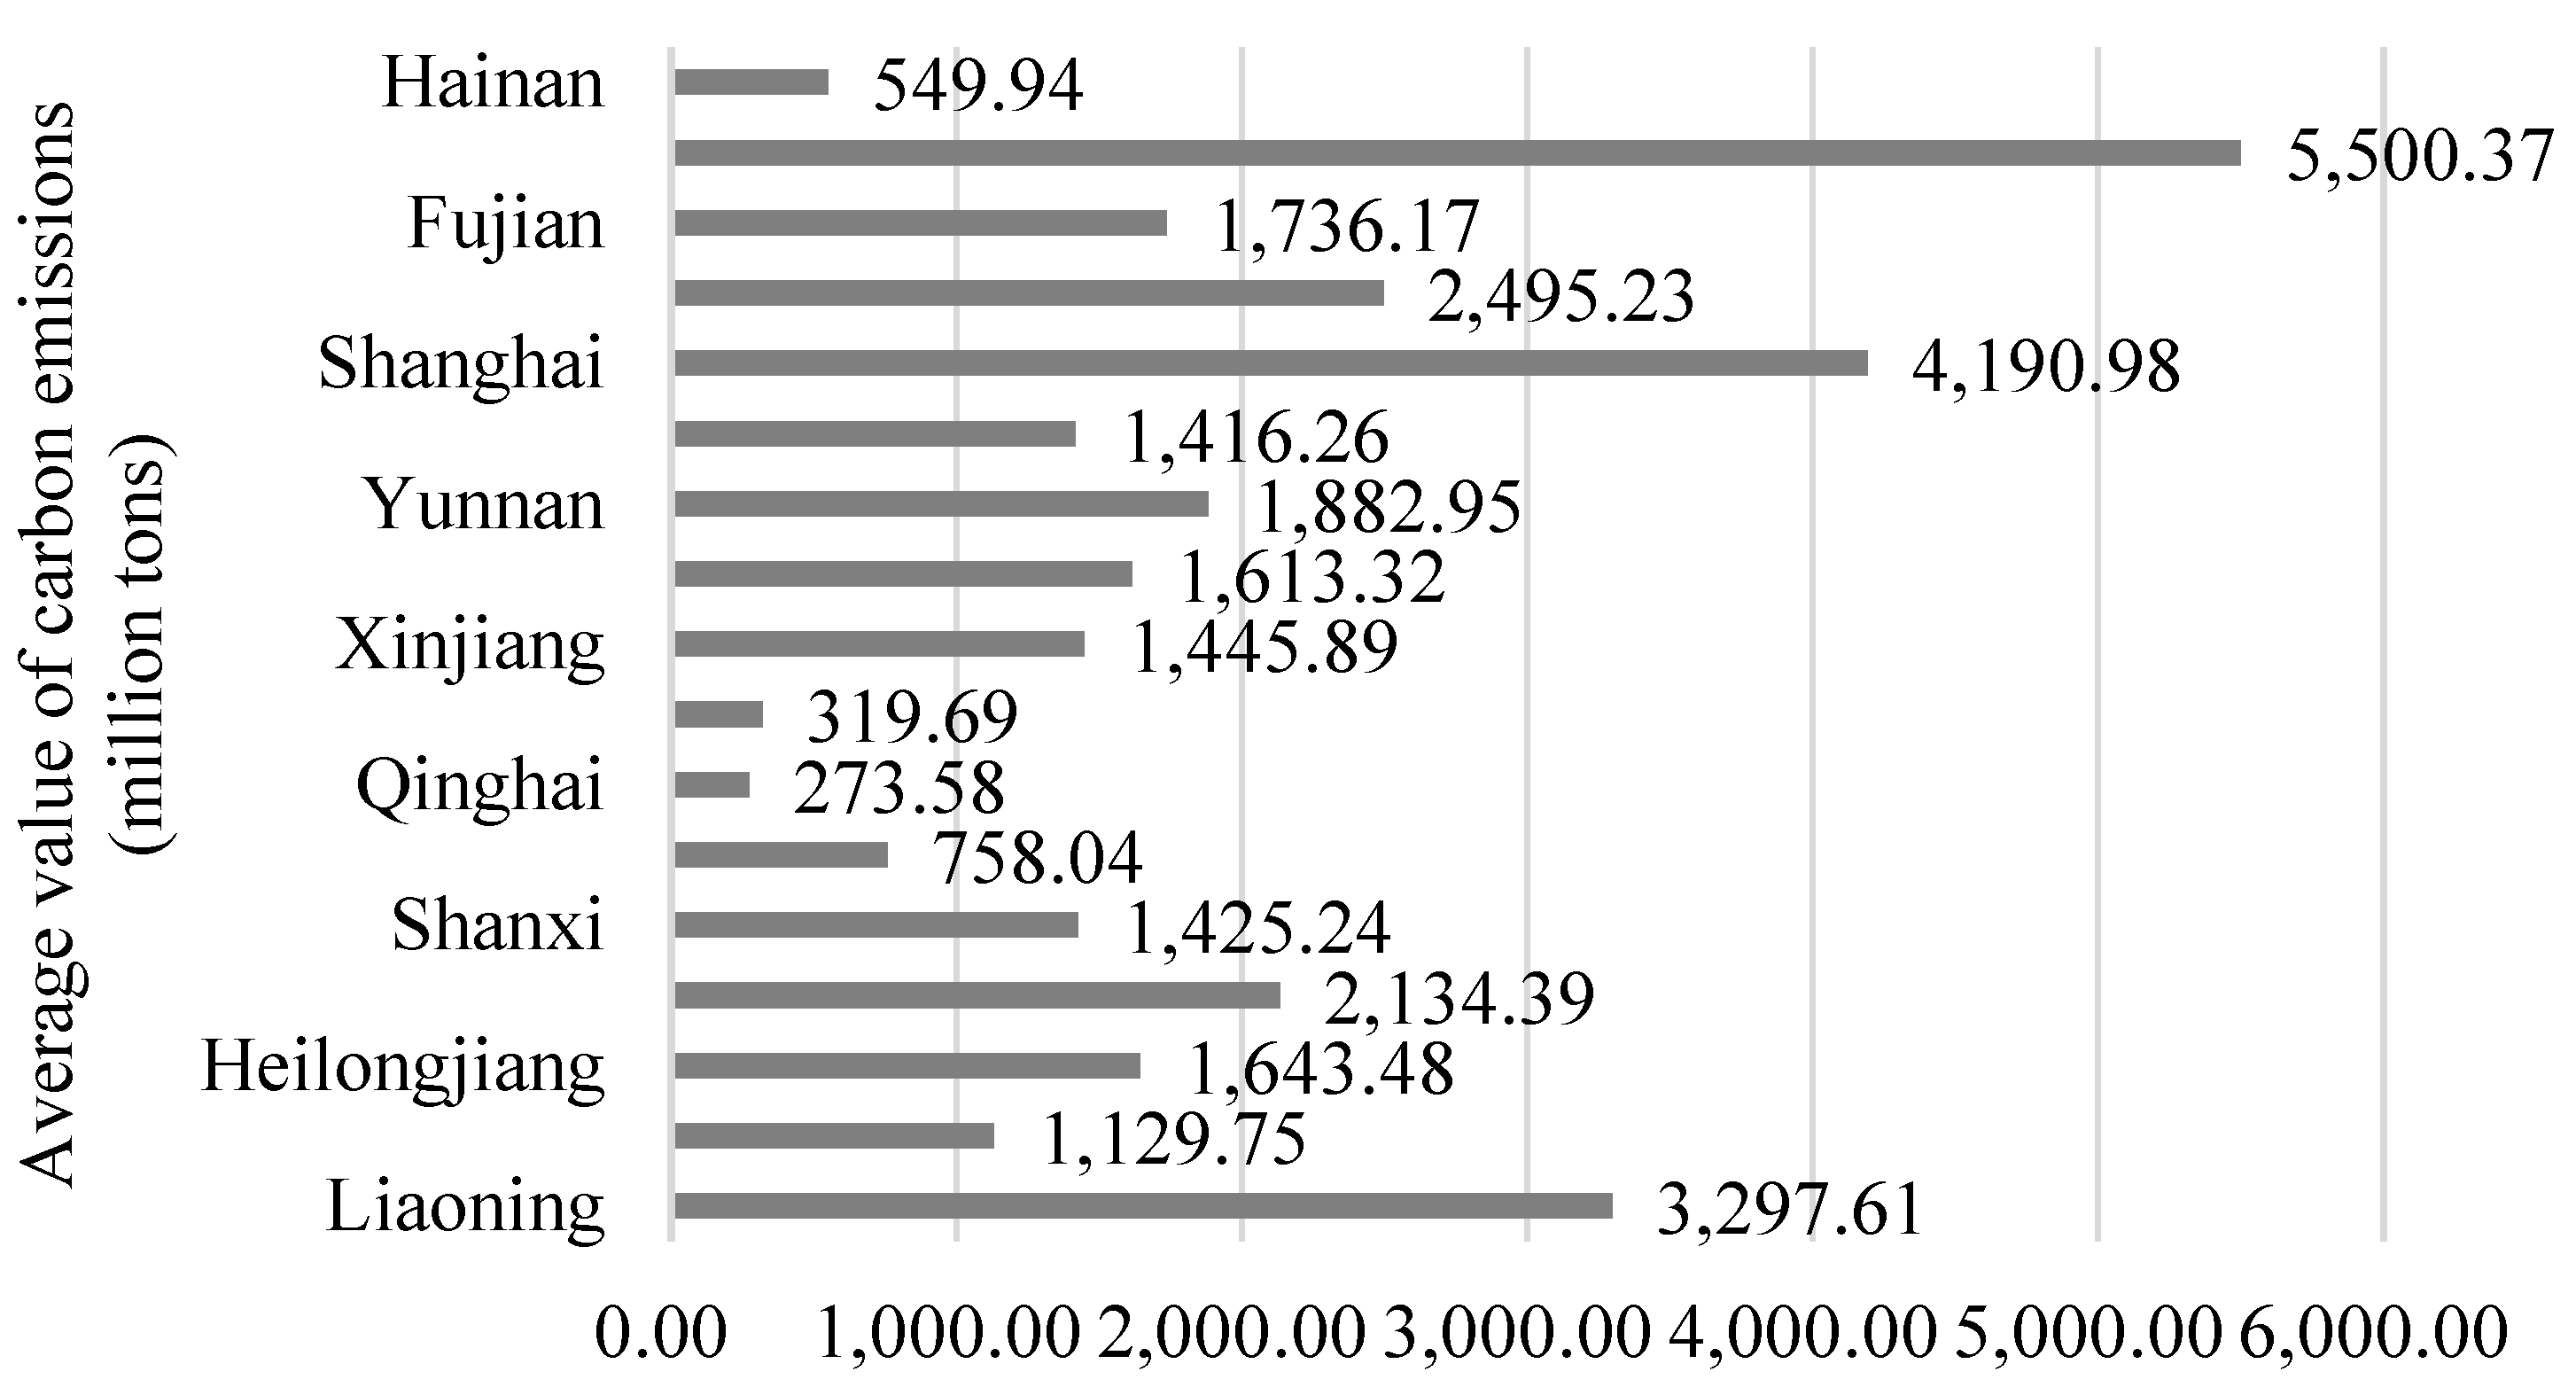
Then, according to the calculation method of carbon emissions generated by each energy source in the IPCC (2006) for the 17 provinces and cities along the region from 2006 to 2020, the results of measuring carbon emissions from the logistics industry are shown in
Table 4, and the average value of carbon emissions in each province is shown in
Figure 3.
From the table of measurement results and the graph of average values, it can be seen that Guangdong Province has the highest average value of carbon emissions among the 17 provinces and cities, probably because Guangdong, as a major manufacturing province, has a more developed economy and a strong demand for logistics, with the matching energy consumption generating more carbon emissions. Qinghai is the province with the lowest average value of carbon emissions, which may be related to its relatively weak infrastructure development and late start in the logistics industry.
Table 5 shows the carbon emissions of the logistics industry in each region from 2006 to 2020 after classification by the four major regions, and
Figure 4 shows the average value of carbon emissions of the logistics industry in the four major regions from 2006 to 2020. Among the average value of carbon emissions from the logistics industry in the four major regions, the southeast region is the highest, which is closely related to the good economic foundation and the higher level of development of the logistics industry in the southeast region. The results of ranking the four regions from largest to smallest according to the average value of carbon emissions are the southeast, northwest, northeast, and southwest regions.
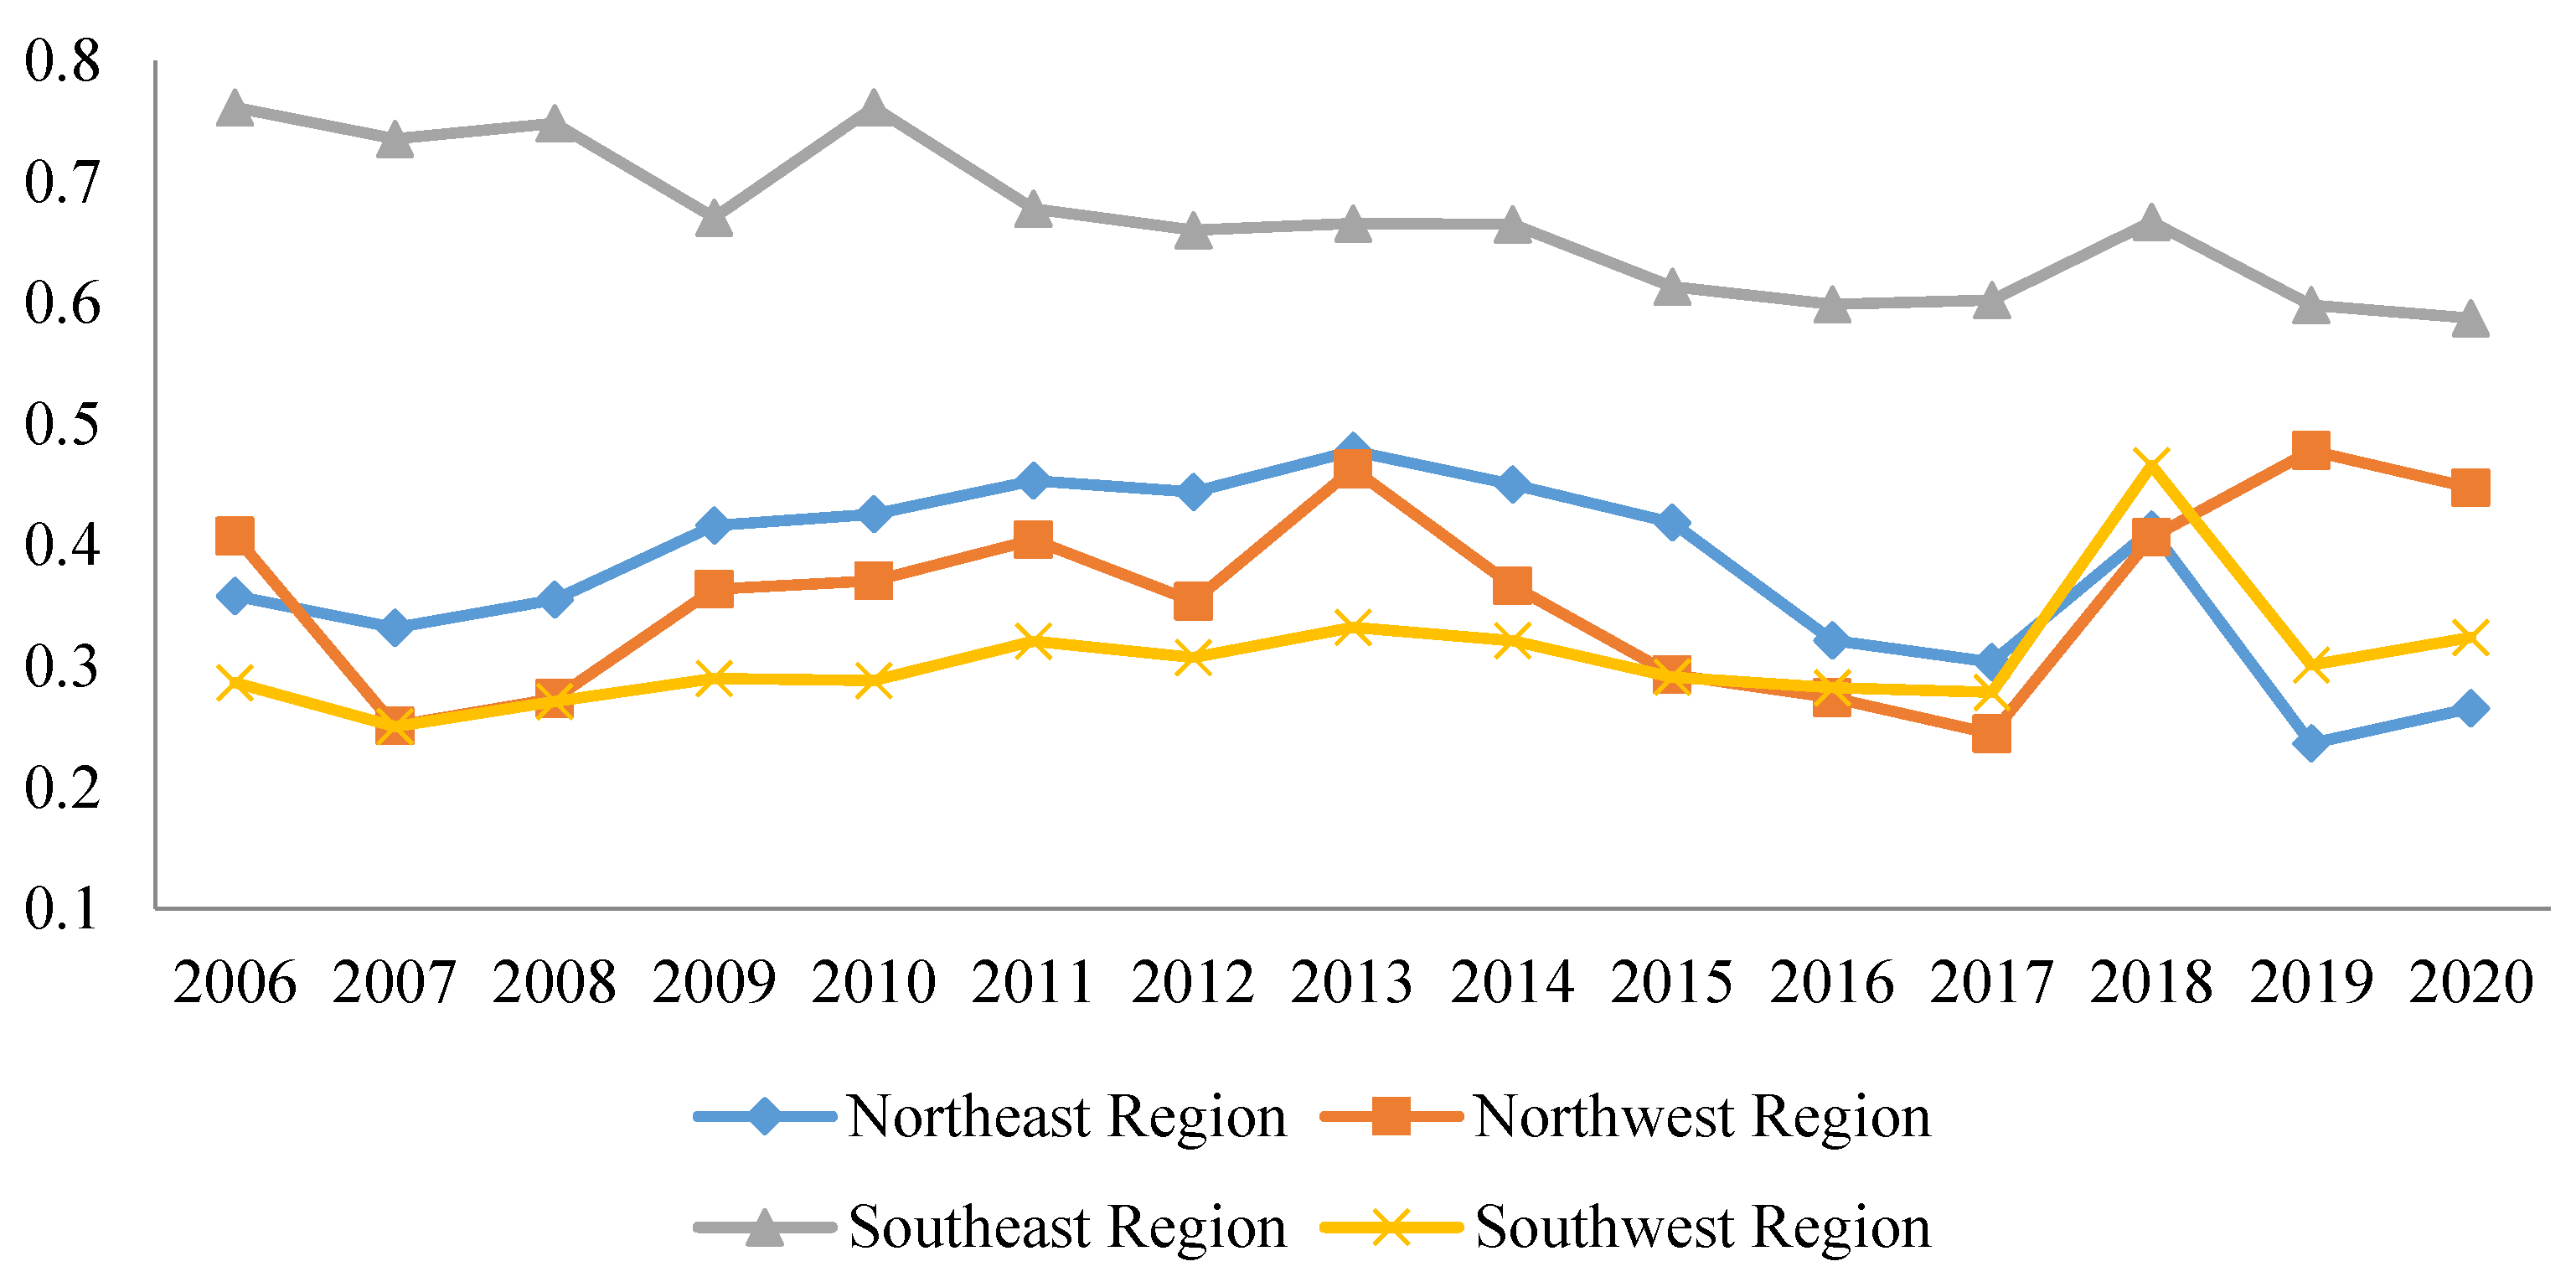
Figure 5 shows a line graph of carbon emissions from the logistics industry in the four regions along the route from 2006 to 2020. From the graph, it can be seen that the carbon emissions in the southeast region are significantly higher and growing at the fastest rate. The change lines of carbon emissions in the northeast and northwest tend to overlap, with carbon emissions in the northeast showing a slow growth trend and a slow decline after peaking in 2017. From 2006 to 2012, carbon emissions in the northwest show an upward trend and a fluctuating downward trend after peaking in 2012. From 2006 to 2020, carbon emissions in the southwest are the least, with a slow upward trend overall. There is a small decline in 2012–2013.
4.2.3. Results of the Principal Component Analysis Method
Before proceeding with the calculation of low-carbon logistics efficiency, as the selection of input indicators is subjective and may have an impact on the results of the subsequent efficiency measures, our study draws on the method of Põldaru R et al. [
42], conducting principal component analysis on the panel data of five input indicators from 2006–2020, so as to obtain more objective input indicators.
(1) Standardization of raw data
The initial input indicator data are standardized, some of which are shown in
Table 6.
(2) Adaptability tests
The correlation between the data of each indicator and the results are shown in
Table 7. The results analysis shows that the KMO value is 0.625, which is greater than the critical value of 0.6; Bartlett’s test of sphericity shows that the significance is 0.000, which is less than 0.05, indicating that the data are suitable to be used for principal component analysis.
(3) Solving for the principal components
As shown in
Table 8, the results by default take variance greater than 1 as the principle of selecting principal components, and the first two principal components explain 74.716% of the total variance, so it is considered that the first two principal component factors can basically reflect the input situation of the logistics industry in each region. Therefore, the first two principal component factors are selected to enter the next step of calculation. Based on the coefficients of each indicator, the following linear combination is obtained:
4.2.4. Standardization of Input and Output Variables
The newly generated logistics industry efficiency evaluation system contains a total of four comprehensive indicators, namely, the input new variables I1, I2, the gross value of the logistics industry Y1, and the carbon emissions of the logistics industry Y2. Due to the quantitative differences among the variables, the data need to be standardized in order to eliminate the influence of the quantitative scale. Comparing several calculation methods in the current study and combining the most common methods in existing studies, the following formula is adopted in our study:
where
and
denote the input and output variables after standardization, respectively;
denotes the new input variables obtained after principal component analysis, and
denotes the output variables. After normalization, both input and output variables take values in the range of (0.1, 1), which will be used as the final input and output variables.
4.3. Measurement Results
4.3.1. Static Analysis of Regional Logistics Efficiency along the Route Based on the SBM Model
The values of I1 and I2 obtained after standardization are used as input variables of the SBM-DEA model, and the expected value of the output of the logistics industry and the nonexpected value of the amount of carbon dioxide output of the logistics industry are used as output variables and imported into the DEA calculation, and the results of measuring the efficiency of the logistics industry in the 17 provinces and cities along the route are shown in
Table 9.
In order to compare the difference of efficiency values of the logistics industry along the route before and after considering carbon emissions, our study uses the CCR model to measure the efficiency of logistics without nonexpected output, and it is known that the decision-unit-strong DEA is effective when the efficiency value is equal to 1 [
43]. A comparison of the efficiency effective regions of the two is shown in
Table 10. From the table, it can be seen that during the 15 years studied in our study, the number of provinces and cities that reach the efficient effective state after considering carbon emissions is less than or equal to the effective number when carbon emissions are not considered, indicating that the size of logistics efficiency values in each province and city is affected to some extent after considering carbon emissions.
From an overall perspective, the efficiency values of the logistics industry in the vast majority of provinces and cities along China’s “Belt and Road” from 2006 to 2020 are between 0 and 1, indicating that after considering carbon emissions, the efficiency of the logistics industry in most regions has declined to some extent. On the one hand, this is due to the fact that the logistics industry is a high-carbon energy-dependent industry with high carbon emissions; on the other hand, the long-standing crude development of the logistics industry has led to waste of energy, which has unnecessarily increased the carbon emissions of the logistics industry, thus leading to the reduction of the efficiency of the logistics industry.
Figure 6 shows the changes in the mean value of low-carbon logistics efficiency in provinces and cities along the region from 2006 to 2020. From the results, it can be seen that, overall, the efficiency level of the logistics industry in China’s Belt and Road regions is not high, the overall efficiency value is below 0.6 in 15 years, the fluctuation trend tends to be stable in most years, and there is still much room for development. Except for 2016–2017, when the average pure technical efficiency was lower, the rest of the years basically remained stable. The change in average scale efficiency shows a strong fluctuating trend, which shows that the main factor affecting the high efficiency of low-carbon logistics is scale efficiency. Throughout the graph, the average value of scale efficiency is 0.77, and the average value of pure technical efficiency is 0.60 during 15 years, indicating that the future development of the logistics industry not only should focus on the size of scale, but also needs to continue to pay attention to the training of talents and innovation of technology, with a view to improving the pure technical efficiency, thus improving the overall level of comprehensive efficiency of the logistics industry [
44]. Each province has a high pure technical efficiency, but significant regional differences in comprehensive technical efficiency and scale efficiency are apparent [
45,
46].
By region, the efficiency of the logistics industry varies significantly from region to region over the same period due to large differences in various aspects, such as infrastructure, economy, and labor force, and
Figure 7 reflects the efficiency of the logistics industry in the four regions along the route. From high to low, they are southeast > northeast > northwest > southwest. The reason for this may be that the southeast and northeast regions are located in the eastern economic belt of China’s three major economic belts; are leading in terms of external economy, human resources, and logistics industry infrastructure; and have formed a certain degree of scale effect. The northwest and southwest regions, on the other hand, have a late start in the logistics industry due to geographical influences and a relative lack of logistics infrastructure and logistics talents, so the efficiency of the logistics industry is still at a low level [
47].
In terms of specific provinces and cities, a total of 24 times from 2006–2020 along the regional provinces effective logistics industry efficiency has been reached. As can be seen from the distribution of the number of effective logistics efficiency times in
Table 10, only six provinces and cities, namely, Fujian, Shanghai, Zhejiang, Shaanxi, Inner Mongolia, and Gansu, have reached the effective logistics efficiency value DEA, among which Shanghai, Zhejiang, and Fujian, as developed coastal economic provinces and cities, have been leading the development of the logistics industry for a long time, which is an important reason why these provinces can reach the effective logistics efficiency value DEA. Additionally, Inner Mongolia, Shanxi, and Gansu can reach the valid logistics efficiency value DEA, which shows that the less developed inland economy can also achieve high efficiency of low-carbon logistics if the input is reasonable and the scale is appropriate. From the efficiency value of each province, the maximum value is 1 and the minimum value is 0.0944, which indicates that there is a big gap between the logistics efficiencies of each province and city along the route region.
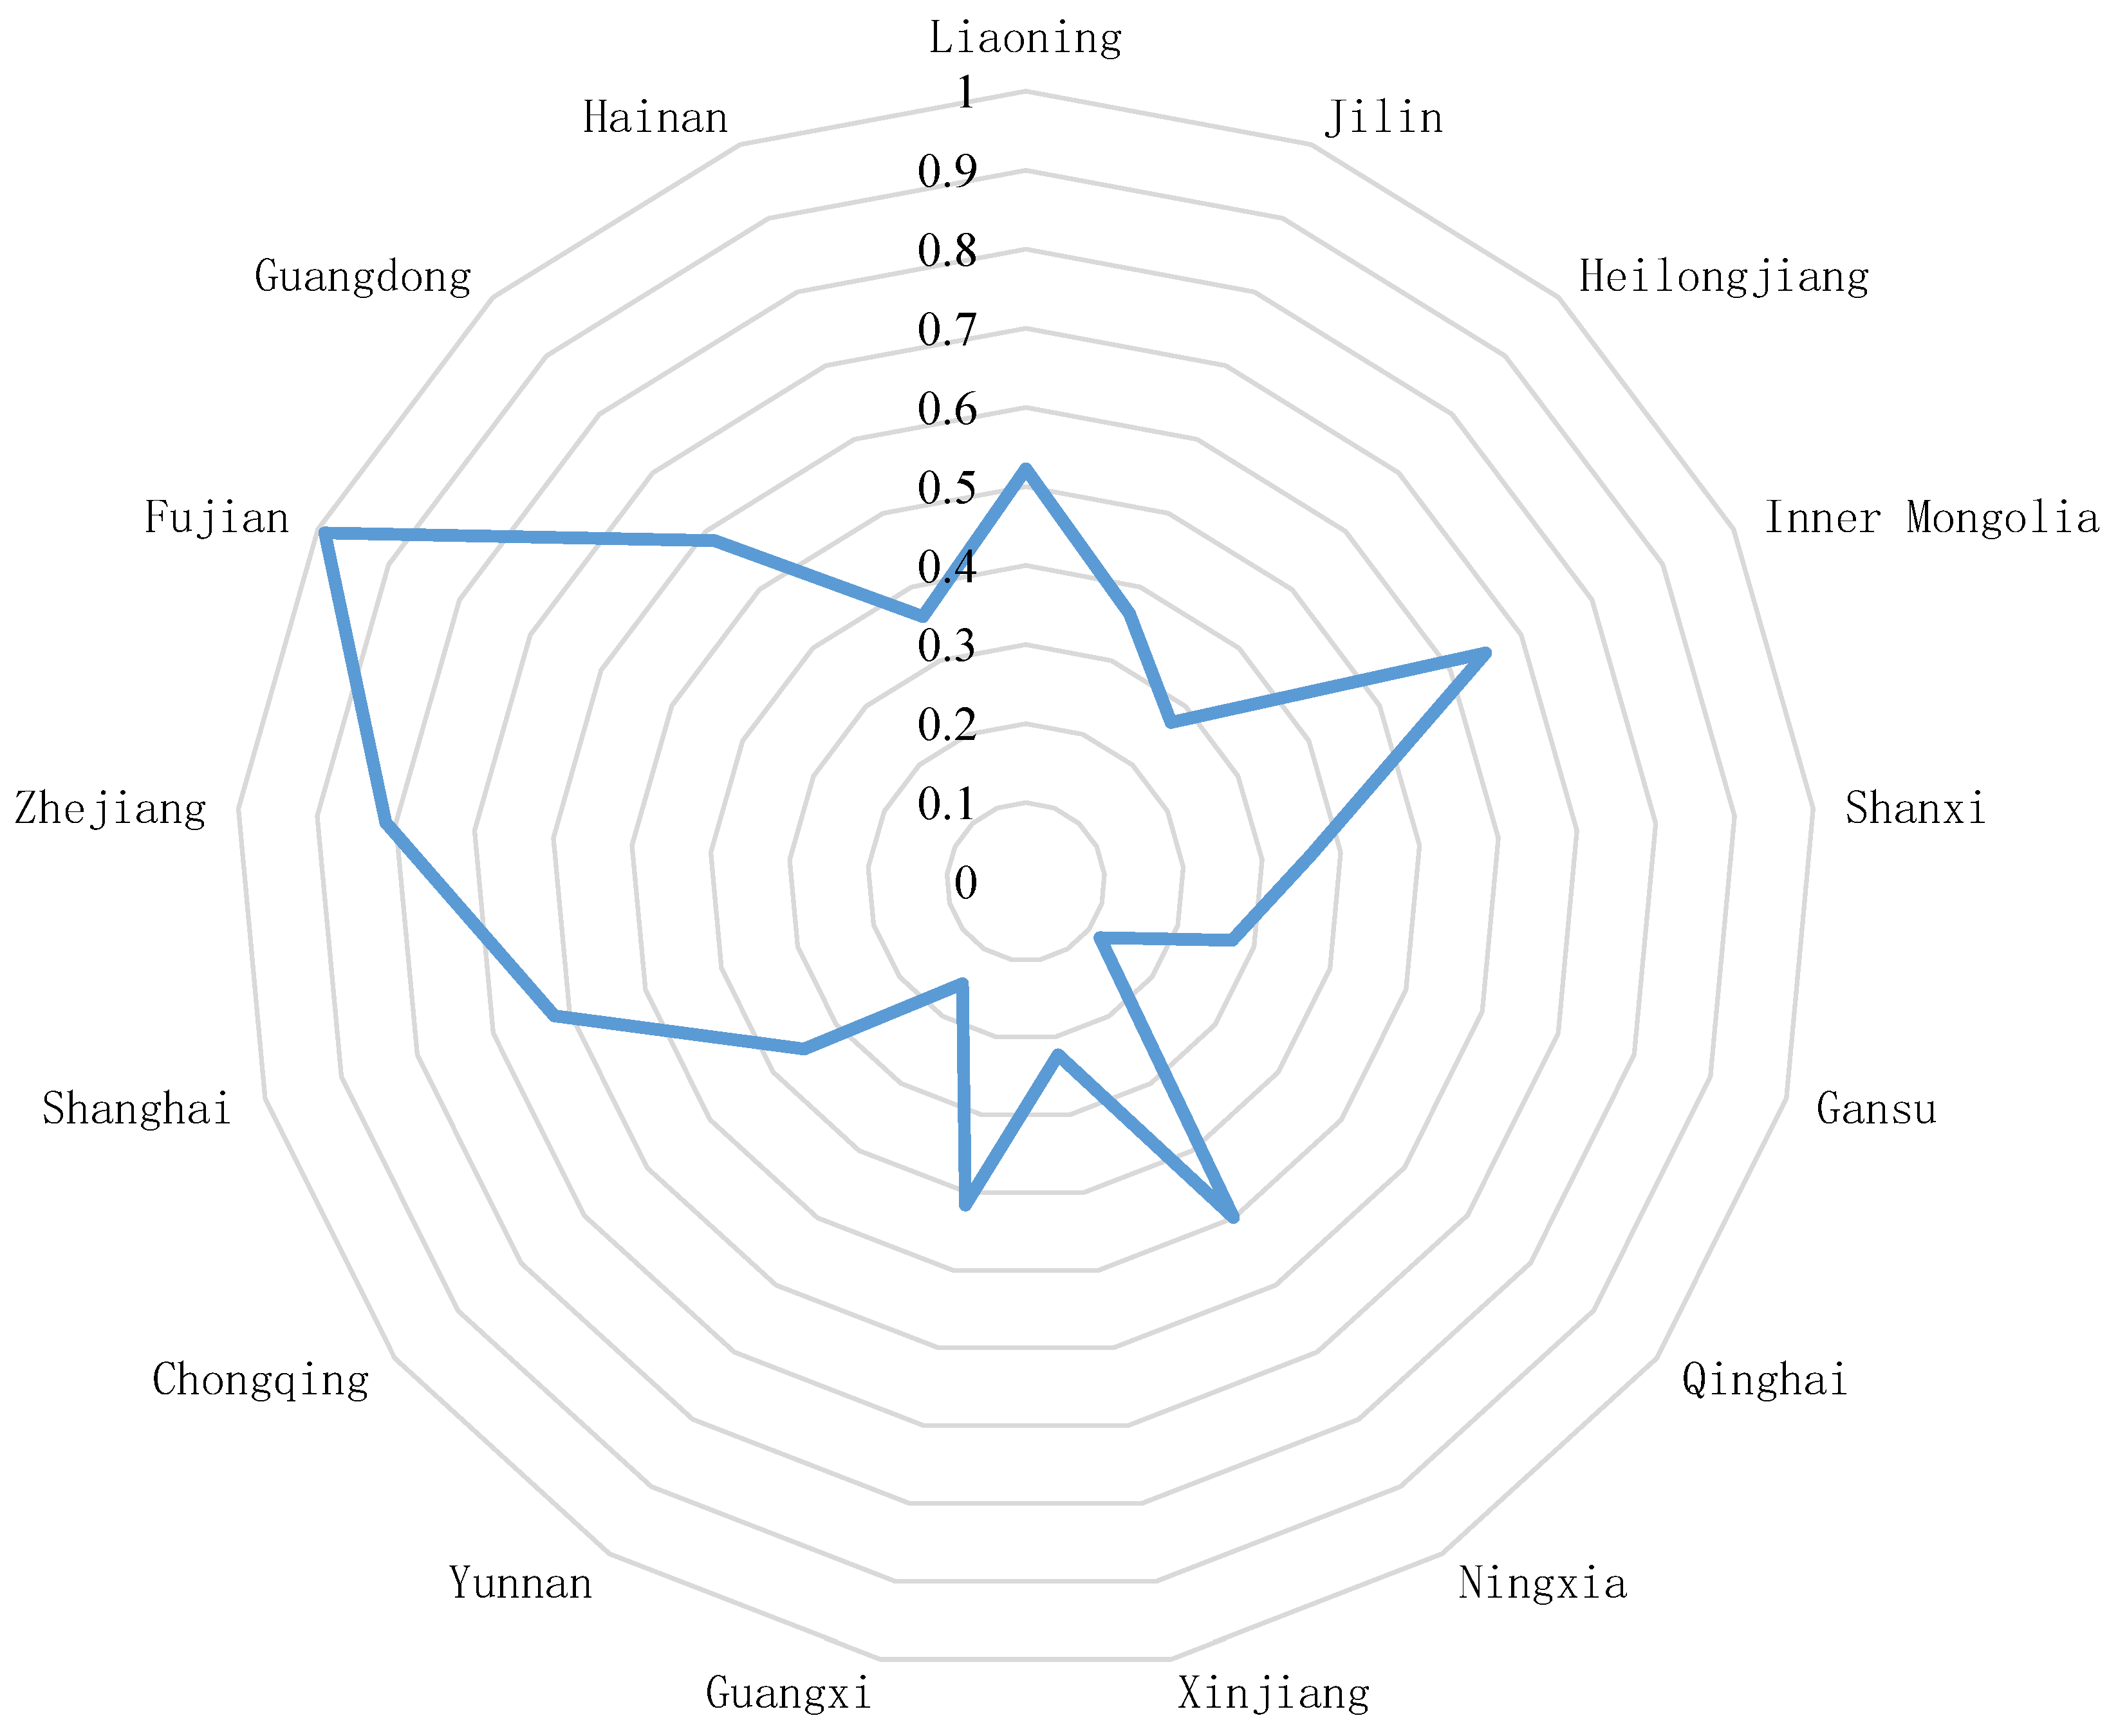
Table 11 and
Figure 8 can visually reflect the uneven development of the logistics industry in the provinces and cities along the route region from 2006–2020. Only two provinces, Fujian and Zhejiang, have an average value of logistics industry efficiency above 0.8, which belongs to the high comprehensive efficiency region. Five provinces and cities, namely, Liaoning, Inner Mongolia, Ningxia, Shanghai, and Guangdong, have an average value of logistics efficiency above 0.45, which belongs to the general comprehensive efficiency region. The remaining provinces and cities have an average value of logistics efficiency below an average value of 0.445 for the whole region along the route, which belongs to the low comprehensive efficiency region. In particular, the average value of logistics efficiency in Qinghai and Yunnan is below 0.2, indicating that the development of the logistics industry in these two provinces is relatively backward.
4.3.2. Dynamic Analysis of the Efficiency of the Logistics Industry in the Region along the Route Based on the Malmquist Model
The previous paper applies the SBM model under the DEA method to measure the low-carbon logistics efficiency values of each decision unit in the years under study and analyzes the results, which are static analysis. In order to analyze the changes of low-carbon logistics efficiency in provinces and cities along the region from 2006 to 2020, our study adopts the Malmquist index model for the dynamic evaluation of low-carbon logistics efficiency in the region along the route.
(1) Dynamic analysis of overall logistics efficiency in the region along the route
Table 12 shows the average value of total factor productivity and its decomposition in the regions along the route from 2006–2020, and the results show that the average value of the MI index and its component indices of logistics efficiency in the regions along the route from 2006 to 2020 are greater than 1, which indicates that, in general, the logistics industry in the regions along the route continues to develop in a positive way. First, it can be seen from the MI index that only an MI index of 2013–2014 is less than 1. According to the China Logistics Development Report 2013–2014, this may be due to the fact that in 2013, the continued downturn of steel, coal, and other production-related industries led to the weak demand for logistics in China and overcapacity, and some enterprises had difficulties in operation, thus reducing their scale. The MI index is greater than 1 in the remaining years, indicating a trend of small growth in the efficiency of the logistics industry in the regions along the route, which also shows that the development momentum of the logistics industry in the provinces and cities along the route depends on the growth of total factor productivity, in addition to the input of production factors. Second, from the TC index, there are 5 years in the time frame of the study where the TC index is less than 1, but the average value of each time period is 1.100, which indicates that the overall technical level of China’s logistics industry is on the rise. Finally, from the EC index, the EC index and its decomposition indexes PEC index and SEC index show small fluctuation changes during the study years, but the mean values of the EC index, PEC index, and SEC index for 15 years are still greater than 1, which indicates that the efficiency of the logistics industry has a tendency toward continuous improvement, which is closely related to the continuous improvement of the logistics management level.
(2) Dynamic analysis of logistics efficiency in subregions along the route
According to the regional division in the previous section, our study is divided into the northeast, northwest, southeast, and southwest regions for the dynamic analysis of logistics efficiency. After finishing, the MI indices of logistics industry efficiency and their decomposition of the four regions along the route are obtained, as shown in
Table 13. It can be seen that, among the four regions, the mean value of the MI index in the southeast region is the highest, and the remaining regions are the southwest, northeast, and northwest regions in descending order. Additionally, the mean value of MI indexes in all four regions is greater than 1, which indicates that the overall logistics industry efficiency in all four regions shows an increase. Among them, the regions with the highest mean value of the TC index are southeast and southwest, which is related to the promotion of the development of the logistics technology level in southeast with a high economic level, complete infrastructure, and large scale of the logistics industry, while the development of logistics technology in southwest is slower due to the late start of the logistics industry and low level of infrastructure construction due to economic and natural conditions and location of the region. EC, the mean value of the index, is from high to low in this order: southwest, southeast, northeast, and northwest, which indicates that the efficiency of the logistics industry in the southwest region has the fastest change, while the southeast region has better economic foundation and booming development of the logistics industry, so the efficiency of the logistics industry has faster change. In contrast, the change of logistics industry efficiency in the northeast and northwest regions tends to be stable.
Comparing the four regions, it is found that the average value of the TC index in all the four regions is higher than the average value of the EC index, indicating that the improvement of the MI index of the logistics industry in the four regions along the route is mainly due to the progress of logistics industry technology. It can be seen that, in pursuing the improvement of the efficiency of the logistics industry in the regions along the “Belt and Road” in China, not only strengthening the construction of logistics channels and the construction of an informatization logistics platform is necessary, to enhance the informatization and information connection of the logistics industry, in order to play the role of logistics technology in promoting the improvement of the efficiency of the logistics industry, but also strengthening the training of logistics industry personnel and improving the logistics management level and the scale effect of regional logistics are needed.
(3) Analysis of the dynamics of logistics efficiency in the provinces and cities along the route
In order to further study the dynamic changes of the efficiency of the logistics industry in China along the “Belt and Road”, our study calculates the mean value of the MI index, TC index, EC index, PEC index, and SEC index of each province and city along the route from 2006 to 2020, and the results are shown in
Table 14. As can be seen from the table, the MI index of only one province, Qinghai, among the 17 provinces and cities along the route is less than 1, indicating that the efficiency of the logistics industry in most provinces and cities along the route is on the rise. Since the “Belt and Road” strategy was proposed, Qinghai Province has accelerated the construction of a comprehensive transportation network for opening up to the west.
Among the 17 provinces and cities along the region, the province with the highest MI index is Fujian Province, indicating that its logistics industry efficiency has increased the most. The TC index value of Fujian Province is greater than the EC index value, indicating that the increase in logistics efficiency of the province is mainly attributed to the progress of logistics technology, which is because Fujian is located in the southeast coast, with a superior economic development, larger logistics scale, and more complete transportation infrastructure network, cargo turnover, maritime transport. The region with the lowest MI index is Qinghai Province, whose TC index is greater than 1 and whose EC index is less than 1, indicating that the regression of its logistics industry efficiency is mainly attributed to the decline of logistics efficiency, and the size of its decomposition index PEC and SEC shows that the decline of its logistics efficiency is the result of the joint action of pure technical efficiency and scale efficiency, so Qinghai should pay attention to the cultivation of talents, improve the management level, and at the same time, improve the logistics facilities.
5. Analysis of the Factors Influencing the Efficiency of the Logistics Industry
In order to analyze the factors influencing the low-carbon logistics efficiency of the provinces and cities along the route at the macro level, our study analyzes the overall and regional data based on the data from 2006–2020 along the “Belt and Road” region. The Tobit regression model is calculated using Stata 16.0 software.
5.1. Selection of Indicators and Model Construction
5.1.1. Selection of Indicators and Data Sources
The efficiency of the logistics industry is not only related to various input factors, but also indirectly influenced by external environmental factors. Based on existing research results on the influence factors of low-carbon logistics efficiency and the comprehensive consideration of the regional situation along the “Belt and Road”, our study selects four indicators to explore the influence factors of low-carbon logistics efficiency. The indicator system is shown in
Table 15.
The relevant data in this chapter are obtained from the statistical yearbook of each province and city, the China Statistical Yearbook, and the China Energy Statistical Yearbook.
5.1.2. Model Construction
There are only two broad models used to carry out the impact factors, which are least squares and Tobit models. Since the low-carbon logistics efficiency values along the region calculated by DEA are truncated data and take values between 0 and 1, the use of least squares may lead to errors in the calculated parameter estimates, so our study chooses to use the Tobit model and constructs Tobit with the low-carbon logistics efficiency values obtained from the SBM-DEA model and the above four influencing factors as the dependent and independent variables, respectively, modeled as follows:
where
denotes the constant term;
,
,
, and
denote the parameter estimates of the four influencing factors, respectively;
,
,
,
, and
denote the low-carbon logistics efficiency value, economic development level, logistics energy structure, logistics industry structure, and logistics government expenditure in year
j of the
ith province, respectively; and
denotes the error term.
5.2. Data Processing
5.2.1. Descriptive Statistical Analysis of the Variables
In order to compare whether the low-carbon logistics efficiency value, economic development level, logistics energy structure, logistics industry structure, and logistics government expenditure level of each province and city along the route region are balanced; establish the descriptive statistical results of each influencing factor, as shown in
Table 16; make the difference between the maximum and minimum values of each factor; and compare this result with the mean value of each factor, it can be seen that: the low-carbon logistics efficiency value, economic development level, logistics energy structure, logistics industry structure, and logistics government expenditure gap are relatively large.
5.2.2. Correlation Test for Each Variable
The data were imported into SPSS, the correlation test was conducted on low-carbon logistics efficiency and the four influencing factors, and the results were obtained as shown in
Table 17. From the results, it can be seen that the correlation coefficients of ED, EC, IS, and TE are 0.267, 0.202, and 0.213, respectively, indicating that ED, EC, and IS all present a positive correlation with TE, and all pass the test at 1% level of significance. The correlation coefficient of GE and TE is −0.427 and passes the test at 1% level of significance, indicating that they present a negative correlation. Since all four independent variables are correlated with the dependent variable TE at 1% level of significance, it is considered appropriate to use these four influencing factors for the subsequent analysis.
5.2.3. Tests for the Stability of the Data
When the data lack stability, the subsequent “pseudo-regression” may appear, resulting in the reduction of the validity of the results, so there is a need for a data stability test in order to enhance the persuasive test results. Our study used Stata 16.0 software to carry out the LLC, IPS, Fisher-ADF, and Fisher-PP test. If three or more of the four rejected the original hypothesis of the existence of a unit root, then the data were considered to be stable and vice versa. The results are shown in
Table 18.
From the results, it can be seen that all the variables passed the stationarity test in all the four test forms in all the three tests, indicating that the variables involved in this chapter, low-carbon logistics efficiency values, level of economic development, energy consumption, industrial structure, and government expenditure, are all stationary series and can be used for regression analysis.
5.3. Regression Analysis
5.3.1. Full-Sample Regression Analysis
All variables were substituted into the constructed Tobit model, and the overall sample regression was calculated using Stata 16.0 software, and the results are shown in
Table 19.
The analysis of the full-sample regression results can be divided into the following four points.
- (1)
The regression coefficient value of the economic development level and the low-carbon logistics efficiency value is 0.0128299, so they show a positive correlation with a p-value of 0.000; that is, they pass the test of significance level of 1%. It shows that the improvement of the economic development level of the regions along the route plays a positive role in promoting the improvement of the low-carbon logistics efficiency values.
- (2)
The regression coefficient value of energy consumption and the low-carbon logistics efficiency value is −0.0060079, so they show a negative correlation with a
p-value of 0.079; that is, they pass the test of significance level of 10%. It shows that the higher the energy consumption of logistics along the regional logistics, the lower the value of low-carbon logistics efficiency, which may be due to the increase in energy consumption, while providing power for logistics operations also increases the burden on the environment. When carbon pollution exceeds the carrying capacity of the environment, low-carbon logistics efficiency will be reduced, so it is equally important to think about how to reduce the pressure of energy consumption on the environment under the premise of ensuring the level of logistics services. The higher the efficiency of the logistics system, the greater the savings in regional logistics energy consumption can be achieved [
48].
- (3)
The regression coefficient value of the industrial structure and the low-carbon logistics efficiency value is 0.0300081, so the two present a positive relationship with a p-value of 0.000; that is, they pass the test of significance level of 1%. It shows that a reasonable logistics industry structure has a positive contribution to the improvement of a low-carbon logistics efficiency value.
- (4)
The value of the regression coefficient between government expenditure and the low-carbon logistics efficiency value is −0.060079, so they show a negative correlation with a p-value of 0.000; that is, they pass the test of significance level of 1%. It shows that despite the large amount of government investment in the logistics industry, it is not effective in improving the efficiency of low-carbon logistics in the regions along the route. This may be due to the fact that the imbalance in the development of the logistics industry in the provinces and cities along the route region is prominent, and the government’s relevant expenditure is often closely linked to the level of local economic development, so the development imbalance has not been improved. Therefore, the government should formulate appropriate macrocontrol measures and enhance financial support to less economically developed regions in order to improve the overall level of China’s logistics industry along the “Belt and Road”.
5.3.2. Regression Analysis of Regional Samples
To further explore the influence of each influencing factor on the efficiency of low-carbon logistics in the four regions along the route, a regional sample regression was calculated using Stata 16.0 software, and the results are shown in
Table 20.
The analysis of the regression results for the regional sample can be divided into the following four points.
- (1)
From the regression results of the four regions’ economic development levels, it can be seen that the regression coefficient value of the northeast region’s economic development level and the low-carbon logistics efficiency value is −0.0152165 and passes the test at the 5% significance level, indicating that its economic development level is negatively correlated with low-carbon logistics efficiency, which is different from the regression results of the full sample, which may be caused by the high-speed and low-quality development of the region’s economy. The value of the regression coefficient between the level of economic development and the value of low-carbon logistics efficiency in the northwest region is 0.0211083 and passes the test at the 1% significance level, indicating that its level of economic development has a catalytic effect on the improvement of its low-carbon logistics efficiency, while the level of economic development in the southeast and southwest regions does not have a significant effect on its low-carbon logistics efficiency.
- (2)
From the regression results of energy consumption in the four regions, it can be seen that the regression coefficient of energy consumption and low-carbon logistics efficiency values in the northeast region is 1.119874 and passes the 1% significance level test, indicating that its reasonable energy consumption has a strong contribution to the improvement of low-carbon logistics efficiency, which is different from the regression results of the full sample, indicating that energy consumption compatible with the overall regional development can also lead to the improvement of low-carbon logistics efficiency. The regression coefficient of energy consumption and low-carbon logistics efficiency in the southeast region is −0.3297515 and passes the test at the 1% significance level, indicating that energy consumption and low-carbon logistics efficiency in the region are negatively correlated. Energy consumption in the northwest and southwest regions has no significant effect on low-carbon logistics efficiency.
- (3)
The regression results of the industrial structure of the four regions show that the regression coefficients of the values of low-carbon logistics efficiency of the industrial structure of the northwest and southwest regions are 0.0635115 and 0.0569106, respectively, and they both pass the test at the 1% significance level, indicating that the industrial structure of these two regions has a positive effect on the improvement of their low-carbon logistics efficiency, which is consistent with the findings of the full-sample analysis. The role of industrial structure on low-carbon logistics efficiency in the northeast and southeast regions is not significant.
- (4)
The regression results of government expenditure in the four regions show that the regression coefficients of government expenditure and low-carbon logistics efficiency in the northwest and southeast regions are −0.0179162 and −0.1812927, respectively, and pass the tests at the 5% and 1% significance levels, respectively, indicating that government expenditure in these two regions is negatively related to low-carbon logistics efficiency, which is consistent with the results of the full-sample analysis. There is no significant effect of government expenditure on low-carbon logistics efficiency in the northeast and southwest regions.
6. Discussion
The prosperity of the modern logistics industry plays an important role in economic development, and it is an important support for many industries and plays a driving role in improving the speed and quality of regional economic growth. Therefore, improving the efficiency of the logistics industry is beneficial to the optimization of an industrial structure, the promotion of social employment, and the improvement of industry development. On the other hand, it plays an important role in optimizing the allocation of input and output resources, exploring the path to reduce the burden on the environment and even promoting the development of the whole logistics industry, and also responds to the green development concept of “Belt and Road”.
From the perspective of low-carbon economy, this paper responds to the strategy of “One Belt and One Road”; selects 17 provinces and cities along the “One Belt and One Road” in China as the research object; divides them into four regions; takes carbon emissions from the logistics industry as nonexpected output; measures the efficiency of the logistics industry; conducts comparative analysis in three dimensions, which are overall, regional, and provincial; and gives suggestions for efficiency improvement, which helps to further clarify the concept of logistics efficiency, enriches the theoretical system of low-carbon logistics efficiency and sustainable development to a certain extent, and improves the research content and method of logistics industry efficiency measurement.
With the rapid development of the “Belt and Road” construction, China’s logistics industry is facing unprecedented favorable conditions, while the large gap in the development of the logistics industry among the provinces and cities along the route has had a certain impact on the development of cooperation between the regions. This paper considers the nonexpected output indexes in the evaluation system, understands the differences of carbon emissions of the logistics industry in each province and city along the route through empirical analysis, and evaluates the low-carbon logistics efficiency in the route from two perspectives—static and dynamic—which provides scientific and effective data support and a theoretical basis for the low-carbon development of the logistics industry along the “Belt and Road” route. It also provides scientific and effective data support and a theoretical basis for the low-carbon development of the logistics industry along the “Belt and Road”, and provides a decision basis for the government to formulate regional emission reduction plans and implement a carbon emission assessment system. From the study results, the development level of low-carbon logistics in each province along the “Belt and Road” in China is uneven, and the logistics efficiency of most provinces has not reached the optimal level, so there is great room for improvement and development potential. From 2006 to 2020, the overall low-carbon logistics efficiency of China’s regions along the Belt and Road shows an upward trend. Among them, technological progress has a driving effect on the growth of low-carbon logistics efficiency, while the low scale efficiency and pure technical efficiency form a certain obstacle to the growth of low-carbon logistics efficiency. The level of economic development and industrial structure have positive effects on the improvement of low-carbon logistics efficiency in the regions along the route, while energy consumption and government expenditure are negatively related to low-carbon logistics efficiency.
Based on the above findings, this paper makes the following suggestions:
- (1)
Adhere to the low-carbon concept and promote green logistics. According to the calculation and analysis results of carbon emissions of the logistics industry along the route, it is clear that the rapid development of the logistics industry is accompanied by the negative impact on the ecological environment. In order to respond to the call for sustainable development in the “Belt and Road” initiative, the government should strengthen the guiding role, establish a set of effective carbon emission supervision mechanism for the logistics industry, and introduce carbon-emission-related laws and regulations to regulate, supervise, and motivate the trinity so as to promote the green development of the logistics industry. In addition, it should also incorporate green logistics into government planning, accelerate the development of green technologies, encourage reverse logistics and resource reuse, and implement clean energy tax subsidies and carbon emission trading systems, with a view to achieving environmental protection and resource conservation.
- (2)
Play a leading role and promote synergistic development. According to the results of the static analysis of regional low-carbon logistics efficiency along the route, it can be seen that there is an unbalanced development of the logistics industry among provinces and cities and regions. In order to narrow the regional logistics efficiency gap and achieve synergistic development, four provinces and cities, namely, Fujian, Zhejiang, Inner Mongolia, and Shanghai, should play a leading role, strengthen the dissemination of advanced logistics energy-saving technologies and the summary of advanced management methods, and enhance experience sharing and exchange cooperation with other provinces under the guidance of the “Belt and Road” initiative so as to narrow the regional efficiency to reduce regional efficiency differences and promote the synergistic development of the regional logistics industry along the “Belt and Road”.
- (3)
Focus on technology research and development to enhance scale efficiency. According to the results of the dynamic analysis of low-carbon logistics efficiency in the regions along the Belt and Road, technological progress has an important role in promoting the improvement of low-carbon logistics efficiency in the regions along the Belt and Road. Therefore, it is important to continue to strengthen the upgrade of logistics technology innovation and explore the path of scale efficiency improvement. To this end, in terms of technological progress, we can focus on strengthening the close connection between “Internet+” and low-carbon logistics, introducing unmanned vehicles, sorting robots and other high-tech logistics equipment, and using efficient logistics information technology, such as big data and cloud computing. In terms of expanding the scale of benefits, we can take measures to strengthen the integration and reorganization of the logistics industry, break the barriers of cooperation between various modes of transportation and enterprises, and strengthen the standardization and informationization of the logistics industry.
- (4)
Control energy consumption and increase government input. According to the results of the analysis of the influencing factors of logistics efficiency in the regions along the route, it can be seen that energy consumption and government expenditure have not positively influenced the efficiency of low-carbon logistics in the regions along the route. For this reason, in terms of energy consumption, a pushback mechanism can be adopted; that is, energy consumption can be controlled through energy quota consumption in the logistics industry, while the share of clean energy consumption can be promoted jointly in terms of policy and technology, with a view to promoting the green development of the logistics industry in the coastal regions. In terms of government investment, while comprehensively increasing the investment in the logistics industry, it should also pay attention to the formulation of macrocontrol policies, and should be appropriately tilted to less economically developed regions in the allocation so as to accelerate the process of overall improvement of the efficiency of the regional logistics industry along China’s “Belt and Road”.
However, our paper has the following limitations. In our paper, 17 provincial regions are selected as the research units, while in the actual study, there are certain differences in the development level of the logistics industry within the same province, so the ideal research unit should be prefecture-level cities or county-level regions. However, due to the availability of data, it is difficult to collect the energy consumption in areas below the provincial level, and the provincial level is the most detailed research unit in both domestic and international studies. Therefore, it is hoped that in future research, we can enrich the relevant scientific data, change the research idea, find alternative and representative variables, further refine the research unit, and obtain conclusions that are more reliable and closer to the current life of research so as to provide theoretical guidance for the green development of the regional logistics industry.
7. Conclusions
The study of domestic scholars on the efficiency of low-carbon logistics in regions along the “Belt and Road” has been comprehensive, and it is found that although some scholars have focused on the provinces and cities along the “Belt and Road” in China, most of the studies have focused on the overall analysis or the analysis of specific provinces and cities. However, this paper quantitatively analyzes the efficiency of the logistics industry in 17 provinces and cities along the “Belt and Road” in China during the period of 2006–2020 to investigate the sustainable development level of the logistics industry in general and in regions and specific provinces and cities and analyze the factors affecting the efficiency of the logistics industry. The paper also analyzes the key factors affecting the efficiency of the logistics industry, and makes corresponding suggestions based on the empirical results in order to provide reference for the sustainable and coordinated development of the logistics industry in the regions along the Belt and Road. The following conclusions are drawn from the empirical analysis of this paper:
According to the measurement results of carbon emissions from the logistics industry along the route, from 2006 to 2020, the energy consumption and carbon dioxide emissions of 17 provinces and cities along the “Belt and Road” in China showed an increasing trend year by year, while the energy intensity and carbon emission intensity showed a decreasing trend, indicating that the green level of the logistics industry in China has improved in recent years due to technological improvement and national policies. However, energy consumption and carbon emissions are still on the rise, and the environmental pressure brought by the logistics industry is still great, so there is still a long way to go to promote the green development of the logistics industry.
According to the static evaluation results of logistics industry efficiency along the route, from 2006 to 2020, the efficiency values of the logistics industry in most provinces and cities along the route did not reach the effective state, which indicates that the overall low-carbon logistics efficiency level of all provinces and cities along the “Belt and Road” in China is low. The average value of low-carbon logistics efficiency in the regions along the Belt and Road shows fluctuations, and since the pure technical efficiency is relatively stable, it can be seen that the main factor affecting the overall efficiency is the scale efficiency; from the regional point of view, the logistics industry efficiency in the four regions along the Belt and Road is ranked from high to low in the southeast, northeast, northwest, and southwest, and the southeast has obvious advantages, while the other three regions are close to each other, indicating that a good economic and logistics industry foundation has a great influence on the efficiency of the logistics industry; from the perspective of specific provinces and cities, the highest value of low-carbon logistics efficiency of provinces and cities along the route region is 1.0000, and the lowest value is only 0.0944, with large differences in logistics efficiency values among provinces, which illustrates the uneven development of the logistics industry in provinces and cities along the route region from 2006 to 2020.
According to the results of the dynamic evaluation of the efficiency of the logistics industry in the regions along the route, on the whole, although there are slight fluctuations in each decomposition index of the average value of the MI index in the calendar years of the regions along the route from 2006 to 2020, the average values of MI, TC, EC, PEC, and SEC in the regions along the route are still greater than 1, indicating that the overall development of low-carbon logistics in the regions along China’s “One Belt and One Road is positive. By region, the mean values of the MI indexes of the regions along the Belt and Road are, in descending order, southeast, southwest, northeast, and northwest, and the MI indexes are all greater than 1, indicating that the low-carbon logistics efficiency in all the four regions shows an upward trend. The TC index of all the four regions is higher than the EC index, which indicates that the growth of logistics industry efficiency in all the four regions is mainly due to the progress of logistics technology, and also indicates that the four regions should focus on the improvement of regional scale efficiency when exploring the efficiency improvement path of the logistics industry. From the perspective of specific provinces and cities, except for Qinghai, the average value of MI from 2006 to 2020 is greater than 1, and the highest of them is Fujian Province, which shows that most of the provinces and cities along the region have continued to grow in low-carbon logistics efficiency. The average value of the TC index in Qinghai Province is greater than 1, while the average value of the PEC and SEC indexes is less than 1, indicating that the overall decline in logistics efficiency in Qinghai Province is the result of the combination of scale efficiency and pure technical efficiency.
From the results of the study on the factors influencing the efficiency of the logistics industry in the regions along the Belt and Road, on the whole, four indicators, namely, the level of economic development, energy consumption, industrial structure, and government expenditure, have a significant effect on the low-carbon logistics efficiency in the regions along the Belt and Road. Among them, economic development level and industrial structure have a positive effect on low-carbon logistics efficiency, while energy consumption and government expenditure are negatively related to low-carbon logistics efficiency. By region, the level of economic development is negatively related to low-carbon logistics efficiency in the northeast, has a facilitating effect on low-carbon logistics efficiency in the northwest, and has no significant effect on low-carbon logistics efficiency in the southeast and southwest; energy consumption is positively related to low-carbon logistics efficiency in the northeast, has an adverse effect on low-carbon logistics efficiency in the southeast, and has no significant effect; industrial structure has a positive contribution to low-carbon logistics efficiency in the northwest and southwest regions and no significant effect on the northeast and southeast regions; government expenditure is negatively related to low-carbon logistics efficiency in the northwest and southeast regions and has no significant effect for the northeast and southwest regions.


