Abstract
Ground control point (GCP) is an important calibration factor when correcting position information during unmanned aerial vehicle (UAV) remote sensing. Studies of the optimal number and distribution shape of GCPs have been conducted worldwide in recent years. However, when conducting surveys at houses, construction sites, farming lands, forests, and some other locations, it is both difficult and destructive to install GCP inside the subject area. In many cases, it is only possible to install GCP at the outer edge around the area. Therefore, this study aims to suggest the optimal GCP distribution pattern, which can provide the highest accuracy, when only the outer edge of a particular area is available. In this research, 88 GCP patterns have been validated and compared at an 18 ha farm. Results show that the patterns with GCPs distributed evenly around the field provided the best calibration (RMSE = 0.15 m). If this kind of pattern is not achievable because of obstructions, patterns with GCPs distributed evenly around half of the field or forming an evenly distributed triangle can provide moderate accuracy (RMSE = 0.18 m and 0.43 m, respectively). Patterns with GCPs forming a straight line yielded the worst accuracy (RMSE = 2.10 m). This shows that GCP distributions of a two-dimensional shape, even if the surrounding area is small, are better calibrated than a long, straight line. These results strongly suggest that appropriate GCP distribution patterns in the study areas will provide satisfactory accuracy for constructing integrated monitoring systems of diverse resources.
1. Introduction
Remote sensing employing unmanned aerial vehicles (UAVs) is becoming a popular and trustworthy technology for both users and researchers in many technical fields. UAVs have an extremely high observation resolution compared with satellite remote sensing data, and higher efficiency and utility than laser scanning remote sensing. These advantages have made UAV one of the most optimal platforms for local regional scale remote sensing. The rapid developments in both engineering and sensor technology have enabled UAVs to contribute to a variety of uses, such as constructing three-dimensional terrain models of mountainous areas [1], water bodies [2], farming land [3,4,5], forests [6,7,8,9,10], and artificial structures [11], as well as estimating biomass storage of wood or grass resources [12,13], monitoring crop growth status [14], grasping the condition of disaster areas [15], and evaluating ecosystem service [16].
When a highly accurate topographic map is required, or the photographs of a certain area taken by multi-temporal surveys need to be overlapped and compared to see dynamic changes, the position information of the UAV remote sensing data must be corrected and optimized. This is because the position information obtained by the geographic positioning system (GPS) equipped on UAV has a limited accuracy, which may be unstable due to the weather or satellite signal reception [17].
The use of ground control points (GCPs) is one of the most commonly used methods to correct the position information of UAV imagery. With this method, several GCPs are set inside or around the subject area, for which coordinates (x, y, z) are measured by precise positioning equipment such as the real-time kinematic global navigation satellite system (RTK-GNSS). Before the UAV photography is conducted, anti-aircraft signs are placed on the GCPs, so that the points can be identified from the UAV photographs. The position information of the photographs is corrected afterwards during the bundle adjustment within the Structure-from-Motion (SfM) software by inputting the correct coordinates of the GCP [18].
Although the use of GCPs contributes greatly to the accuracy of photogrammetric products (such as orthomosaic and digital surface models), settlement and measure of the GCPs are time-consuming works. Therefore, UAVs with global navigation satellite system real-time kinematic (GNSS-RTK) on board have been gathering attention [19]. Specifically, the UAV post-processed kinematic (PPK) and real-time kinematic (RTK) are two kinds of technologies that are commonly used for the direct georeferencing, and the accuracy could be very close to that of the projects using a reasonable GCP distribution [20,21,22,23]. However, the elevation error of these approaches varies significantly depending on the experimental equipment and the object surface morphology, resulting in an unstable elevation accuracy [24], and a double-grid oblique flight in differential mode is required to achieve the similar accuracy with the GCP method [25]. There are still also limitations to these approaches. For example, the network transmission (NRTK) which supports the real-time differential correction of RTK is easily affected by the long reference distance when the flight path of the UAV is long [26]. Moreover, during the SfM procedure, when the UAV data are expressed as a vertical ‘doming’ of the surface, which is caused by a combination of near-parallel imaging directions, the absence of GCPs can easily lead to a systematic broad-scale error (as known as the dome effect) [27]. Furthermore, in practice, UAVs with GNSS-RTK onboard are still costly, which restricts their wider use in developing countries or rural areas. Based on this background, the utilization of GCPs is still necessary for UAV photogrammetry to meet the requirement of sustainable resource management.
There are many previous studies of the influence on the GCP setting to the horizontal or vertical accuracy of the SfM products. Evaluating the quality of GCP setting is a complex task because many variables have to be taken into consideration. Over the years, various studies have analyzed the effect of the number and spatial configurations of the GCPs used for indirect georeferencing [28,29,30,31,32,33,34,35,36,37]. Most of the above research assumes that the higher the number of GCP used, the better the overall accuracy. For example, Mirko et al. (2019) tested the accuracy obtained from various photogrammetric workflows in 3D modeling of a coastline georeferencing. The results showed that 3 GCPs are needed for reasonable georeferencing, efficient results may be obtained using 6–7 GCPs, and more than 15 GCPs are necessary to produce accurate cartographic works [38].
However, the number of GCPs is not the only variable that affects the calibration accuracy. The position of each GCP used is also a crucial factor that needs to be considered during the surveys. For example, Oniga et al. assessed the UAV photogrammetric accuracy using different GCP settings at an urban area of about 1 ha in Romania. The results not only showed that a higher number of GCPs improves the accuracy, but also suggested the facts such as the GCPs in the corners of the study site are essential, placing the GCPs along the border of the study block is not optimal, and interior GCPs are improving the accuracy significantly [39]. Awasthi et al. (2020) discussed the accuracy of UAV-based photogrammetric products in corridor mapping and area with undulating terrain for different sets of GCP settings. The results showed that the GCPs should be established in places covering all elevations with a minimum of five GCPs in the shape of a die [40]. Cabo et al. (2021) used generalized additive models (GAMs) to analyze the relationship between the root mean squared error (RMSE) and the mean absolute error (MAE) in the Z coordinate in a group of checkpoints and in a set of covariates related to the number and spatial distribution of GCPs. As a result, among the different predictor variables (describing GCP number and distribution), the number of GCPs had the greatest influence on vertical accuracy. Other variables such as mean distance between control points or distance of checkpoints from their nearest GCP contribute much less to explaining RMSE and MAE [41]. Villanueva and Blanco (2019) presented a method for assessing the impact of GCP distribution, quantity, and inter-GCP distance on the output digital elevation model (DEM) by utilizing SfM and GIS. The results showed that the best configuration was the evenly distributed GCP set, configurations clumped to the edge and distributed to the edge had the lower accuracy, and those configurations clumped to the center yielded the worst accuracy [36]. Furthermore, the Geographical Survey Institute of Ministry of Land, Infrastructure, Transport, and Tourism of Japan also suggests that at least four GCPs should be used and must be set both surrounding and inside the subject area to obtain satisfactory accuracy for public surveying with UAV [42]. However, none of the previous studies above has covered all the variables that affect the quality of GCP setting, such as the number of GCPs, the distance between GCPs, or the distribution configuration of GCPs.
Furthermore, most of the previous studies have agreed that GCPs should be evenly spaced around the subject area if possible, and the more GCPs are used, the higher the accuracy is expected. However, the most basic aim and advantage of UAV remote sensing is to observe areas that are difficult or impossible for investigators to enter. For example, for land surveys, it is difficult to set the GCP on artificial structures; in the case of forest surveys, the anti-aircraft signals cannot be recognized even if the GCPs are placed and measured inside the forest; in the case of ecosystem service surveys, it is impossible to set stable GCPs at the center of a water body such as lakes or rivers; and for agricultural surveys, setting GCPs inside the crops is destructive for the growing plants and will cause disruptions to field management. Therefore, it is necessary to acknowledge that in many surveying sites, only the outer edges of the subject area are available for GCP placement. Based on this reality, the current study aims to create a standard to evaluate the quality of GCP setting to provide a guideline for researchers or surveyors of UAV photogrammetry to decide the most optimal number and spatial configuration of GCPs without intruding into the subject area.
2. Materials and Methods
2.1. Study Area
The survey for this study was conducted at an experimental field located in the agricultural area of Obihiro City, Hokkaido, Japan (Latitude: 42.3728°, Longitude: 142.9985°, Elevation: 261 m above sea level, Figure 1). The study site was approximately 300 × 400 m (12 ha), with the elevation change of 7.5 m. The experimental field was selected as the study area because the difference in elevation was small, so that the topographic factor would not have significant influence on the georeferencing error. Moreover, it was a typical sample of cropland or grassland, which would be an inaccessible area during the growing season of the crop.
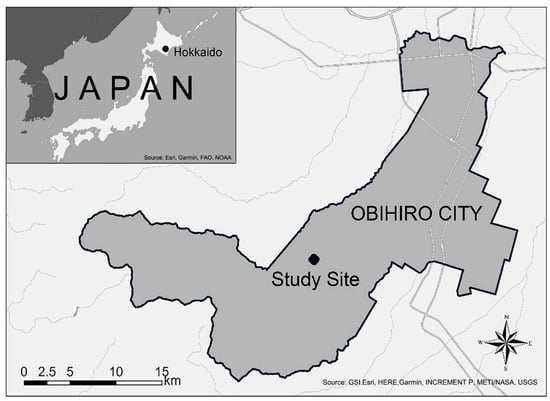
Figure 1.
Study site location.
2.2. Data Collection
The field survey was conducted on 21 August 2021. The weather was sunny, and the wind speed was less than 2 m/s during the whole survey period. As shown in Figure 2, twelve GCPs were evenly distributed at the outer edge of the study site. The distance between two nearest GCPs was between 48 m and 144 m. However, twenty checkpoints were evenly distributed across the whole area of the field. The anti-aircraft signals were placed on the GCPs and checkpoints. The size of the anti-aircraft signals for GCPs was 60 × 60 cm, while the size of those for checkpoints was 35 × 35 cm (Figure 3). All the points had a clear view of the sky and maintained a distance of at least 5 m from the trees or houses.
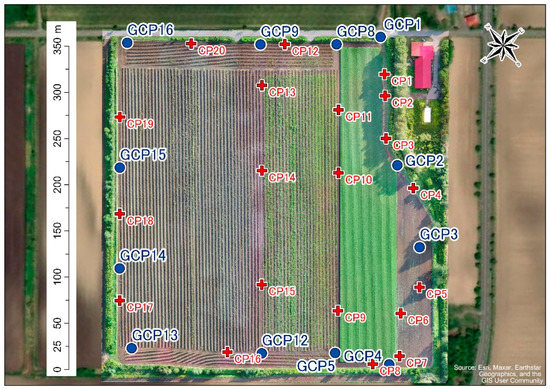
Figure 2.
Distribution of GCPs and check points inside the study site.
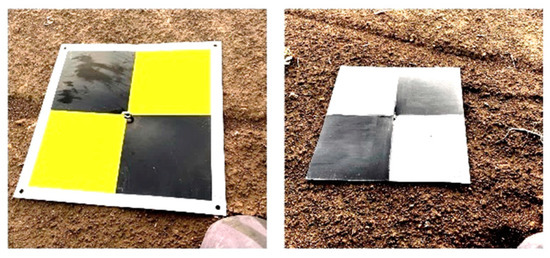
Figure 3.
Anti-aircraft signals (Left: For GCPs; Right: For check points).
The coordinates of the GCPs and the checkpoints were determined using an RTK-GNSS receiver (Hiper V, TOPCON, Tokyo, Japan) in real-time kinematic mode. The distance between the study site and the nearest electronic reference point (Taisho Town, Obihiro City) was 9.43 km. The antenna height of the receiver was 1.80 m above ground (Figure 4). According to the manufacturer of the RTK-GNSS equipment, the MAE of the measured coordinates was expected to be 10 mm horizontally and 15 mm vertically. The GCP and check point coordinates were used to correct the position information of the UAV photogrammetry results and verify the accuracy of the corrected photogrammetry results, respectively.
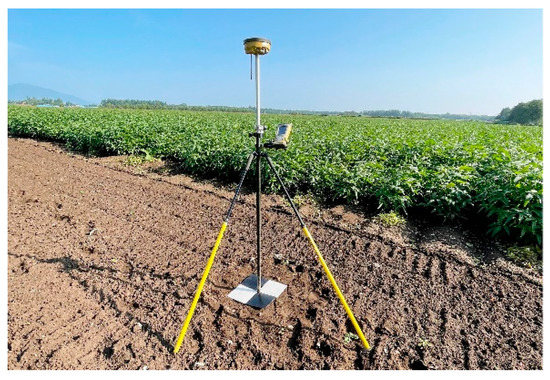
Figure 4.
RTK-GNSS (TOPCON HiperV) measuring.
The UAV photography was conducted after the GCPs and checkpoints were placed and measured. The UAV used in this study was the Inspire 2 (DJI Inc., Shenzhen, China, Figure 5). The camera used to obtain the RGB imagery was the Zenmuse X5S (9–45 mm, resolution: 5280 × 3956). During photography, the camera angle was set to be vertical downward. Two flights were conducted to capture the whole field area because of the battery limitation. Both flights were flown based on the same parameters using an auto flight application Pix4D capture (Pix4D, Lausanne, Swiss). The flying altitude was 50 m above ground; the overlap was 70% by top and 70% by side. The total flying time was 31 min 23 s and total flying distance was 10.045 km, covering a total area of 16 ha and collecting 780 images.
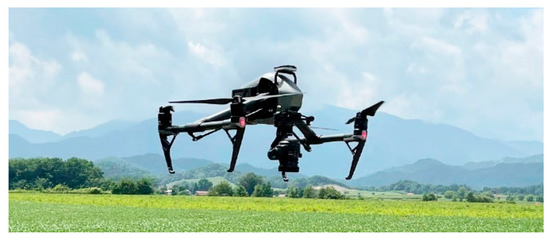
Figure 5.
UAV photography with Inspire2 at the study site.
2.3. Data Processing
2.3.1. Workflow
The data process workflow is shown in Figure 6. The UAV imagery was processed using an SfM software (Pix4D mapper ver 4.5.6, Pix4D, Lausanne, Swiss). After inputting the images into the software, the initial step of SfM, which is the bundle adjustment including the image alignment and camera parameters viewpoint calculation, was performed. Next, the three-dimensional tie point cloud describing the surface model of the object area was constructed. The tie point cloud included the sparse points with 3D coordinates acquired from the GPS information of the UAV images. Subsequently, a high-density point cloud was constructed based on this sparse tie point cloud. Then, as the final production of the SfM, a digital surface model (DSM) and orthomosaic was constructed based on the high-density point cloud. Therefore, to provide accurate position information to these photogrammetry results, the position calibration using a well-distributed GCP set needs to be applied right after the tie point cloud is constructed. To discuss the optimal GCP establishment, this study has created 88 kinds of GCP set patterns with different GCP number and distribution. Each GCP pattern was then used to calibrate tie point cloud derived from the original UAV images at the SfM software, and the calibrating accuracy were compared to reveal the effect by GCP distribution on the georeferencing accuracy. The details of these GCP patterns are introduced in the Section 2.3.2.
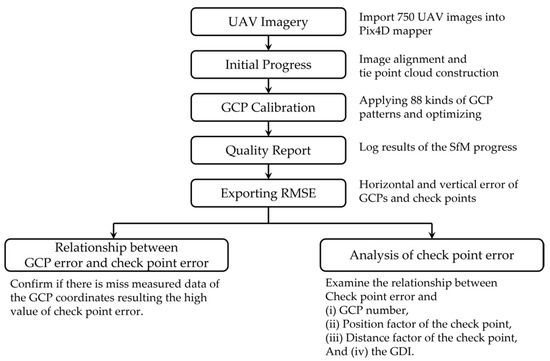
Figure 6.
Data process workflow.
After inputting the GCP information and optimizing the tie point cloud, the software exported a quality report including the bundle adjustment details (the calculated camera position, overlap, and number of key points matches) and geolocation details of the process so far for each GCP pattern. The geolocation details included the Error X, Error Y, and Error Z of both GCPs and check points. Error X stands for the difference between the computed GCP/check point 3D point and the original position obtained from UAV images in the X direction (original position—computed position); the same process was followed for the Error Y and Error Z. For clarity, this study uses “horizontal error” and “vertical error” to stand for the difference between the computed GCP/check point and the original position in horizontal and vertical directions. The calculation for horizontal error is shown in Equation (1). The value of vertical error was the same as that for Error Z.
Then, the Horizontal Error and Vertical Error of both GCPs and check points (20 points) were evaluated. During the error evaluation step, the relationship between the GCP and check point errors was examined. There is a possibility that the measurement of the GCP coordinated with RTK-GNSS may have outliers. If there were any missed data used to calibrate the point cloud, the calibration result would be misdirected and lose their reliability and reproducibility. To ensure that there were no missing data among the GCPs, the correlation between the error of each GCP and the error of all the check points was determined. If a few GCPs was mismeasured, then the error of these mismeasured GCPs would have a higher correlation with the error of the test points.
Finally, the evaluation of the twenty check points was conducted. To fully assess the calibration effect of the GCP patterns, this study discussed four GCP distribution factors that affect the accuracy of the check points: the GCP number, position of the check points, distance between the check points and the GCPs, and GCP distribution index (GDI). The details of the GDI calculation are explained in Section 2.3.3.
2.3.2. GCP Patterns
The 88 GCP patterns were separated to six groups due to the number of GCPs that were used. These six groups were named the 3-GCP Group (twelve patterns), the 4-GCP Group (twenty patterns), the 5 GCP-Group (sixteen patterns), the 6-GCP Group (twenty patterns), the 8 GCP-Group (eleven patterns), and the above-10-GCP Group (nine patterns). Within each group, the GCP patterns were separated into several types based on the configuration of GCPs, which were the (A) corner, (B) diagonal, (C) half side, (D) straight line, and (E) surrounding types.
Additionally, not all the six groups contained all types. For example, the 3-GCP group did not contain (C) the half side type, because when only three GCPs were used, (C) the half side type was not significant different from (B) the diagonal type. Similarly, the 8-GCP Group and the above-10-GCP Group did not contain (A) the corner type, because when there were more than eight GCPs applied, it was impossible to distribute them at one corner of the field. Additionally, only the 4-GCP Group and 5-GCP Group contained (D) the straight-line type, because this type was made to discuss the case of settling GCPs at one side of the field, and only the GCP configurations formed by four or five GCPs resembled that scenario. The typical patterns of each group and configuration type are shown at Figure 7.
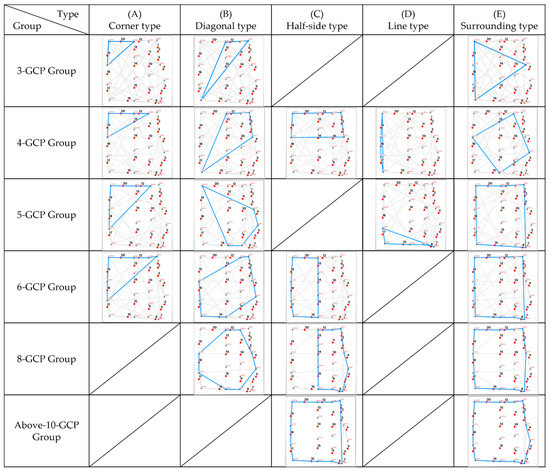
Figure 7.
Typical GCP patterns of each group and each configuration type.
2.3.3. GCP Distribution Index Calculation
To recommend the optimal GCP distribution that is applicable to different locations and periods, some studies have described GCP distribution quantitatively using the GCP density. For example, Gindraux et al. (2017) determined ρGCP (1/km2) as the density of GCPs per unit area [41]. However, this method reduced one dimension, which was the spatial bias inside one square kilometer. With this method, as long as the quantity of GCPs inside a certain area was the same, even if they were clumped in the center or distributed at the edges, the GCP density was the same. Knowing the optimal number of GCPs calculated by the optimal GCP density, users of UAV photogrammetry still face the problem of how to distribute the GCPs. It is a crucial problem, because the configuration of GCPs also has a significant effect on the photogrammetric accuracy [39]. In this study, the GDI has been used to quantify the GCP distribution considering not only their quantity but also their spatial bias. The GDI was calculated by Equation (2).
In this equation, AreaGCP indicates the area surrounded by GCPs, while AreaWhole indicates the whole subject site. When the number of GCP is the same, the larger the area surrounded by GCPs, the higher the GDI value. However, when the area surrounded by GCPs is the same, the more GCPs are used, the higher the GCI value.
3. Results
3.1. Relationship between GCP Error and Check Point Error
The coordinates of twelve GCPs and twenty check points measured by RTK-GNSS (Table 1) were used as the reference data to calculate the GCP error and check point error. The coordinate system used in this study was the Japan Geodetic Datum 2011 (JGD2011)/Japan Plane Rectangular CS XIII. The relationship between GCP error and check point error is shown in Figure 8. The correlation coefficient of horizontal errors was 0.21*, suggesting the horizontal error of GCPs and check points had a low correlation. Furthermore, the p value of the correlation between the vertical error of GCPs and check points was 0.065, suggesting that the vertical GCP error had no significant correlation with the vertical check point error. These results suggested that the GCP coordinate error had no significant effect on the check point error. This proved that the check point error was not caused mismeasured GCP coordinates, but by the distribution configuration or quantity of GCPs and check points.

Table 1.
Coordinates of GCPs and check points.
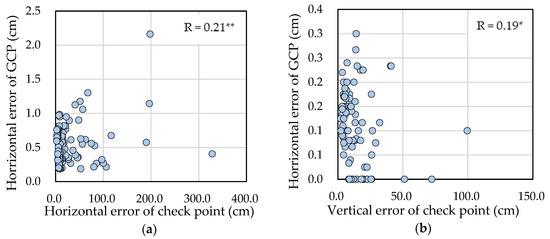
Figure 8.
Relationship between GCP error and check point error: (a) Horizontal error; (b) Vertical error (**: p-value < 0.01; *: 0.01 ≤ p-value < 0.05).
3.2. Relationship between GCP Number and Check Point Error
Figure 9 shows the relationship between the number of GCPs and check point error (horizontal and vertical). For all GCP groups, the vertical check point error was lower than the horizontal error. This was because the study site was flat with little difference in elevation. Both vertical and horizontal error decreased with the increase in the GCP number. In particular, the horizontal error decreased significantly from 0.611 m to 0.144 m when the GCP number increased from five to six. This suggested that for a subject field with the area of approximately 10 ha, using at least six GCPs would efficiently improve the calibration compared to using less than five.
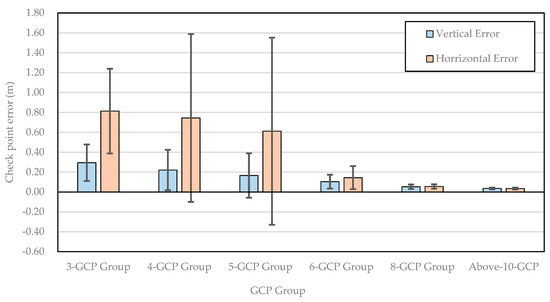
Figure 9.
Relationship between GCP number and mean check point error.
However, even though the average horizontal error of the 3-GCP Group, 4-GCP Group, and 5-GCP Group was significantly higher than the groups with more GCPs, it did not mean that all the patterns with three, four, or five GCPs had low calibration. As shown in Figure 9, all the three groups had an extremely high standard deviation (STDEV) value of the check point error. The STDEV for the 4-GCP Group and 5-GCP Group (0.884 m and 0.940 m, respectively) was even larger than the mean horizontal error (0.813 m and 0.744 m, respectively). This implied that even when the GCP number was the same, different GCP patterns had varied check point errors, indicating that the GCP number should not be the only factor considered when determining the optimal GCP distribution.
3.3. Relationship between GCP Configuration Type and Check Point Error
Because Figure 9 indicated that the both the mean horizontal error and the STDEV of the 3-GCP Group, 4-GCP Group, and 5-GCP Group were particularly high, the mean horizontal error of each GCP pattern in these groups are shown in Figure 10 to identify the specific GCP patterns with extremely high horizontal error. As shown in Figure 10, the horizontal error of Pattern 05 and Pattern 07 in the 3-GCP Group; Patterns 13–16 in the 4-GCP Group; and Pattern 01, Pattern 03, and Pattern 04 in the 5-GCP Group was obviously larger than 1.0 m and was significantly different from the other patterns in the same group. Even with the same GCP number, there were certain distribution configurations of GCPs that might cause high calibration error, which was further proof that the number or density cannot be the main factor to determine the optimal GCP placement. To discuss the characteristic of the GCP patterns that may cause large calibration error, the configuration of the GCP patterns with above-1.0 m-horizontal error are shown in Figure 11.
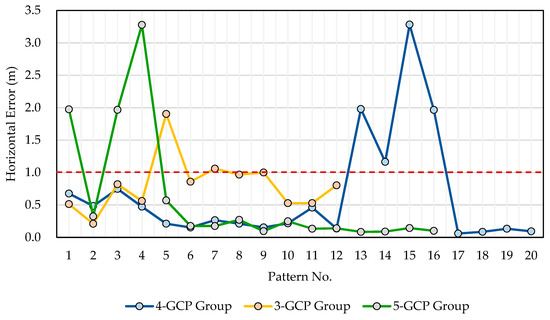
Figure 10.
Horizontal error of each GCP pattern in the 3-GCP Group, 4-GCP Group, and 5-GCP Group.
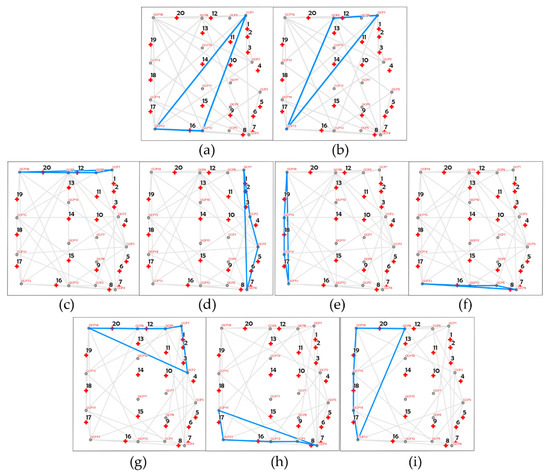
Figure 11.
GCP patterns with above-1.0 m-horizontal error: (a) Pattern 05, 3-GCP Group; (b) Pattern 07, 3-GCP Group; (c) Pattern 13, 4-GCP Group; (d) Pattern 14, 4-GCP Group; (e) Pattern 15, 4-GCP Group; (f) Pattern 16, 4-GCP Group; (g) Pattern 01; 5-GCP Group; (h) Pattern 03, 5-GCP Group; (i) Pattern 04, 5-GCP Group.
As shown in Figure 11, the GCP patterns with above-1.0-horizontal error belonged to the diagonal type in the 3-GCP Group and to the line type in 4-GCP Group and 5-GCP Group. Both the diagonal and line types had the same aspect ratio characteristic (the rate of the longest side to the height, which is vertical to it) and was the highest within their group. As shown in Figure 11, the GCP configuration of these patterns was long and narrow, especially for those in the line type in the 4-GCP Group, which were nearly a straight line. As shown in Figure 10, all the GCP patterns in the 4-GCP Group had stable, high calibration accuracy, except for the four-line type patterns. This result suggested that the higher the aspect rate of the GCP configuration, the lower the calibration accuracy would be, and the GCP patterns forming a straight line had the worst calibration accuracy.
3.4. Describing the Calibration Ability of GCPs by GDI
As noted, when the available GCPs were comparatively less, such as the 3-GCP Group, 4-GCP Group, and 5-GCP Group, the aspect rate was a useful factor when considering the optimal GCP placement. However, when the available GCPs were enough to form a well-balanced polygon, such as the 6-GCP Group, the 8-GCP Group, and the above-10-GCP Group, the distribution configuration of GCPs would not form long and narrow shapes because there were enough polygon apexes. Although the shape of distribution configuration was no longer a main factor that affected the calibration accuracy, the horizontal error still varied for different GCP patterns. For example, as shown in Figure 9, the STDEV of the 6-GCP Group was 0.116 m, which was almost equal to the average horizontal error (0.144 m). This suggested that there was a factor other than the number and configuration shape of GCPs that affected the calibration accuracy. This factor is considered to be the area ratio surrounded by GCPs.
When the numbers of GCPs are the same, and the shapes of the GCP configuration have no distinguishing characteristics, the main difference between the GCP patterns is the surrounding area. However, when the surrounding area remains constant, the number of GCPs also results in varied calibration accuracy. To integrate the effect on calibration accuracy of these two factors, this study has suggested a new parameter to describe the calibration ability of GCP, which is the GDI.
As shown in Equation (2), the GDI is the product of the rate of the area surround by GCPs and the number of GCPs. The larger the GDI value, the larger the calibration accuracy of the GCPs. When the number of GCPs is low, surrounding a larger area with these GCPs may improve the accuracy. Similarly, even with enough GCPs, if the area surrounded by GCPs is extremely small, the accuracy will be low. A proof of this is that the line type had the lowest accuracy among both the 4-GCP Group and the 5-GCP Group. The relationship among horizontal error and GDI, the rate of the area surrounded by GCPs, and the number of GCPs are shown in Figure 12. Among these three factors describing the distribution of GCPs, GDI had the highest coefficient of determination (EMSPE = 7.75%), while both the area rate and the GCP number had large variation for estimating the horizontal error (RMSPE = 8.92% and 10.25%). This result showed that as the product by the area rate and the number of GCPs, GDI was more qualified than the rest for describing the calibration ability of GCPs. To provide a reference for optimal GCP distribution determination, the horizontal error was classified into five ranks, which are shown in Table 2 with the average GDI, area rate, and GCP number relevant to each of them. This reference table indicates that to guarantee an accuracy with a horizontal error < 10 cm, the GCP distribution containing seven GCPs and surrounding 70% of the subject area is recommended. The specific number or surrounding area rate of GCPs may fluctuate, but the GDI should be maintained at approximately five. With the decrease in GDI, the expected horizontal error becomes larger. When the value of GDI is <0.5, the horizontal is expected to be >0.5 m.
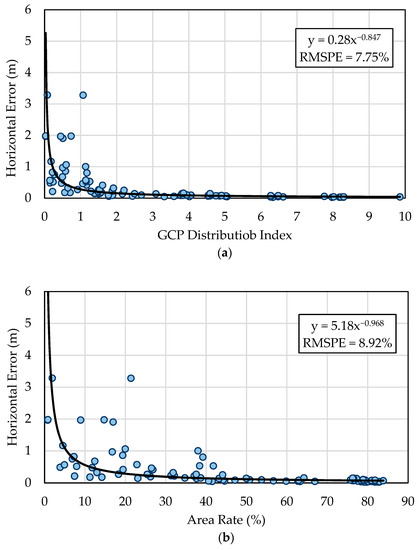
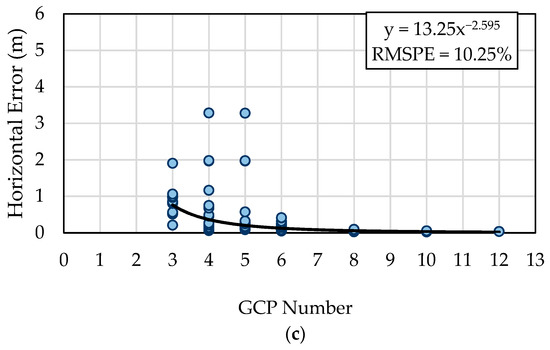
Figure 12.
Relationship between the factors describing GCP distribution: (a) GDI; (b) Rate of area surrounded by GCPs; (c) Number of GCPs.

Table 2.
Reference value of GDI, area rate, and number of GCPs of each rank of horizontal error.
3.5. Relationship between the Position of Check Point Distance and Check Point Error
To provide practical proposal for more accurate UAV photogrammetry, this study has not only focused on the placement of GCPs, but also discussed the effect of the check point position on the photogrammetry accuracy. There are two factors relating to the position of the check points: the distance between the check points and the GCPs and the positional relation between check points and the area surrounded by GCPs.
In this study, the relationship between the horizontal error of the check points and these two factors were determined. Figure 13 shows the relationship between the horizontal check point error and the average distance between each check point and three nearest GCPs for all the twenty check points in each GCP pattern for every GCP group. Within every group, the correlation coefficient was less than 0.6, suggesting that there was no significant correlation between the horizontal error and the distance between GCPs and check points.
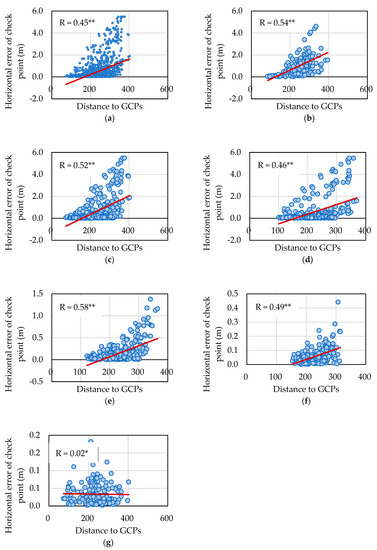
Figure 13.
Relationship between the horizontal error and the distance between GCPs and the check point: (a) All patterns; (b) 3-GCP-Group; (c) 4-GCP-Group; (d) 5-GCP Group; (e) 6-GCP Group; (f) 8-GCP Group; (g) Above-10-GCP Group (**: p-value < 0.01; *: 0.01 ≤ p-value < 0.05).
Then, the positional relation between check points and the area surrounded by GCPs was discussed. The positional relation was classified into three types: outside (check point was outside the area surrounded by GCPs), inside (check point was inside the area surrounded by GCPs), and between (check point was located between two GCPs). Table 3 shows the average horizontal error of check points of these three types for each GCP group. Within each GCP group, the outside check point type had the highest horizontal error, the inside check point type had the lower horizontal error, and the between type had the lowest horizontal error. This suggested that GCPs had better calibration effect for the subjects that were located inside the area surrounded by them and had the highest calibration accuracy when the subject was between two GCPs. This result indicated that if there is a particular subject that needs high photographic accuracy, the optimal GCP placement is to situate the subject between two GCPs. If that is hard to achieve, then having the subject inside the area surrounded by GCPs may provide moderate accuracy.

Table 3.
Average horizontal error of check points of these three types for each GCP group.
4. Discussion
UAV remote sensing is not just an engineering science, it is also a tool for the researchers and common users from all kinds of fields and occupations, such as sociology, environmental assessment, and agriculture. If the basic accuracy verification is conducted without considering the actual situation these non-professional users are facing, the existence of UAV remote sensing will be meaningless outside the academic world.
Many studies have discussed the optimal GCP distribution for UAV photogrammetry. However, when it comes to survey sites in open land or rural areas, the subject field is sometimes difficult or impossible for surveyors to enter due to the variety of environments and may be why photogrammetry by UAV is needed. In these cases, the theoretical optimal GCP distribution with GCPs inside the survey field cannot be put to practical use. In fact, many researchers or users of UAV worry about the photogrammetric accuracy when they cannot place GCPs inside the field. Sometimes, they have to put the GCPs along the road because it is the only place that is possible to set the anti-aircraft signals, but they do not know how much this special GCP configuration can correct the position information of the whole field. With these doubts, they cannot fully trust the accuracy of the photogrammetric production, and in worst cases, the whole UAV survey may be in vain. Furthermore, even if they managed to set some GCPs around the field, they have doubts such as if the GCPs can correct the position information of the subjects from far away. These researchers and users need reference data to tell them how to obtain the optimal GCP calibration effect even without the internal GCPs, and if they must place the GCPs in a special configuration such as a straight line or a little triangle, on what level the photogrammetric error will be. With this kind of reference, the UAV photogrammetry results can be clarified and start contributing to all fields of study. This is exactly the motivation of this study.
In this study, 88 GCP distribution patterns with different configurations using three, four, five, six, eight, ten, and twelve GCPs were applied for the UAV photographs of a 12 ha field to discuss the optimal GCP distribution an inaccessible field.
The results show that when the GCP number was less than six, the shape of GCP configuration was a main factor affecting the calibration accuracy of the GCPs. Specifically, the higher the aspect ratio of the GCP configuration, the lower the calibration accuracy. As an extreme case, when four GCP were used, the GCP configuration with all GCPs forming a straight line had very high horizontal error (2.099 m on average), which was over seven times that of the other configurations also using four GCPs (0.285 m on average). The reason the straight-line type of GCP configuration was discussed in this study is that it is a case that often occurs in UAV surveys. When the whole subject area is difficult to enter or there is no significant object on the ground inside the field, such as a forest, grassland, or lake, the most convenient method is to establish GCPs along the road near the field, because there are many significant objects such as signals and cracks on the road, and it is easy to install the anti-aircraft signals because the road is flat and has no obstacles on it. However, based on the result of this study, placing GCPs along the road will result in a low calibration accuracy because the GCPs will form a straight line. In such cases, it is better to arrange the GCPs into a well-balanced triangle or rectangle with low aspect ratio, such as the corner, diagonal, half-side, or surrounding type shown in Figure 7. If the field is totally inaccessible, setting the GCPs in the corner to form a right triangle will obtain better accuracy than setting the GCPs along the road. It is the same when only three GCPs are used. In the 3-GCP Group, the corner type had much better accuracy (average horizontal error = 0.526 m) than the diagonal type (average horizontal error = 1.198 m), because the aspect ratio of the diagonal type was higher than the corner type. When only three GCPs are available, putting them as an equilateral triangle or a right triangle will obtain better accuracy then an obtuse triangle (Figure 14).
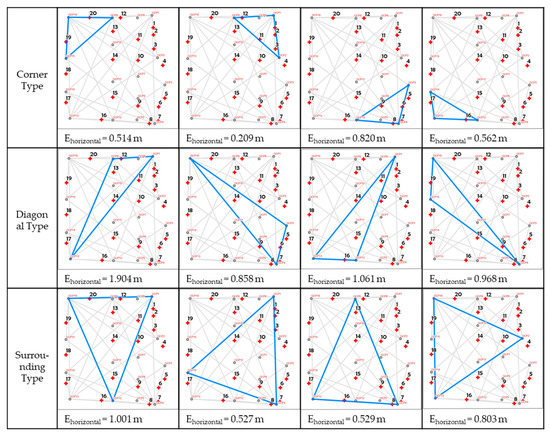
Figure 14.
GCP patterns and horizontal error (Ehorizontal) for the 3-GCP Group.
When there are more than eight available GCPs, the shape of the GCP configuration is no longer a main factor affecting the GCP calibration accuracy because the configurations formed by more than six vertices tend to have no significant aspect ratio value. However, different GCP patterns still have variable accuracy. The factor that affects the GCP calibration accuracy when more than six GCPs are used is the rate of the area surrounded by GCPs. However, the area rate cannot be the only factor explaining the accuracy, because when the area rate stays consistent, the more GCPs used, the higher the accuracy. To integrate these two factors, this study proposed the GDI (the product of area rate and GCP quantity) to describe the ability of GCP calibration when the GCP number is more than six. According to the results, GDI was better at describing the horizontal checkpoint error and thus the GCP calibration accuracy than the area rate and GCP quantity. When surveyors have doubts about the error level of their UAV photogrammetric products, they can calculate the GDI and find the corresponding error value shown in Table 3. Similarly, if they want to achieve a certain level of accuracy and have doubts about what kind of GCP distribution is suitable, they can also calculate the area rate the GCPs should surround using the GCP number. Furthermore, when evaluating former studies or reports using UAV photogrammetry with certain GCP distributions, readers can gain insight into the error level using this reference table. This provides a standard to evaluate the accuracy of UAV photogrammetric results, which have often been subjective.
The last factor that affected the GCP calibration accuracy was the position of the measurement subjects. Normally, it is considered that the farther the subject is from the GCPs, the lower the accuracy will be. However, the results showed that distance between subjects and GCPs was not the main factor affecting the accuracy because the correlation between the GCP-check point distance and horizontal error was low (R = 0.45). Instead of the distance between the subjects and GCPs, the positional relation is more impactful on the GCP calibration accuracy. Locating the subject inside the area that is surrounded by GCPs will efficiently increase the photogrammetric accuracy. However, if the subject is located between two GCPs, it will obtain the best accuracy. When a certain object instead of the whole survey land needs to be measured accurately, surveyors tend to surround the object with GCPs. Based on the results of this study, this placement of GCPs will not provide the best accuracy and placing GCPs on two sides of the object of interest is preferred.
Recently, UAV remote sensing technology has been utilized for resource monitoring in multidisciplinary fields, such as agricultural and land resources, fisheries resources, forests, agroforestry, ecosystem services, etc. It still has the potential to contribute to the transdisciplinary processes of collaborative monitoring of various natural resources with societal stakeholders due to its high-cost performance ratio, high mobility, high image resolution, and user friendliness without many difficulties in operations. However, the UAV survey with high precision is still limited in the field of information engineering and is facing difficulty in being popularized in other science fields, including transdisciplinary knowledge co-creations. This is due to the uncertain survey procedure caused by differences between various study sites. The cross-cutting between the engineering fields that focus on improving remote sensing precision and the other fields which use remote sensing technology as an approach of knowledge creation is necessary. The current study has not only introduced the common methodology of using GCPs, which is a crucial factor to improve UAV survey precision, but also created a standard of settling GCPs properly in inaccessible areas, which helps diverse users of UAV photogrammetry to obtain more reliable UAV remote sensing data at the different study sites. Furthermore, through the effective utilization of high-precision and high-resolution remote sensing data in inaccessible areas such as forests, grasslands, water bodies, coastal areas, and protected areas, it is hopeful to achieve better-integrated management of these areas through transdisciplinary collaborations with researchers of diverse disciplines and societal stakeholders. The results and proposals made in this study are useful for cross-cutting between the UAV remote sensing engineering and other practical science fields, substantially contributing to sustainable community development based on transdisciplinary integration of agricultural and other natural resource management systems by popularizing the precise UAV photogrammetry.
5. Conclusions
This study was conducted using UAV photography and RTK-GNSS equipment at an experimental field (12 ha) located in Obihiro City, Hokkaido, Japan on 24 August 2021. The calibration ability of 88 GCP pattern repetitions was verified to discuss the optimal method to determine the GCP distribution.
Results show that when the available GCPs are less than six, the aspect ratio of the GCP configuration is the main factor affecting the accuracy. A lower aspect ratio is recommended to achieve better accuracy. When there are more than six available GCPs, the GDI is the proper factor to describe the GCP calibration ability. The higher the GDI, the higher the accuracy.
This study also provided a table of reference data to predict the error value with GDI. With this indicator, the georeferencing accuracy is predictable with the GCP number and GCP area. Moreover, according to the concept of GDI, the optimal distribution of GCPs can reduce the necessary number of GCPs to achieve a certain accuracy, and by which improve the efficiency of UAV photogrammetric surveys. In additional, further study on applying the GDI at challenging terrains such as a mountainous area is required.
Finally, referring to the positional relation between the object and GCPs, this study indicated that setting GCPs on two sides of an object may improve the calibration effect more than setting GCPs around it when a certain object needs to be measured.
These results and suggestions are expected to help researchers and societal stakeholders employing UAV photogrammetry obtain more trustworthy data, which can contribute to their research and practices. By providing one improvement for natural resource users and managers to perform accurate monitoring under challenging conditions, the results of this study can hopefully help improve monitoring accuracy at inter- and transdisciplinary studies of sociology, forestry, agriculture, and engineering surveys, which contributes to the development of an integrated resource monitoring system.
Author Contributions
K.Z. designed and conducted the surveys, analyzed the data, and wrote the manuscript. H.O. conducted the conceptualization of this research, set up the condition to make it possible for the surveys, and contributed greatly to the data analyses and manuscript correction. K.H., T.H. and L.F. joined the discussions to improve the data analyses and article construction. S.M. revised the manuscript. All authors have read and agreed to the published version of the manuscript.
Funding
This study was funded by “Establishment of a Sustainable Community Development Model based on Integrated Natural Resource Management System in Lake Malawi National Park (Int NRMS) Project” under the Science and Technology Research Partnership for Sustainable Development (SATREPS) program provided by Japan Science and Technology Agency (JST) and Japan International Cooperation Agency (JICA). This work was also supported by JSPS KAKENHI Grant Number JP20K06351 and research programs of the TokyoNODAI Research Institute, Tokyo University of Agriculture and the Institute of Materials and Systems for Sustainability (IMaSS), Nagoya University.
Institutional Review Board Statement
No applicable.
Informed Consent Statement
No applicable.
Data Availability Statement
The data presented in this study are available on request from the corresponding author. Researchers with interests can contact the corresponding author directly through e-mail.
Acknowledgments
This paper benefited greatly from discussions with IntNRMS project members, especially those of the Agriculture Resource Management Group of the project. Atsuko Fukushima (Ehime University) provided administrative supports throughout the research processes. The authors are grateful to Osamu Tsuji (Obihiro University of Agriculture and Veterinary Medicine) and Kenichi Hoshiyama (Zukosha Co., Ltd., Obihiro, Japan) for providing the field and survey equipment for this study. The authors would like to thank those individuals who gave them the technical and analysis guidance during both the ground surveys and the initial data analyses. This research would not have been completed without the help of these individuals.
Conflicts of Interest
The authors declare no conflict of interest.
Abbreviations
| Acronyms | Complete Expression |
| UAV | Unmanned Aerial Vehicle |
| GPS | Global Positioning System |
| GCP | Ground Control Point |
| SfM | Structure from Motion |
| PPK | Post Processing Kinematic |
| RTK | Real Time Kinematic |
| GNSS | Global Navigation Satellite System |
| NRTK | Network Real Time Kinematic |
| GAM | Generalized Additive Model |
| RMSE | Root Mean Square Error |
| MAE | Mean Absolute Error |
| DEM | Digital Elevation Model |
| DSM | Digital Surface Model |
| GDI | GCP Distribution Index |
| STDEV | Standard Deviation |
| RMSPE | Root Mean Squared Percentage Error |
References
- Piras, M.; Taddia, G.; Forno, M.G.; Gattiglio, M.; Aicardi, I.; Dabove, P.; Lo Russo, S.; Lingua, A. Detailed geological mapping in mountain areas using an unmanned aerial vehicle: Application to the Rodoretto Valley, NW Italian Alps. Geomat. Nat. Hazards Risk 2017, 8, 137–149. [Google Scholar] [CrossRef]
- Manfreda, S.; McCabe, M.F.; Miller, P.E.; Lucas, R.; Pajuelo Madrigal, V.; Mallinis, G.; Dor, E.B.; Helman, D.; Estes, L.; Ciraolo, G.; et al. On the use of unmanned aerial systems for environmental monitoring. Remote Sens. 2018, 10, 641. [Google Scholar] [CrossRef] [Green Version]
- Bendig, J.; Yu, K.; Aasen, H.; Bolten, A.; Bennertz, S.; Broscheit, J.; Gnyp, M.L.; Bareth, G. Combining UAV-based plant height from crop surface models, visible, and near infrared vegetation indices for biomass monitoring in barley. Int. J. Appl. Earth Obs. Geoinf. 2015, 39, 79–87. [Google Scholar] [CrossRef]
- Bareth, G.; Bendig, J.; Tilly, N.; Hoffmeister, D.; Aasen, H.; Bolten, A. A comparison of UAV-and TLS-derived plant height for crop monitoring: Using polygon grids for the analysis of crop surface models (CSMs). Photogramm. Fernerkund. Geoinf. 2016, 2016, 85–94. [Google Scholar] [CrossRef] [Green Version]
- Zhang, K.; Tsuji, O.; Kimura, M.; Muneoka, T.; Hoshiyama, K. Monitoring of Crop Plant Height Based on DSM Data Obtained by Small Unmanned Vehicle Considering the Difference of Plant Shapes. Int. J. Environ. Rural. Dev. 2020, 11, 131–136. [Google Scholar]
- Zhang, Y.; Wu, H.; Yang, W. Forests growth monitoring based on tree canopy 3D reconstruction using UAV aerial photogrammetry. Forests 2019, 10, 1052. [Google Scholar] [CrossRef] [Green Version]
- Zhang, Y.; Yang, W.; Zhang, W.; Yu, J.; Zhang, J.; Yang, Y.; Lu, Y.; Tang, W. Two-step ResUp&Down generative adversarial network to reconstruct multispectral image from aerial RGB image. Comput. Electron. Agric. 2022, 192, 106617. [Google Scholar]
- Zhang, Y.; Yang, W.; Sun, Y.; Chang, C.; Yu, J.; Zhang, W. Fusion of multispectral aerial imagery and vegetation indices for machine learning-based ground classification. Remote Sens. 2021, 13, 1411. [Google Scholar] [CrossRef]
- Zhang, W.; Gao, F.; Jiang, N.; Zhang, C.; Zhang, Y. High-Temporal-Resolution Forest Growth Monitoring Based on Segmented 3D Canopy Surface from UAV Aerial Photogrammetry. Drones 2022, 6, 158. [Google Scholar] [CrossRef]
- Sankey, T.; Donager, J.; McVay, J.; Sankey, J.B. UAV lidar and hyperspectral fusion for forest monitoring in the southwestern USA. Remote Sens. Environ. 2017, 195, 30–43. [Google Scholar] [CrossRef]
- Martinez, J.G.; Gheisari, M.; Alarcón, L.F. UAV integration in current construction safety planning and monitoring processes: Case study of a high-rise building construction project in Chile. J. Manag. Eng. 2020, 36, 05020005. [Google Scholar] [CrossRef]
- Zheng, H.; Cheng, T.; Zhou, M.; Li, D.; Yao, X.; Tian, Y.; Cao, W.; Zhu, Y. Improved estimation of rice aboveground biomass combining textural and spectral analysis of UAV imagery. Precis. Agric. 2019, 20, 611–629. [Google Scholar] [CrossRef]
- Guan, S.; Fukami, K.; Matsunaka, H.; Okami, M.; Tanaka, R.; Nakano, H.; Sakai, T.; Nakano, K.; Ohdan, H.; Takahashi, K. Assessing Correlation of High-Resolution NDVI with Fertilizer Application Level and Yield of Rice and Wheat Crops Using Small UAVs. Remote Sens. 2019, 11, 112. [Google Scholar] [CrossRef] [Green Version]
- Hildmann, H.; Kovacs, E. Using unmanned aerial vehicles (UAVs) as mobile sensing platforms (MSPs) for disaster response, civil security and public safety. Drones 2019, 3, 59. [Google Scholar] [CrossRef] [Green Version]
- James, M.R.; Robson, S.; d’Oleire-Oltmanns, S.; Niethammer, U. Optimising UAV topographic surveys processed with structure-from-motion: Ground control quality, quantity and bundle adjustment. Geomorphology 2017, 280, 51–66. [Google Scholar] [CrossRef] [Green Version]
- Bendig, J.; Bolten, A.; Bareth, G. 4 UAV-based Imaging for Multi-Temporal, very high Resolution Crop Surface Models to monitor Crop Growth Variability. Unmanned Aer. Veh. (UAVs) Multi-Temporal Crop Surf. Model. 2013, 44, 53–69. [Google Scholar]
- Yang, J.; Li, X.; Luo, L.; Zhao, L.; Wei, J.; Ma, T. New Supplementary Photography Methods after the Anomalous of Ground Control Points in UAV Structure-from-Motion Photogrammetry. Drones 2022, 6, 105. [Google Scholar] [CrossRef]
- Taddia, Y.; Stecchi, F.; Pellegrinelli, A. Coastal mapping using DJI Phantom 4 RTK in post-processing kinematic mode. Drones 2020, 4, 9. [Google Scholar] [CrossRef] [Green Version]
- Žabota, B.; Kobal, M. Accuracy assessment of uav-photogrammetric-derived products using PPK and GCPs in challenging terrains: In search of optimized rockfall mapping. Remote Sens. 2021, 13, 3812. [Google Scholar] [CrossRef]
- Hugenholtz, C.; Brown, O.; Walker, J.; Barchyn, T.; Nesbit, P.; Kucharczyk, M.; Myshak, S. Spatial accuracy of UAV-derived orthoimagery and topography: Comparing photogrammetric models processed with direct geo-referencing and ground control points. Geomatica 2016, 70, 21–30. [Google Scholar] [CrossRef]
- Fazeli, H.; Samadzadegan, F.; Dadrasjavan, F. Evaluating the Potential of RTK-UAV for Automatic Point Cloud Generation in 3D Rapid Mapping. Int. Arch. Photogramm. Remote Sens. Spat. Inf. Sci. 2016, 41, 221–226. [Google Scholar] [CrossRef] [Green Version]
- Štroner, M.; Urban, R.; Reindl, T.; Seidl, J.; Brouček, J. Evaluation of the georeferencing accuracy of a photogrammetric model using a quadrocopter with onboard GNSS RTK. Sensors 2020, 20, 2318. [Google Scholar] [CrossRef] [PubMed] [Green Version]
- Taddia, Y.; González-García, L.; Zambello, E.; Pellegrinelli, A. Quality assessment of photogrammetric models for façade and building reconstruction using DJI Phantom 4 RTK. Remote Sens. 2020, 12, 3144. [Google Scholar] [CrossRef]
- Teppati Losè, L.; Chiabrando, F.; Giulio Tonolo, F. Boosting the timeliness of UAV large scale mapping. Direct georeferencing approaches: Operational strategies and best practices. ISPRS Int. J. Geo-Inf. 2020, 9, 578. [Google Scholar] [CrossRef]
- James, M.R.; Robson, S. Mitigating systematic error in topographic models derived from UAV and ground—Based image networks. Earth Surf. Processes Landf. 2014, 39, 1413–1420. [Google Scholar] [CrossRef] [Green Version]
- Nikolakopoulos, K.G.; Kyriou, A.; Koukouvelas, I.K. Developing a Guideline of Unmanned Aerial Vehicle’s Acquisition Geometry for Landslide Mapping and Monitoring. Appl. Sci. 2022, 12, 4598. [Google Scholar] [CrossRef]
- Meinen, B.U.; Robinson, D.T. Mapping erosion and deposition in an agricultural landscape: Optimization of UAV image acquisition schemes for SfM-MVS. Remote Sens. Environ. 2020, 239, 111666. [Google Scholar] [CrossRef]
- Tonkin, T.N.; Midgley, N.G. Ground-control networks for image based surface reconstruction: An investigation of optimum survey designs using UAV derived imagery and structure-from-motion photogrammetry. Remote Sens. 2016, 8, 786. [Google Scholar] [CrossRef] [Green Version]
- Bolkas, D. Assessment of GCP number and separation distance for small UAS surveys with and without GNSS-PPK positioning. J. Surv. Eng. 2019, 145, 04019007. [Google Scholar] [CrossRef]
- Mesas-Carrascosa, F.J.; Rumbao, I.C.; Berrocal, J.A.B.; Porras, A.G.F. Positional quality assessment of orthophotos obtained from sensors onboard multi-rotor UAV platforms. Sensors 2014, 14, 22394–22407. [Google Scholar] [CrossRef]
- Ulvi, A. The effect of the distribution and numbers of ground control points on the precision of producing orthophoto maps with an unmanned aerial vehicle. J. Asian Archit. Build. Eng. 2021, 20, 806–817. [Google Scholar] [CrossRef]
- Liu, X.; Lian, X.; Yang, W.; Wang, F.; Han, Y.; Zhang, Y. Accuracy assessment of a UAV direct georeferencing method and impact of the configuration of ground control points. Drones 2022, 6, 30. [Google Scholar] [CrossRef]
- Sanz-Ablanedo, E.; Chandler, J.H.; Rodríguez-Pérez, J.R.; Ordóñez, C. Accuracy of unmanned aerial vehicle (UAV) and SfM photogrammetry survey as a function of the number and location of ground control points used. Remote Sens. 2018, 10, 1606. [Google Scholar] [CrossRef] [Green Version]
- Nagendran, S.K.; Tung, W.Y.; Ismail, M.A.M. Accuracy assessment on low altitude UAV-borne photogrammetry outputs influenced by ground control point at different altitude. In IOP Conference Series: Earth and Environmental Science, Proceedings of the 9th IGRSM International Conference and Exhibition on Geospatial & Remote Sensing (IGRSM 2018), Kuala Lumpur, Malaysia, 24–25 April 2018; IOP Publishing: Bristol, UK; Volume 169, p. 012031.
- Park, J.W.; Yeom, D.J. Method for establishing ground control points to realize UAV-based precision digital maps of earthwork sites. J. Asian Archit. Build. Eng. 2022, 21, 110–119. [Google Scholar] [CrossRef]
- Awasthi, B.; Karki, S.; Regmi, P.; Dhami, D.S.; Thapa, S.; Panday, U.S. Analyzing the Effect of Distribution Pattern and Number of GCPs on Overall Accuracy of UAV Photogrammetric Results. In Lecture Notes in Civil Engineering, Proceedings of the International Conference on Unmanned Aerial System in Geomatics, Roorkee, India, 6–7 Apil 2019; Jain, K., Khoshelham, K., Zhu, X., Tiwari, A., Eds.; Springer: Cham, Switzerland; pp. 339–354.
- Mirko, S.; Eufemia, T.; Alessandro, R.; Giuseppe, F.; Umberto, F. Assessing the Impact of the Number of GCPS on the Accuracy of Photogrammetric Mapping from UAV Imagery. Balt. Surv. 2019, 10, 43–51. [Google Scholar]
- Cabo, C.; Sanz-Ablanedo, E.; Roca-Pardiñas, J.; Ordóñez, C. Influence of the number and spatial distribution of ground control points in the accuracy of uav-sfm dems: An approach based on generalized additive models. IEEE Trans. Geosci. Remote Sens. 2021, 59, 10618–10627. [Google Scholar] [CrossRef]
- Villanueva, J.K.S.; Blanco, A.C. Optimization of ground control point (GCP) configuration for unmanned aerial vehicle (UAV) survey using structure from motion (SFM). Int. Arch. Photogramm. Remote Sens. Spat. Inf. Sci. 2019, 42, 167–174. [Google Scholar] [CrossRef] [Green Version]
- Geographical Survey Institute. Manual of Public Surveying with UAV; Ministry of Land, Infrastructure, Transport and Tourism of Japan: Tokyo, Japan, 2017; pp. 23–24.
- Gindraux, S.; Boesch, R.; Farinotti, D. Accuracy assessment of digital surface models from unmanned aerial vehicles’ imagery on glaciers. Remote Sens. 2017, 9, 186. [Google Scholar] [CrossRef] [Green Version]
- Yang, H.; Li, H.; Gong, Z.; Dai, W.; Lu, S. Relations between the Number of GCPs and Accuracy of UAV Photogrammetry in the Foreshore of the Sandy Beach. J. Coast. Res. 2020, 95, 1372–1376. [Google Scholar] [CrossRef]
Publisher’s Note: MDPI stays neutral with regard to jurisdictional claims in published maps and institutional affiliations. |
© 2022 by the authors. Licensee MDPI, Basel, Switzerland. This article is an open access article distributed under the terms and conditions of the Creative Commons Attribution (CC BY) license (https://creativecommons.org/licenses/by/4.0/).