Article

Characteristics of Soil Temperature, Humidity, and Salinity on Bird Island within Qinghai Lake Basin, China

1
College of Geographical Science, Qinghai Normal University, Xining 810008, China
2
Key Laboratory of Qinghai Province Physical Geography and Environmental Process, MOE Key Laboratory of Tibetan Plateau Land Surface Processes and Ecological Conservation, Xining 810008, China
3
Academy of Plateau Science and Sustainability, Qinghai Normal University, Xining 810008, China
4
Faculty of Geographical Science, Beijing Normal University, Beijing 100875, China
5
Institute of Urban and Regional Development, Taiyuan Normal University, Jinzhong 030619, China
*
Author to whom correspondence should be addressed.
Sustainability 2022, 14(15), 9449; https://doi.org/10.3390/su14159449
Submission received: 5 May 2022 / Revised: 21 July 2022 / Accepted: 25 July 2022 / Published: 2 August 2022
(This article belongs to the Topic Climate Change and Environmental Sustainability)

Abstract

:
The temperature, moisture, and salt content of soil in alpine regions are sensitive to changes in climatic factors and are important indicators of ecosystem functions. In this study, we collected soil moisture, temperature and electrical conductivity data at different depths at a sampling site on Bird Island in Qinghai Lake during winter using a continuous soil temperature, moisture and salt content monitoring system and analyzed their variations and influential factors. The variation in soil moisture showed an obvious ‘V-shaped’ pattern from 00:00 to 23:00 and an upward trend with soil layer depth. From 00:00 to 23:00, the overall soil temperature data fitted a ‘unimodal’ curve and showed a clear and continuous upward trend with soil layer depth at a rate of 0.684 (p < 0.001). Soil electrical conductivity data also exhibited a distinct ‘V-shaped’ pattern from 00:00 to 23:00 and a continuous increase with increasing soil depth. The correlation between soil temperature, moisture, and conductivity and the spatial distribution of five climate factors indicated that climate factors accounted for 53.6% of the changes in soil temperature, moisture, and salinity. Climate factors showed a significant positive correlation with soil temperature, moisture, and conductivity (p < 0.001), and air temperature was the most important factor influencing soil temperature and soil moisture changes, whereas wind direction was the most important factor influencing soil conductivity. (Wind direction and wind speed affect soil evapotranspiration, and then affect soil moisture and solute transport process). The results of this preliminary study reveal the characteristics associated with soil temperature, moisture, and salinity changes in winter within the wetlands of Bird Island on Qinghai Lake in the context of climate change, and they can be used as valuable reference data in further studies investigating associated changes in ecosystem functions.

1. Introduction

Global climate change is significantly impacting the structure, function, and pro-cesses of global ecosystems, and it has become a major concern for the scientific com-munity, the public, and governments globally [1]. Soil temperature and moisture condi-tions affect exchanges of water, heat, and carbon between the land and air and regulate the distribution of sensible and latent heat; as such, they have important roles in atmospheric and ecological processes. They are also important variables in water and energy exchanges during land surface processes, and they are analyzed for use in vegetation growth monitoring and drought prediction [2,3,4]. The soil water reservoir is contributed to by surface water, groundwater and the biogeochemical cycle, and it is central to the transformation of the “four waters” (Atmospheric water, surface water, soil water and shallow groundwater) and the material cycle [5]. In arid zones, the soil water content is an important ecological factor limiting plant growth and development, and it affects the growth and development of plant communities and their productivity [6] and directly determines the growth of vegetation. The amount of water stored in soil is susceptible to constant spatial and temporal changes, and the soil layers containing concentrated soil water are usually infiltrated by a dense distribution of plant roots [7,8].
Temperature is one of the most important factors [9] affecting soil moisture. Soil temperature, which is also referred to as ‘ground temperature’, is measured in the shallow subsurface layer. It is directly related to the growth and development of vegetation and influences plant growth, development, and soil formation [10]. Various biochemical processes in the soil, such as those relating to microbial activities and abiotic chemical processes, are influenced by the soil temperature. The soil liquid water content in winter, which is also referred to as the ‘unfrozen water content of soil’, remains unfrozen at temperatures below 0 °C due to capillary action and adsorption on the surface of soil particles.
Hydrothermal transport during the soil freeze-thaw processes is an important component [11] of the natural water cycle. The laboratory of permafrost mechanics in the former Soviet Union determined three water phase change regions that occurred in un-frozen water with a temperature decrease of 1 °C: an intense phase change zone (water phase change amount of > 1%), a transition zone (0.1% < water phase change amount < 1%) and a frozen zone (water phase change amount < 0.1%) according to the amount of water phase change [12,13]. Burt and Williams [14] concluded that unfrozen water undergoes dynamic changes. When the temperature drops, the permeability of the frozen soil medium and the unfrozen water content decrease due to the freezing of capillary water and the thinning of the membranous water around the soil particles. Various studies have been conducted to determine soil changes associated with climate. For example, Xu [15,16,17] has been conducting detailed studies on the factors influencing the unfrozen water content since 1982, and has proposed a simple model for predicting the unfrozen water content. Zhang et al. [18] investigated the effect of different salinities and various types of salts on the unfrozen water content, and Yang et al. [19] analyzed the soil temperature change characteristics with time at different locations and depths in the northern Tibetan plateau. Furthermore, Shang et al. [20] improved a numerical model for coupled soil hydrothermal transport under freezing conditions to provide a platform for simulating the soil freezing process under various conditions.
Under the climate warming scenario, permafrost degradation begins with the in-creases in temperature and unfrozen water content. As the Bird Island wetlands of international importance shows, the response of permafrost temperature and moisture to climate change is a good indicator of climate change. Past studies have suggested that the hydrological process is a key driving process in the process of permafrost degradation in mountainous regions, the thermal mechanism of permafrost is mainly influenced by snow cover, ice, and water in the soil [21]. Therefore, it is of great significance to study the degradation process of the wetland permafrost by studying soil temperature, moisture and salt in winter in Bird Island. However, the corresponding study based on in-situ observation is still very scarce.
The Bird Island wetlands of international importance is a unique lakeside wetland on the Tibetan Plateau. It is a unique ecosystem and an ideal place to study soil temperature, humidity and electrical conductivity. Because of the influence of natural geographical environment, the research on soil temperature, moisture and electrical conductivity of wetland is less. As a typical region of the Tibetan plateau, the changes of soil hydrothermal transport in Bird Island affect the energy balance and soil freeze-thaw cycle [22,23]. In the past 50 years, climate change on the Tibetan Plateau has been characterized by warming and wetting, indirectly affecting the groundwater level [24], and also affects the changes of soil temperature, moisture, and electrical conductivity. The purpose of this article: The Bird Island sampling site within Qinghai Lake is an important and globally renowned wetland, and it was selected to monitor the soil moisture content, temperature and conductivity and associated variabilities at different depths during winter using a continuous soil temperature, humidity and salt monitoring system. The characteristics and influencing factors of soil moisture and temperature in winter were analyzed at temporal scale (day and night) and spatial scale (different soil depths). We analyzed the patterns of variations of soil moisture, temperature and electrical conductivity at the Bird Island sampling site during winter to understand changes in the soil water content within the Bird Island wetlands in relation to the climate transitioning from warm and dry to warm and humid conditions. The results are helpful to understand the energy exchange among vegetation, soil and atmosphere in future climate scenarios, and to understand the habitat status of wetland ecosystem. At the same time, it provides the reference basis for protecting and restoring the alpine meadow ecosystem of the Tibetan Plateau.

2. Methodology

2.1. Overview of the Study Area

Bird Island is an important and internationally renowned wetland that is home to hundreds of thousands of birds (Figure 1). It is located in the northwest corner of Qinghai Lake at 36°57′–37°04′ N, 99°44′–99°54′ E and at an elevation of 3194–3226 m above sea level [25]. The terrain is dominated by lakeside wetlands with a high elevation in the northwest and a low elevation in the southeast [26]. The total area of Bird Island is 522.18 km2, including 0.47 km2 of ecological compensation land, 38.11 km2 of waterbird habitat, 2.27 km2 of river wetland, 6.99 km2 of sandy land, 130.43 km2 of winter grassland, and 343.91 km2 of water body. Bird Island is situated at the intersection between the eastern monsoon region and the north-western arid region of China, which is arid and windy with little rain, strong solar radiation and large daily temperature variations. It lies within a highland semi-arid alpine climate zone and has an annual average temperature of −0.7 °C and an annual average precipitation of 322.7 mm [27]. The main vegetation is mountain meadow. The main consisting of Astragalus adsurgens Pall., Allium przewalskianum, Leymus secalinus, Polygonum sibiricum Laxm., Poa annua L., Carex rigescens. The thin soil layer is formed by the differentiation of Triassic or Permian gneiss, and the soil type is dry and moist sandy new soil; the soil layer is thin and the gravel content is high [28].

2.2. Field Observation Instrument Deployment

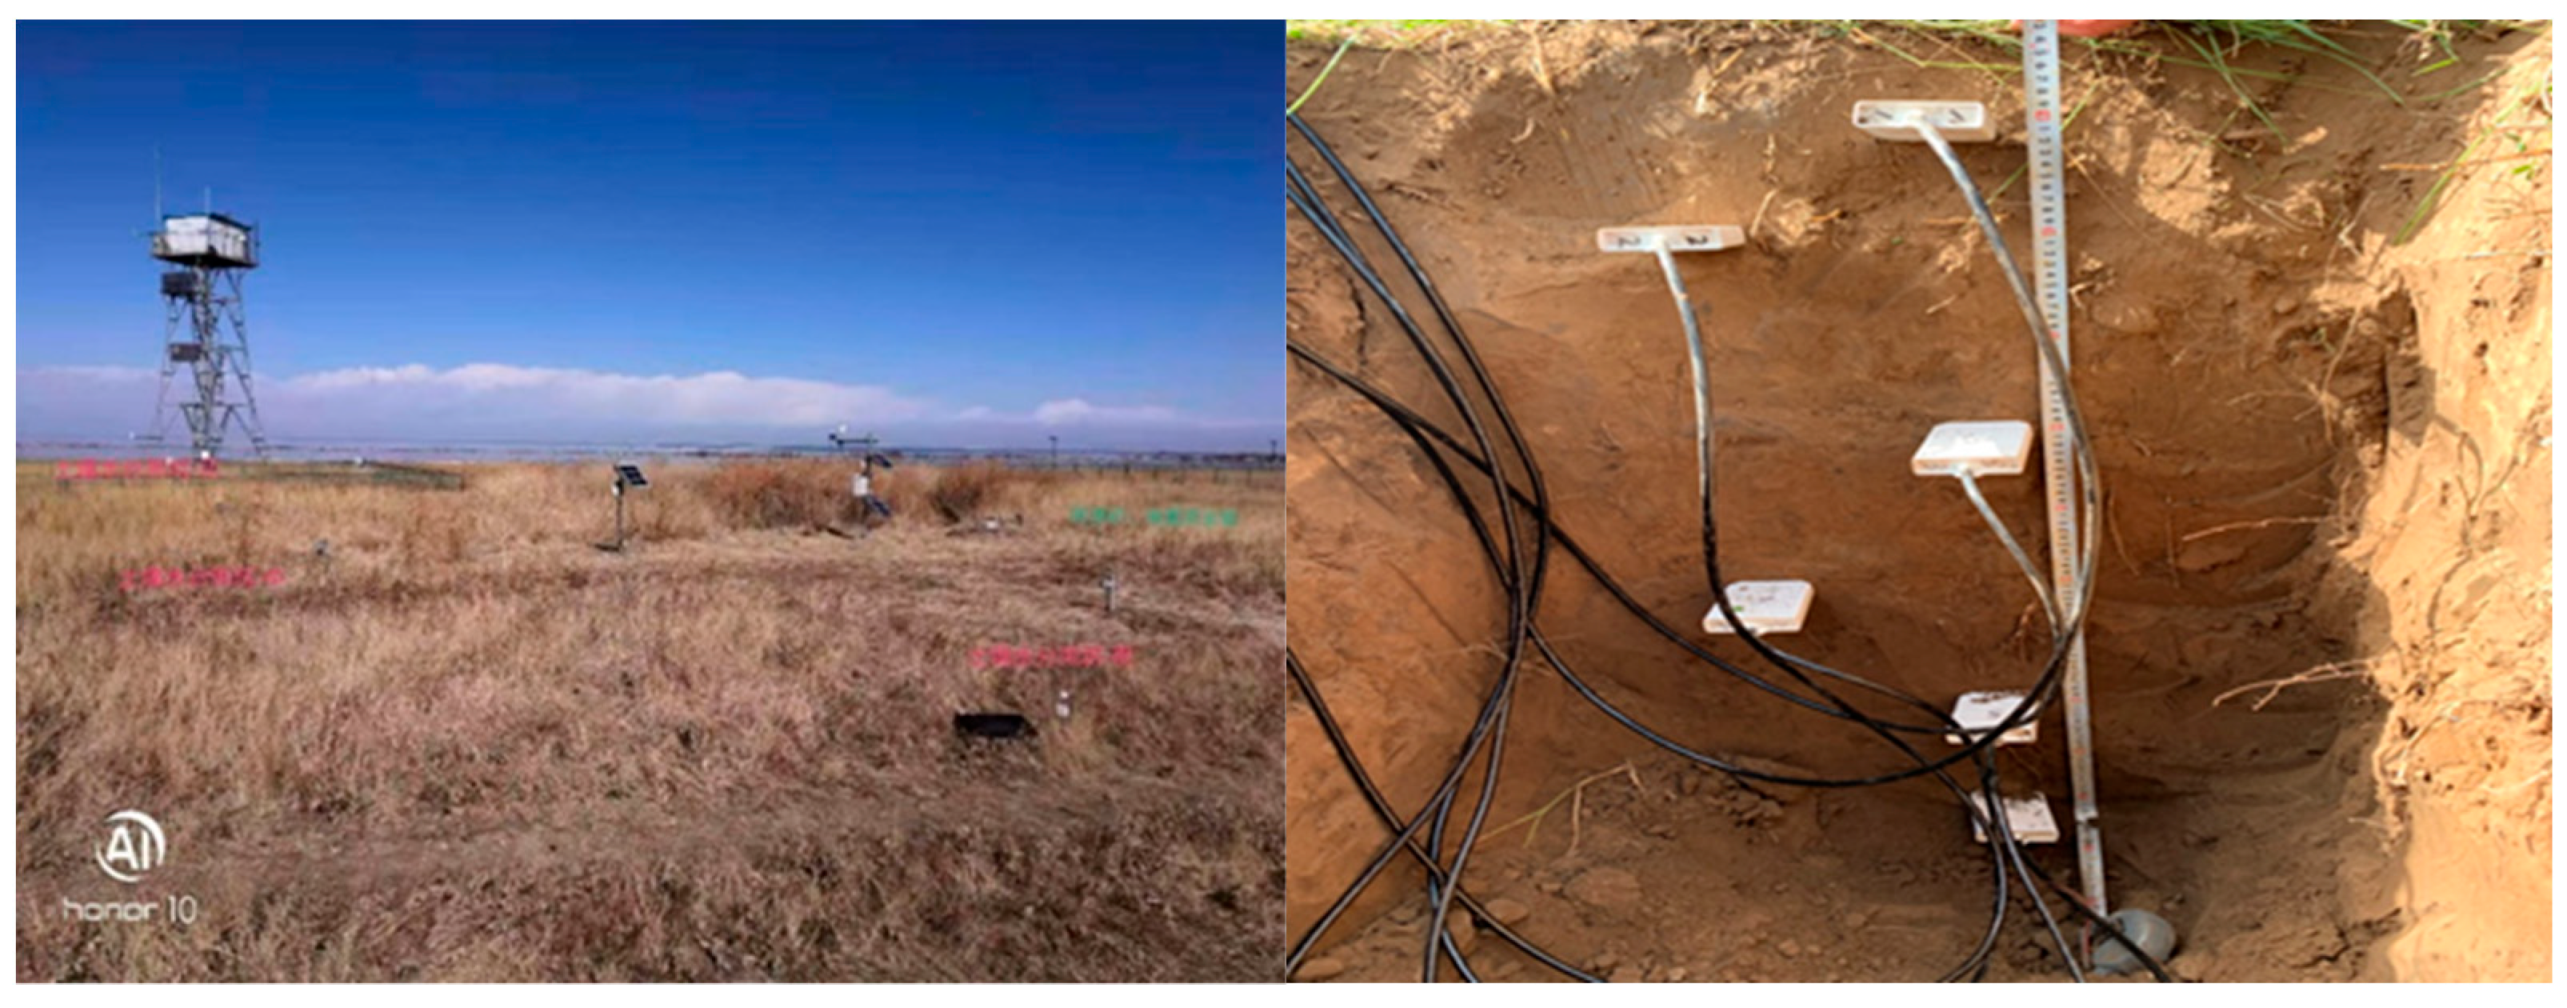
The data used to study variations in the soil moisture content, temperature and conductivity during winter on Bird Island were acquired at the Bird Island sampling site of the National Positioning Observation and Research Station of Qinghai Lake Wetland Ecosystem. We used a continuous soil temperature, humidity, and salinity monitoring system manufactured by Campbell Scientific (Beijing, China), Inc., that consists of 18 CS655 multi-parameter sensors and a DL3000 data collector. The 18 sensors were distributed in three soil pits, with one CS655 sensor installed in each pit at soil depths of 10 cm, 20 cm, 40 cm, 60 cm, 80 cm, and 100 cm, respectively. The three measurement pits were located in the southern, central and northern parts of the test site, and they are labelled pits 1, 2 and 3, respectively, in Figure 2. The DL3000 collector recorded data of soil temperature (°C), the soil volumetric moisture content (m3/m3) and the soil dielectric constant (dS/m) every 30 min and daily data every 24 h.
Main Sensing Volume parameters were measured within a range of approximately 3600 cm3 (7.5 cm radius for the probe tips and 4.5 cm radius for the probe). Soil moisture was measured from 5% to 50% with an accuracy of ±3% (EC ≤ 8 dS/m), Soil Measurement Range from −10 to 70 °C with an accuracy of ±0.5 °C and the conductivities of solutions and soil were measured in a range from 0 to 3 dS/m and 0–0.8 dS/m, respectively, with an accuracy of ±5% or 0.05 dS/m.
Soil evapotranspiration data on Bird island were obtained from the Bird Island sampling plots established in the National Positioning Observation and Research Station of Qinghai Lake Wetland Ecosystem, in Figure 3. The measuring instrument used was an in-situ continuous micro-lysimeter system manufactured by the Campbell Scientific (Beijing, China) Co. The main component was a DL3000 instrument with a working principle as follows: leaked water and rainwater entered the micro-pumping system through the connection pipes at the bottom and was automatically discharged at the surface. The soil columns employed had a height and diameter of 100 cm and 50 cm, respectively, an evaporation area of 0.2 m2, and an evaporation resolution of 0.01 mm. The weighing range was 0–400 kg, and the tipping bucket lysimeter was 4 g. The initial value of evapotranspiration (g) was recorded every 30 min.
Data of wind speed, wind direction, air temperature and relative humidity were also obtained on Bird island were obtained from the Bird Island sampling plots established in the National Positioning Observation and Research Station of Qinghai Lake Wetland Ecosystem, in Figure 3. At the sampling plots using an integrated continuous observation meteorological station manufactured by the Campbell Scientific (Beijing, China) Co. Data of wind speed (m/s), wind direction (°), air temperature (°C) and relative air humidity (%) were recorded every 30 min.

2.3. Description of Measurement Method

For the water content measurement, a differential emitter-coupled logic (ECL) oscillator on the circuit board is connected to the two parallel stainless steel rods. The differentially driven rods form an open-ended transmission line in which the wave propagation velocity is dependent upon the dielectric permittivity of the media surrounding the rods. An ECL oscillator state change is triggered by the return of a reflected signal from the end of one of the rods.
The fundamental principle for CS655 water content measurement is that the velocity of electromagnetic wave propagation along the probe rods is dependent on the dielectric permittivity of the material surrounding the rods. As water content increases, the propagation velocity decreases due to increasing dielectric permittivity. The two-way travel time of the rod signal is dependent upon water content, and hence named as water content reflectometer. Digital circuitry scales the high-speed oscillator output to an appropriate frequency for measurement by an onboard microprocessor. Increases in oscillation period resulting from signal attenuation are corrected using an electrical conductivity measurement. A calibration equation converts period and electrical conductivity to bulk dielectric permittivity. The following Equation (1) is used to convert the dielectric permittivity to volumetric water content. The relationship between dielectric permittivity and volumetric water content in mineral soils has been described by Topp et al. (1980) [29] in an empirical fashion; they used a 3rd degree polynomial.
θ v = 5.3 × 10 2 + 2.92 × 10 2 K a 5.5 × 10 4 K a 2 + 4.3 × 10 6 K a 3
where, θv is the volumetric water content and Ka is the bulk dielectric permittivity of the soil.

2.4. Observation Period

Lakes on the Qinghai-Tibet Plateau generally begin to freeze from early November to mid-December, and they do not completely thaw until mid-April to early June. They have an average freeze period of 175 days and an average complete freeze period of 130 days. The northern part of the lake starts to freeze early and defrosts late; it thus has a long freeze period [30]. According to a report from the Qinghai Provincial Meteorological Bureau issued on 22 January 2020, the water surface close to the shore in Qinghai Lake began to sporadically freeze after 19 November in 2019, which indicated that it was entering a freezing period [31]. The observational data used in this study were thus obtained from 0:00 on 19 November 2020 to 23:30 on 10 April 2021, based on Beijing time, and the data were retrieved from the continuous soil temperature, humidity, and salinity monitoring system, the in situ micro-lysimeter observation system and the integrated weather observation station at the Bird Island sampling site.

2.5. Data Processing and Statistical Analysis

The soil temperature, moisture and electrical conductivity data used in this study are from 19 November 2020 to 10 April 2021. Firstly, the average values of soil temperature, moisture and electrical conductivity in each layer (10 cm, 20 cm, 40 cm, 60 cm, 80 cm and 100 cm) of the three measurement pits were calculated as the soil depth, the average value of 0:00–23:30 data of each layer in the re-survey pit is taken as daily scale data, and the average value of the whole point and the next half point data is taken as hourly data. In this study, the changes of soil temperature, moisture and electrical conductivity were analysed by means of comparative analysis and linear trend analysis [32,33], all data were calculated and plotted by Microsoft office Excel (Microsoft, Beijing, China).
The evapotranspiration (ET), wind speed, wind direction, air temperature, and air relative humidity data used in this paper are from 19 November 2020 to 10 April 2021, the average values of wind speed, wind direction, air temperature, and air relative humidity from 0:00 to 23:30 were taken as daily scale data. ET—the change of stored water volume in the lysimeter can be calculated from lysimeter weight change for the selected time period (in our case 30 min), through the following Formula (2):
E T m m = L m n k g L m n 30 k g 14.15

2.6. Analysis of Factors Influencing Soil Temperature, Moisture, and Conductivity

Five climate factor variables (evapotranspiration, air temperature, relative humidity, wind speed and wind direction) were selected as potential drivers of changes in soil temperature, moisture and conductivity. The correlations between soil temperature, moisture and conductivity and the spatial distribution of climate factors were analyzed by conducting a redundancy analysis (RDA) [34], which is a canonical method that performs regression analysis on several predictors (i.e., drivers) and responses (i.e., the soil temperature, moisture, and conductivity). The redundancy analysis was conducted with CANOCO5 (Microcomputer Power Ithaca, New York, NY, USA) [35].

3. Results and Analysis

3.1. Variations in Soil Moisture and Associated Patterns

3.1.1. Temporal Variations in Soil Moisture and Associated Patterns

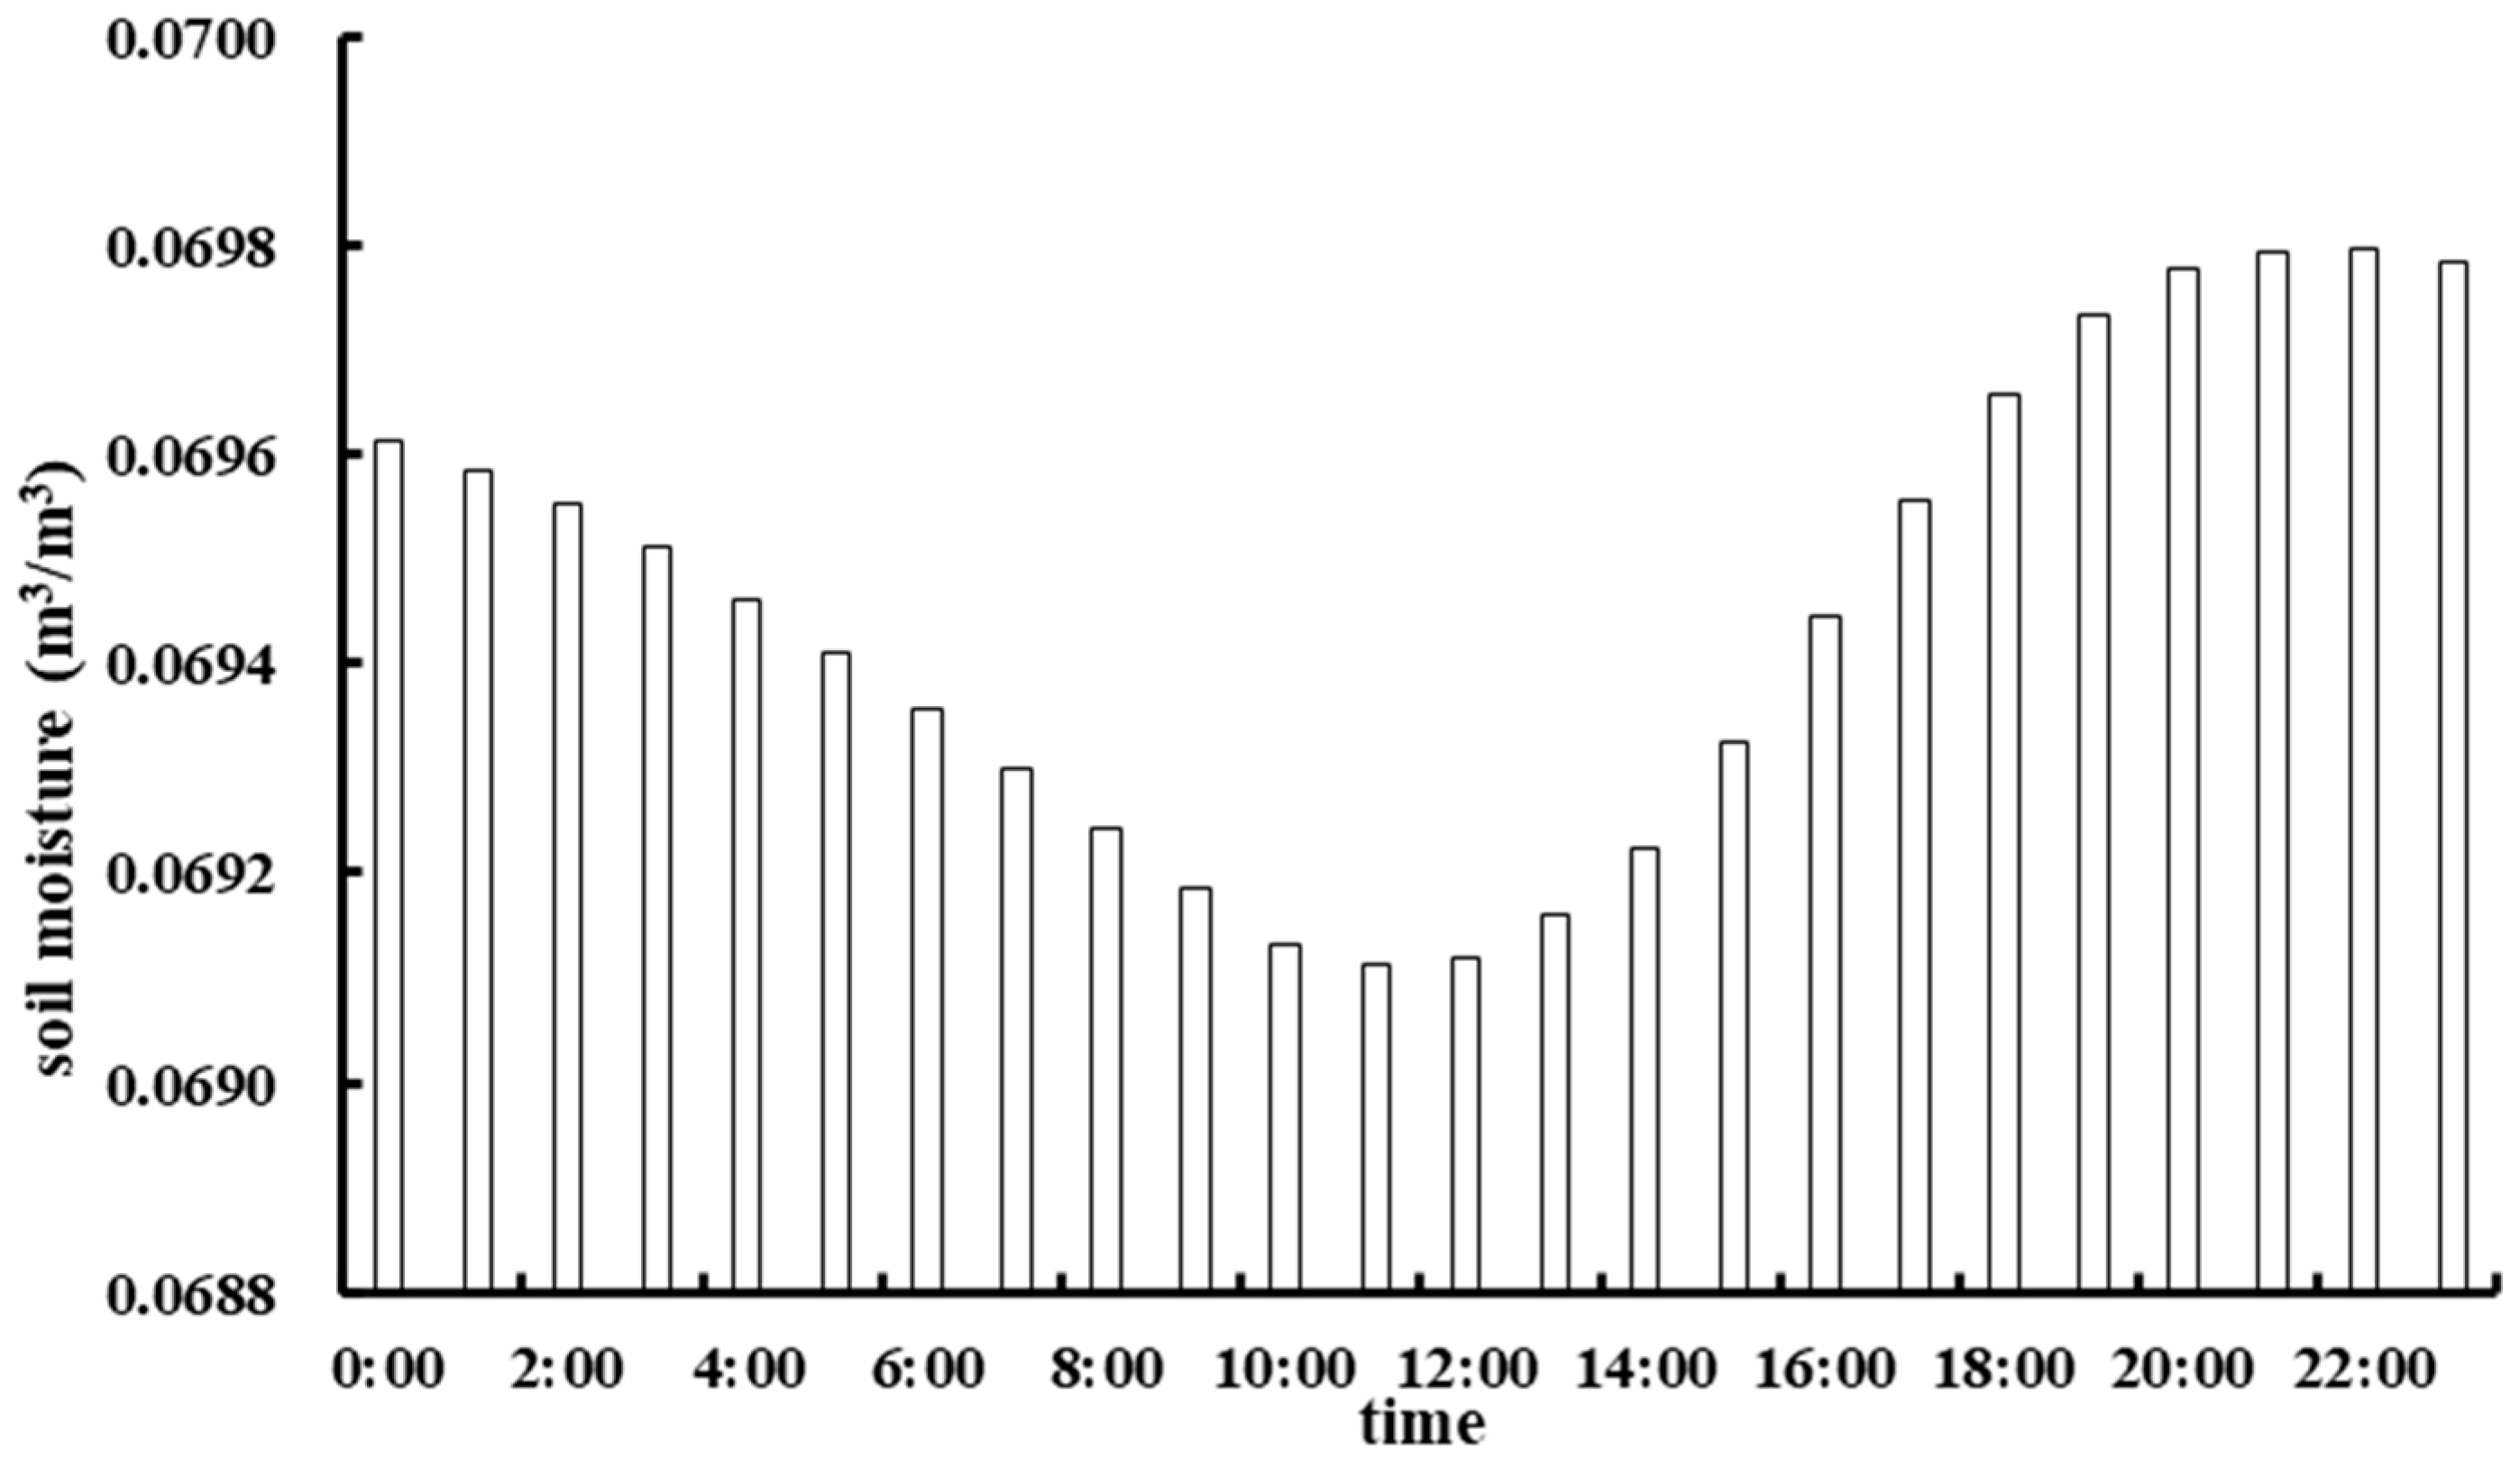
An analysis of the soil moisture variation pattern at different times (Figure 4) showed a clear ‘V-shaped’ variation pattern from 00:00 to 23:00, with a decreasing trend from 22:00 to 11:00 and then dropping to a minimum value of 0.069112 m3/m3 at 11:00. An increasing trend was seen from 11:00 to 22:00, rising to a maximum value of 0.069795 m3/m3 at 22:00.

3.1.2. Temporal Variations in Soil Moisture at Different Depths and Associated Patterns

An analysis of soil moisture temporal variations at different depths (Figure 5) indicated similar variations at depths of 10 cm and 20 cm as the data both showed obvious undulating characteristics; however, there were certain differences between the patterns. The maximum and minimum soil moisture values at 10 cm occurred at 20:00 and 11:00, respectively, while those at 20 cm occurred at 23:00 and 13:00, respectively. The undulating soil moisture pattern at a depth of 40 cm was also relatively noticeable, with maximum and minimum values occurring at 08:00 and 21:00, respectively. The soil moisture variation patterns at depths of 60 cm, 80 cm and 100 cm showed both similarities and differences. The soil moisture at all these depths showed an undulating upward trend from 00:00 to 23:00, but they differed in that the uptrend was the strongest at 100 cm, followed by at 60 cm and then 80 cm. Soil moisture at 100 cm showed a continuous upward trend from 00:00 to 23:00, that at 60 cm showed a continuous rising trend from 00:00 to 15:00, with minor changes from 15:00 to 23:00, and that at 80 cm exhibited an undulating upward trend from 00:00 to 23:00.

3.1.3. Variations in Soil Moisture at Different Depths and Associated Patterns

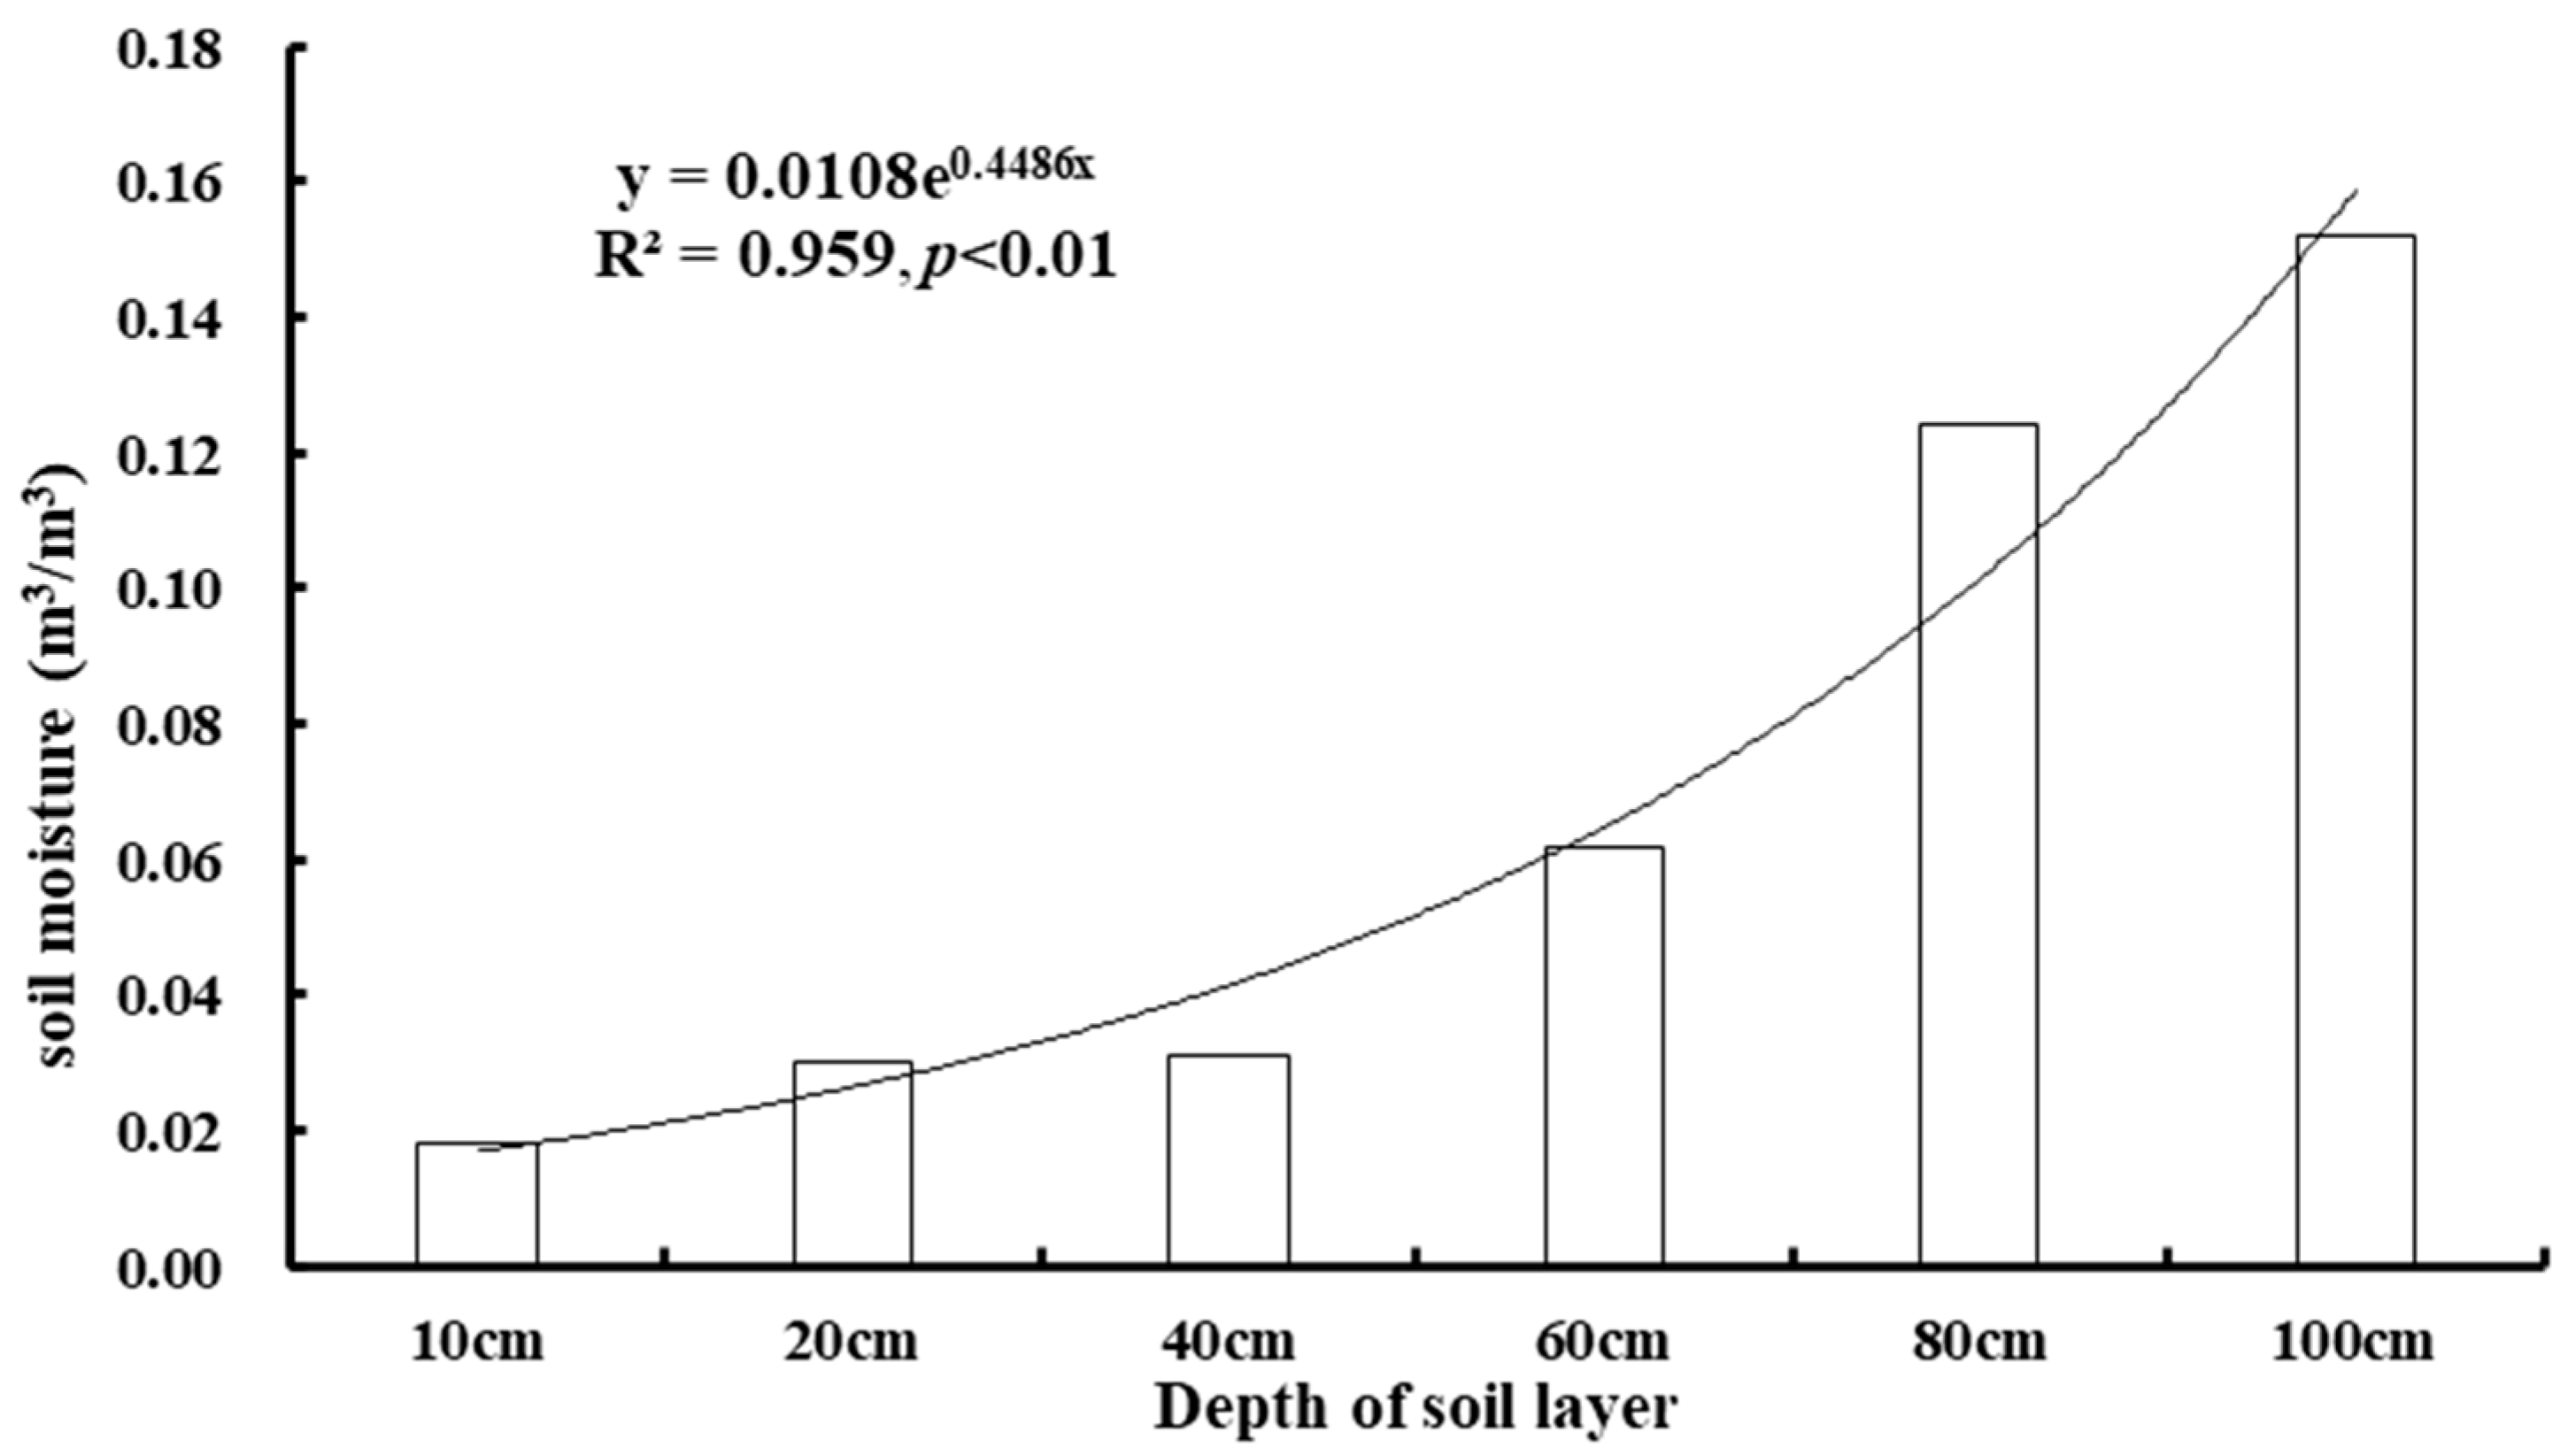
The analysis of the variations in soil moisture and associated patterns in different soil layer depths (Figure 6) revealed that soil moisture increased (From the surface layer to the deep layer of the soil showed an increasing trend) significantly and continuously with depth. The maximum and minimum soil moisture values were 0.0178 m3/m3 and 0.152 m3/m3 at 10 cm and 100 cm, respectively.

3.2. Variations in Soil Temperature and Associated Patterns

3.2.1. Temporal Variations in Soil Temperature and Associated Patterns

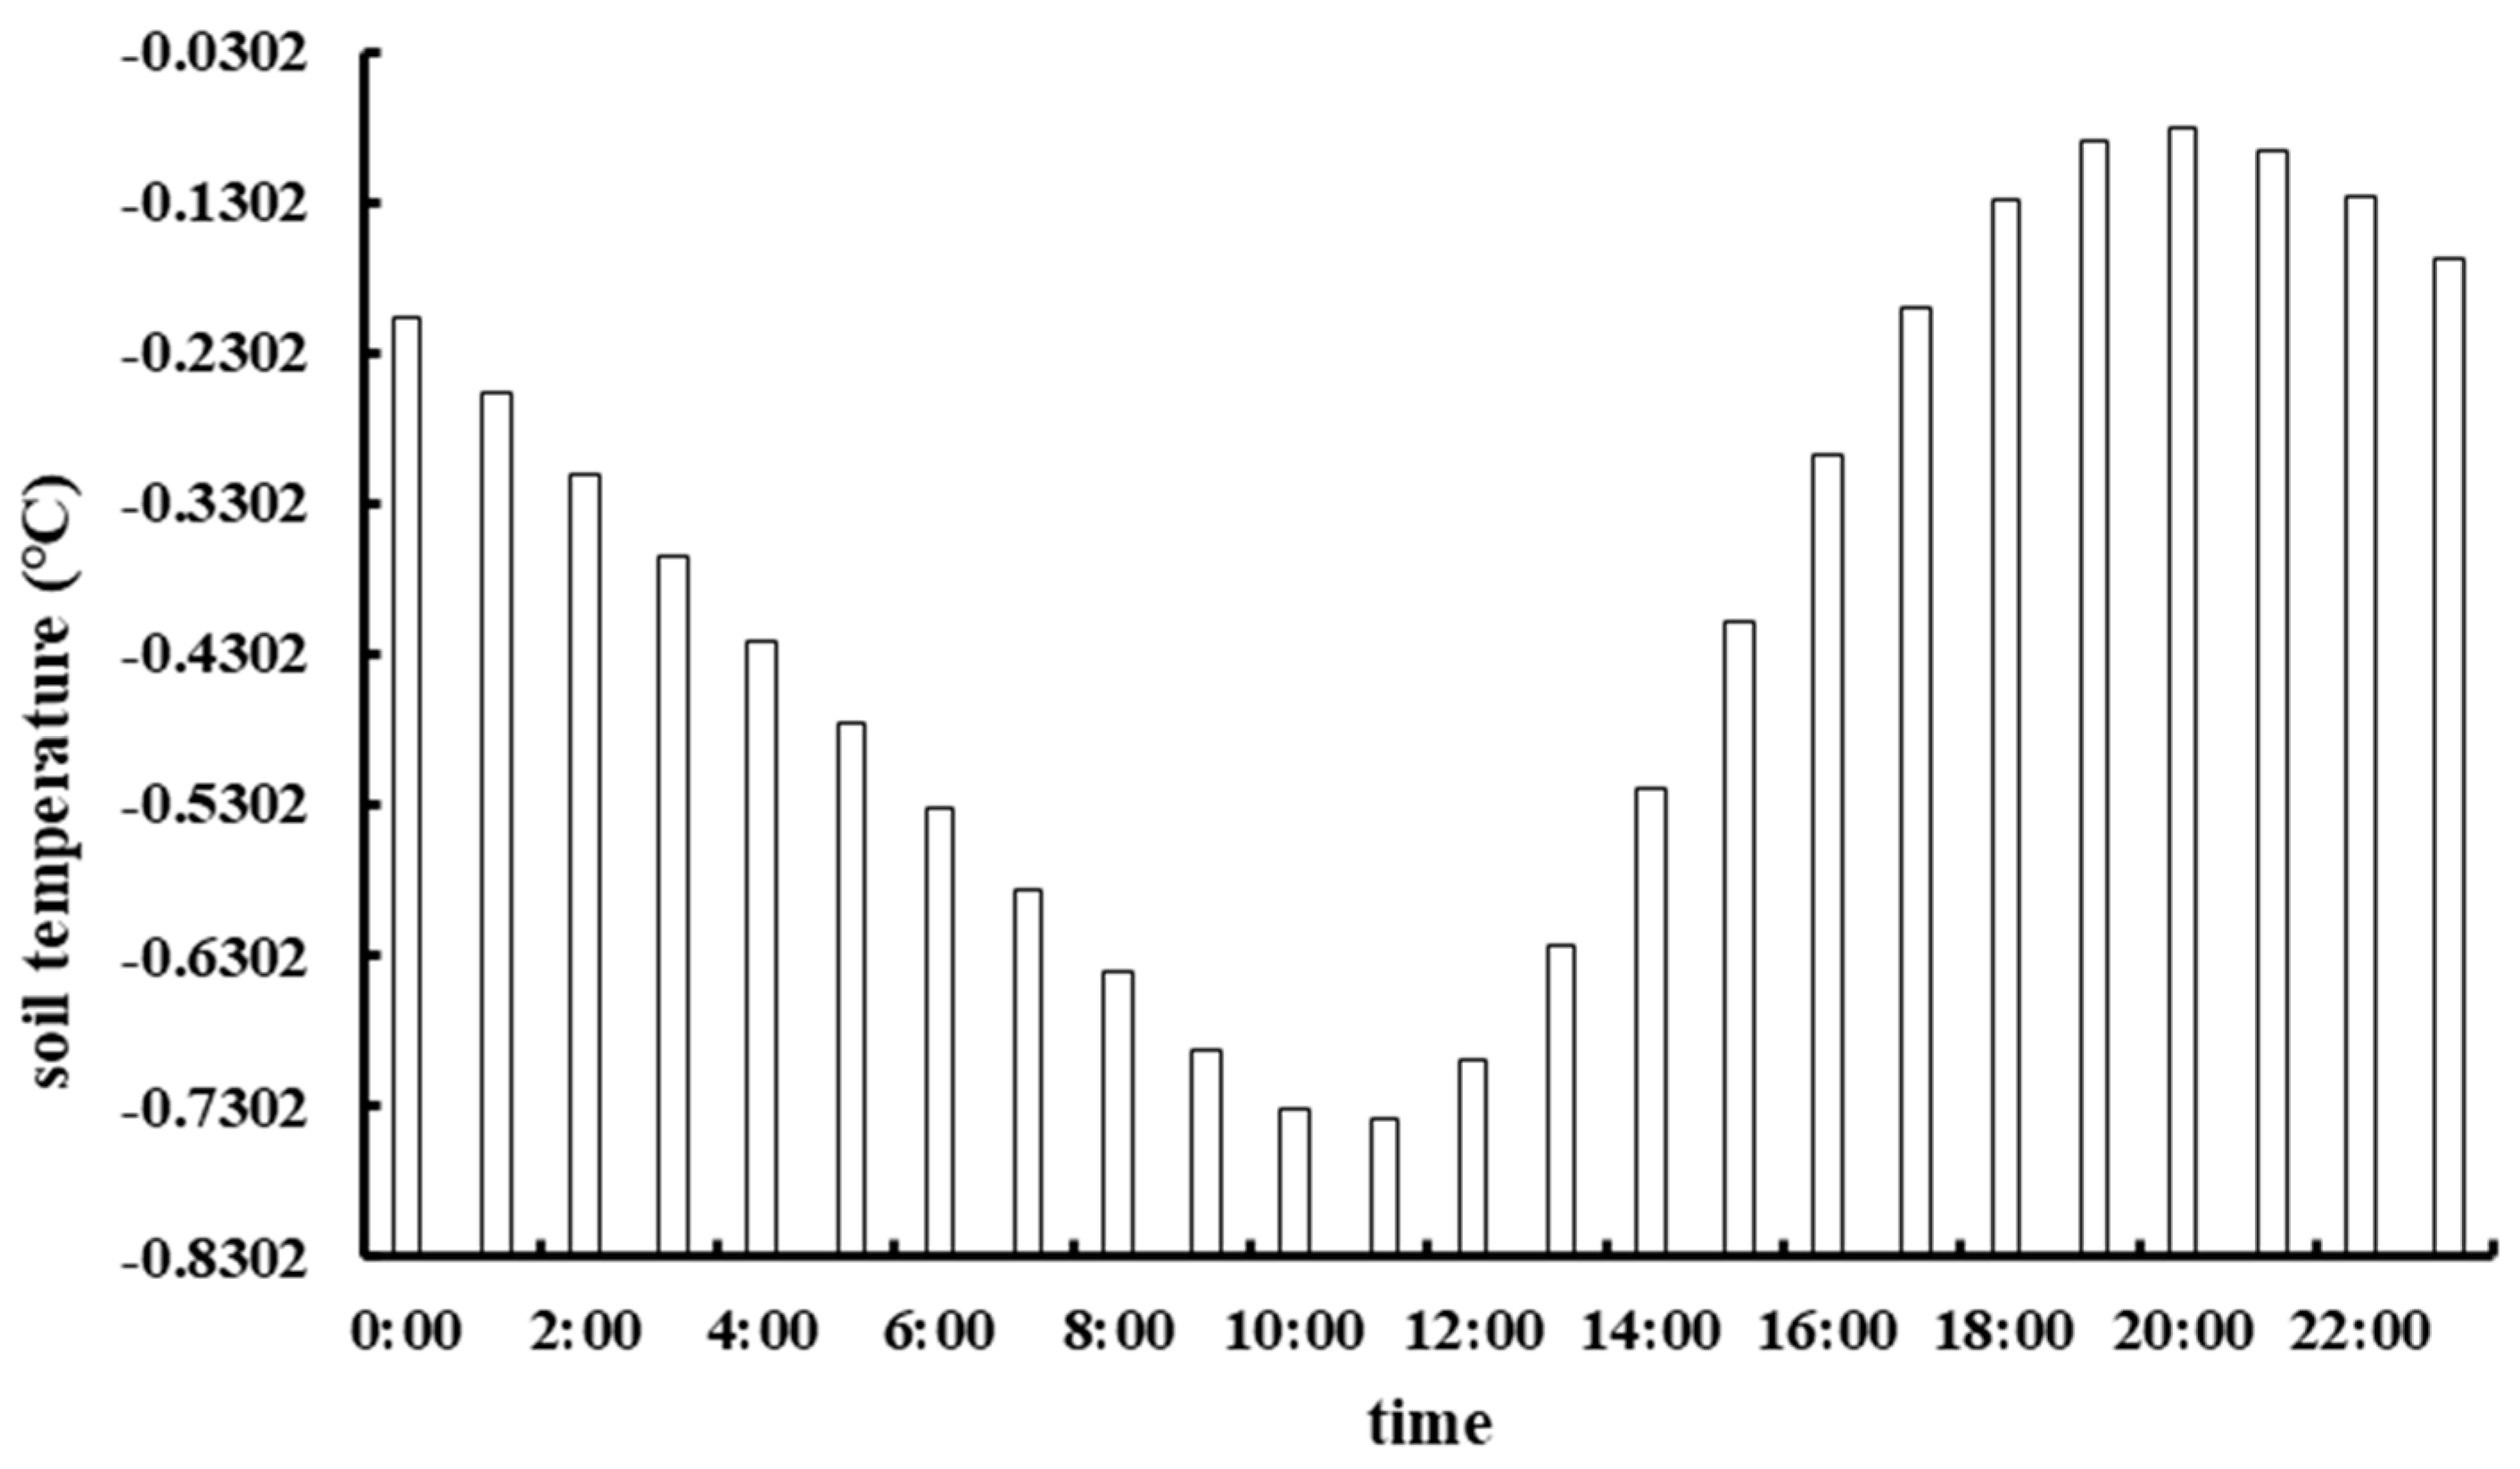
The analysis of the trends of temporal variations in soil temperature (Figure 7) revelated a unimodal soil temperature pattern from 00:00 to 23:00 [30] that was similar to the soil temperature variation trend in the Qilian Mountains. A downward trend occurred from 20:00 to 11:00, reaching a minimum value of −0.738 °C at 11:00, while an upward trend occurred from 11:00 to 20:00, reaching a maximum value of −0.081 °C.

3.2.2. Temporal Variations in Soil Temperature at Different Depths and Associated Patterns

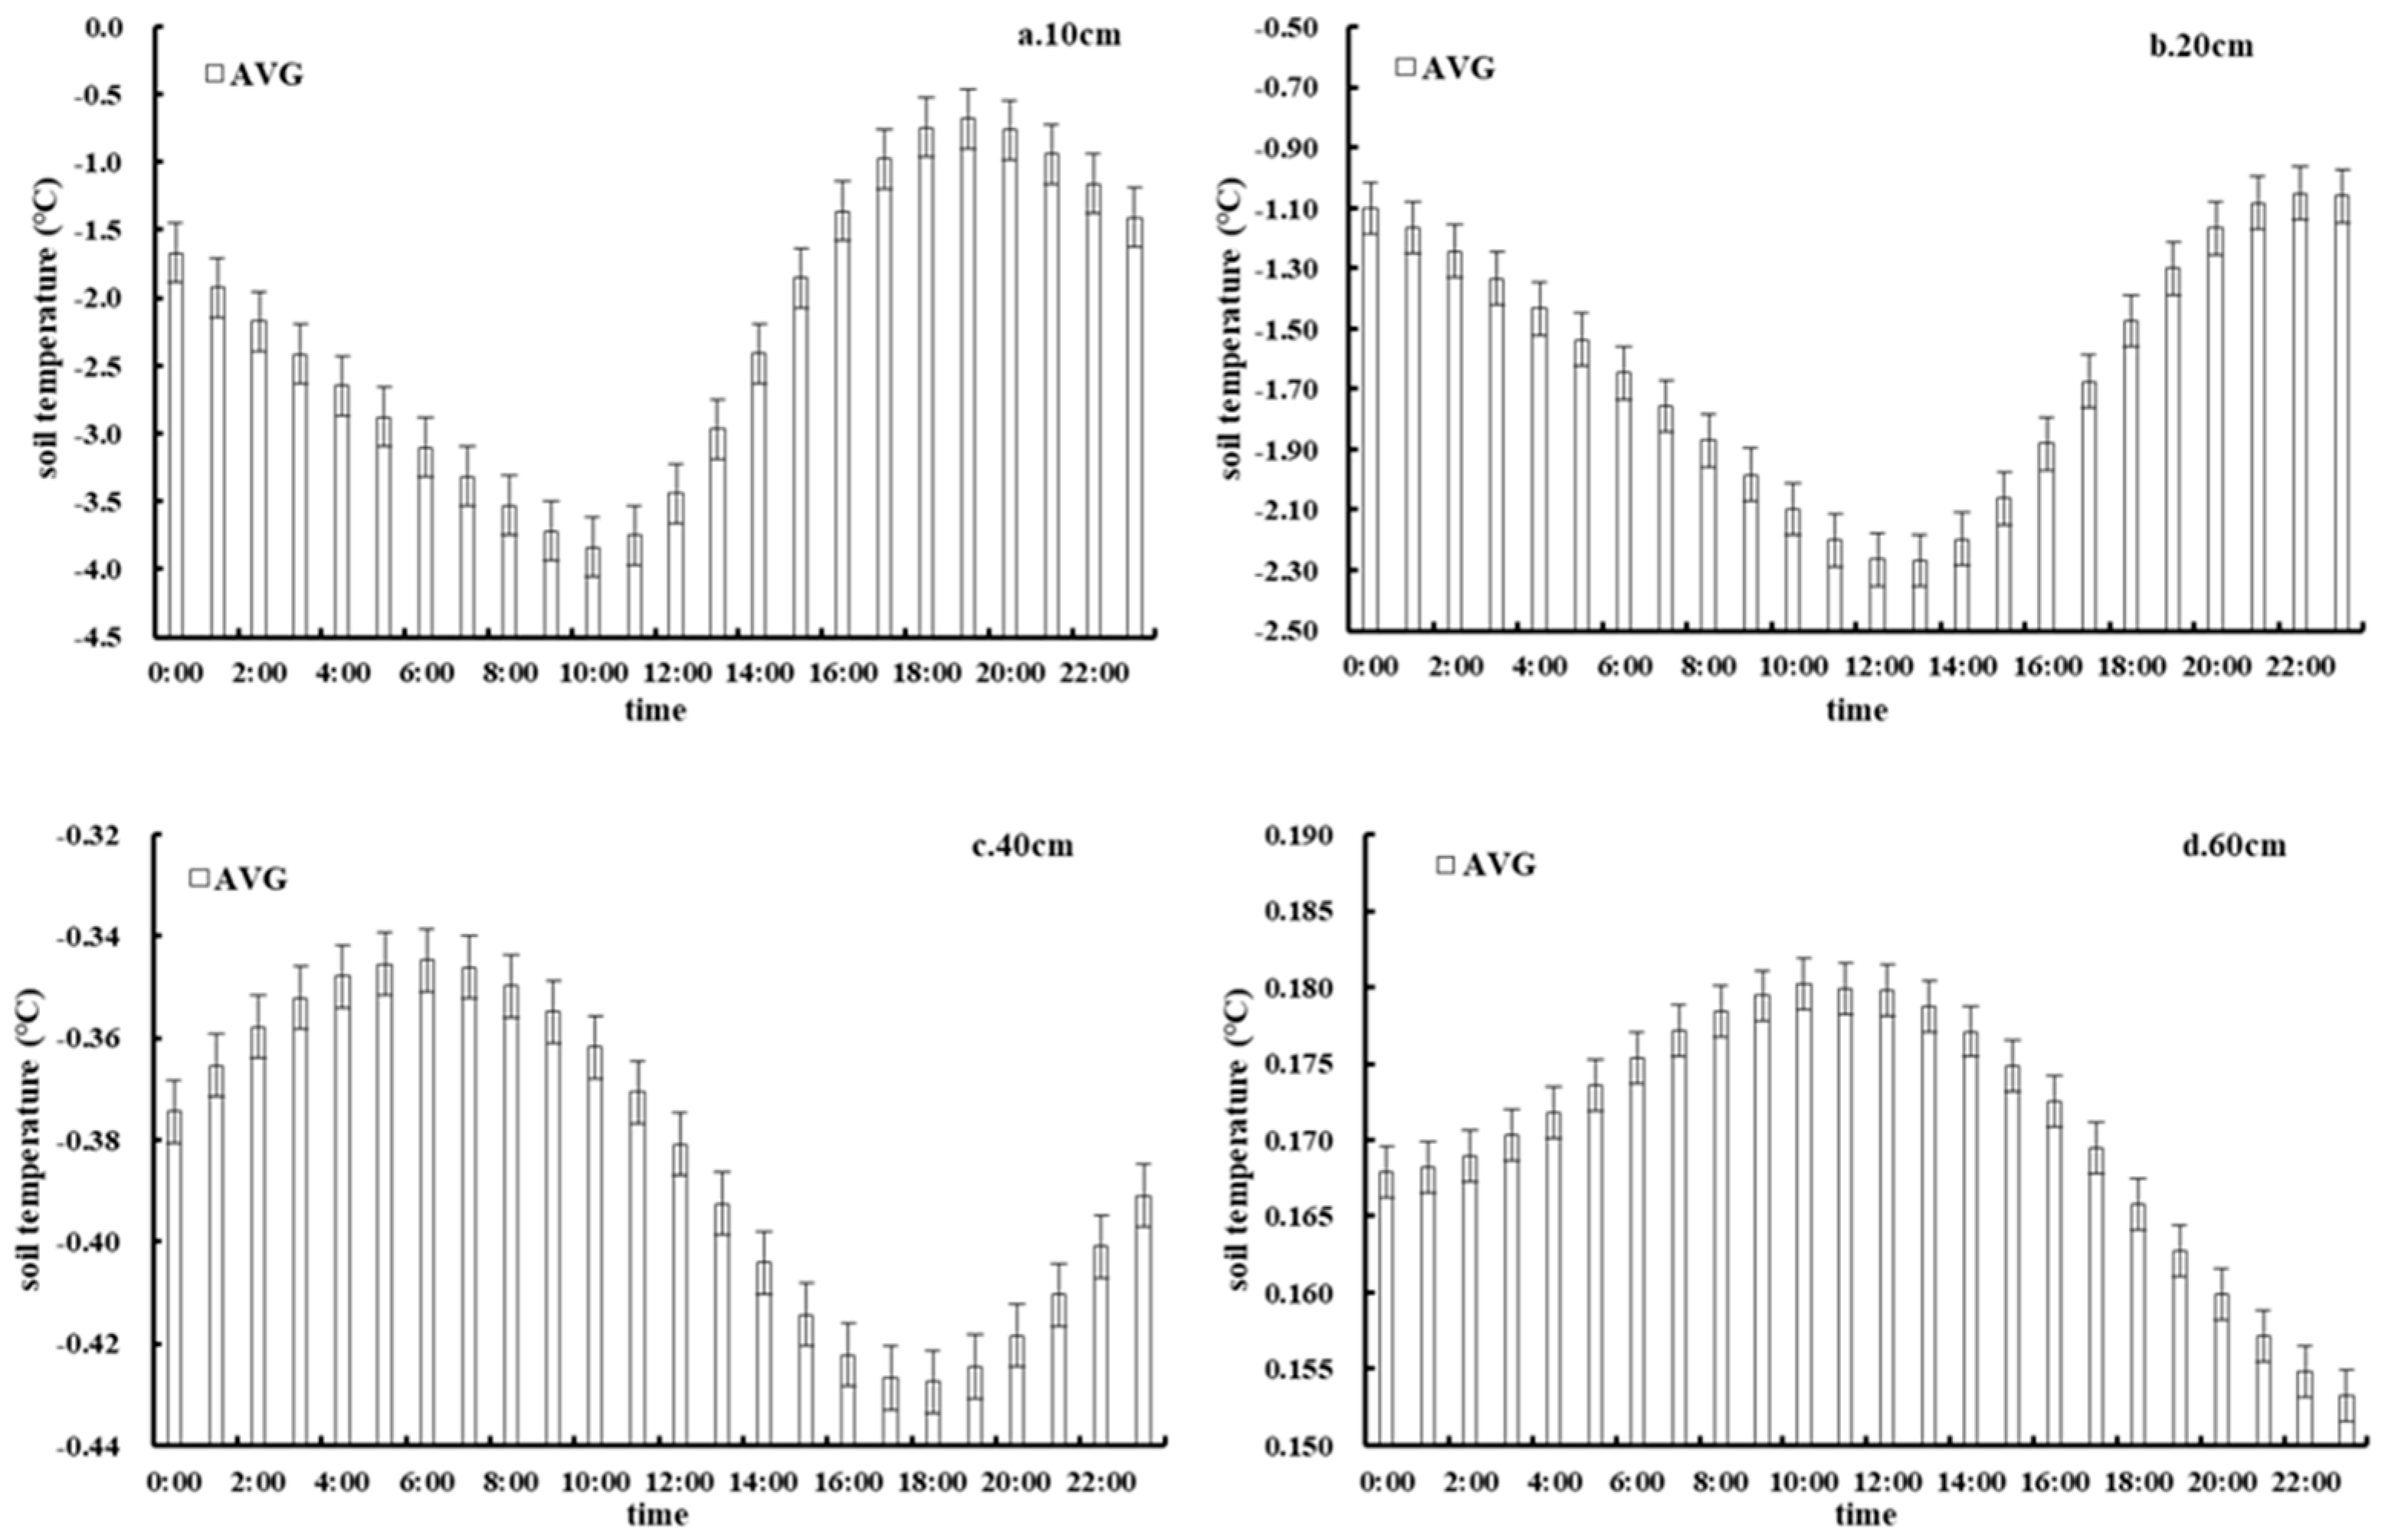
The analysis of temporal variations in soil temperature at different depths (Figure 8) showed that the soil temperature at depths of 10 cm and 20 cm followed a “V-shaped” pattern from 00:00 to 23:00, with extreme values occurring at different times. The maximum and minimum soil temperature values at 10 cm were −0.68 °C and −3.84 °C, respectively, and they occurred at 19:00 and 11:00, respectively, while the maximum and minimum values at 20 cm were −1.05 °C and −2.27 °C, respectively, occurring at 22:00 and 13:00, respectively. The soil temperature at depths of 40 cm and 60 cm displayed a ‘unimodal’ pattern of variation, with peak values of −0.34 °C and 0.18 °C occurring at 06:00 and 10:00, respectively, and low values occurring at 18:00 and 23:00, respectively. There was a slow and continuous downward trend in soil temperature at depths of 80 cm and 100 cm, but the decline at 100 cm was more substantial. The maximum values of 0.622 °C and 1.118 °C, respectively, occurred at 00:00, and the minimum values of 0.601 °C and 1.093 °C, respectively, occurred at 23:00.

3.2.3. Temporal Variations in Soil Temperature at Different Depths and Associated Patterns

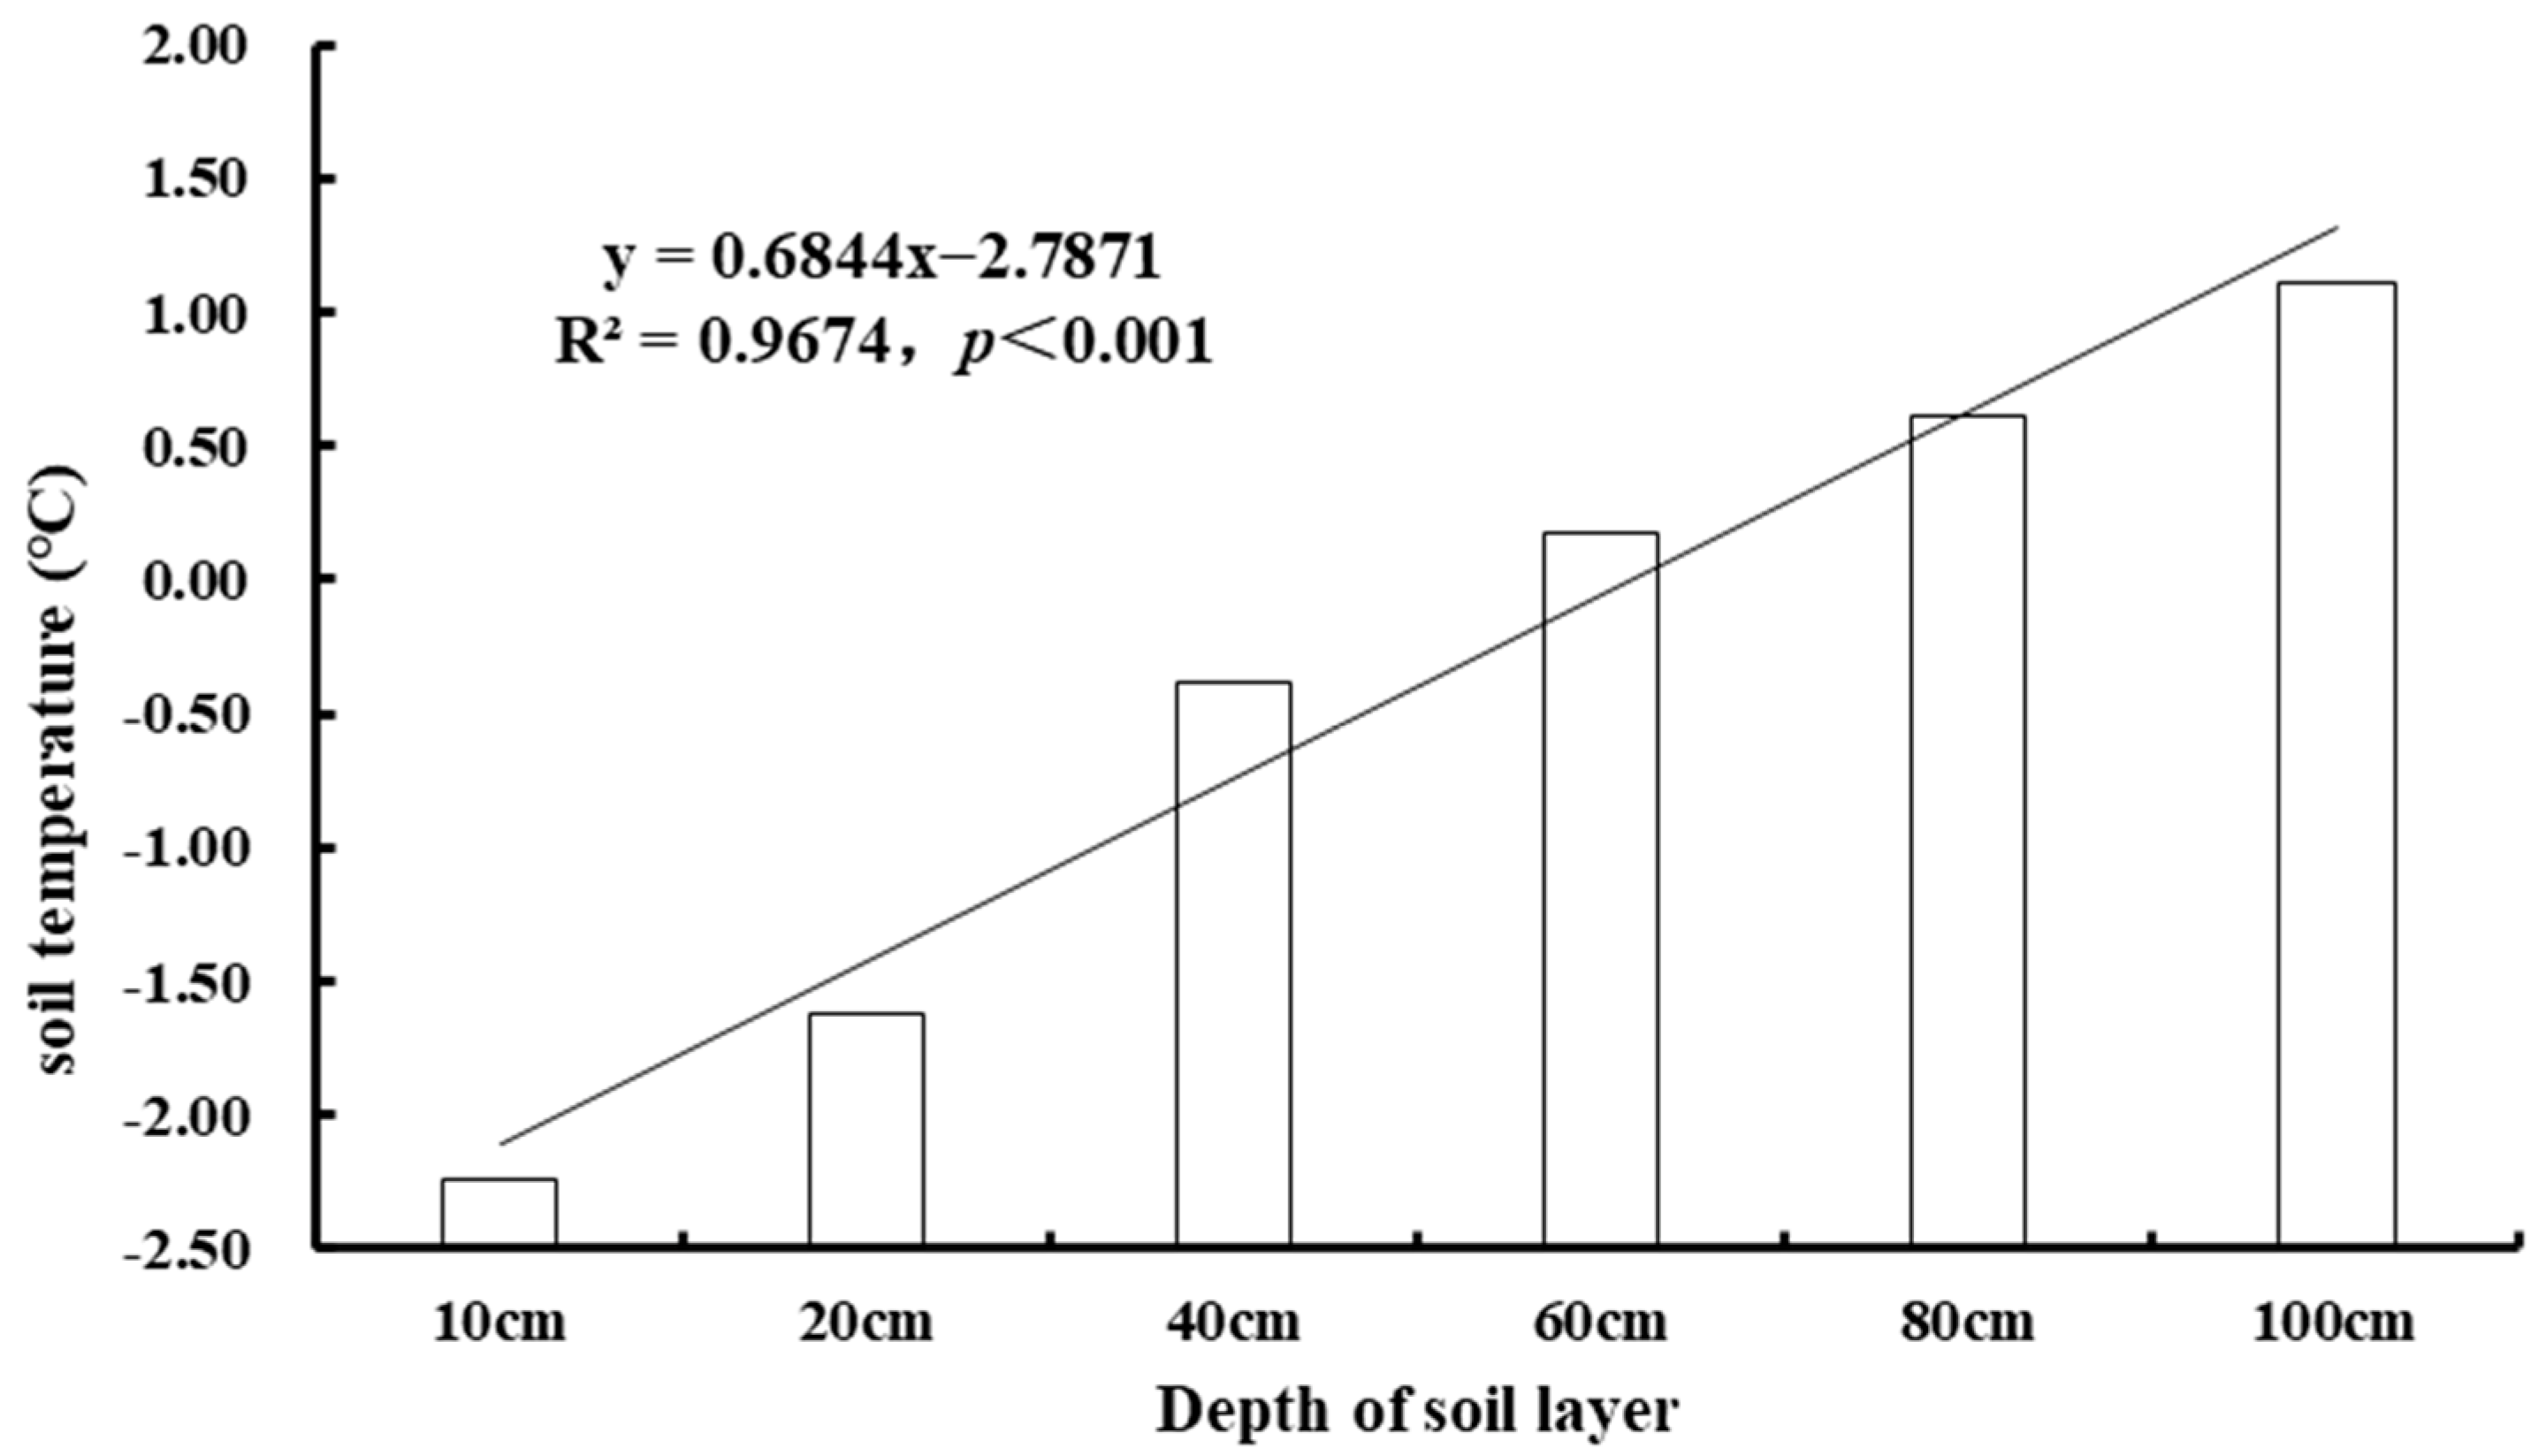
The analysis of variations in soil temperature at different soil depths and associated patterns (Figure 9) showed that the soil temperature increased significantly and continuously with depth at a rate of 0.684 (p < 0.001). The maximum and minimum soil temperatures of 1.105 °C and −2.237 °C occurred at depths of 100 cm and 10 cm, respectively.

3.3. Variations in Soil Conductivity and Associated Patterns

3.3.1. Temporal Variations in Soil Conductivity and Associated Pattern

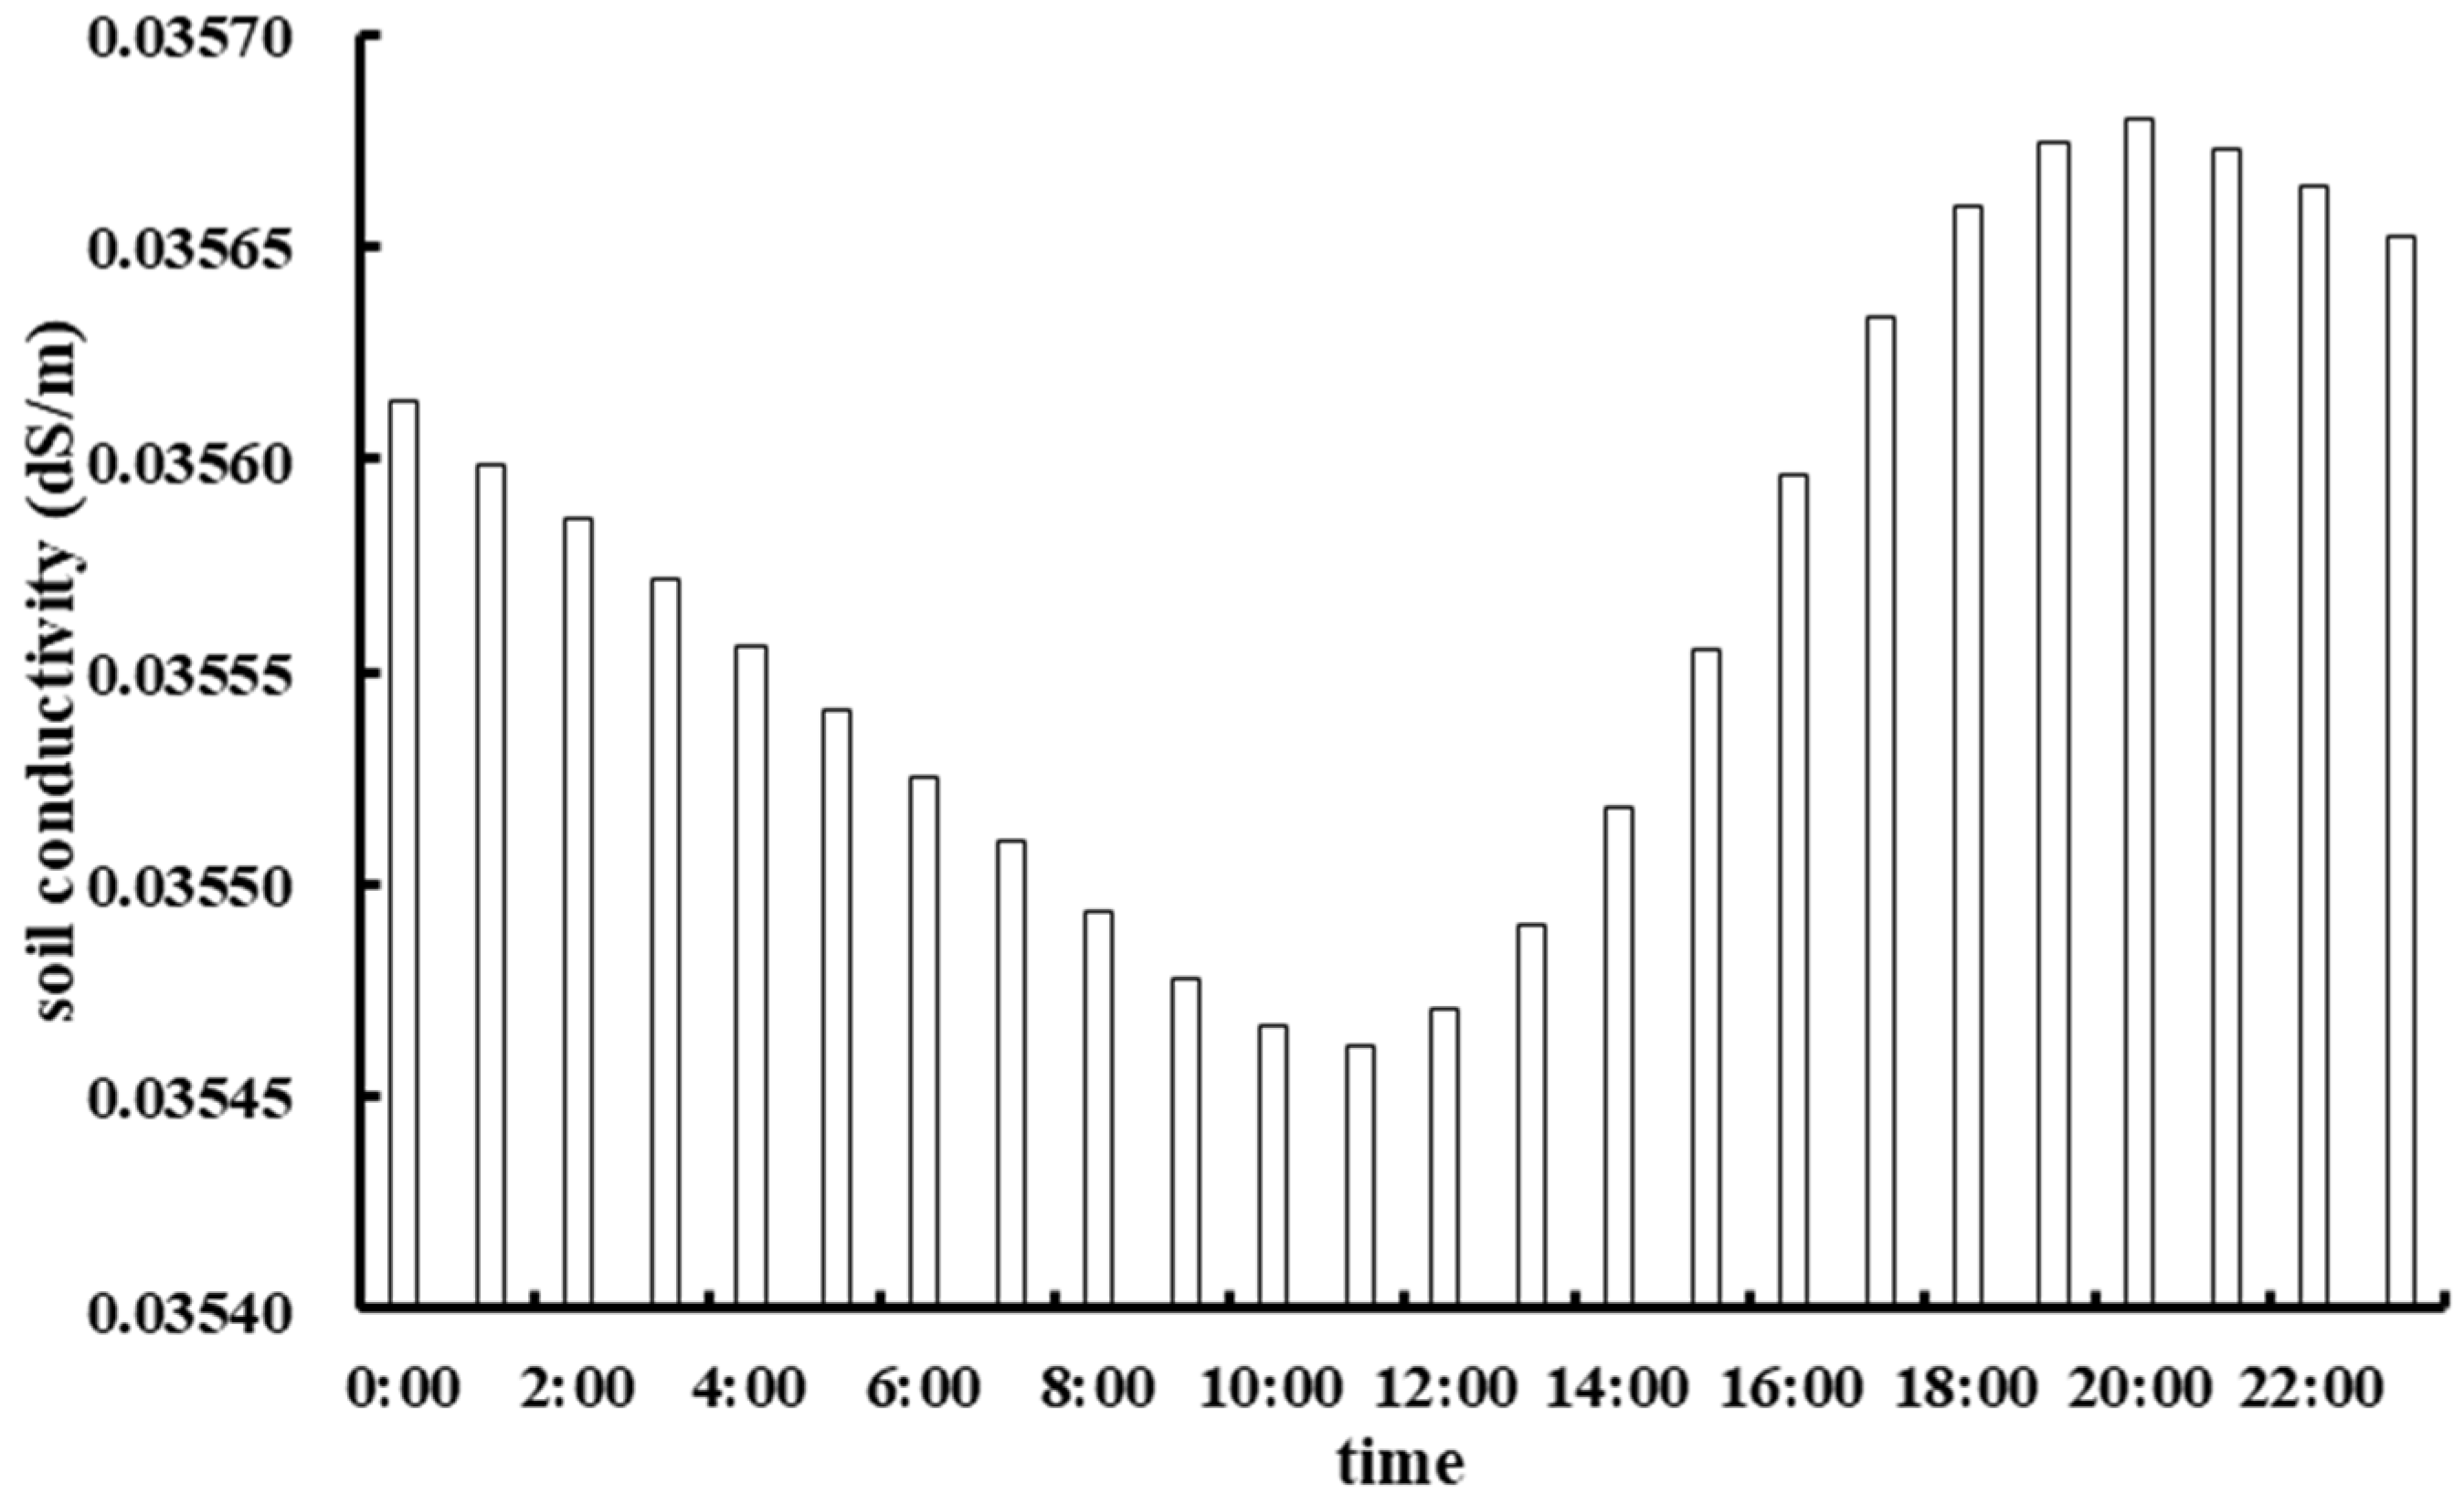
The analysis of temporal variations in soil conductivity (Figure 10) revealed the occurrence of an obvious ‘V-shaped’ soil conductivity pattern from 00:00 to 23:00. The value decreased from 21:00 to 11:00, reached a minimum value of 0.035462 dS/m at 11:00, and then increased from 11:00 to 20:00, and reached a maximum value of 0.03568 dS/m at 20:00.

3.3.2. Temporal Variations in Soil Conductivity at Different Depths and Associated Patterns

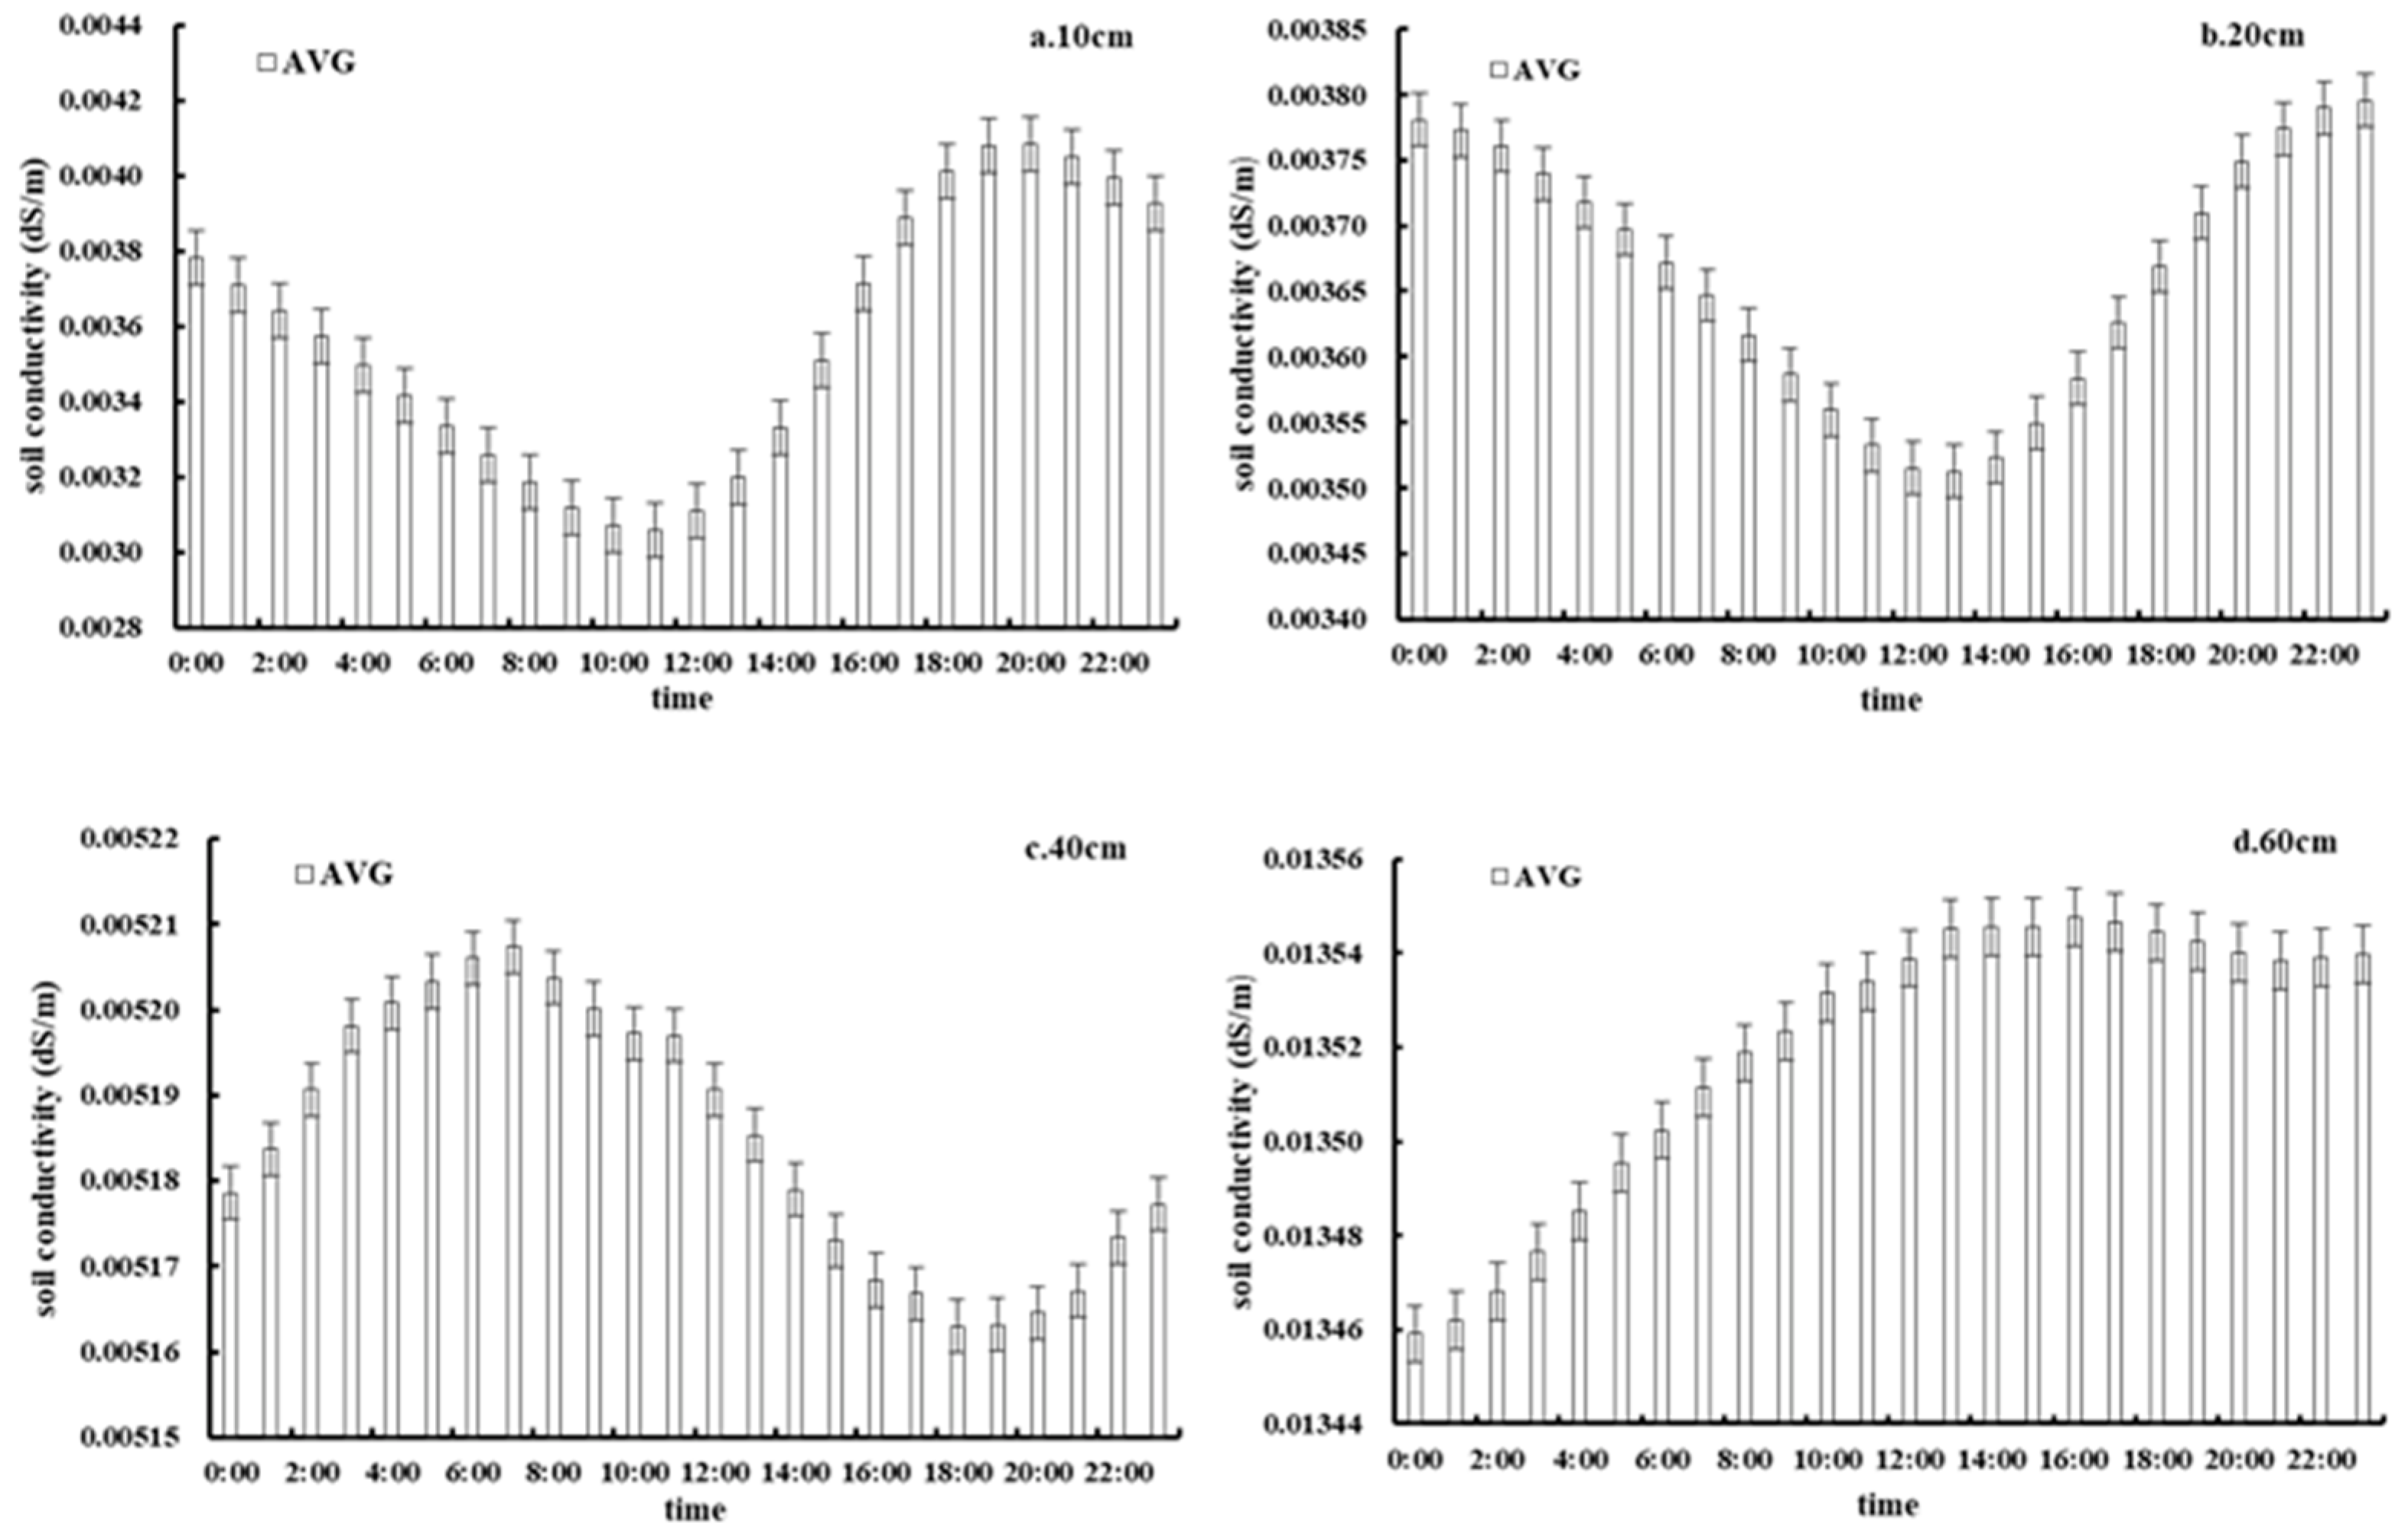
The analysis of the temporal variations in soil conductivity at different depths (Figure 11) showed certain similarities at depths of 10 cm and 20 cm, and both showed a gradual decrease followed by a slow increase. The changes in conductivity at different depths varied to a certain extent, with maximum and minimum values occurring at 20:00 and 11:00 at 10 cm and at 23:00 and 13:00 at 20 cm. The undulating pattern of soil conductivity variations at 40 cm was also noticeable, and maximum and minimum values occurred at 07:00 and 18:00, respectively. At 60 cm, the values showed a fluctuating upward trend from 00:00 to 23:00 that was opposite to the pattern at 80 cm, which showed a continuous decline. The pattern at 100 cm was similar to that at 10 cm in that a downward trend in soil conductivity occurred from 00:00 to 23:00 followed by an undulating pattern. However, the uptrend at 100 cm was more substantial, and a continuous upward trend was observed from 09:00 to 18:00 and a constant downtrend from 19:00 to 08:00 the following day.

3.3.3. Variations in Soil Conductivity at Different Depths and Associated Patterns

The analysis of variations in soil conductivity at different soil depths and associated patterns (Figure 12) revealed a significant and continuous increase in soil conductivity with soil depth. The maximum and minimum soil conductivity values were 0.00356 dS/m and 0.12089 dS/m, respectively, at depths of 10 cm and 100 cm, respectively.

3.4. Analysis of Factors Influencing Changes in Soil Temperature, Moisture, and Conductivity

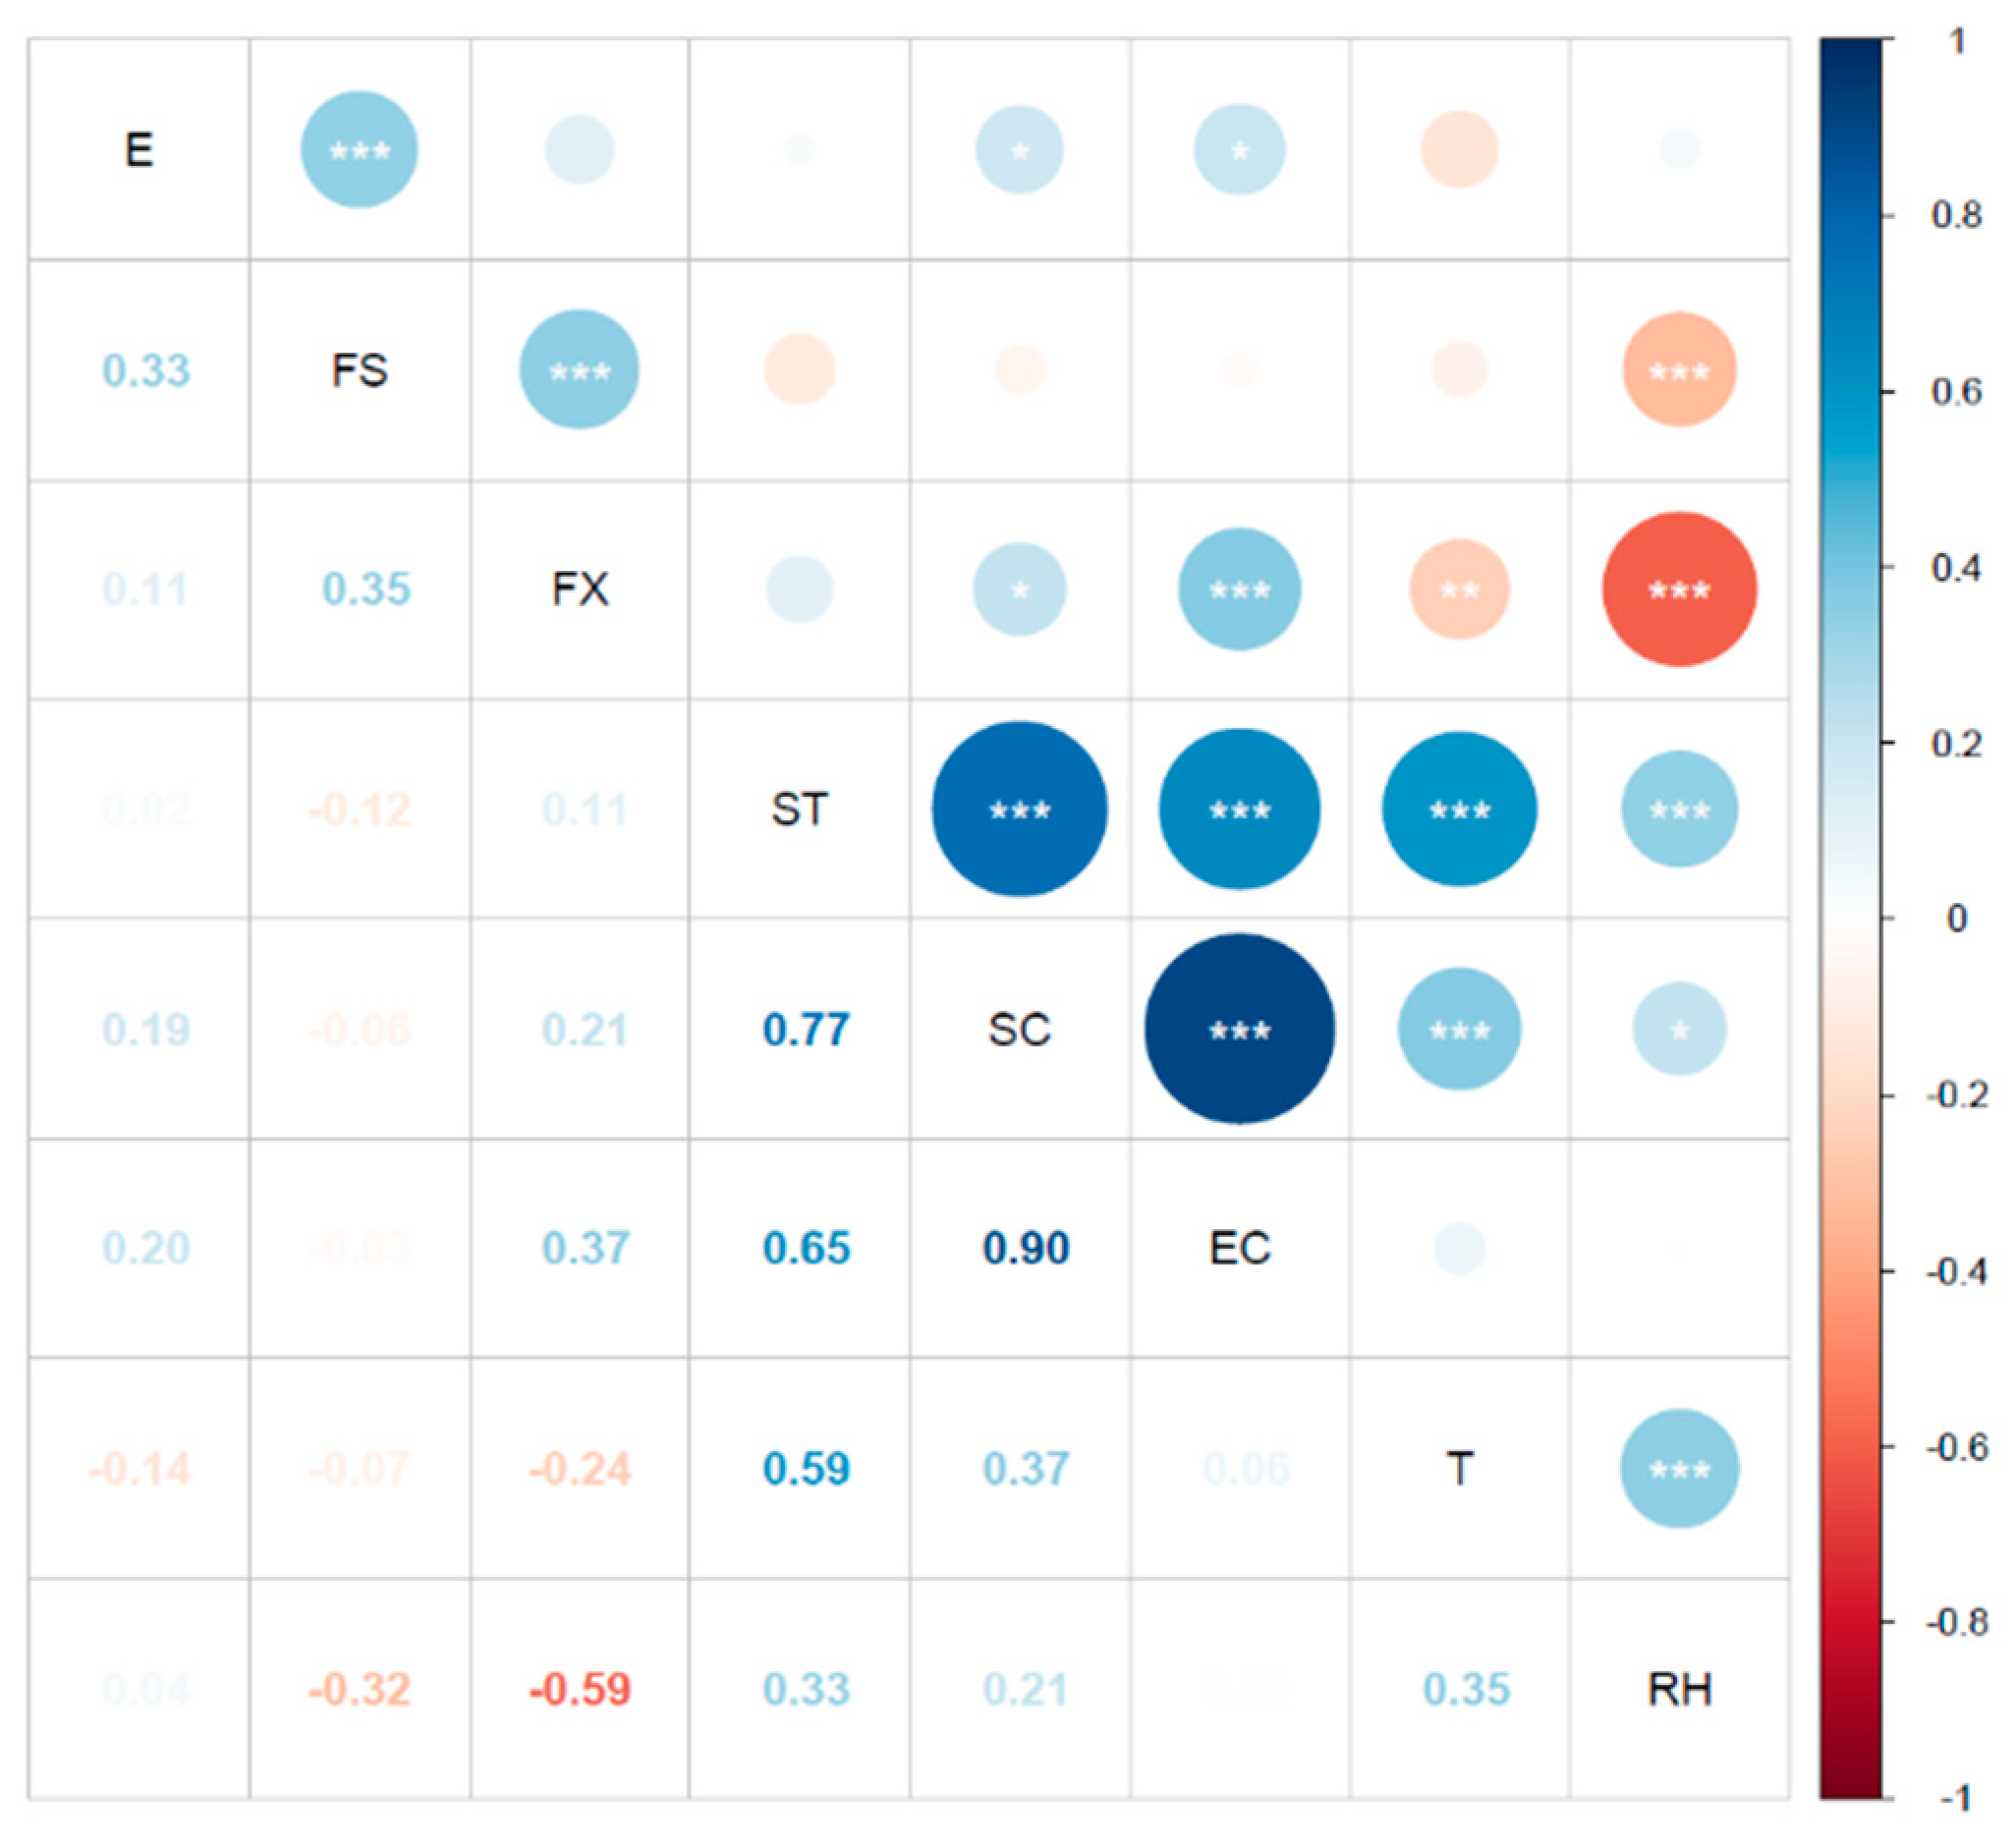
Figure 13 shows that soil moisture, soil conductivity, air temperature, and relative humidity had significant positive correlations (p < 0.01) with soil temperature, and their correlation coefficients (r) were 0.77, 0.65, 0.59, and 0.33, respectively. Soil conductivity, soil temperature, and air temperature were positively correlated with soil moisture (p < 0.01), with r values being 0.9, 0.77, and 0.37, respectively. Relative humidity, wind direction and evapotranspiration showed significant positive correlations (p < 0.05) with soil moisture, with r values being 0.21, 0.21, and 0.19, respectively. Soil moisture, soil temperature and wind direction showed significant positive correlations (p < 0.01) with soil conductivity, with r values being 0.9, 0.65, and 0.37, respectively. Evapotranspiration and air temperature were positively correlated with soil conductivity (p < 0.05), with r values being 0.2 and 0.06, respectively.
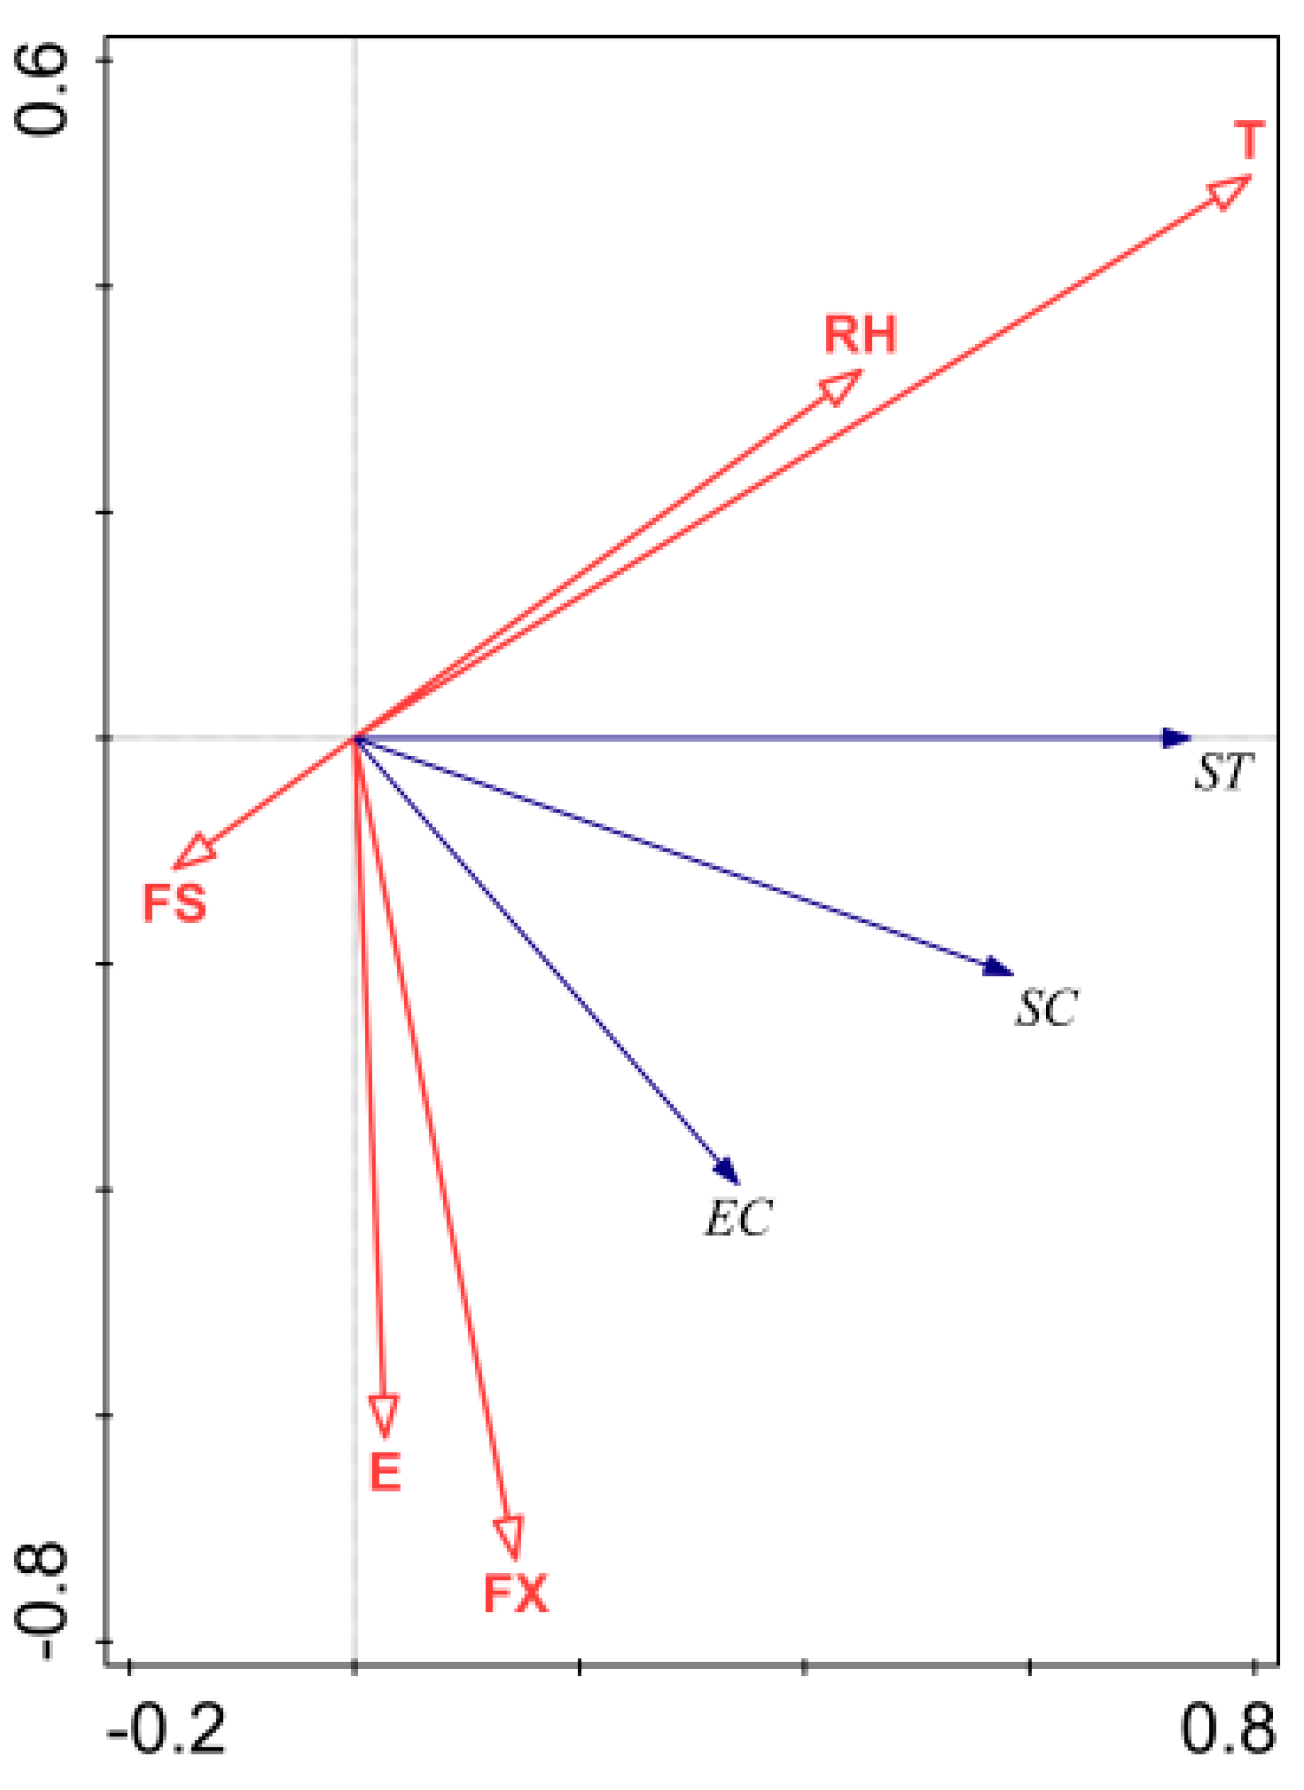
The first two axes of the redundancy analysis revealed the relationship between soil temperature, moisture and conductivity and climate factors. As shown in Figure 14, climate factors were significantly correlated with soil temperature, moisture and conductivity (p < 0.001). Air temperature, relative humidity and wind direction were the most important influential factors positively correlated with variations in soil temperature, and air temperature had the most significant impact. Evapotranspiration and wind speed were influential factors which were negatively correlated with soil temperature. Air temperature, relative humidity, wind direction and evapotranspiration were influential factors that were positively correlated with soil moisture, and air temperature was the most important; the wind speed was the influential factor negatively correlated with soil moisture. Wind direction, evapotranspiration and air temperature were positively correlated factors influencing soil conductivity; wind direction was the most important factor (Wind direction and wind speed affect soil evapotranspiration, and then affect soil moisture and solute transport process), relative humidity, wind speed was negatively correlated influential factors. Table 1 shows the degree to which each climate factor accounted for changes in the characteristics of soil temperature, moisture and conductivity. The results showed that the five climate factors (wind speed, wind direction, air temperature, relative air humidity, and evapotranspiration) in total accounted for 53.6% (after correction) of the change. Air temperature and relative humidity contributed at higher levels of 35% and 11.4%, respectively, to variabilities in soil temperature, moisture and conductivity variability, evapotranspiration and the wind speed contributed at lower levels of 0.6% and 1.5%, respectively.

4. Discussion

4.1. Soil Moisture Variation Characteristics

Winter soil moisture changes are related to the feedback processes of snowfall, albedo, longwave radiation, latent heat of condensation and soil moisture [36]. Variability in soil moisture was observed at different depths at the Bird Island sampling site in winter. The maximum and minimum soil moisture values in the surface layer (10 cm and 20 cm) on Bird Island occurred at night and during the day, respectively, which indicated that surface soil moisture was significantly influenced by solar radiation and atmospheric temperature. The maximum and minimum soil moisture values at a depth of 40 cm occurred in the morning and the evening, respectively, which indicated that solar radiation and atmospheric temperature had a lower influence on soil moisture at this depth and below. Soil moisture at the depths of 60 cm, 80 cm, and 100 cm gradually increased throughout the day, indicating that deep soil with a high moisture content may not be frozen, and it may be more significantly influenced by other factors, such as soil runoff.

4.2. Characteristics of Soil Temperature Variations

The temperature of winter soil changed through the processes of absorption and the release of energy in response to changes in solar radiation and atmospheric temperature [37]. There was variability between the soil temperature ranges at different depths. Negative soil temperature values were observed at the depths of 10 cm, 20 cm, and 40 cm respectively, and the positive values were observed at depths ≥ 60 cm. These results indicated that soil temperature was less affected by solar radiation with increasing depth, and the variation in the ranges tended to be stable.
Zhao et al. [32] found that the maximum and minimum soil temperatures in the Qilian Mountains occurred at 18:00 and 09:00, respectively, while the maximum and minimum soil temperatures in this study occurred at 20:00 and 11:00, respectively; the difference between the times mainly related to the locations of the observation sites used. Although both areas were covered in grass, the terrain on Bird Island is more open and the soil temperature changes more slowly and undergoes a gradual warming and cooling processes. In contrast, temperature changes in the Qilian Mountains are more intense than those on Bird Island and the soil undergoes quick warming and cooling processes. These differences resulted in a 2 h time delay for the soil temperature extremes on Bird Island relative to those in the Qilian Mountains. The soil temperature gradually increased with an increase in the soil layer depth, although there was a gradual decrease in the magnitude of soil temperature changes, and the greatest fluctuations in soil temperature were observed at a depth of 10 cm. As the soil layer approaches the surface, the influence of the external environment becomes greater and more solar radiation is received, which results in greater soil temperature variations at shallower depths. The surface receives direct solar radiation throughout the day, and the ground temperature gradually rises. Heat is transferred from the ground to the atmosphere through ground radiation, and the air temperature also gradually increases. Under the joint influence of atmospheric and solar radiation, the temperature of the surface soil layer rapidly rises. Due to the thermal capacity and conduction resistance, the amount of heat transferred from the surface layer to the deep soil layers gradually slows down, which delays the time at which the maximum soil temperature is reached [38]. In this study, the soil temperature reached a maximum value at 20:00.

4.3. Variations in Soil Conductivity and Associated Patterns

With an increase in soil depth, the extreme difference of soil conductivity showed a rough increasing pattern. For example, the ranges at the depths of 10 cm, 20 cm, 40 cm, 60 cm, 80 cm, and 100 cm were at 0.00356 dS/m, 0.00366 dS/m, 0.00519 dS/m, 0.01352 dS/m, 0.06659 dS/m, and 0.12089 dS/m, respectively, which could be jointly affected by soil salinity, temperature, moisture, the organic matter content and the soil texture and structure [39]. According to the salinization grading index of Saline Soils in China for saline soils in coastal and semi-humid semi-arid areas, the soil is not considered to be salinized when conductivity is less than 0.243 dS/m, and the values of 0.243–0.486 dS/m indicate mild salinization [40]. The soil conductivity was consistently lowers than 0.243 dS/m at different depths in the study area, which indicates that the soil on Bird Island is not salinized.

4.4. Factors Influencing the Variations in Soil Temperature, Moisture, and Conductivity

During the freezing process, the water potential inside frozen soil varies with both the soil temperature and the liquid water content within the soil, and soil texture is an important factor impacting the change in the moisture during freezing and thawing of the soil [41]. Climate factors are the main drivers behind the spatial distribution of soil water and heat, and they determine the heat transfer and the phase change and diffusion of water in the soil to a certain extent. During the soil freezing process, the air temperature gradually decreases, the liquid water in the soil changes to solid water, and the surface layer of the soil begins to freeze. In addition, the temperature of the deeper soil layers is relatively high, and the water in the deeper soil layers is driven by the soil potential energy difference to gradually migrate to the location of the freezing front. The soil temperature affects the movement of water, and the water diffusion process also has an effect on temperature conduction. The driving force behind the migration and diffusion of soil moisture temperature is derived from climate variability [42].
In addition, soil texture affects soil temperature, soil moisture and conductivity. The Bird Island sampling site is an important and internationally renowned area of wetlands that is classified as a lakeshore wetland, and it experiences extreme minimum temperatures of −31 °C [26]. The sample site has sandy soil, with a poor water holding capacity and a low winter soil water content [43,44]. Furthermore, soil salinity varies with the amount and type of groundwater under different geographical conditions, and the soil at the Bird Island sampling site is well-drained and sandy; it is thus not susceptible to salinization. In this respect, the results of this study are consistent with the findings of Wang et al. [45], who analysed the geographical pattern and saline soil distribution within the area using GIS and remote sensing technology. Their results showed a clear correlation between soil salinity and geographical patterns and that soil salinization occurred mainly in areas that had a low terrain, such as the edges of the lowlands and the central plains. In addition, soil salinization is commonly discovered in the upper layer of soil [46]. The average annual temperature at the Bird Island sampling site is −0.7 °C. The low temperature and low amounts of evaporation delay the precipitation of soluble salt compounds following water evaporation. Our results show that salinization has not occurred yet, and this is consistent with the findings of Wang et al. [47] and Mohamed et al. [48].

5. Conclusions

The winter soil moisture, temperature and conductivity changes at the Bird Island sampling site in Qinghai Lake were analyzed, and the following conclusions were made:
  • The changes of soil moisture, temperature and electrical conductivity in the Bird Island wetland have their own characteristics in winter. The diurnal variation of soil temperature is obviously influenced by external factors such as solar radiation, and presents a “Single-peak” curve, however, the soil hydrology and electrical conductivity were affected by the external factors and lagged behind, showing a “V-type” change law. The soil moisture and soil electrical conductivity at depths of 10 cm and 20 cm showed obvious undulating characteristics in time, and the soil temperature dropped more obviously at depths of 100 cm. As a whole, soil moisture, temperature, and electrical conductivity showed a continuous upward trend with the deepening of soil depth.
  • Air temperature and air relative humidity are the most important positive correlation factors of soil temperature and soil moisture in winter, and wind direction is the most important positive correlation factor of soil conductivity. The total explanation rate of climate factors to soil temperature, moisture and electrical conductivity was 53.5%. Soil moisture, soil electrical conductivity, air temperature and air relative humidity were positively correlated with soil temperature (p < 0.01). In winter, soil electrical conductivity, soil temperature and air temperature were positively correlated with soil moisture (p < 0.01), in winter, soil moisture, soil temperature and wind direction were positively correlated with soil electrical conductivity (p < 0.01).
  • Under the warm and humid background of the Tibetan plateau, the changes of soil temperature, moisture and electrical conductivity in the Bird Island wetland in winter were not obvious. There was a negative correlation between soil freezing temperature and salt content in winter, and the variability of salt content was greater than that of water content during freezing-thawing period. At the same time, temperature is one of the important factors affecting soil moisture. Due to the spatio-temporal variation and complexity of soil water and heat changes in winter, the analysis of this study and the verification of the existing research results are still Without loss of generality. However, it is still necessary to study the law of water and heat change of active layer soil in permafrost region.
To sum up, the change of soil temperature, humidity and salt in winter is a complex and multi-scale cycle process in the Tibetan plateau. Because of the special ecosystem around the study area, though there are some limitations in the analysis of a single site, the above-mentioned analysis and the verification of the existing research results are still of great significance. In frozen soil, soil texture is an important factor to determine soil water potential, and the melting speed of deeper soil is faster than that of shallow soil in the process of soil thawing [41]. In future research, the real-time variation of each factor and its influence on the variation of unfrozen water will be considered.

Author Contributions

Conceptualization, K.C. and D.Y.; methodology, Z.C.; software, Z.C.; validation, Z.C., G.C. and J.F.; formal analysis, Z.C.; investigation, Z.C.; resources, Z.C.; data curation, Z.C.; writing—original draft preparation, Z.C.; writing—review and editing, Z.C. and D.Y.; visualization, Y.M.; supervision, X.W.; project administration, K.C.; funding acquisition, K.C. All authors have read and agreed to the published version of the manuscript.

Funding

This work was supported by the Free Exploration and research project of the key laboratory of The Tibetan Plateau surface process and ecological conservation (grant no. TGEZT-2021-05), The Second Tibetan Plateau Scientific Expedition and Research Program (grant no. 2019QZKK0405).

Institutional Review Board Statement

The study was conducted in accordance with the Declaration of Helsinki, and approved by the Institutional Review Board (or Ethics Committee) of NAME OF.

Informed Consent Statement

Informed consent was obtained from all subjects.

Data Availability Statement

The raw data have been uploaded to NCBI.

Acknowledgments

We gratefully acknowledge financial support from the Key Laboratory of Qinghai Province Physical Geography and Environmental Process, MOK Key Laboratory of Tibetan Plateau Land Surface Processes and Ecological Conservation. We also want to express our respect and thanks to the anonymous reviewers and the editors for their important and insightful comments and suggestions, which helped improve the manuscript.

Conflicts of Interest

The authors declare no conflict of interest.

References

  1. Yan, H.; Zhan, J.; Zhang, T. Review of Ecosystem Resilience Research Progress. Prog. Geogr. 2012, 31, 303–314. [Google Scholar]
  2. Zhou, J.; Wen, J.; Liu, R.; Wang, X.; Xie, Y. Late spring soil moisture variation over the Tibetan Plateau and its influences on the plateau summer monsoon. Int. J. Climatol. 2018, 38, 4597–4609. [Google Scholar] [CrossRef]
  3. Li, K.; Zhang, J.; Yang, K.; Wu, L. The Role of Soil Moisture Feedbacks in Future Summer Temperature Change over East Asia. J. Geophys. Res. Atmos. 2019, 124, 12034–12056. [Google Scholar] [CrossRef]
  4. Yang, M.; Wang, X.; Pang, G.; Wan, G.; Liu, Z. The Tibetan Plateau cryosphere: Observations and model simulations for current status and recent changes. Earth-Sci. Rev. 2019, 190, 353–369. [Google Scholar] [CrossRef]
  5. Robock, A.; Vinnikov, K.; Srinivasan, G.; Entin, J.; Namkhai, A. The global soil moisture data bank. Bull. Am. Meteorol. Soc. 2000, 81, 1281–1299. [Google Scholar] [CrossRef] [Green Version]
  6. Jiang, Y. Study on Spatial and Temporal Simulation of Vegetation CarbonSink Using Quantitative Remote Sensing in Jilin Province; Jilin University: Changchun, China, 2012. [Google Scholar]
  7. Hossain, A. Labile Soil Organic Matter Pools Are Influenced by 45 Years of Applied Farmyard Manure and Mineral Nitrogen in the Wheat—Pearl Millet Cropping System in the Sub-Tropical Condition. Agronomy 2021, 11, 2190. [Google Scholar] [CrossRef]
  8. Docker, B.; Hubble, T. Modeling the distribution of enhanced soil shear strength beneath riparian trees of south-eastemn Australia. Ecol. Eng. 2009, 35, 921–934. [Google Scholar] [CrossRef]
  9. Musa, A.; Ya, L.; Anzhi, W.; Cunyang, N. Characteristics of soil freeze-thaw cycles and their effects on water enrichment in the rhizosphere. Geoderma 2016, 264, 132–139. [Google Scholar] [CrossRef]
  10. Sun, X. Agrologypedology; China Forestry Publishing House: Beijing, China, 2005. [Google Scholar]
  11. Chen, G. New Progress in the study of permafrost and underground ice at high altitude. Chin. Sci. Bull. 1990, 19, 1441–1443. [Google Scholar]
  12. Tsytovich, N. Bases and Foundations on Frozen Soil; Highway Research Board Special Report: Washington, DC, USA, 1960. [Google Scholar]
  13. Guo, H. Variation Characteristics and Influencing Factors of Unfrozen Water Content in Qilian Mountains Frozen Soil; Lanzhou University: Lanzhou, China, 2017. [Google Scholar]
  14. Burt, T.; Williams, P. Hydrulic conductivity in frozen soils. Earth Surf. Process 1976, 1, 349–360. [Google Scholar] [CrossRef]
  15. Xu, X.; Aolifengte, J.; Taisi, A. Water migration in unsaturated frozen moling clay under linear temperature gradient. J. Glaciol. Geocryol. 1985, 2, 111–122. [Google Scholar]
  16. Xu, X.; Aolifengte, J.; Taisi, A. Soil water potential, unfrozen water content and temperature. J. Glaciol. Geocryol. 1985, 1, 1–14. [Google Scholar]
  17. Xu, X. French central laboratory for roads and bridges. J. Glaciol. Geocryol. 1982, 1, 90–91. [Google Scholar]
  18. Zhang, L.; Xu, X.; Zhang, Z.; Deng, Y. Experimental Study of the Relationship Between the Unfrozen, Water Content of Frozen Soil and Pressure. J. Glaciol. Geocryol. 1998, 2, 28–31. [Google Scholar]
  19. Yang, M.; Yao, C.; Ken’ichi, U. Time series analysis of soil temperature at D105 point on the north slope of Tanggula Mountains, qinghai-tibet plateau. Resour. Sci. 2000, 2, 77–81. [Google Scholar]
  20. Shang, S.; Lei, Z.; Yang, S. Numerical simulation improvement of coupled moisture and heat transfer during soil freezing. J. Tsinghua Univ. 1997, 8, 64–66+104. [Google Scholar]
  21. Wilfried, H.; Bernard, H.; Lukas, A.; Roger, E.; Ole, H.; Andreas, K.; Viktor, K.; Branko, L.; Norikazu, M.; Sarah, S.; et al. Permafrost creeps and rock glacier dynamics. Permafr. Periglac. Processes 2006, 17, 189–214. [Google Scholar]
  22. Miller, R. Freczing Phenomena in Soil. In Application of Soil Physics; Hillel, D., Ed.; Academic Press, Inc.: London, UK, 1980; pp. 255–299. [Google Scholar]
  23. Wang, C.; Dong, W.; Wei, Z. Study on relationship between freezing- thawing processes of the Qinghai-Tibet Plateau and the atmospheric eirculation over Fast Asia. Chin. J. Geophys. 2003, 46, 438–448. [Google Scholar] [CrossRef]
  24. Yang, Z.; Chen, K.; Liu, F.; Che, Z. Effects of Rainfall on the Characteristics of Soil Greenhouse Gas Emissions in the Wetland of Qinghai Lake. Atmosphere 2022, 13, 129. [Google Scholar] [CrossRef]
  25. Wang, S.; Chen, G.; Bai, Y.; Zhou, G.; Sun, J. The relationship between plant community species diversity and soil environmental factors in the bird island area of Qinghai Lake. Chin. J. Appl. Ecol. 2005, 16, 186–188. [Google Scholar]
  26. Zhang, N.; Chen, K.; Wang, H.; Yang, Y. Effect of simulated warming on soil microorganism of bird island in Qinghai lake. J. Microbiol. China 2021, 48, 722–732. [Google Scholar]
  27. Wang, T.; Lu, L.; Liu, G.; Shan, W.; Luo, M.; Wang, J.; Zhou, Y.; Wang, F. Analysis on the evolution and driving factors of the wetland of Qinghai Lake. J. China Inst. Water Resour. Hydropower Res. 2020, 18, 274–283. [Google Scholar]
  28. Chen, J.; Cao, J.; Jin, Z.; Shi, W.; Zhang, B.; Zhang, S. The influence of short-term experimental warming on alpine steppe of bird island, Qinghai Lake. J. Arid. Land Resour. Environ. 2014, 28, 127–133. [Google Scholar]
  29. Topp, G.; Davis, J.; Annan, A. Electromagnetic determination of soil water content: Measurements in coaxial transmission lines. Water Resour. Res. 1980, 16, 574–582. [Google Scholar] [CrossRef] [Green Version]
  30. Wang, Z. Multi-Source Remote Sensing Monitoring of Lake Environmental Factors in the Tibetan Plateau and Its Response to Climate Change; Shandong Normal University: Jinan, China, 2017. [Google Scholar]
  31. Available online: https://baijiahao.baidu.com/s?id=1656794983302806378&wfr=spider&for=pc (accessed on 26 January 2020).
  32. Zhao, W.; Liu, X.; Jin, M.; Jing, W.; Wang, S.; Ren, X.; Ma, J.; Wu, X. Spatio-temporal Change Characteristics of Soil Temperatures and Moistures in Forest and Grass Complex Basin in Qilian Mountains. Soils 2018, 50, 795–802. [Google Scholar]
  33. Zhang, J.; Sha, Z.; Xu, W. Variations of alpine meadow soil temperature and moisture in Batang, Yushu region of the Qinghai-Tibet Plateau. J. Glaciol. Geocryol. 2015, 37, 635–642. [Google Scholar]
  34. Lepš, J.; Petr, Š. Multivariate Analysis of Ecological Data Using CANOCO 5; Cambridge University Press: Cambridge, UK, 2003. [Google Scholar]
  35. Braak, C.; Milauer, P. Canoco Reference Manual and User’s Guide: Software of Ordination, version 5.0; Microcomputer Power: Ithaca, NY, USA, 2012. [Google Scholar]
  36. Hu, G.; Zhao, L.; Li, R.; Wu, T.; Pang, Q.; Wu, X.; Qiao, Y.; Shi, J. Characteristics of Hydro-thermal Transfer During Freezing and Thawing Period in Permafrost Regions. Soils 2014, 46, 355–360. [Google Scholar]
  37. Mu, Y.; Liu, Z.; Li, Y.; Zhu, D. Characteristics of soil temperature change and its relationship with climatic factors in Kras area. Acta Ecol. Sin. 2021, 41, 2738–2749. [Google Scholar]
  38. Chen, J.; Li, S.; Zhang, Y.; Chen, F.; Zhang, H. Characteristics of soil temperature and its response to air temperature in wheat field under different tillage patterns: Diurnal variation of soil temperature and its response to air temperature. Sci. Agric. Sin. 2009, 42, 2592–2600. [Google Scholar]
  39. Agricultural Chemistry Committee of Soil Society of China. Conventional Analytical Methods of Soil Agrochemistry; China Science Publishina & Media Ltd.: Beijng, China, 1983. [Google Scholar]
  40. Diao, E.; Cao, G.; Cao, S.; Yuan, J.; Yu, M.; Fu, J. Analysis of Soil Physical and Chemical Properties and Spatial Variability under Different Land Use Patterns in Southern Slope of Qilian Mountains. Southwest China J. Agric. Sci. 2019, 32, 1864–1871. [Google Scholar]
  41. Luo, S.; Lv, S.; Zhang, Y.; Hu, Z.; Shang, L.; Li, S. Monitoring Soil Water in Frozen Soil on the Central Tibetan Plateau. J. Glaciol. Geocryol. 2009, 31, 1150–1155. [Google Scholar]
  42. Ma, Z. Study on Variation and Transmission Mechanism of Moisture and Engery inAtmosphere-Snow Cover-Freeze-Thaw Soil System; Northeast Agricultural University: Harbin, China, 2018. [Google Scholar]
  43. Wu, L.; Li, Q. Research of Mechanism of Saline Desertification in Western Songnen Plain. J. Soil Water Conserv. 2003, 4, 79–81+93. [Google Scholar]
  44. Li, Q.; Li, X.; Li, X.; Wang, Z.; Song, C.; Zhang, G. Sodium bicarbonate soil management and utilization in Songnen plain. Resour. Sci. 2003, 1, 15–20. [Google Scholar]
  45. Wang, Y.; Shao, M.; Liu, Z.; Warrington, D. Regional spatial pattern of deep soil water content and its influencing factors. Hydrol. Sci. J. 2012, 57, 265–281. [Google Scholar] [CrossRef]
  46. Wang, L.; Shi, B.; Guan, S.; Gong, Q. The variation of soil physical properties on alkali grasslands in Anda City of Heilongjiang Province. Pratacultural Sci. 2007, 10, 19–25. [Google Scholar]
  47. Wang, J.; Wu, J.; Jia, H. Analysis of Spatial Variation of Soil Salinization Using a Hydrochemical and Stable Isotopic Method in a Semiarid Irrigated Basin, Hetao Plain, Inner Mongolia, North China. Environ. Processes 2016, 3, 723–733. [Google Scholar] [CrossRef]
  48. Ibrahimi, M.K.; Miyazaki, T.; Nishimura, T.; Imoto, H. Contribution of shallow groundwater rapid fluctuation to soil salinization under arid and semiarid climate. Arab. J. Geosci. 2014, 7, 3901–3911. [Google Scholar] [CrossRef]
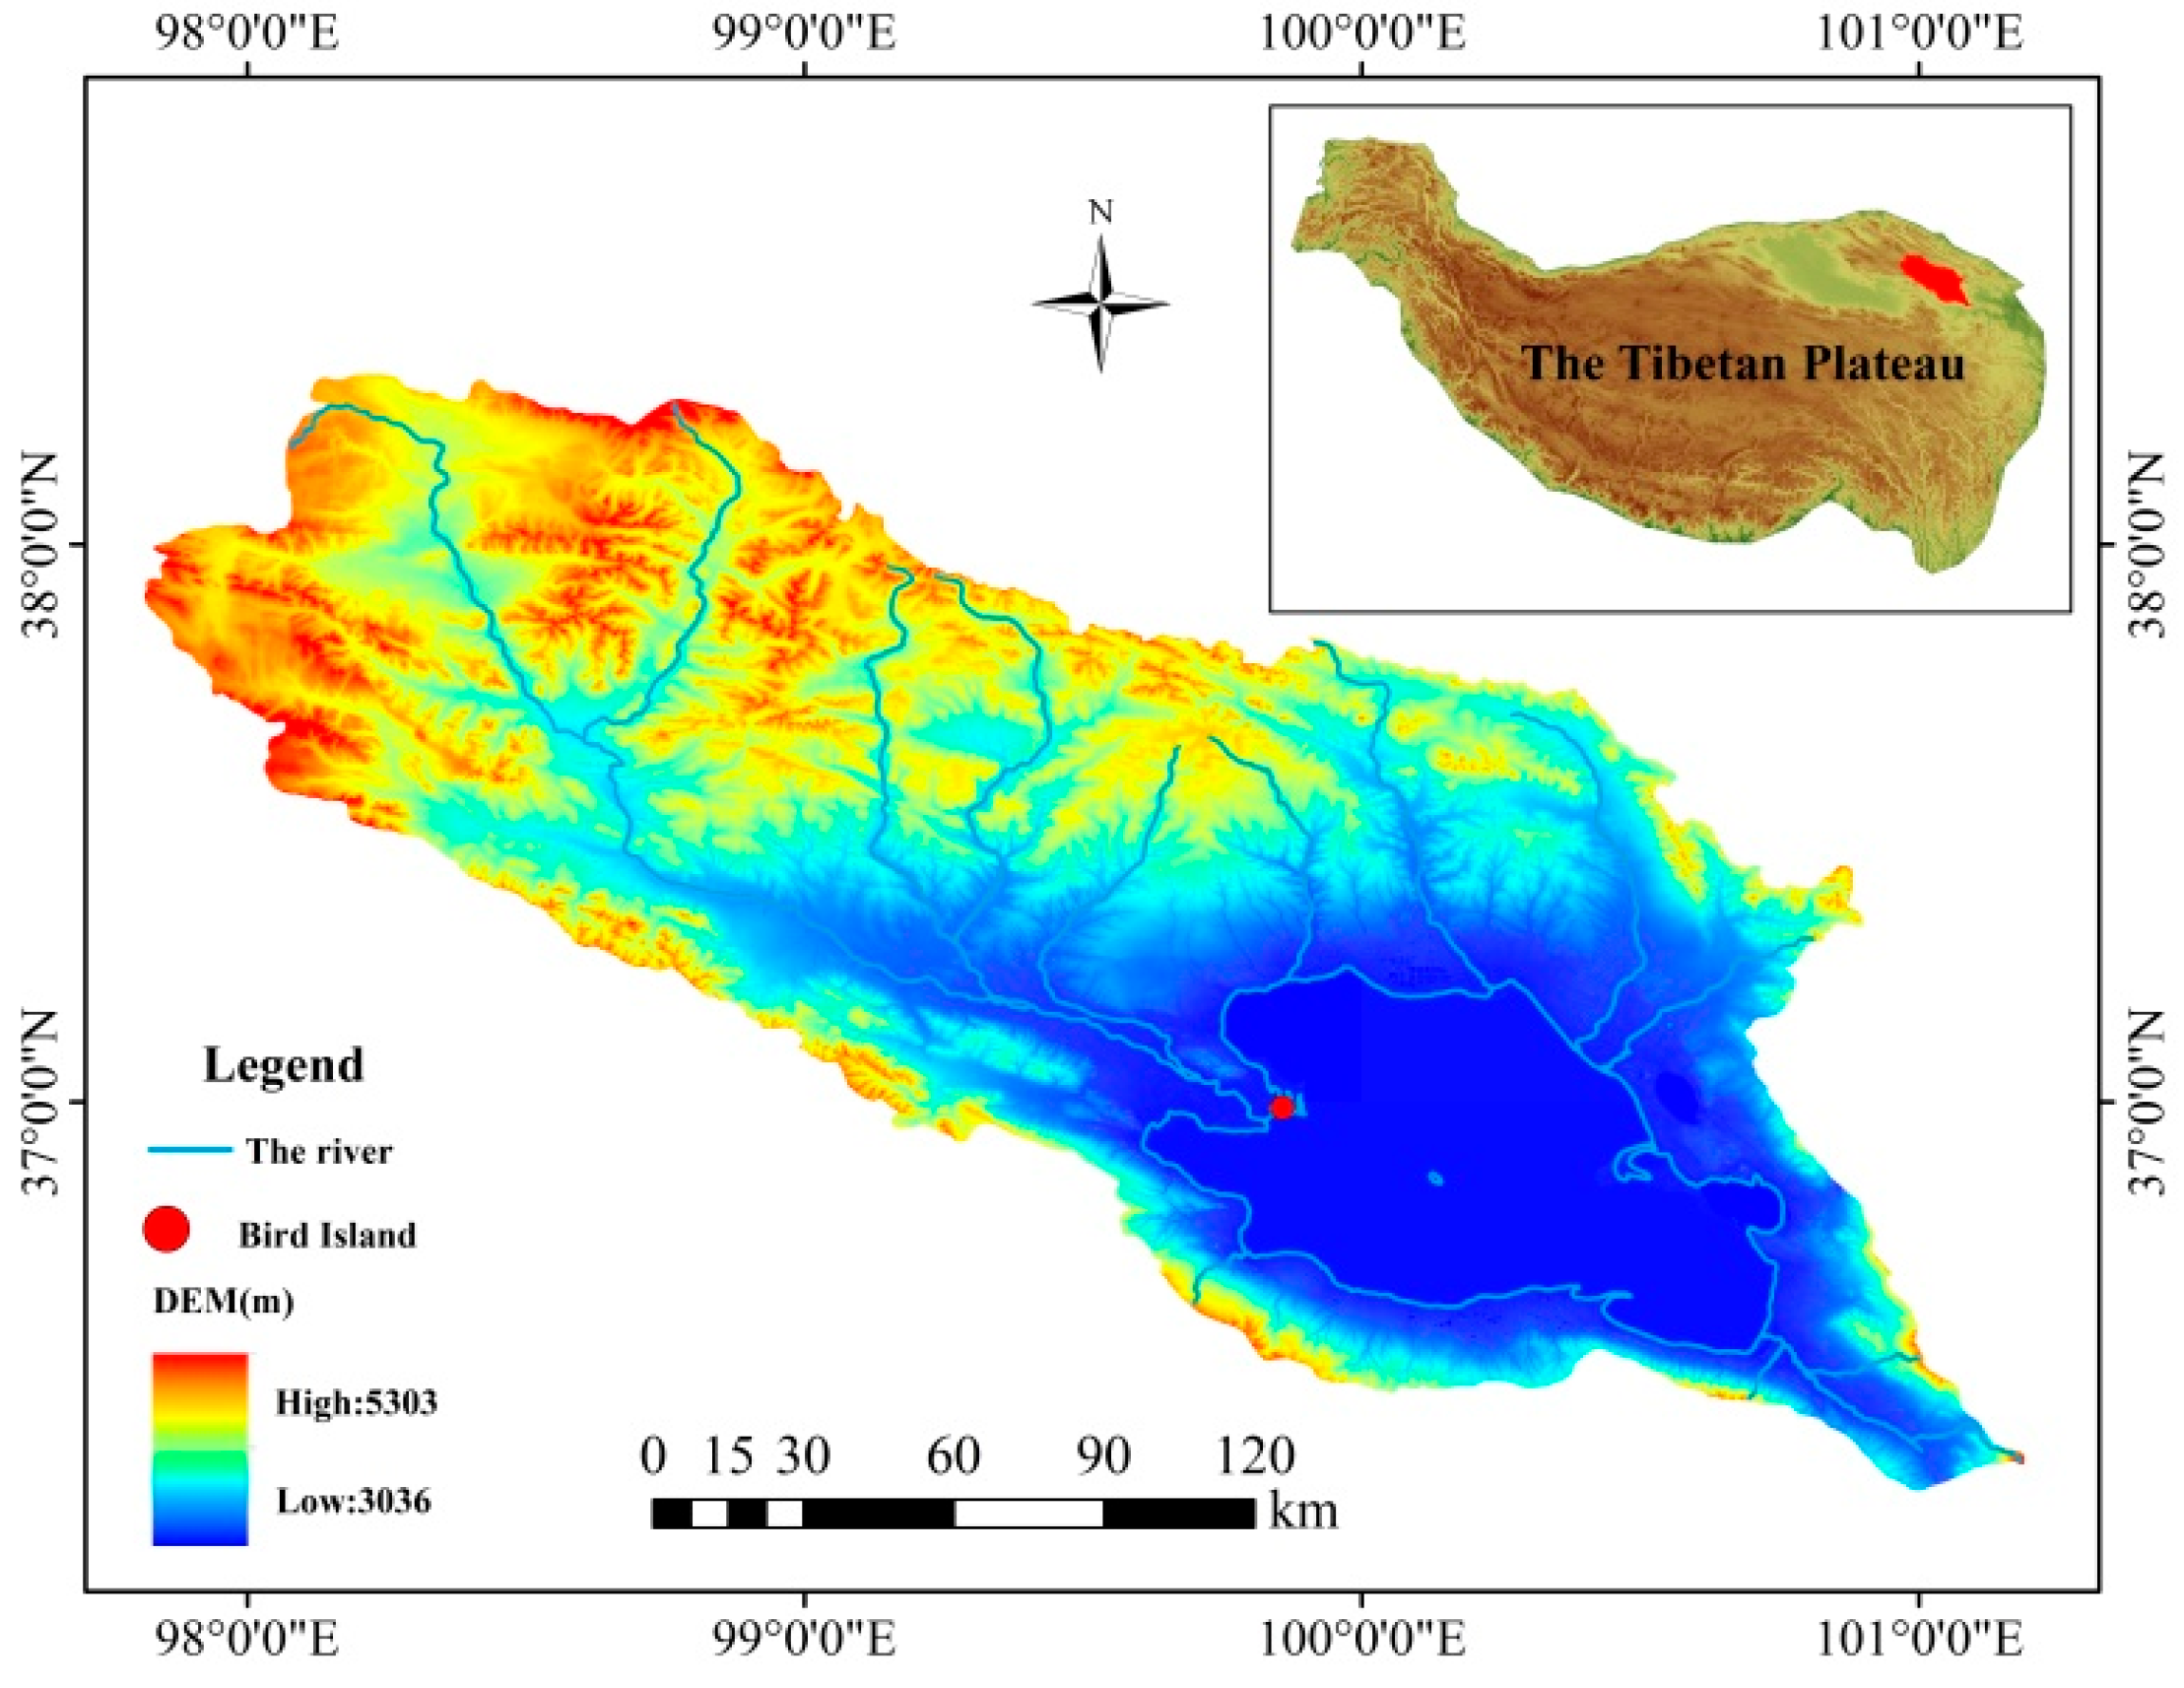
Figure 1. Geographical location of study area.
Sustainability 14 09449 g001
Figure 2. Diagram of continuous monitoring system used to obtain data of soil temperature, soil volumetric moisture content and soil dielectric constant.
Sustainability 14 09449 g002
Figure 3. Diagram of continuous monitoring system used to obtain data of evapotranspiration and meteorological factors.
Sustainability 14 09449 g003
Figure 4. Temporal variations in soil moisture and associated patterns.
Sustainability 14 09449 g004
Figure 5. Temporal variations in soil moisture at different depths.
Sustainability 14 09449 g005aSustainability 14 09449 g005b
Figure 6. Variations in soil moisture of different soil layer depths.
Sustainability 14 09449 g006
Figure 7. Temporal variations in soil temperature.
Sustainability 14 09449 g007
Figure 8. Temporal variations in soil temperature at different depths and associated patterns.
Sustainability 14 09449 g008aSustainability 14 09449 g008b
Figure 9. Variations in soil temperature at different depths and associated patterns.
Sustainability 14 09449 g009
Figure 10. Temporal variations in soil conductivity and associated patterns.
Sustainability 14 09449 g010
Figure 11. Variation in soil conductivity at different depths and associated patterns (AVG: average, SD: standard deviation).
Sustainability 14 09449 g011aSustainability 14 09449 g011b
Figure 12. Variations in soil conductivity at different depths and associated patterns.
Sustainability 14 09449 g012
Figure 13. Correlations between climate factors and soil temperature, moisture, and conductivity at the Bird Island sampling site (SC-soil moisture; ST-soil temperature; EC-soil conductivity; T-air temperature; RH-air relative humidity; FS-wind speed; E-evapotranspiration; FX-wind direction); *** indicates a significant correlation at the level of 0.001; ** indicates a significant correlation at the level of 0.01; * indicates a significant correlation at the level of 0.05.
Sustainability 14 09449 g013
Figure 14. Results of redundancy analysis of the influence of climate factors (red) on soil temperature, moisture and conductivity (blue) at the Bird Island sampling site (the angle between the arrows represents the correlation between soil temperature, moisture, conductivity and climate factors; an angle of less than 90° between the variables indicates a positive correlation and an angle of more than 90° between the variables indicates a negative correlation; the length of arrows represents the strength of the influencing factors, the longer the arrow the stronger the influence); (SC-Soil moisture; ST-soil temperature; EC-soil conductivity; T-air temperature; RH-air relative humidity; FS-wind speed; E-evapotranspiration; FX-wind direction).
Sustainability 14 09449 g014
Table 1. Climate factors accounting for changes in soil temperature, moisture, and electrical conductivity at various levels.
Climate FactorsDegree at Which Individual Factors Accounted for the Change (%)F Valuep Value
Air temperature3575.80.002
Relative humidity11.433.80.002
Wind direction6.7160.002
Wind speed1.54.70.022
Evapotranspiration0.61.90.15
Publisher’s Note: MDPI stays neutral with regard to jurisdictional claims in published maps and institutional affiliations.