Article

Dynamics of Fire Foci in the Amazon Rainforest and Their Consequences on Environmental Degradation

by
Helvécio de Oliveira Filho
1,
José Francisco de Oliveira-Júnior
1,2,*,
Marcos Vinícius da Silva
3,
Alexandre Maniçoba da Rosa Ferraz Jardim
3,
Munawar Shah
4,*,
João Paulo Assis Gobo
5,
Claudio José Cavalcante Blanco
6,
Luiz Claudio Gomes Pimentel
7,
Corbiniano da Silva
8,
Elania Barros da Silva
1,
Thelma de Barros Machado
1,
Carlos Rodrigues Pereira
1,
Ninu Krishnan Modon Valappil
9,
Vijith Hamza
10,
Mohd Anul Haq
11,
Ilyas Khan
12,
Abdullah Mohamed
13 and
El-Awady Attia
14,15
1
Postgraduate Program in Biosystems Engineering Department (PGEB), Fluminense Federal University (UFF), Niterói 24210-240, Rio de Janeiro, Brazil
2
Institute of Atmospheric Sciences (ICAT), Federal University of Alagoas (UFAL), Maceió 57072-260, Alagoas, Brazil
3
Department of Agricultural Engineering, Federal Rural University of Pernambuco (UFRPE), Dom Manoel de Medeiros avenue, SN, Dois Irmãos, Recife 52171-900, Pernambuco, Brazil
4
Department of Space Science, GNSS and Space Education Research Lab, National Center of GIS and Space Applications, Institute of Space Technology, Islamabad 44000, Pakistan
5
Department of Geography, Federal University of Rondônia–UNIR, Porto Velho 76812-020, Rondônia, Brazil
6
School of Environmental and Sanitary Engineering, Federal University of Pará–FAESA/ITEC/UFPA, Av. Augusto Corrêa, 01, Belém 66075–110, Pará, Brazil
7
Department of Meteorology, Federal University of Rio de Janeiro (UFRJ), Rio de Janeiro 23897-000, Rio de Janeiro, Brazil
8
Civil Engineering Program, Federal University of Rio de Janeiro (UFRJ), Rio de Janeiro 21941-909, Rio de Janeiro, Brazil
9
Department of Atmospheric Sciences, Institute of Astronomy, Geophysics and Atmospheric Sciences, University of São Paulo, Rua do Matão, 1226, São Paulo 055508-090, SP, Brazil
10
Kerala State Disaster Management Authority, Thiruvananthapuram 695033, Kerala, India
11
Department of Computer Science, College of Computer and Information Sciences, Majmaah University, Al-Majmaah 11952, Saudi Arabia
12
Department of Electrical Engineering, Department of Mathematics, College of Science Al-Zulfi, Majmaah University, Al-Majmaah 11952, Saudi Arabia
13
University Research Centre, Future University in Egypt, New Cairo 11745, Egypt
14
Department of Industrial Engineering, College of Engineering, Prince Sattam bin Abdulaziz University, Al Kharj 16273, Saudi Arabia
15
Mechanical Engineering Department, Faculty of Engineering (Shoubra), Benha University, Cairo 11511, Egypt
*
Authors to whom correspondence should be addressed.
Sustainability 2022, 14(15), 9419; https://doi.org/10.3390/su14159419
Submission received: 1 July 2022 / Revised: 25 July 2022 / Accepted: 26 July 2022 / Published: 1 August 2022

Abstract

:
Burns are common practices in Brazil and cause major fires, especially in the Legal Amazon. This study evaluated the dynamics of the fire foci in the Legal Amazon in Brazil and their consequences on environmental degradation, particularly in the transformation of the forest into pasture, in livestock and agriculture areas, mining activities and urbanization. The fire foci data were obtained from the reference satellites of the BDQueimadas of the CPTEC/INPE for the period June 1998–May 2022. The data obtained were subjected to descriptive and exploratory statistical analysis, followed by a comparison with the PRODES data during 2004–2021, the DETER data (2016–2019) and the ENSO phases during the ONI index for the study area. Biophysical parameters were used in the assessment of environmental degradation. The results showed that El Niño’s years of activity and the years of extreme droughts (2005, 2010 and 2015) stand out with respect to significant increase in fire foci. Moreover, the significant numbers of fire foci indices during August, September, October and November were recorded as 23.28%, 30.91%, 15.64% and 10.34%, respectively, and these were even more intensified by the El Niño episodes. Biophysical parameters maps showed the variability of the fire foci, mainly in the south and west part of the Amazon basin referring to the Arc of Deforestation. Similarly, the states of Mato Grosso, Pará and Amazonas had the highest alerts from PRODES and DETER, and in the case of DETER, primarily mining and deforestation (94.3%) increased the environmental degradation. The use of burns for agriculture and livestock, followed by mining and wood extraction, caused the degradation of the Amazon biome.

1. Introduction

In connection with human activities, forest fires have been occurring for thousands of years. Globally, due to the devastation they cause in different regions of the planet, they are considered major disturbances [1], whose average burned area reached 363.41 × 10⁶ ha between 2015 and 2019 [2]. Largely related to deforestation, land management [3] and climate change [4], most fires are caused by humans, and are associated with the role that fire plays as a tool management for new land uses [5], where the conversion of forest areas, mainly through deforestation, drives other human activities: expansion of frontiers for agriculture and pasture and the increase in urbanization. In this sense, fires act as catalysts for changes in the terrestrial ecosystem [6].
With the combination of high temperatures, low relative humidity and strong winds, which in general cause fires, ideal conditions are created for their propagation [7,8]. The increase between hot days and dry seasons, followed by shorter and/or longer dry seasons, contains lower or higher probability of vegetation flammability [9]. The increase in pressure from human activities is one of the main factors that amplifies the consequences of fire actions, increasing the global average duration of fire events [10], where climate warming conditions become indicators that favor the creation of areas more prone to fire and increase its impacts [11]. Extending on a global, regional and local scale, the consequences of fires are a significant concern worldwide, which incorporates in an integrated way the various environmental, socioeconomic and social aspect, causing different impacts: on climate and air quality; on water quality, economic losses and human casualties [12,13,14,15,16,17,18,19]; and on human health [20], among others.
Burned forests and forest fires in the Legal Amazon cause profound changes in the landscape of the natural forest, and such practices aim to transform areas for agriculture, intensive livestock, logging and, currently, mining [21,22,23]. Forest fires in the Legal Amazon result in increased air pollution and worsening of local and regional air quality. In addition, there are interferences in the patterns of the humidity corridor that will feed the watersheds, and such remote effects have been felt in recent decades in the southeast, south and central-west regions of Brazil [17,18,19,20]. In the Amazon, most fires occur between July and November—the dry season [21], a period in which the risks of reduced groundwater and surface moisture are high [22]. In addition, climate variability potentiates the relationship between drought and fires worldwide, influenced by the Atlantic Multidecadal Oscillation (AMO), the El Niño-Southern Oscillation (ENSO) and the Pacific Decadal Oscillation (PDO) [23].
The complex consequences caused by forest fires reveal the essential need for constant mapping/management of the potential for their occurrence and impacts on short-, medium- and long-time scales [6], a process whose application of resources aiming at forecasting of associated hazards and their emissions is essential. Although wider areas pose obstacles in their mapping, mainly due to cloud cover, making early detection and evaluation of their effects in these territories difficult, the location and extent of fires, burned areas and their emissions have been determined from satellite products [24].
Considering the scales and characteristics of fires, different methods and satellite technologies have been promising in detecting their sources and evaluating their impacts [8]. Fire foci are used to assess fires in South America (SA) and across the planet from data from orbital platforms [15,16]. In large areas, satellites with low spatial resolution and high temporal resolution (AQUA, NOAA, TERRA, etc.) are the main source of data on these phenomena [8,9,10,11,12,13,14,15]. The integration of sensors with data of high spatial resolution and low temporal resolution (for example, GOES-16) already allows, even in remote regions, the faster detection of fires, a relevant factor in the monitoring and evaluation of emissions, aiming at safety actions, prevention, planning and emergency to the negative effects caused [25,26].
In SA and Brazil, the National Institute for Space Research (INPE), through the Burning Database System (BDQueimadas), provides real-time data on fire foci and fire risk, based on data recorded by environmental satellites [15,27]. Through the Amazon Deforestation Calculation Program (PRODES) and the Real Time Deforestation Detection System (DETER), monitoring is carried out, evaluating the annual rate of shallow deforestation in the Brazilian Amazon [28]. The PRODES project monitors clear-cut deforestation via satellite in the Legal Amazon [28]. The DETER system is used to support inspections, where alerts are issued fortnightly and forwarded to the Brazilian Institute for the Environment and Renewable Natural Resources (IBAMA) and the Environment secretariats of the states that make up the biome. These systems make it possible to distinguish between the moment of occurrence and the moment of problem detection [29].
Several studies on the subject of fires have been carried out in the Amazon. However, few relate in integrated way deforestation, fires via environmental reference satellites, geoenvironmental and sociodemographic data. Therefore, the objective of the study is to evaluate the dynamics of fire foci obtained through environmental satellites in the Amazon and their consequences on environmental degradation, mainly in the transformation of the forest into pasture, in livestock and agriculture areas, mining activities and urbanization.

2. Materials and Methods
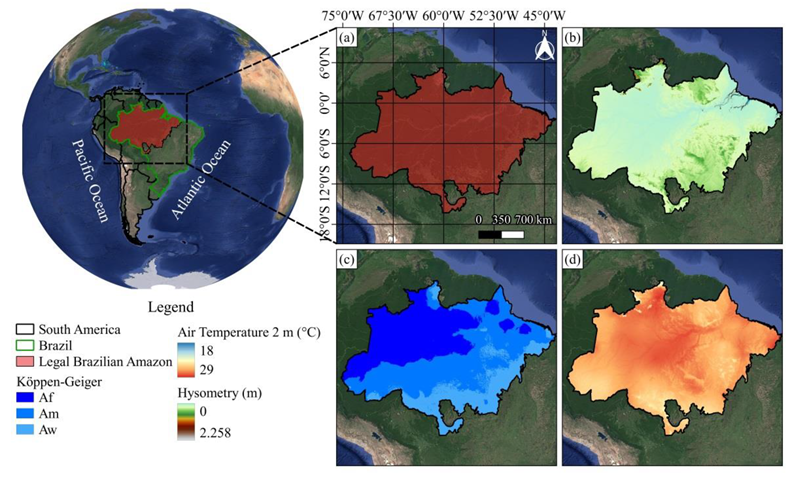
2.1. Study Area

The study region encompasses the Legal Amazon, whose area of 5,015,067,749 km2 comprises approximately 59% of the Brazilian territory and includes eight states: Acre (AC), Amapá (AP), Amazonas (AM), Mato Grosso (MT), Pará (PA), Rondônia (RO), Roraima (RR), Tocantins (TO) and part of the state of Maranhão (MA) (west of the 44° W meridian), which total a population of 29.6 million inhabitants [30], and for a total of 3 of the 5 Brazilian regions (north, northeast, and midwest) (Figure 1). The Legal Amazon region has three subclimates according to the Köppen–Geiger climate classification—“Af”, “Am” and “Aw” [31]—an air temperature range between 21 and 42 °C (minimum and maximum, respectively), and an annual average of 28 °C. Additionally, it is characterized by having relatively high humidity throughout the year, which favors the formation of vegetation cover.

2.2. Fire Foci

The fire foci time series data used in this study included records from June 1998 to May 2022 and from the reference satellites of the Burning Database (BDQueimadas) of the Center for Weather Forecasting and Climate Studies/National Institute for Space Research (CPTEC/INPE), available online at the following electronic address: http://queimadas.dgi.inpe.br/queimadas/portal-static/estatisticas_estados/ (accessed on 4 June 2022) [28].

2.3. Applied Statistic

In the study, descriptive, exploratory and multivariate statistics were applied to the time series of fire foci and to socioeconomic and demographic data. Descriptive statistics include the mean, median, maximum, minimum, standard deviation (SD), percentage (%) and coefficient of variation (CV, %). Exploratory statistics were based on the boxplot. All statistical procedures were performed using Microsoft Excel and ORIGIN Pro software version 8.6 [32].
A principal component analysis (PCA) was applied to identify which variables (e.g., land-use/land-cover (LULC) and PRODES) have the greatest influence on the fire foci and dynamics of vegetation and land use and occupation from 1998 to 2019. This method allows for a reduction in the data set in orthogonal and noncorrelated variables, which can help clarifying most of the total variation within the data [33,34,35]. We used the Kaiser criterion, which assigns eigenvalues above 1.0 for better reliability of the principal components generated [36]. Finally, a Pearson correlation analysis was performed to identify the variables with the highest correlation [37]. All analyzes were performed using the R software [38].

2.4. Deforestation Monitoring Data (PRODES and DETER)

PRODES comprised the time series of annual deforestation data from 1998 to 2019 and was obtained using the INPE platform. Available online: (http://www.dpi.inpe.br/prodesdigital) (accessed on 4 June 2022). The DETER resource included data from 2016 to 2019 and was collected from the INPE platform. Available online: (http://terrabrasilis.dpi.inpe.br/app/map/alerts) (accessed on 4 June 2022). In this study, the data from both PRODES and DETER were compared with the fire foci data.

2.5. Biophysical Parameters

The study used reflectance data from the MODIS sensor (Terra–MOD09A1 and Aqua–MYD09A1, version 6) with temporally representative cloudless images. Product reflectance data from the MODIS sensor (Terra–MOD09A1 and Aqua–MYD09A1, version 6) library with temporally representative cloud-free images were used in the study. The MODIS images were automatically processed by means of the Google Earth Engine (GEE) digital cloud platform. Available online: (https://earthengine.google.com/) (accessed on 4 June 2022). GEE is a library with multiple functions of mathematical analysis and computational modeling and machine learning operations.
The Normalized Difference Vegetation Index (NDVI) was generated using the near infrared (NIR) (0.851–0.879 μm) and red (0.636–0.673 μm) bands (Equation (1)). Commonly, the NDVI can take values between 1 and +1; the higher the NDVI value, the more “green/healthy” the vegetation is. On the other hand, the lower the NDVI values, the lower the photosynthetically activity of the species; in addition, values from −1 to 0 represent water cups [39].
NDVI = N I R R e d N I R + R e d
The surface albedo was calculated as a function of the multispectral reflectance bands, using weight coefficients suggested by Tasumi et al. [40]. The coefficients for the MODIS sensor are determined based on solar radiation at the surface, specifically for use in operational energy balance applications, representing each of the seven MODIS bands. Each weight coefficient is acquired by the ratio between the specific solar constant of the multispectral band and the sum of all bands of the reflectance product. These values are calibrated for different types of land cover and land use associated with each of the multispectral reflectance bands [41,42]. The surface albedo is estimated from the product of the MODIS sensor, which is the spectral reflectance of the surface, according to Equation (2) [43].
α sup = 0 . 215   ×   r 1   + 0 . 215   ×   r 2 + 0 . 242   ×   r 3 + 0 . 129   ×   r 4 + 0 . 101   ×   r 5 + 0 . 062   ×   r 6 + 0 . 036   ×   sup 7
wherein, α sup—surface albedo; numerical values—weight coefficients referring to each multispectral band of the MODIS sensor product (e.g., Tasumi et al. [40]); r1, r2, r3, r4, r5, r6 and r7—correspond to the multispectral bands of the reflectance product.
The leaf area index (LAI, m2 · m−2) is estimated as a function of soil-adjusted vegetation index (SAVI), functioning as an indicator of the amount of plant biomass and other characteristics of the plant cover, such as moisture conditions; see Equation (3) [43,44].
LAI = ln 0 . 69 SAVI 0 . 59 0 . 91
In the procedure for estimating the biophysical parameter of the surface temperature, correction/calibration factors and multiplier and additional compensation factors are applied referring to the MODIS sensor product, daytime temperature of the Earth’s surface. Available online: (https://modis.gsfc.nasa.gov/data/dataprod/mod11.php) (accessed on 5 June 2022). The surface temperature product is estimated from the emissivity (thermal) bands 31 and 32, which, in turn, are estimated from the mathematical modeling as a function of the types of land cover and land use, pixel by pixel of the MODIS image [43,44]. The L3 processing level offers spatially resampled products, variables in uniform grids at various spatial and temporal resolutions.
The actual evapotranspiration (ETa) product is based on the Penman–Monteith equation [45,46], with the principle of inserting daily meteorological reanalysis data associated with the dynamics of vegetation properties, albedo and cover from the ground, from MODIS remote sensing data products [47]. For all images, the multiplier factor referring to the product of the MODIS sensor of real evapotranspiration (ET). Available online: (https://modis.gsfc.nasa.gov/data/dataprod/mod16.php) applies (accessed on 5 June 2022).
The product of the ETa of the MODIS sensor (Terra–MOD16A2 and Aqua–MYD16A2, version 6) provides the sum of the ETa in a period composed by pixel by pixel values referring to 8 days. The ETa layer has geophysical data starting in 2001 to the present [43,48].

2.6. ENSO Data

In this study, information on the occurrence of El Niño-Southern Oscillation (ENSO) was obtained from the database of the National Oceanic and Atmospheric Administration/Climate Prediction Center-NOAA/CPC [49]. The years of El Niño, La Niña and Neutral during 1998–2022 were classified as hot (red) and cold (blue), based on a limit of ±0.5 °C of the sea surface temperature (SST) of the Equatorial Pacific in the El Niño 3.4 region, available at: http://www.cpc.ncep.noaa.gov/products/analysis_monitoring/ensostuff/ensoyears.shtml (accessed on 5 June 2022). In addition, the ENSO phases were evaluated based on the Oceanic Niño Index (ONI) [49].

2.7. Burned Areas Via Fire MapBiomas

The burned area in the Brazilian Legal Amazon is characterized for the years 2004, 2005, 2007, 2010, 2015 and 2019, based on fire scar estimates performed by MapBiomas, which has processed over 150 thousand images generated by Landsat 5, 7 and 8/OLI satellites from 1985 to 2020. The MapBiomas platform, with the help of artificial intelligence, analyzed the burned area in each 30 × 30 m pixel of the more than 8.5 million square kilometers of Brazilian territory over the 36 years between 1985 and 2020, regardless of LULC [50].
Fire data in annual, monthly and cumulative maps, and statistics for any period between 1985 and 2020, are available at the following link. Available online: (https://plataforma.brasil.mapbiomas.org/) (accessed on 4–10 June 2022) [50]. The platform also includes fire frequency data, indicating the areas most affected in the last 36 years. The resolution is 30 m, with an indication of the type of cover and use of the land that burned, allowing territorial and land divisions by biome, state, municipality, watershed, conservation unit, indigenous land, settlements and areas with Rural Environmental Registry (RER).

3. Results

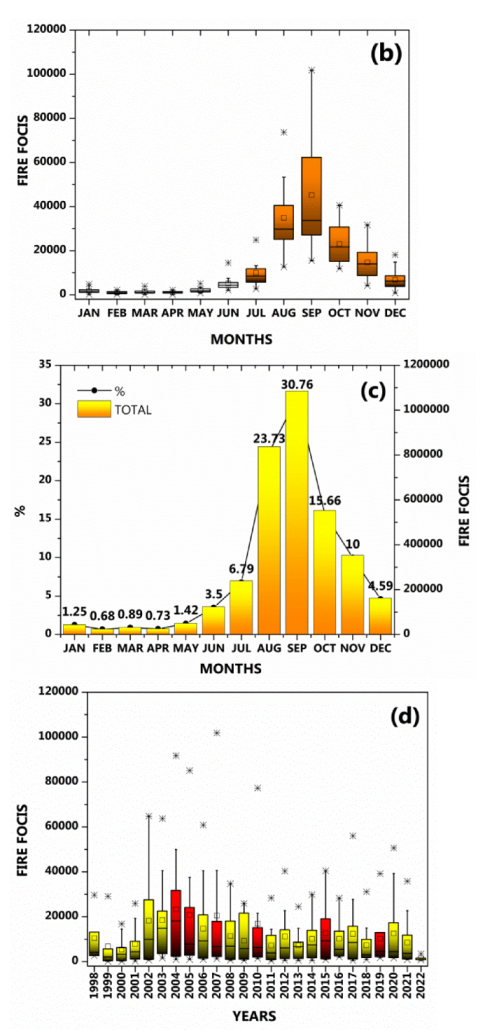
3.1. Statistical Analysis

Orbital monitoring in the Legal Amazon (141,130.8 ± 68,423.05 foci) recorded a total of 3,528,270 foci from June/1998 to May/2022. According to Figure 2a, the largest annual records of fire foci occurred in 2002 (6.18%), 2003 (6.30%), 2004 (7.81%), 2005 (7.48%), 2007 (7.47%) and 2010 (6.12%) (see Table 1). These years cover 41.36% of fire foci in the time series. The years that were above the media correspond to the range from 2002 to 2010.
Figure 2b exhibits the monthly variation of fire foci via boxplot. There is a high variability of fire foci from July to November, and the highest interquartile ranges (IQR) were in August and September, corresponding to the dry season of the Legal Amazon. Figure 2c exhibits on the monthly scale that July (6.79%), August (23.73%), September (30.76%), October (15.66%), November (10.00%) and December (4.59%) exhibited the greatest records of fire foci. The lowest values of fire foci in the Legal Amazon were found in both the initial and the final recorded years over the studied period (see Figure 2d). It is worth mentioning the inclusion of the previously mentioned environmental satellites in BDQueimadas from 1998 to present.
Table 1 presents the statistical results of the annual fire foci within the Legal Amazon. The largest SD from the annual averages of fire foci occurred in 2002, 2003, 2004, 2005, 2007 and 2010, corresponding to the highest percentages recordings (Figure 2c). Again, both years cited were influenced by the performance of El Niño and El Niño/La Niña (see Table 1), with emphasis on the total fire foci for the respective years.
The percentages of the fire foci over the studied period were less than 10%, while 2004 demonstrated one of the highest records of fire foci in comparison to the other years (Table 1). PROARCO (Programa de Prevenção e Controle as Queimadas e aos Incêndios Florestais no Arco do Desflorestamento) and IBAMA data showed that the NOAA-12 satellite detected 116,574 fire foci until September in the region, which represents a 19% growth compared to the same previous period. It is important to highlight the influence of El Niño in the biannual cycle (2003/2004) and the deforestation records, carried out by the PRODES/INPE system (2020), and in that same period in the Legal Amazon, in which the highest rate of deforestation occurred in the respective years, with the loss of 25,396 km2 and 27,772 km2 of forest in 2003 and 2004, respectively. The El Niño event, together with the deforestation, contributes to the increase in medians in the time series of fire foci.
The CVs obtained in the time series were greater than 100%; the exceptions were the years 1998 (initial), 2016 and 2022 (final). We highlight the years 1999 (141.9%), 2005 (132.5%), 2007 (146.7%), 2010 (145.8%), 2017 (131.3) and 2020 (132.0) as having the highest CVs and high data variability. The highlighted years varied between the El Niño and La Niña cycles (Table 1). However, under El Niño episodes, for example, the rainfall regime can decrease by up to 50%. Thus, increasing the likelihood of forest fires (Table 1), it is more than 10% likely that the forest area is flammable during very dry years, such as 2005 and 2010.

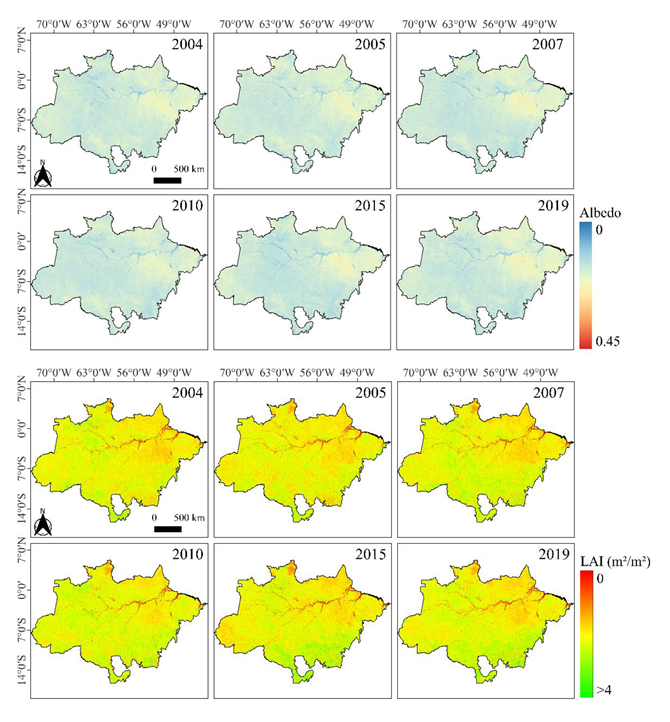
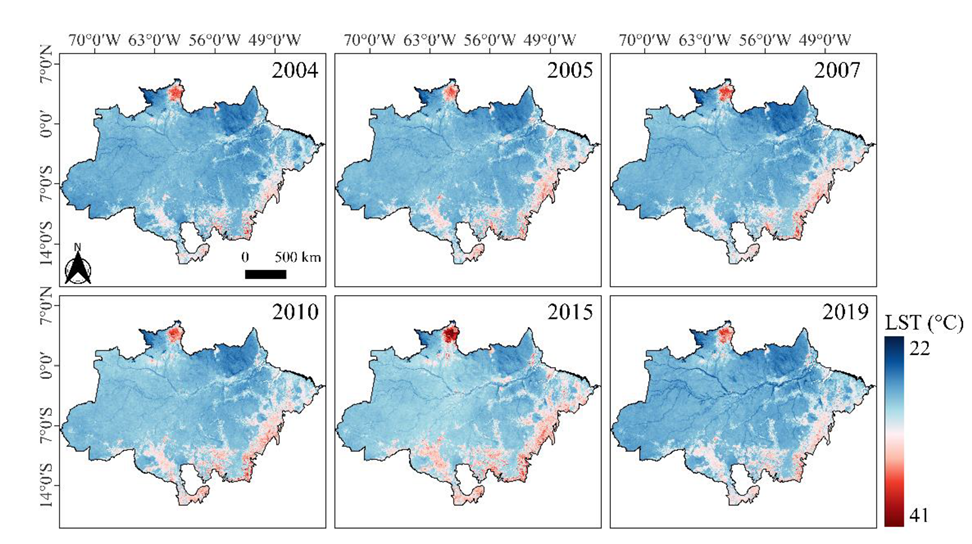
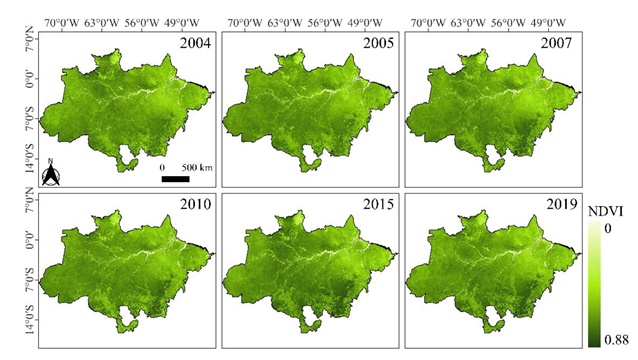
3.2. Biophysical Parameters

Based on the results of statistics applied to the time series of fire foci, the years 2004, 2005, 2007, 2010, 2015 and 2019 were chosen for the analysis of the biophysical parameters of the Legal Amazon. The LAI in the Legal Amazon varied between the central, northern (N) and mainly south (S) and southwest (SW) regions with higher values. Generally, higher values of LAI in the Amazon are associated with the dry season.
As one can observe from Figure 3, the land surface temperature was high (>40 °C) in all years evaluated, highlighting the S and SW regions of the Amazon, mainly the impacts of the three megadroughts (2005, 2010, and 2015), together with the N of states of RR. The drought in 2015 led to extreme warming and soil moisture deficits in some regions, which is attributed to a very strong El Niño.
The change from forest to the deforested area is characterized by the spatial dynamics of ETa, with emphasis again on the S and SW regions of the Legal Amazon and the N of states of RO, such as soil temperature (Figure 4). The decrease in ETa in the years evaluated and, in the regions, mentioned above is due to the performance of the El Niño or El Niño/La Niña cycle. The fire foci in the evaluated period were higher in the years 2004, 2005 and 2007. This is due to the reference satellite of the time (NOAA 12) that used the MODIS sensor; on the contrary, the fire foci were lower in the years 2010, 2015 and 2019 with the changes to the AQUA and TERRA orbital platforms and the NBR sensor.

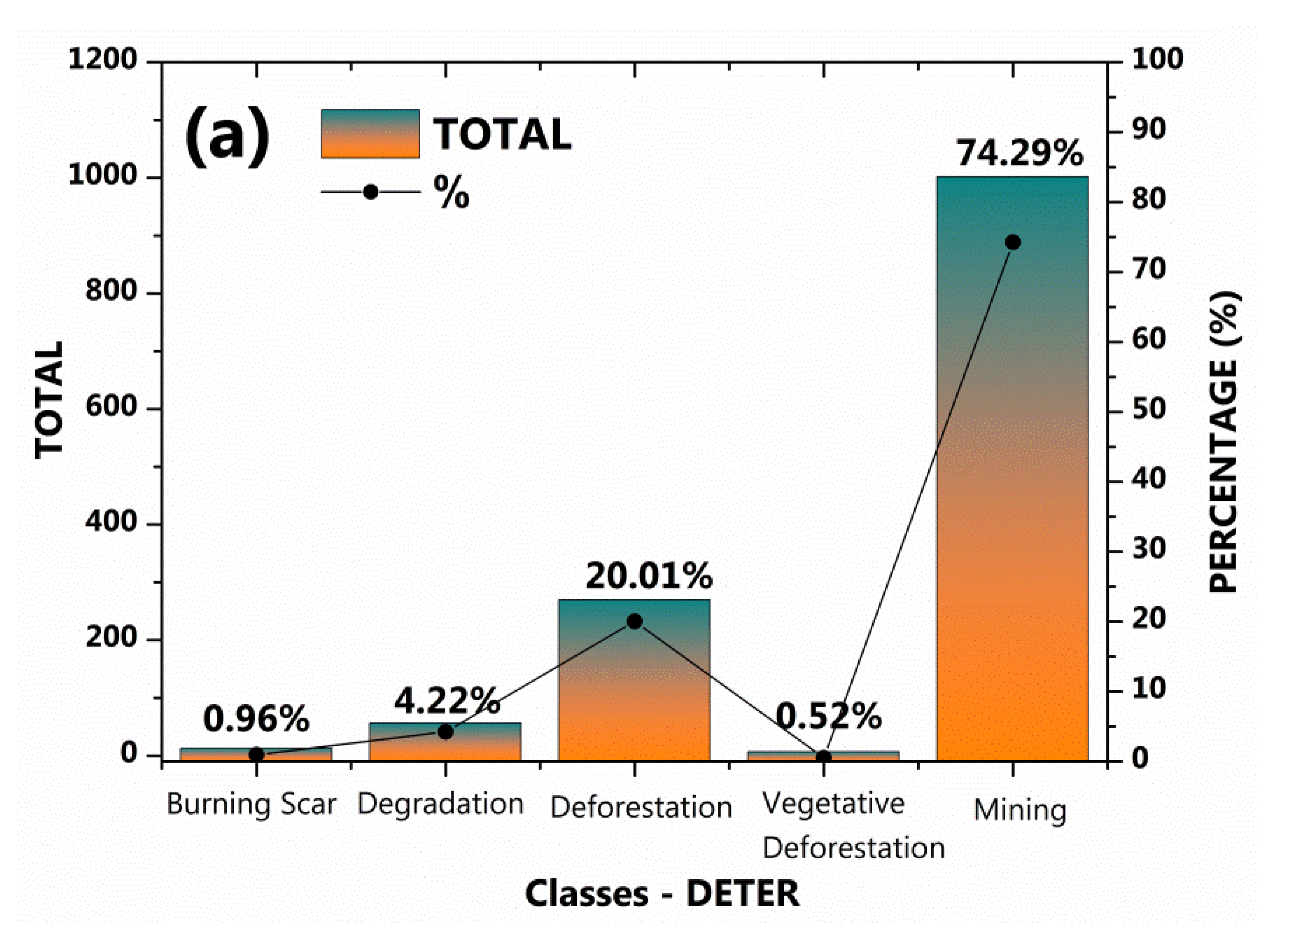
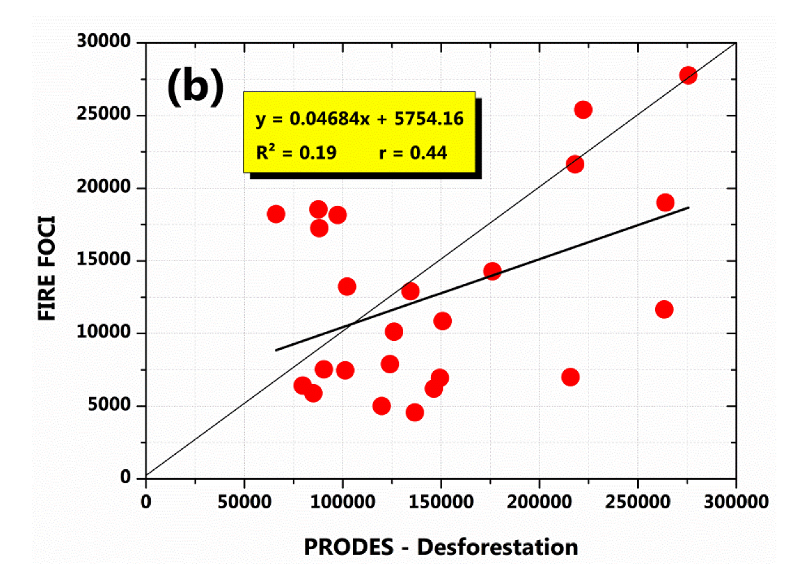
3.3. Fire Foci Versus Deforestation (PRODES/DETER)

The records obtained via PRODES for 1998–2019 indicated a deforested area of 279,942 km2 in the Legal Amazon, with a total of 3,274,260 fire foci records. Therefore, the PRODES system alone is insufficient to prevent, inspect and combat deforestation. Hence, INPE implemented the DETER system in 2004. According to INPE, areas of deforestation and degradation warning included 2072.03 km2 in June 2019 (Table 2).
Table 2 shows the DETER system alert areas (deforestation and degradation) in the Legal Amazon in June 2019. The largest extensions of deforestation were displayed in the State of MT, with a cumulative deforested area of 153.55 km2 and a cumulative area of 1025.58 km2 of deforestation and degradation areas. Next was the State of PA with a total of 446.56 km2 of deforested areas and a total of 577.25 km2 of deforested and degraded area, followed by the State of Amazonas with a total of 193.28 km2 and 228.44 km2 of the area of deforested and both deforested and degraded areas, respectively. The states consisting of the smallest areas for deforestation alerts by means of the DETER systems were AP (0.3 km2) and TO (0.15 km2).
The data obtained in the period between 2017 and 2018 showed that deforestation in the Legal Amazon increased once more, with a growth of 13.7%. DETER recorded a deforestation rate of 64.86%, and PRODES registered a deforested area of 7536 km2. During 2016–2017, the DETER deforestation rate was 49.75% for an area of deforestation of 6947 km2. According to INPE, PRODES pointed out an area of 6947 km2 of shallow cut in the period during August 2016–July 2017 (Table 3).
Figure 5a shows the categories identified by DETER in the Legal Amazon during the period 2016–2019: mining (74.29%) and deforestation (20.01%) categories were the highest in total and frequency. In the dispersion diagram (Figure 5b), the determination coefficient (R2) explains an accuracy of 19% and the Pearson correlation coefficient (r) is showing 44% correlation between BDQueimadas versus PRODES data (Figure 5b). Thus, 56% of the variability is due to other factors such as climatic, anthropic and errors within the omission and commission of fire foci data, which are common in BDQueimadas CPTEC/INPE. The remaining 56% shows high variability in the dynamics of hotspots in the Legal Amazon, which can be properly explained by the aforementioned factors, since the interactions between them cause forest fires in the region.
Figure 6 presents the PCA of the analyzed variables in the study. The cumulative total change of principal components 1 and 2 (PC1 and PC2) was 49.74%. According to the Kaiser criterion [35], the eigenvalues of the first three components (PC1, PC2 and PC3) were greater than 1 (2.29, 2.18 and 1.20, respectively) and may be used for the generation of the biplot graph. However, the biplot graph was constructed only according to PC1 and PC2 since PC3 presented a total variance of just 13.36% (Supplementary Table S1), while PC1 and PC2 displayed a greater load of information as their explained variance was 25.47% and 24.27%, respectively.
The formation of two distinct groups was observed (Figure 6a). Group 1 (G1) was formed by the forest, fire and mining areas, while group 2 (G2) included the livestock, pasture, agriculture and temporary crops areas. The relations conferred within G1 can be explained by the tendency for the expansion of fires due to the expansion of mining areas, which in turn will directly affect the Amazon rainforest, directly resulting in the responses captured by PRODES. The connection within G2 is common since, with the expansion of livestock, there will be a consecutive expansion of grazing areas, as well as agriculture and an increase in temporary crops; since deforestation is entering pasture areas, there is also the insertion of agriculture as well as temporary crops, based on rotational cropping techniques. Correlating the groups, it is noteworthy that as livestock and agriculture expand, inversely proportional to this, there is a significant reduction in forest areas (Figure 6a,b). In addition, a reduction in forest areas reflects the increase in fire foci (Figure 6a,b).

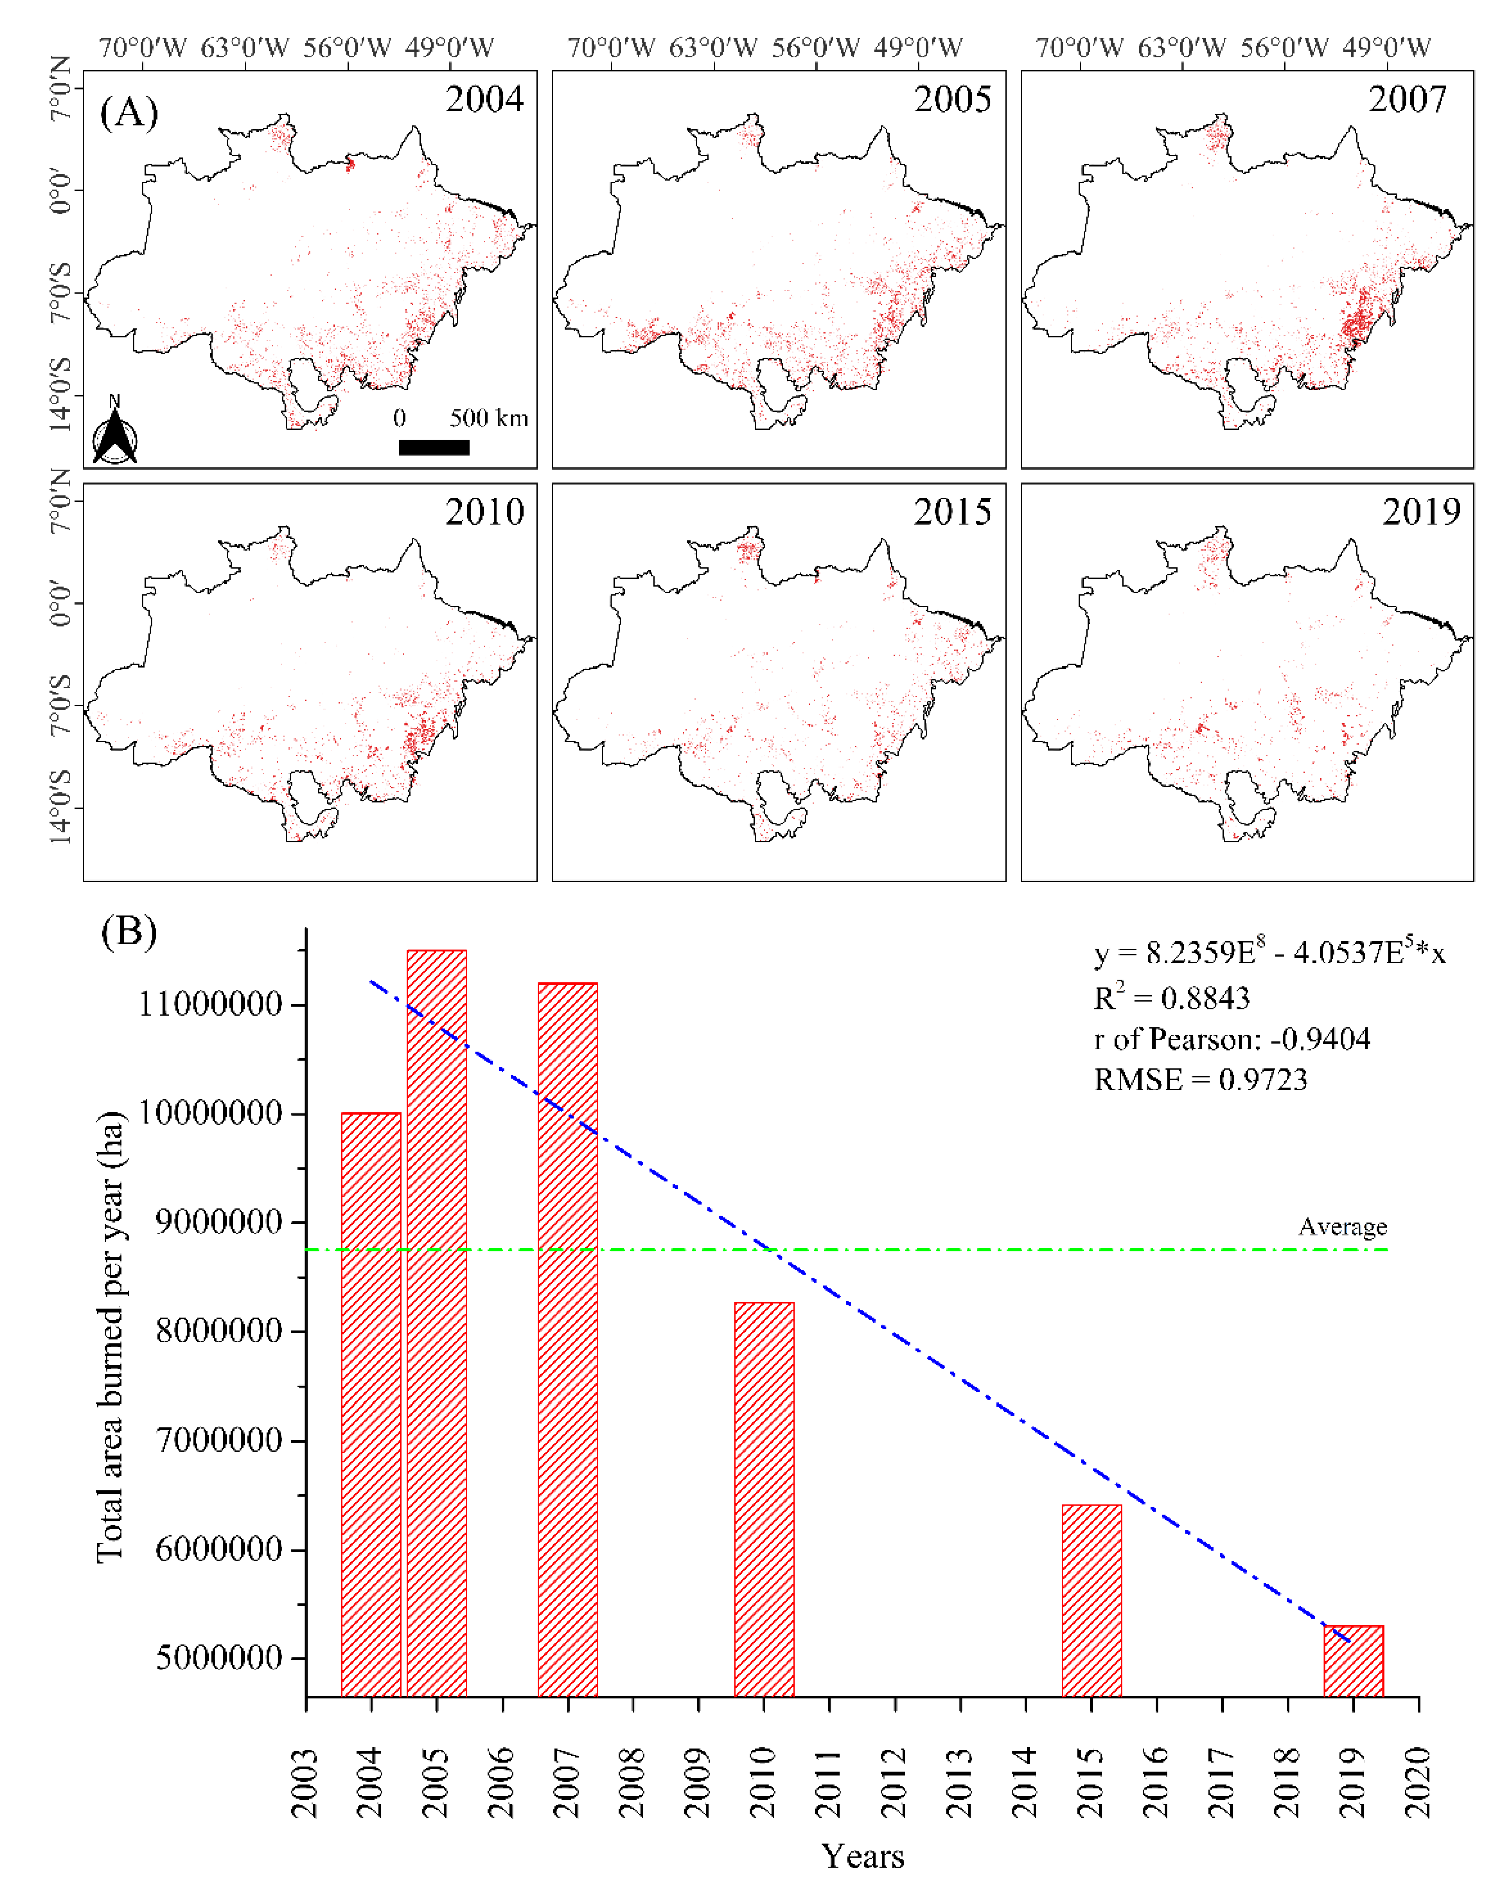
3.4. Dynamics of the Total Annual Burned Area

Figure 7 shows the fire scars for the Legal Amazon (Figure 7A) and the area per hectare burned for the years 2004, 2005, 2007, 2010, 2015 and 2019 (Figure 7B). It was found that in the years 2004, 2005 and 2007, the total area burned in the Legal Amazon was over 10 million hectares, which is higher than the average (8.7 million) of the total years analyzed [43], with a concentration of burned areas in the eastern sector of the Legal Amazon (Figure 7A). Corroborating the above results, the NDVI values (Figure 4) were close to 0 for the year’s corresponding to the highest incidences of burned areas in the Amazon biome. The higher incidences of LST in Figure 3 in the corresponding burned areas also exhibit clear evidence of high fire foci.
The annual values of the total burned areas of the Legal Amazon have a satisfactory coefficient of determination (Figure 7B), indicative of the veracity of the data; they also present an error (RMSE, root mean squared error) close to 0 accentuated in the area (ha) burned for the years evaluated. This occurs as a result of the occupation of the burned areas by agricultural activity, with emphasis on livestock, in which, with the expansion of the burned areas and the same being later occupied by agriculture, it opens borders for the expansion of new burned areas, as well as for an increase in the frequency of fire.

4. Discussion

The years highlighted in the time series correspond to El Niño episodes, for example, moderate El Niño (2001–2002 cycle), weak El Niño (2007) and especially the extreme droughts that occurred in 2005, 2010 and 2015 in the Amazon [51,52,53]. The years that were above the average also correspond to changes in the orbital sensors for detecting hotspots, for example, at the beginning of the time series AVHRR (Advanced Very High-Resolution Radiometer) was used; from 2002 MODIS was used until mid-2012 [15,18,27]. As for the outliers between June and December, such outliers correspond to the Amazon, since most fires occur between July and November—the dry season [21], a period in which the risks of reduced groundwater and surface moisture are high [22].
This highest percentage is directly related to the time of year where the highest amount of forest fires and burns occur, corresponding to the dry season [21,51]. It is well known that August, September and October resemble the critical period of fire incidence not merely within the Amazon region but in Brazil in general [15,54,55], mainly during the ENSO phases episodes (El Niño and/or La Niña), which highly effect the frequency, duration and quantity of rainfall in the south and west of the Amazon basin [52,53,56]. During the wet season, however, the effect is the opposite, and a significant decrease in fire foci is observed, especially from January to May, where rain amounts are increased, moisturizing the forest, making the soil relatively humid, which makes it difficult for the fire to spread. Fires occur every year, with a significant increase during the dry season [9,15], particularly during 2005, 2010 and 2015, since several severe droughts resulted in an exponential increase in forest fires in the Legal Amazon [23,52,54,55]. The ENSO phases are responsible for the variability for rainfall [23,52], which can make the forest dry and consequently prone to fire hazard, comparing to the wet season. In general, droughts in the Amazon are associated with El Niño and the warming of the north tropical Atlantic [51,54,55].
According to Ambiente Brasil [57], the Amazon had the highest record of fire foci in 2004, followed by the highest growth rate of illegal activity (e.g., logging) compared to 2003. El Niño and La Niña episodes influence both the monthly and the annual distribution, in addition to rainfall records and air temperature in the Legal Amazon [58,59]. According to Marengo et al. [56], in February 2010, there was a significant reduction in rainfall in southern Amazonia compared to previous years. Between March and May 2010, there was a decrease in the El Niño event in the Pacific, followed by an increase in the area and magnitude of the SST, with values of 1–2 °C above the typical value in the tropical North Atlantic. This configuration of the Atlantic Ocean contributed to a drought pattern in March 2010. Previously, in 2005, one of the most severe and prolonged droughts of the century occurred, but the impact of the 2010 drought was greater [51,52] and is considered the most severe drought in the Amazon of this century [47,53], being called a megadrought [60]. The influences of the ENSO phases (El Niño/La Niña) cause significant changes in both the dry and rainy seasons, thus interfering with the typical duration of the season in the Legal Amazon [23,52,54,55,61]. According to Nepstad et al. [14], the Amazon rainforest is inflammable during years of usual rainfall.
The year 2019 was the year of the fire crisis in Brazil [62]. As a result, the albedo values ranged from 0 to 0.45 in the Legal Amazon, highlighting the northwest region (NW) and corresponding to the end of the Arc of Deforestation [54,63,64] and the border with the states of MA and TO that are part of the agricultural consortium MATOPIBA [54,64,65], with higher albedo values in the period, especially in 2019, which in turn was highlighted by deforestation and, consequently, the increase in fire foci in the study region.
In this case, there were El Niño events that intensified the dry season in the region [59,60]. There were interannual differences in the spatial distribution of LAI due to the ENSO climate variability mode [66], but anthropogenic changes cannot be ruled out [10,54]. During the 2015/2016 drought in the Amazon, there was a 49.8% reduction in photosynthesis that caused a water deficit [57] and an increase in forest fires [54].
A highlight for the La Niña years with the highest record of fire foci, burned area and carbon emissions in the Amazon was identified by Barbosa et al. [65]. Anthropogenic processes, for example, deforestation, agricultural activities and the use of fire to clean areas, start large fires in the Legal Amazon [16,54]. Nevertheless, regardless of the variability of the records of fire foci, the areas remain concentrated in the Arc of Deforestation [61,65] and on the border of the MATOPIBA agricultural consortium [64].
There was a sharp increase in albedo values in the eastern portion of the Legal Amazon, which corroborates the lower values of LAI. In view of this, it is evident that the lower proportionality in LAI values is characterized as exposed soil surfaces, coming mainly from deforested areas. These are better captured and exposed by the albedo, which is a sensitive index to the Earth’s surface reflectance. Darker surfaces such as water and forests have a much lower albedo, and, consequently, more incident solar radiation is absorbed [67,68,69,70,71,72]. However, in our study, it was observed that the highest albedo values were directly related to exposed soil, while lower albedo values were directly related to the Amazon forest (Figure 3), as this is a more intense active agent in the absorption of water in Amazon biome.
As for the LST values, there was an increase in temperature from 2004 to 2019, with emphasis on the year 2015, which had the highest temperature records in the eastern and northern sectors of the Legal Amazon, an effect resulting from the El Niño phenomenon for the year. Corroborating the results of this study, Oliveira-Júnior et al. [54] and Jardim et al. [35] point out that the effects of the 2015 El Niño strongly worsened the northern region of the Legal Amazon with reduced rainfall in the eastern and northern portions of the Amazon rainforest. This type of phenomenon provides some cyclical droughts for the forest region and increases the problems with fires. In the Brazilian northeast (NEB) there is an incidence of severe droughts, mainly in the Brazilian semiarid region [35,54]. In addition, it is also noted that the regions with the highest incidence of temperature, respectively, result from a higher incidence of albedo. Moreover, there are many modeling studies in the form of spatial and temporal analyses of environmental effects with satellite and ground data [73,74,75,76,77,78,79,80,81,82,83,84,85].
According to Barbosa et al. [65], there is a direct relationship between the increase in burns and the increase in deforestation since the deforested area becomes an easy target for fire, being an open area [14,16], and once burned, the likelihood of reemerging fires increases considerably in the Amazon biome [53]. Interestingly, both states have the largest territorial extensions and the highest population density. CPTEC/INPE [28,86,87,88] published that drought in the Amazon biome region reduces humidity and favors fire spread, along with having the strong correlation between fires and deforestation.
It is worth mentioning that even though deforestation in the Amazon began in the 1970s, it was only in the 1990s that deforestation was acknowledged as a central factor in environmental degradation. These findings corroborate the results by Silva et al. [33], who studied the degradation of the Caatinga biome from 1998 to 2018 and observed that the expansion of livestock provided the expansion of pasture areas as well as agriculture and temporary crops. Corroborating the results of this research, Oliveira-Júnior et al. [54], who evaluated the hotspot scenarios in SA, point out in their results that in the eastern sector of the Amazon biome, there is a greater concentration of fire foci, characterized by greater degraded areas.

5. Conclusions

The study indicates that the variability of the fire foci in the Amazon biome is directly linked to the anthropogenic activities, the economic interests and climatic patterns, mainly during the dry season (August–November), with rainfalls, and during ENSO (El Niño/La Niña) episodes, with increased frequency in burns and fires during the years of El Niño occurrence, which is responsible for 30% of the fire foci in the studied period. The binomial dry seasons in El Niño phase provides extreme and/or prolonged drought events, thus contributing to the forest burning and fires in the Amazon biome. Therefore, the orbital monitoring of fire foci and deforestation via environmental satellites is a fundamental management tool in combating the degradation of the Amazon biome, together with environmental legislation.
The years in which La Niña operates presented the lowest number of fire foci per unit area, which is the opposite situation from the years of El Niño, which demonstrate a significant increase in the number of fire foci per unit area. The southern Amazon region, the border states, and the eastern Amazon biome (Arc of Deforestation) presented the highest density of fire foci in the Amazon biome. The states of Mato Grosso, Pará and Amazonas had the highest alerts from the PRODES and DETER systems, and in the case of DETER, mining and deforestation categories (94.3%) stand out compared to the others during 2016–2019. We also observed changes in the behavior of NDVI and ETa due to the occurrence of forest fires.
The use of burning for profitable activities, agriculture and livestock, followed by mining, has significantly caused environmental degradation in the Amazon rainforest. Importantly, the BDQueimadas, the PRODES and the DETER systems are crucial tools in environmental research and monitoring, forest management and anticipating actions to combat deforestation and forest fires in the Amazon biome. Therefore, in future works we will apply more methods for monitoring other humid forests in the world.
The limitations of the study are summarized in data from fire reports, followed by continuous data on agricultural production and the recommendations and the use of climate models that are based on the new directions and scenarios proposed by the last IPCC report.

Supplementary Materials

The following supporting information can be downloaded at: https://www.mdpi.com/article/10.3390/su14159419/s1, Table S1: Eigenvalue, percentage of variance, and loadings for the first three principal components of the PCA.

Author Contributions

Conceptualization, methodology, writing—review and editing, data curation, H.d.O.F., J.F.d.O.-J., M.V.d.S., A.M.d.R.F.J. and M.S.; software and validation, J.F.d.O.-J., M.V.d.S. and A.M.d.R.F.J.; methodology, investigation, editing and formal analysis, J.P.A.G., C.J.C.B., L.C.G.P., C.d.S., E.B.d.S., T.d.B.M., C.R.P., N.K.M.V. and V.H.; supervision, and visualization, J.F.d.O.-J. and M.S.; project administration, funding acquisition and resources, J.F.d.O.-J., M.S., M.A.H., I.K., A.M. and E.-A.A. All authors have read and agreed to the published version of the manuscript.

Funding

Funding for this study was provided through Majmaah University. The authors thank CPTEC/INPE for providing the fire foci data via BDQueimadas. The second author thanks the National Council for Scientific and Technological Development (CNPq, Brazil) for granting the Research Productivity Scholarship number 309681/2019-7. The sixth author thanks the National Council for Scientific and Technological Development (CNPq, Brazil) for granting the Research Productivity Scholarship number 308147/2021-9. The authors also thank the Coordination of Improvement of Higher Education Personnel (CAPES, Brazil)-Finance Code 001 and Research Support Foundation of the Pernambuco State (FACEPE, Brazil) for granting scholarships and financial support.

Acknowledgments

M.A.H. also would like to thank Majmaah University for providing APC for this paper. M.S wants to thanks IST for a good working environment. We thank anonymous reviewers for their time and comments that helped to improve the quality of this manuscript.

Conflicts of Interest

The authors declare no conflict of interest.

References

  1. Andela, N.; Morton, D.C.; Giglio, L.; Chen, Y.; Van der Werf, G.R.; Kasibhatla, P.S.; Defries, R.S.; Collatz, G.J.; Hantson, S.; Randerson, J.T. A human-driven decline in global burned area. Science 2017, 356, 1356–1362. [Google Scholar] [CrossRef] [PubMed] [Green Version]
  2. Wei, M.; Zhang, Z.; Long, T.; He, G.; Wang, G. Monitoring Landsat based burned area as an indicator of Sustainable Development Goals. Earth’s Future 2021, 9, e2020EF001960. [Google Scholar] [CrossRef]
  3. Andreae, M.O. Emission of trace gases and aerosols from biomass burning—An updated assessment. Atmos Chem. Phys. 2019, 19, 8523–8546. [Google Scholar] [CrossRef] [Green Version]
  4. Amigo, I. When will the Amazon hit a tipping point? Nature 2020, 578, 505–508. [Google Scholar] [CrossRef] [Green Version]
  5. Castellanos, P.; Boersma, K.F.; Van Der Werf, G.R. Satellite observations indicate substantial spatiotemporal variability in biomass burning NO x emission factors for South America. Atmos. Chem. Phys. 2014, 14, 3929–3943. [Google Scholar] [CrossRef] [Green Version]
  6. Farahmand, A.; Stavros, E.N.; Reager, J.T.; Behrangi, A.; Randerson, J.T.; Quayle, B. Satellite hydrology observations as operational indicators of forecasted fire danger across the contiguous United States. Nat. Hazards Earth Sys. Sci. 2020, 20, 1097–1106. [Google Scholar] [CrossRef] [Green Version]
  7. Bondur, V.G.; Tsidilina, M.N.; Cherepanova, E.V. Satellite monitoring of wildfire impacts on the conditions of various types of vegetation cover in the federal districts of the Russian Federation. Izv. Atmos. Ocean. Phys. 2019, 55, 1238–1253. [Google Scholar] [CrossRef]
  8. Shah, M.; Calabia, A.; Tariq, M.A.; Ahmed, J.; Ahmed, A. Possible ionosphere and atmosphere precursory analysis related to Mw > 6.0 earthquakes in Japan. Remote Sens. Environ. 2020, 239, 111620. [Google Scholar] [CrossRef]
  9. Chen, X.; Quan, Q.; Zhang, K.; Wei, J. Spatiotemporal characteristics and attribution of dry/wet conditions in the Weihe River Basin within a typical monsoon transition zone of East Asia over the recent 547 years. Environ. Model. Softw. Environ. Data News 2021, 143, 105116. [Google Scholar] [CrossRef]
  10. Zhang, K.; Ali, A.; Antonarakis, A.; Moghaddam, M.; Saatchi, S.; Tabatabaeenejad, A.; Chen, R.; Jaruwatanadilok, S.; Cuenca, R.; Crow, W.T.; et al. The Sensitivity of North American Terrestrial Carbon Fluxes to Spatial and Temporal Variation in Soil Moisture: An Analysis Using Radar-Derived Estimates of Root-Zone Soil Moisture. J. Geophys. Res. Biogeosciences 2019, 124, 3208–3231. [Google Scholar] [CrossRef]
  11. Liu, Y.; Zhang, K.; Li, Z.; Liu, Z.; Wang, J.; Huang, P. A hybrid runoff generation modelling framework based on spatial combination of three runoff generation schemes for semi-humid and semi-arid watersheds. J. Hydrol. 2020, 590, 125440. [Google Scholar] [CrossRef]
  12. Wang, S.; Zhang, K.; Chao, L.; Li, D.; Tian, X.; Bao, H.; Xia, Y. Exploring the utility of radar and satellite-sensed precipitation and their dynamic bias correction for integrated prediction of flood and landslide hazards. J. Hydrol. 2021, 603, 126964. [Google Scholar] [CrossRef]
  13. Liu, S.; Liu, Y.; Wang, C.; Dang, X. The Distribution Characteristics and Human Health Risks of High- Fluorine Groundwater in Coastal Plain: A Case Study in Southern Laizhou Bay, China. Front. Environ. Sci. 2022, 10, 568. [Google Scholar] [CrossRef]
  14. Hu, S.; Wu, H.; Liang, X.; Xiao, C.; Zhao, Q.; Cao, Y.; Han, X. A preliminary study on the eco-environmental geological issue of in-situ oil shale mining by a physical model. Chemosphere 2022, 287, 131987. [Google Scholar] [CrossRef] [PubMed]
  15. Zhao, T.; Shi, J.; Lv, L.; Xu, H.; Chen, D.; Cui, Q.; Zhang, Z. Soil moisture experiment in the Luan River supporting new satellite mission opportunities. Remote Sens. Environ. 2020, 240, 111680. [Google Scholar] [CrossRef]
  16. Chéret, V.; Denux, J.P. Mapping wildfire danger at regional scale with an index model integrating coarse spatial resolution remote sensing data. J. Geophys. Res. Biogeosci. 2007, 112, 1–11. [Google Scholar] [CrossRef] [Green Version]
  17. Jolly, W.M.; Cochrane, M.A.; Freeborn, P.H.; Holden, Z.A.; Brown, T.J.; Williamson, G.J.; Bowman, D.M. Climate-induced variations in global wildfire danger from 1979 to 2013. Nat. Commun. 2015, 6, 7537. [Google Scholar] [CrossRef]
  18. Pereira, G.; Longo, K.M.; Freitas, S.R.; Mataveli, G.; Oliveira, V.J.; Santos, P.R.; Cardozo, F.S. Improving the south America wildfires smoke estimates: Integration of polar-orbiting and geostationary satellite fire products in the Brazilian biomass burning emission model (3BEM). Atmos. Environ. 2022, 273, 118954. [Google Scholar] [CrossRef]
  19. Tecle, A.; Neary, D. Water quality impacts of forest fires. Pollut. Eff. Control 2015, 3, 25–40. [Google Scholar] [CrossRef]
  20. Reid, C.E.; Brauer, M.; Johnston, F.H.; Jerrett, M.; Balmes, J.R.; Elliott, C.T. Critical review of health impacts of wildfire smoke exposure. Environ. Health Perspect. 2016, 124, 1334–1343. [Google Scholar] [CrossRef] [Green Version]
  21. Nepstad, D.; McGrath, D.; Alencar, A.; Barros, A.C.; Carvalho, G.; Santilli, M.; Vera Diaz, M. Frontier Governance in Amazonia. Science 2002, 295, 629–631. [Google Scholar] [CrossRef] [PubMed] [Green Version]
  22. Caúla, R.H.; Oliveira-Júnior, J.F.; Lyra, G.B.; Delgado, R.C.; Heilbron Filho, P.F.L. Overview of Fire Foci Causes and Locations in Brazil Based on Meteorological Satellite Data from 1998 to 2011. Environ. Earth Sci. 2015, 74, 1497–1508. [Google Scholar] [CrossRef]
  23. Lima, M.; do Vale, J.C.E.; Costa, G.D.M.; dos Santos, R.C.; Correia Filho, W.L.F.; Gois, G.; de Oliveira-Junior, J.F.; Teodoro, P.E.; Rossi, F.S.; da Silva Junior, C.A. The Forests in the Indigenous Lands in Brazil in Peril. Land Use Policy 2020, 90, 104258. [Google Scholar] [CrossRef]
  24. Shrivastava, M.; Andreae, M.O.; Artaxo, P.; Barbosa, H.M.J.; Berg, L.K.; Brito, J.; Ching, J.; Easter, R.C.; Fan, J.; Fast, J.D.; et al. Urban Pollution Greatly Enhances Formation of Natural Aerosols over the Amazon Rainforest. Nat. Commun. 2019, 10, 1046. [Google Scholar] [CrossRef] [Green Version]
  25. Oliveira-Júnior, J.F.; Teodoro, P.E.; Silva Junior, C.A.; Baio, F.H.R.; Gava, R.; Capristo-Silva, G.F.; Gois, G.; Correia Filho, W.L.F.; Lima, M.; de Santiago, D.B.; et al. Fire Foci Related to Rainfall and Biomes of the State of Mato Grosso do Sul, Brazil. Agric. For. Meteorol. 2020, 282–283, 107861. [Google Scholar] [CrossRef]
  26. De Sales, F.; Santiago, T.; Biggs, T.W.; Mullan, K.; Sills, E.O.; Monteverde, C. Impacts of Protected Area Deforestation on Dry-Season Regional Climate in the Brazilian Amazon. J. Geophys. Res. Atmos. 2020, 125, e2020JD033048. [Google Scholar] [CrossRef]
  27. Sato, H.; Kelley, D.I.; Mayor, S.J.; Martin Calvo, M.; Cowling, S.A.; Prentice, I.C. Dry Corridors Opened by Fire and Low CO2 in Amazonian Rainforest during the Last Glacial Maximum. Nat. Geosci. 2021, 14, 578–585. [Google Scholar] [CrossRef]
  28. Chen, Y.; Velicogna, I.; Famiglietti, J.S.; Randerson, J.T. Satellite observations of terrestrial water storage provide early warning information about drought and fire season severity in the Amazon. J. Geophys. Res. Biogeosci. 2013, 118, 495–504. [Google Scholar] [CrossRef] [Green Version]
  29. Ray, D.; Nepstad, D.; Moutinho, P. Micrometeorological and canopy controls of fire susceptibility in a forested Amazon landscape. Ecol. Appl. 2005, 15, 1664–1678. [Google Scholar] [CrossRef]
  30. Aragão, L.E.; Anderson, L.O.; Fonseca, M.G.; Rosan, T.M.; Vedovato, L.B.; Wagner, F.H.; Saatchi, S. 21st Century drought-related fires counteract the decline of Amazon deforestation carbon emissions. Nat. Commun. 2018, 9, 536. [Google Scholar] [CrossRef] [PubMed]
  31. Langmann, B.; Duncan, B.; Textor, C.; Trentmann, J.; Van Der Werf, G.R. Vegetation fire emissions and their impact on air pollution and climate. Atmos. Environ. 2009, 43, 107–116. [Google Scholar] [CrossRef]
  32. Giglio, L.; Schroeder, W.; Justice, C.O. The collection 6 MODIS active fire detection algorithm and fire products. Remote Sens. Environ. 2016, 178, 31–41. [Google Scholar] [CrossRef] [PubMed] [Green Version]
  33. Bondur, V.G.; Gordo, K.A.; Kladov, V.L. Spacetime distributions of wildfire areas and emissions of carbon-containing gases and aerosols in northern Eurasia according to satellite-monitoring data. Izv. Atmos. Ocean. Phys. 2017, 53, 859–874. [Google Scholar] [CrossRef]
  34. Marinho, A.A.R.; Gois, G.; Oliveira-Júnior, J.F.; Correia Filho, W.L.F.; Santiago, D.B.; da Silva Junior, C.A.; Teodoro, P.E.; Souza, A.; Capristo-Silva, G.F.; Freitas, W.K. Temporal Record and Spatial Distribution of Fire Foci in State of Minas Gerais, Brazil. J. Environ. Manag. 2021, 280, 111707. [Google Scholar] [CrossRef] [PubMed]
  35. CPTEC/INPE Centro de Previsão Do Tempo e Estudos Climáticos/Instituto Nacional de Pesquisas Espaciais. Monitoramento de Focos de Calor. 2020. Available online: https://www.cptec.inpe.br/ (accessed on 4 June 2022).
  36. Souza, A. Metodologia Utilizada Nos Projetos PRODES e DETER; INPE: São José dos Campos, Brazil, 2019; p. 33. [Google Scholar]
  37. IBGE—Instituto Brasileiro de Geografia e Estatistica. Geoestatística de Recursos Naturais da Amazôni; IBGE: Brasília, Brazil, 2020. [Google Scholar]
  38. Alvares, C.A.; Stape, J.L.; Sentelhas, P.C.; Moraes, G.J.L.; Sparovek, G. Köppen’s Climate Classification Map for Brazil. Meteorol. Zeitschrift 2013, 22, 711–728. [Google Scholar] [CrossRef]
  39. ORIGIN (Pro) 3.6 Version; OriginLab Corporation: Northampton, MA, USA, 2019.
  40. da Silva, M.V.; Pandorfi, H.; Lopes, P.M.O.; da Silva, J.L.B.; de Almeida, G.L.P.; Silva, D.A.D.O.; dos Santos, A.; Rodrigues, J.A.D.M.; Batista, P.H.D.; Jardim, A.M.D.R.F. Pilot Monitoring of Caatinga Spatial-Temporal Dynamics through the Action of Agriculture and Livestock in the Brazilian Semiarid. Remote Sens. Appl. Soc. Environ. 2020, 19, 100353. [Google Scholar] [CrossRef]
  41. da Silva, M.V.; Pandorfi, H.; de Almeida, G.L.P.; de Lima, R.P.; dos Santos, A.; Jardim, A.M.D.R.F.; Rolim, M.M.; da Silva, J.L.B.; Batista, P.H.D.; da Silva, R.A.B.; et al. Spatio-Temporal Monitoring of Soil and Plant Indicators under Forage Cactus Cultivation by Geoprocessing in Brazilian Semi-Arid Region. J. S. Am. Earth Sci. 2021, 107, 103155. [Google Scholar] [CrossRef]
  42. Jardim, A.M.D.R.F.; da Silva, M.V.; Silva, A.R.; dos Santos, A.; Pandorfi, H.; de Oliveira-Júnior, J.F.; de Lima, J.L.; de Souza, L.S.B.; Júnior, G.D.N.A.; Lopes, P.M.O.; et al. Spatiotemporal Climatic Analysis in Pernambuco State, Northeast Brazil. J. Atmos. Solar-Terr. Phys. 2021, 223, 105733. [Google Scholar] [CrossRef]
  43. Kaiser, H.F. The Application of Electronic Computers to Factor Analysis. Educ. Psychol. Meas. 1960, 20, 141–151. [Google Scholar] [CrossRef]
  44. Jardim, A.M.D.R.F.; Santos, H.R.B.; Alves, H.K.M.N.; Ferreira-Silva, S.L.; de Souza, L.S.B.; Júnior, G.D.N.A.; Souza, M.D.S.; de Araújo, G.G.L.; de Souza, C.A.A.; da Silva, T.G.F. Genotypic Differences Relative Photochemical Activity, Inorganic and Organic Solutes and Yield Performance in Clones of the Forage Cactus under Semi-Arid Environment. Plant Physiol. Biochem. 2021, 162, 421–430. [Google Scholar] [CrossRef]
  45. R Core Team. R: A Language and Environment for Statistical Computing; R Foundation for Statistical Computing: Vienna, Austria, 2022. [Google Scholar]
  46. Jiang, Z.; Huete, A.R.; Chen, J.; Chen, Y.; Li, J.; Yan, G.; Zhang, X. Analysis of NDVI and Scaled Difference Vegetation Index Retrievals of Vegetation Fraction. Remote Sens. Environ. 2006, 101, 366–378. [Google Scholar] [CrossRef]
  47. Shah, M.; Jin, S. Statistical characteristics of seismo-ionospheric GPS TEC disturbances prior to global Mw≥5.0 earthquakes (1998–2014). J. Geodyn. 2015, 92, 42–49. [Google Scholar] [CrossRef]
  48. Tasumi, M.; Allen, R.G.; Trezza, R. At-Surface Reflectance and Albedo from Satellite for Operational Calculation of Land Surface Energy Balance. J. Hydrol. Eng. 2008, 13, 51–63. [Google Scholar] [CrossRef]
  49. Allen, R.G.; Masahiro, T.; Ricardo, T. Satellite-Based Energy Balance for Mapping Evapotranspiration with Internalized Calibration (METRIC)—Model. J. Irrig. Drain. Eng. 2007, 133, 380–394. [Google Scholar] [CrossRef]
  50. Allen, R.G.; Tasumi, M.; Trezza, R.; Waters, R.; Bastiaanssen, W.G.M. SEBAL (Surface Energy Balance Algorithms for Land). Advance Training and Users Manual–Idaho Implementation; Springer: Dordrecht, The Netherland, 2002; p. 97. [Google Scholar]
  51. Shah, M.; Ehsan, M.; Abbas, A.; Ahmed, A.; Jamjareegulgarn, P. Possible Thermal Anomalies Associated with Global Terrestrial Earthquakes During 2000–2019 Based on MODIS-LST. IEEE Geosci. Remote Sens. Lett. 2022, 19, 1002705. [Google Scholar] [CrossRef]
  52. Nascimento, A.C.L.; Galvani, E.; Gobo, J.P.A.; Wollmann, C.A. Comparison between Air Temperature and Land Surface Temperature for the City of São Paulo, Brazil. Atmosphere 2022, 13, 491. [Google Scholar] [CrossRef]
  53. Jardim, A.M.; Araújo Júnior, G.D.; Silva, M.V.; Santos, A.D.; Silva, J.L.; Pandorfi, H.; Oliveira-Júnior, J.F.; Teixeira, A.H.; Teodoro, P.E.; de Lima, J.L.M.P.; et al. Using Remote Sensing to Quantify the Joint Effects of Climate and Land Use/Land Cover Changes on the Caatinga Biome of Northeast Brazilian. Remote Sens. 2022, 14, 1911. [Google Scholar] [CrossRef]
  54. Allan, R.; Pereira, L.; Smith, M. Crop Evapotranspiration-Guidelines for Computing Crop Water Requirements-FAO Irrigation and Drainage Paper 56; FAO: Rome, Italy, 1998; Volume 56. [Google Scholar]
  55. Running, S.W.; Mu, Q.; Zhao, M.M.A. MODIS Global Terrestrial Evapotranspiration (ET) Product (MOD16A2/A3 and Year-End Gap-Filled MOD16A2GF/A3GF) NASA Earth Observing System MODIS Land Algorithm. 2019. Available online: https://www.google.com.hk/url?sa=t&rct=j&q=&esrc=s&source=web&cd=&cad=rja&uact=8&ved=2ahUKEwjU95fti5v5AhUJGaYKHcQ9APsQFnoECAkQAQ&url=https%3A%2F%2Fmodis-land.gsfc.nasa.gov%2Fpdf%2FMOD16UsersGuideV2.022019.pdf&usg=AOvVaw0uTr9icG3sNfjVoYtXGle0 (accessed on 4 June 2022).
  56. NOAA/CPC National Oceanic and Atmospheric Administration/Climate Prediction Center. Cold & Warm Episodes by Season; Climate Prediction Center: College Park, MSD, USA, 2020. [Google Scholar]
  57. Fogo, M. Plataforma de Mapas e Dados 2021. Available online: https://portaldemapas.ibge.gov.br/portal.php#homepage (accessed on 4 June 2022).
  58. Tomasella, J.; Pinho, P.F.; Borma, L.S.; Marengo, J.A.; Nobre, C.A.; Bittencourt, O.R.F.O.; Prado, M.C.R.; Rodriguez, D.A.; Cuartas, L.A. The Droughts of 1997 and 2005 in Amazonia: Floodplain Hydrology and Its Potential Ecological and Human Impacts. Clim. Change 2013, 116, 723–746. [Google Scholar] [CrossRef]
  59. Almeida, C.T.; Oliveira-Júnior, J.F.; Delgado, R.C.; Cubo, P.; Ramos, M.C. Spatiotemporal Rainfall and Temperature Trends throughout the Brazilian Legal Amazon, 1973–2013. Int. J. Climatol. 2017, 37, 2013–2026. [Google Scholar] [CrossRef]
  60. Marengo, J.; Nobre, C.; Tomasella, J.; Oyama, M.; Sampaio, G.; Oliveira, R.; Camargo, H., Jr.; Alves, L.; Brown, F. The Drought of Amazonia in 2005. J. Clim. 2008, 21, 495–516. [Google Scholar] [CrossRef] [Green Version]
  61. Oliveira-Júnior, J.F.; Mendes, D.; Correia Filho, W.L.F.; da Silva Junior, C.A.; Gois, G.; Jardim, A.M.D.R.F.; da Silva, M.V.; Lyra, G.B.; Teodoro, P.E.; Pimentel, L.C.G.; et al. Fire Foci in South America: Impact and Causes, Fire Hazard and Future Scenarios. J. S. Am. Earth Sci. 2021, 112, 103623. [Google Scholar] [CrossRef]
  62. Berenguer, E.; Lennox, G.D.; Ferreira, J.; Malhi, Y.; Aragão, L.E.O.C.; Barreto, J.R.; Espírito-Santo, F.D.B.; Figueiredo, A.E.S.; França, F.; Gardner, T.A.; et al. Tracking the Impacts of El Niño Drought and Fire in Human-Modified Amazonian Forests. Proc. Natl. Acad. Sci. USA 2021, 118, e2019377118. [Google Scholar] [CrossRef] [PubMed]
  63. de Oliveira-Júnior, J.F.; Shah, M.; Abbas, A.; Correia Filho, W.L.F.; da Silva Junior, C.A.; de Barros Santiago, D.; Teodoro, P.E.; Mendes, D.; de Souza, A.; Aviv-Sharon, E.; et al. Spatiotemporal Analysis of Fire Foci and Environmental Degradation in the Biomes of Northeastern Brazil. Sustainability 2022, 14, 6935. [Google Scholar] [CrossRef]
  64. Ambiente Brasil. Maior Número de Focos de Calor Está No Bioma Amazônia. 2004, p. 16501. Available online: https://www.redebrasilatual.com.br/category/ambiente/page/64/?amp (accessed on 4 June 2022).
  65. Barreto, P.; Silva, R.; Rodrigues, R.; Nunes, H.; Souza, E. Influência Do El Niño e La Niña Nos Campos de Precipitação e Temperatura Na Reserva de Caxiuanã, PA—Amazônia Oriental. 2009. Available online: https://www.google.com.hk/url?sa=t&rct=j&q=&esrc=s&source=web&cd=&cad=rja&uact=8&ved=2ahUKEwjNx8e2jpv5AhXFAKYKHUCqA6YQFnoECAkQAQ&url=https%3A%2F%2Fwww.redalyc.org%2Fpdf%2F4675%2F467546322081.pdf&usg=AOvVaw12zwsg1091rUsCNlsdzDqq (accessed on 4 June 2022).
  66. Mu, Y.; Biggs, T.W.; De Sales, F. Forests Mitigate Drought in an Agricultural Region of the Brazilian Amazon: Atmospheric Moisture Tracking to Identify Critical Source Areas. Geophys. Res. Lett. 2021, 48, e2020GL091380. [Google Scholar] [CrossRef]
  67. Hafeez, A.; Shah, M.; Ehsan, M.; Jamjareegulgarn, P.; Ahmed, J.; Tariq, M.A.; Iqbal, S.; Naqvi, N.A. Possible atmosphere and ionospheric anomalies of the 2019 Pakistan earthquake using statistical and machine learning procedures on MODIS LST, GPS TEC and GIM TEC. IEEE J. Sel. Top. Appl. Earth Obs. Remote Sens. 2021, 14, 11126–11133. [Google Scholar] [CrossRef]
  68. Ribeiro, T.M.; de Mendonça, B.A.F.; de Oliveira-Júnior, J.F.; Fernandes-Filho, E.I. Fire Foci Assessment in the Western Amazon (2000–2015). Environ. Dev. Sustain. 2021, 23, 1485–1498. [Google Scholar] [CrossRef]
  69. Silveira, M.V.F.; Petri, C.A.; Broggio, I.S.; Chagas, G.O.; Macul, M.S.; Leite, C.C.S.S.; Ferrari, E.M.M.; Amim, C.G.V.; Freitas, A.L.R.; Motta, A.Z.V.; et al. Drivers of Fire Anomalies in the Brazilian Amazon: Lessons Learned from the 2019 Fire Crisis. Land 2020, 9, 516. [Google Scholar] [CrossRef]
  70. Da Silva, H.J.F.; Gonçalves, W.A.; Bezerra, B.G. Comparative Analyzes and Use of Evapotranspiration Obtained through Remote Sensing to Identify Deforested Areas in the Amazon. Int. J. Appl. Earth Obs. Geoinf. 2019, 78, 163–174. [Google Scholar] [CrossRef]
  71. Junior, C.A.D.S.; Costa, G.D.M.; Rossi, F.S.; Vale, J.C.E.D.; de Lima, R.B.; Lima, M.; de Oliveira-Junior, J.F.; Teodoro, P.E.; Santos, R.C. Remote Sensing for Updating the Boundaries between the Brazilian Cerrado-Amazonia Biomes. Environ. Sci. Policy 2019, 101, 383–392. [Google Scholar] [CrossRef]
  72. Barbosa, M.L.F.; Delgado, R.C.; de Andrade, C.F.; Teodoro, P.E.; Junior, C.A.S.; Wanderley, H.S.; Capristo-Silva, G.F. Recent Trends in the Fire Dynamics in Brazilian Legal Amazon: Interaction between the ENSO Phenomenon, Climate and Land Use. Environ. Dev. 2021, 39, 100648. [Google Scholar] [CrossRef]
  73. Gao, C.; Hao, M.; Chen, J.; Gu, C. Simulation and design of joint distribution of rainfall and tide level in Wuchengxiyu Region, China. Urban Clim. 2021, 40, 101005. [Google Scholar] [CrossRef]
  74. Quan, Q.; Gao, S.; Shang, Y.; Wang, B. Assessment of the sustainability of Gymnocypris eckloni habitat under river damming in the source region of the Yellow River. Sci. Total Environ. 2021, 778, 146312. [Google Scholar] [CrossRef] [PubMed]
  75. Zhang, K.; Wang, S.; Bao, H.; Zhao, X. Characteristics and influencing factors of rainfall-induced landslide and debris flow hazards in Shaanxi Province, China. Nat. Hazards Earth Syst. Sci. 2019, 19, 93–105. [Google Scholar] [CrossRef] [Green Version]
  76. Quan, Q.; Liang, W.; Yan, D.; Lei, J. Influences of joint action of natural and social factors on atmospheric process of hydrological cycle in Inner Mongolia, China. Urban Clim. 2022, 41, 101043. [Google Scholar] [CrossRef]
  77. Zhang, K.; Shalehy, M.H.; Ezaz, G.T.; Chakraborty, A.; Mohib, K.M.; Liu, L. An integrated flood risk assessment approach based on coupled hydrological-hydraulic modeling and bottom-up hazard vulnerability analysis. Environ. Model. Softw. Environ. Data News 2022, 148, 105279. [Google Scholar] [CrossRef]
  78. Zhao, T.; Shi, J.; Entekhabi, D.; Jackson, T.J.; Hu, L.; Peng, Z.; Kang, C.S. Retrievals of soil moisture and vegetation optical depth using a multi-channel collaborative algorithm. Remote Sens. Environ. 2021, 257, 112321. [Google Scholar] [CrossRef]
  79. Li, W.; Shi, Y.; Zhu, D.; Wang, W.; Liu, H.; Li, J.; Fu, S. Fine root biomass and morphology in a temperate forest are influenced more by the nitrogen treatment approach than the rate. Ecol. Indic. 2021, 130, 108031. [Google Scholar] [CrossRef]
  80. Li, J.; Charles, L.S.; Yang, Z.; Du, G.; Fu, S. Differential Mechanisms Drive Species Loss Under Artificial Shade and Fertilization in the Alpine Meadow of the Tibetan Plateau. Front. Plant Sci. 2022, 13, 832473. [Google Scholar] [CrossRef]
  81. Yang, Y.; Dou, Y.; Wang, B.; Wang, Y.; Liang, C.; An, S.; Kuzyakov, Y. Increasing contribution of microbial residues to soil organic carbon in grassland restoration chronosequence. Soil Biol. Biochem. 2022, 170, 108688. [Google Scholar] [CrossRef]
  82. Miao, R.; Liu, Y.; Wu, L.; Wang, D.; Liu, Y.; Miao, Y.; Ma, J. Effects of long-term grazing exclusion on plant and soil properties vary with position in dune systems in the Horqin Sandy Land. Catena 2022, 209, 105860. [Google Scholar] [CrossRef]
  83. Tian, H.; Qin, Y.; Niu, Z.; Wang, L.; Ge, S. Summer Maize Mapping by Compositing Time Series Sentinel-1A Imagery Based on Crop Growth Cycles. J. Indian Soc. Remote Sens. 2021, 49, 2863–2874. [Google Scholar] [CrossRef]
  84. Tian, H.; Wang, Y.; Chen, T.; Zhang, L.; Qin, Y. Early-Season Mapping of Winter Crops Using Sentinel-2 Optical Imagery. Remote Sens. 2021, 13, 3822. [Google Scholar] [CrossRef]
  85. Su, N.; Jarvie, S.; Yan, Y.; Gong, X.; Li, F.; Han, P.; Zhang, Q. Landscape context determines soil fungal diversity in a fragmented habitat. Catena 2022, 213, 106163. [Google Scholar] [CrossRef]
  86. Cheela, V.S.; John, M.; Biswas, W.; Sarker, P. Combating urban heat island effect—A review of reflective pavements and tree shading strategies. Buildings 2021, 11, 93. [Google Scholar] [CrossRef]
  87. Leite-Filho, A.T.; Soares-Filho, B.S.; Davis, J.L.; Abrahão, G.M.; Börner, J. Deforestation reduces rainfall and agricultural revenues in the Brazilian Amazon. Nat. Commun. 2021, 12, 2591. [Google Scholar] [CrossRef]
  88. Caioni, C.; Silvério, D.V.; Macedo, M.N.; Coe, M.T.; Brando, P.M. Droughts amplify differences between the energy balance components of Amazon forests and croplands. Remote Sens. 2020, 12, 525. [Google Scholar] [CrossRef] [Green Version]
Figure 1. Location of the Brazilian Legal Amazon (a); elevation from the 30 m SRTM (Shuttle Radar Topography Mission); (b); Köppen–Geiger climate classification (c); and air temperature 2 m based on the 2001–2021 average (d).
Sustainability 14 09419 g001
Figure 2. Total and average of fire foci in the Legal Amazon (a), monthly boxplot of fire foci (b), total and percentage of monthly fire foci (c) and annual boxplot of fire foci (d). Colors highlighted in red in the boxplot correspond to years of severe drought.
Sustainability 14 09419 g002aSustainability 14 09419 g002b
Figure 3. Albedo, LAI (m2 · m−2) and land surface temperature (LST, °C) Legal Amazon for 2004, 2005, 2007, 2010, 2015 and 2019, respectively.
Sustainability 14 09419 g003aSustainability 14 09419 g003b
Figure 4. ETa (mm·day−1), fire foci and NDVI Legal Amazon for 2004, 2005, 2007, 2010, 2015 and 2019, respectively.
Sustainability 14 09419 g004aSustainability 14 09419 g004b
Figure 5. Categories identified by DETER in the Legal Amazon during the period 2016–2019 (a) and dispersion diagram between BDQueimadas versus PRODES (b).
Sustainability 14 09419 g005aSustainability 14 09419 g005b
Figure 6. Principal component analysis (a) and Pearson’s correlation (b) as a function of the years 1998–2019 for land use and occupation variables, fire foci and PRODES observations for the Legal Amazon. Note: * and ** indicate significance at 0.05 and 0.01 levels, respectively (Pearson’s correlation coefficient).
Sustainability 14 09419 g006
Figure 7. Burned area scars in the Brazilian Legal Amazon (A); burned area (ha) for the years 2004, 2005, 2007, 2010, 2015 and 2019 (B).
Sustainability 14 09419 g007
Table 1. Results of the descriptive statistics applied to annual fire foci in the Legal Amazon during 1998–2022 and the phases of ENSO (El Niño/La Niña and Neutral), according to the classification of region 3.4 based on the ONI index (Oceanic Niño Index).
YearMeanSDMedianCV (%)Percent (%)MaximumMinimumTotalENSO (Phases)
199810,491.5611,342.56417897.82.4829,680262094,424El Niño/La Niña
19996774.579704.942091.5141.92.5029,13311694,844La Niña
200054035923.033310116.21.8716,81312375,642Neutral
20017921.368795.904402116.92.7625,897228110,899La Niña
20021826420,780.9610,014122.56.1864,827720255,696El Niño
200318,529.8817,849.7614,866104.46.3063,6831556259,418El Niño
200423,248.6524,789.0218,139116.67.8191,745958325,481El Niño
200520,803.5027,086.687767132.57.4885,108967291,249El Niño
200614,723.2317,541.129218128.84.9960,858897206,126El Niño
200720,517.1529,929.556736.5146.77.47101,8161254287,240El Niño/La Niña
200811,387.9312,297.756873117.33.8134,735637159,431La Niña
20099267.509613.565826.5115.02.8725,876510129,745El Niño
201016,943.4324,314.606329145.86.1277,2941413237,208El Niño/La Niña
20117131.788043.183888129.72.2628,34735099,845La Niña
201211,206.5612,996.706087123.13.8740,325576156,892Neutral
20137266.866945.956736106.32.4124,511579101,736Neutral
201410,156.6510,175.457435110.13.4029,861585142,193El Niño
201512,720.4312,834.819236.5113.24.1540,452858178,086El Niño
201610,220.799237.17551695.73.5228,2952049143,091El Niño
201712,404.7915,105.638545131.34.2355,994522173,667La Niña
20187337.298371.833106118.72.5631,140828102,722La Niña
201910,238.8611,670.914572119.33.5739,1761675143,344Neutral
202012,565.2516,584.534466132.04.2750,6311556150,783La Niña
20218517.5010,912.553679.5128.12.9035,808911102,210La Niña
20221494.801161.1384777.70.2134897767474La Niña
Table 2. Comparison of Deforestation Alert Rates in the DETER and PRODES Systems during 2015–2019.
PeriodDETERPRODESVariation (%)
2015–20165377 km27893 km246.79%
2016–20174639 km26947 km249.75%
2017–20184571 km27536 km264.86%
2018–20196844 km29762 km242.63%
Table 3. DETER Alert Areas (km2) for Deforestation and Degradation Deforestation in June 2019.
StatesDETER Alert Areas
(Deforestation and Degradation-km2)
DETER Deforestation Alert Areas
(km2)
Acre11.6711.03
Amapá0.150.15
Amazonas228.44193.28
Maranhão8.018.01
Mato Grosso1025.58153.55
Pará577.25446.56
Rondônia99.4199.41
Roraima7.927.92
Tocantins0.30.3
TOTAL2072.03920.21
Publisher’s Note: MDPI stays neutral with regard to jurisdictional claims in published maps and institutional affiliations.

