Article

Revaluation of Local Waste through an Ecotechnologies Strategic Plan: A Case Study with Digesters

by
Mariana Montserrat Flores-Nieves
1,
Genaro M. Soto-Zarazúa
1,*,
Enrique Rico-García
1,
Sergio Zamora-Castro
2,
Gonzalo Macías-Bobadilla
3,
Ma Sandra Hernández-López
4 and
Arantza Elena Sánchez-Gutiérrez
1
1
Facultad de Ingeniería Campus Amazcala, Universidad Autónoma de Querétaro, Carr. Chichimequillas S/N Km 1, Amazcala, El Marqués 76265, Mexico
2
Facultad de Ingeniería, Construcción y Hábitat, Universidad Veracruzana Bv. Adolfo Ruíz Cortines 455, Costa Verde, Boca del Río 94294, Mexico
3
Laboratorio de Mecatrónica, Universidad Autónoma de Querétaro, Cerro de las Campanas, Col. Las Campanas, S/N, Querétaro 76010, Mexico
4
Facultad de Ingeniería, Universidad Autónoma de Querétaro, Cerro de las Campanas, Col. Las Campanas, S/N, Querétaro 76010, Mexico
*
Author to whom correspondence should be addressed.
Sustainability 2022, 14(15), 9389; https://doi.org/10.3390/su14159389
Submission received: 6 July 2022 / Revised: 22 July 2022 / Accepted: 29 July 2022 / Published: 31 July 2022
(This article belongs to the Section Sustainable Forestry)

Abstract

:
In Mexico, the accelerated and unplanned growth of population causes the increment in informal facilities, complicating access to essential services such as adequate sanitation and organic waste management, where the most affected are usually the vulnerable population. The Mexican government has implemented programs and support to encourage the use of ecotechnologies and thus provide alternatives to improve their living conditions by taking advantage of local resources and waste. However, these programs and supports lack planning, creating little interest from users. This research proposes an acceptance strategy for the integration of ecotechnologies that adapt to the lifestyle of populations that need an alternative for their method of sanitation and organic waste management. The strategy is mainly based on a course of action that operates with four main lines of intervention. It was executed as a practical exercise with biodigesters, in the Mexican community of La Trinidad, in the municipality of Tequisquiapan, Querétaro. With the help of the strategy, important factors for the end-user were identified that must be considered when integrating one ecotechnology into the population. In general terms, the strategy showed an improvement in sanitation and organic waste management and a greater acceptance of biodigesters as an alternative of use.

1. Introduction

In the world, 2010 million total tons of solid waste are generated annually, where at least 33% of this is not handled correctly, causing a risk by contact or for the environment, as it is estimated that from 32 to 56% of the total waste is organic and is generated according to the levels of economic development of the population. It is estimated that by 2050 these levels of total waste will have increased by 70% compared to the current levels if urgent sanitation and separation measures are not adopted for organic waste generated at home, crops, and in farm activities [1], directly affecting the most vulnerable areas such as indigenous populations, rural areas, and urban peripheries [2]. This is because in 2015 there were up to 4500 million people who lacked safely managed sanitation and waste separation. Their alternative solutions are associated with significant health risks or are one of the primary sources of contamination of the water and the environment [3].
Therefore, it is essential to provide support to decisions related to the sanitation services and the separation of organic waste that supports solid waste management policies, reduction in food waste through consumer education, organic waste management, and coordinated programs of food waste management [4]. In general, the sanitation and separation of waste comprises facilities inside or outside the site for the collection, handling, treatment, and waste elimination, while also guaranteeing hygienic conditions fit for the population that do not represent a health or environmental risk [5].
To be able to provide ideal alternatives to these populations to cover their basic needs and provide a sanitation service and adequate separation of organic waste, public programs have been implemented to promote the use of ecotechnologies and actively involve local societies [6]. However, despite the efforts made, the programs show a lack of social comprehension, where the State has not been efficient in formulating, creating, and evaluating the appropriate instruments for the programs, causing the abandonment of the ecotechnology implemented by the users, since many programs require an assistance-based approach (solution from outside and not structural); this slows down any sustainable rural development [7].
Among the most implemented ecotechnology programs that provide great benefits in the sanitation service and waste harnessing are homemade biodigesters with an anaerobic system [8,9]; these biodigesters promote sustainable development in various activities and communities, propagating diverse benefits in the economic, environmental, and social spheres [10,11]. Anaerobic digestion is characterized as a biological process in which microorganisms decompose organic waste in the absence of oxygen, producing methane, carbon dioxide, and sludge that can serve as manure; where around 10% of waste organics are converted into sludge and the remaining 90% is used as biogas [12,13,14,15].
In Mexico, it is estimated that there are around 799 biodigesters [16], although more than 80% of these are not working at their maximum potential and there is a lack of studies that help to understand the problems they present and develop adequate strategies for their full use [17]. It is estimated that most of these biodigesters are not efficient, since their operation requires empirical knowledge from people lacking the necessary technical knowledge [18]. At the same time, Mexico has registered increases in the generation of organic waste of up to 53.1 million tons, thus helping to minimize environmental contaminants and develop alternative sources of energy while adequate means of sanitation are established for the population (although there is no official record of how much is used in biodigesters) [19].
Faced with these challenges, the Mexican government has carried out strategic planning for the implementation of biodigesters. Funding schemes have been managed for three main sectors: industrial, productive, and domestic, where the domestic sector shows an abandonment of programs related to biodigesters. The registered abandonments are mainly due to a lack of technical assistance for basic maintenance and repairs required by the biodigesters [16,20].
In this context, there is a wide variety of research experience on the integration of ecotechnology into the population, through strategies and even with financial support from government programs. However, there are still project biases on the integration of ecotechnologies and their acceptance, and various strategies have been proposed and applied to promote the use of ecotechnologies and sustainable development. There is “The participatory design of communication strategies (DPEC)” within a guide named Communication Manual for Rural Development, which describes a process based on user opinions and perspectives to respond to user needs, adapting to their culture and their diverse situations [21]. Najjar et al. [22] propose three key factors for ecotechnology applications, among which is community participation, emphasizing that science works by inviting others to challenge existing models; projects will be safer and more sustainable effective if everyone is involved. The previous proposals revolve around ecotechnologies in general and there are also government programs that have been specifically targeted at biodigesters, such as “Mitigation strategies, the biodigester program in Yucatan, Mexico” [23].
If ecotechnology integration projects are based mainly on user perceptions, these strategies can last and be successful. To evaluate them, user preferences are measured in relation to other similar products [24]. Not only should strategies be proposed for the acceptance of a product, but strategic activities should be planned under an approach where the population can understand the benefits and weaknesses of ecotechnology, in order to later be able to adapt it to the needs of each user [25]. The new information must be related to their previous knowledge and experience, so that the mind accepts the new information, otherwise this information will be filtered and discarded [26]. The user, having a positive experience with the integration of ecotechnology generates an acceptance of ecotechnology, which intervenes in a future purchase intention or the recommendation of the product to third parties, obtaining as a response a loyalty towards the product.
Therefore, this research focuses attention on addressing a gap concerning the strategies applied in projects that promote the use and acceptance of ecotechnologies that help in the sanitation and management of organic waste while promoting sustainable development. A strategy is proposed under a line of action that is based on four principal axes of intervention, where the lack of intuitive design and development based on user experience are addressed, to capture the interest of the rural population, and in this way the strategy and its tools promote the acceptance and use of ecotechnologies, having as a case study the biodigesters in a community of Queretaro, Mexico.
This article shows a system for the operation of the strategy and its main lines of action, as well as the tools that helped to execute each axis and its corresponding stages. In the Section 3, the graphs obtained from the questionnaire carried out before and after applying the strategy are shown, where a discussion of the results obtained is subsequently made, a relationship is made between the factors of each axis for the analysis of the points obtained and is thus able to define the contributions of the strategy, its limitations, and areas of growth.

2. Materials and Methods

To development the strategy, we defined the location as well as a quantitative analysis of the behavior of the population,: its culture, and main activities were observed, and subsequently a questionnaire of habits and customs was circulated to a certain number of people called the “sample population”, with the responses collected and the main needs expressed by the sample population analysed. Once the needs were identified, the design of the strategy began, and a line of action was developed with its main intervention axes. For the development of the biodigester model with local and low-cost materials, a Quality Function Deployment (QFD) was carried out, as well as the impact relationship of the main needs of the users. A field study was conducted where annotations were made on the most common, economic, and easily accessible materials for acquisition, and subsequently a support manual was designed as a visual tool. Both the manual and the course present the same material concerning the information presented. Finally, the strategy was executed in stages, with each stage corresponding to one main axis of the course of action. For the measurement of the stages, a questionnaire was used where the users evaluated their current methods of sanitation and management of organic waste, as well as the use of the biodigester.
This research seeks to analyze the acceptance of a population towards biodigesters, through a strategy developed under four main lines of action; the study is descriptive in scope since it seeks to define characteristics, priorities, processes, or any other concept that is subjected to an analysis [27]. The Design Thinking methodology is also taken as a reference, which helps to observe human behavior regarding a product, and shows a coincidence of user needs, in this way, a feasible technology can be presented to the population for their needs [28].
Multistage sampling techniques were used for this study. The State of Queretaro was selected for several reasons: where a substantial 27.6% of its population is in a vulnerable situation, that is, approximately 579,200 people [29], and it has an economic axis under various actions according to the contextual diagnosis, where one of them is the line of operational action focused on using the energy generation from biodigesters [30]. Subsequently, the municipality of Tequisquiapan was selected, as it has communities such as La Trinidad, where it has been recorded that their main activity is agriculture, livestock, and small farms. As can be seen in Figure 1, this community shows social backwardness causing a vulnerability impact on its population in basic services such as sanitation and organic waste management [31].
To calculate the sample size, the formula proposed by Murray and Larry [33] was used. Finally, the reliability of the measurement scale was validated with Cronbach’s Alpha. A sample of at least 60 households was determined based on the 509 registered dwellings; therefore, a total of 60 respondents contributed.
A program of semi-structured interviews was used to collect the users’ perspectives and how their organic waste management is operated, if they have any ecotechnology installed in their home, and to identify similarities in personal and work characteristics. The schedule of the interviews included the demographic and socioeconomic characteristics of the respondents and questions related to their basic services, the infrastructure of their homes, willingness to adopt ecotechnology, and their general opinions about ecotechnologies; this was to visualize the feasibility of proposing ecotechnologies as a solution to their needs. Interviews were conducted face-to-face and in the local language.
A line of action with four main axes of intervention was executed in an Ecotechnology Acceptance Strategy (EAS), the EAS was divided into four stages, each one corresponding an intervention axis: perception of ecotechnology, acceptance of the process, benefits perceptions, and adoption of ecotechnology (30 people participated to apply the EAS). The general system shows the order of the stages and the factors that complement each stage; to advance to the next stage it is necessary to finish the current stage (Figure 2). For the execution of the strategy during stage one (Perception), a PowerPoint presentation was used to give the training course (Figure A1), as well as a User Manual as visual support for the attendees and a sample model of the biodigester. For stage two (Acceptance of the process) and three (Benefits), a monthly plan was used that is integrated into the User Manual.
In the perception stage, the objective was to homogenize concepts and provide information on the use and manipulation of biodigesters through a training course; the factors involved in this stage were physical, internal stimuli, and user needs. The training was given in person to two groups of no more than 15 people with a duration of 4 h. Attendees were provided with a “User Manual” as visual support and a demonstration of the operation and assembly of ecotechnology with a pilot model; this was so that the attendees manage the same information about the biodigester, they know the parts of it in detail, and can detect points of the biodigester that they can modify it to fit into their homes. In this stage, the users installed a biodigester in their homes, and visits were scheduled to be able to provide personalized advice in-person to each user for any alteration of the model that was presented in the training to adapt it to their homes; the users evaluated whether to integrate a biodigester to their homes to facilitate sanitation activities and manage organic waste generated in their homes.
The acceptance of the process corresponds to the second stage of the strategy; in this case the factors involved were the willingness of the user to pay for the biodigester, as well as their satisfaction with the experience, and acceptance of the process that implies the integration of a biodigester in their homes. Visits were scheduled to monitor the users and observe how they manipulate the biodigester. To measure this stage a Monthly Plan was integrated into the User Manual, where the user marks the activity carried out with the biodigester, observes how organic waste is handled, the correct functioning of the biodigester and how to feed and maintain the biodigester.
The perceived benefits correspond to the third stage, where the economic, social, and environmental benefits that the user perceives were measured. To monitor the benefits, the same dynamics as in the second stage were applied, face-to-face visits were scheduled with each user, the conditions in which they kept the waste to feed the biodigester were observed, and it was analyzed whether the biodigester gave off unpleasant odors or generated flies and the use they made of biogas and biofertilizer. The users evaluated through some questions what benefits they had perceived since the integration of the biodigester into their home.
Finally, stage four corresponds to the Adoption of ecotechnology; it focuses on the recommendation, recognition, and loyalty developed toward ecotechnology. In this stage, the users answered some questions such as whether their expectations were met and if they had recommended this ecotechnology to family and friends. The monitoring of the strategy was designed according to the stages and a time was defined for each one. To measure each stage, visits were scheduled with each participant, at the place where their biodigester was installed. It was observed in each stage how the corresponding activities were carried out (Figure 3).
To measure each stage an acceptance questionnaire was structured and divided into four parts, each corresponding to a stage and was applied individually twice: before applying the EAS (Q1) and after applying the EAS (Q2) (Figure A2). The users rated their current methods of sanitation and organic waste management (Q1) and likewise rated the biodigester as a new alternative (Q2). In the case of Q1, it was carried out in a single exhibition and in Q2 it was carried out at the end of each stage, according to the corresponding questions. Finally, a comparison of the results was made of the current energy supply and its sanitation service before the strategy and the biodigester after applying the strategy.
The questionnaire consisted of 60 questions, divided into 15 questions per stage, using the Likert Scale as a measurement where: 1 Strongly disagree, 2 Disagree, 3 Undecided, 4 Agree and 5 Strongly agree. To obtain values in percentages of the responses, the total value of the questionnaire was assigned to 100%, which was divided by the four stages found in the EAS, leaving each stage with 25% of the total value; subsequently, and considering that each stage has three factors, each factor had a value of 33.33% to add 25% to each stage. To obtain the percentage of each factor, a rule of three was performed where the average obtained from each factor was multiplied by the 33.33% corresponding to the value of each factor and divided by the highest score on the Likert scale, finally, in the case of the stages, to get their total percentage, the percentages of the factors corresponding to each stage were added, and a rule of three was made where the percentage obtained from the stage was multiplied by 25%, which corresponds to the value of each stage and it was divided by 100%, this being the total value of acceptance.
Finally, the biodigester design was based on the Quality Function Deployment (QFD) system that (Figure A3), according to Akao and Mizuno (1978), helps to focus the product design and meet the needs of the end-user. An Impact Relationship was managed, according to this the main criteria that are demanded were established within which the quality, ergonomics, design, and graphics were considered as visual support for the manipulation of the biodigester. The main needs of the users were filtered according to the highest evaluation score obtained by each, prioritizing those with the highest score to be considered in the design of the biodigester.

3. Results

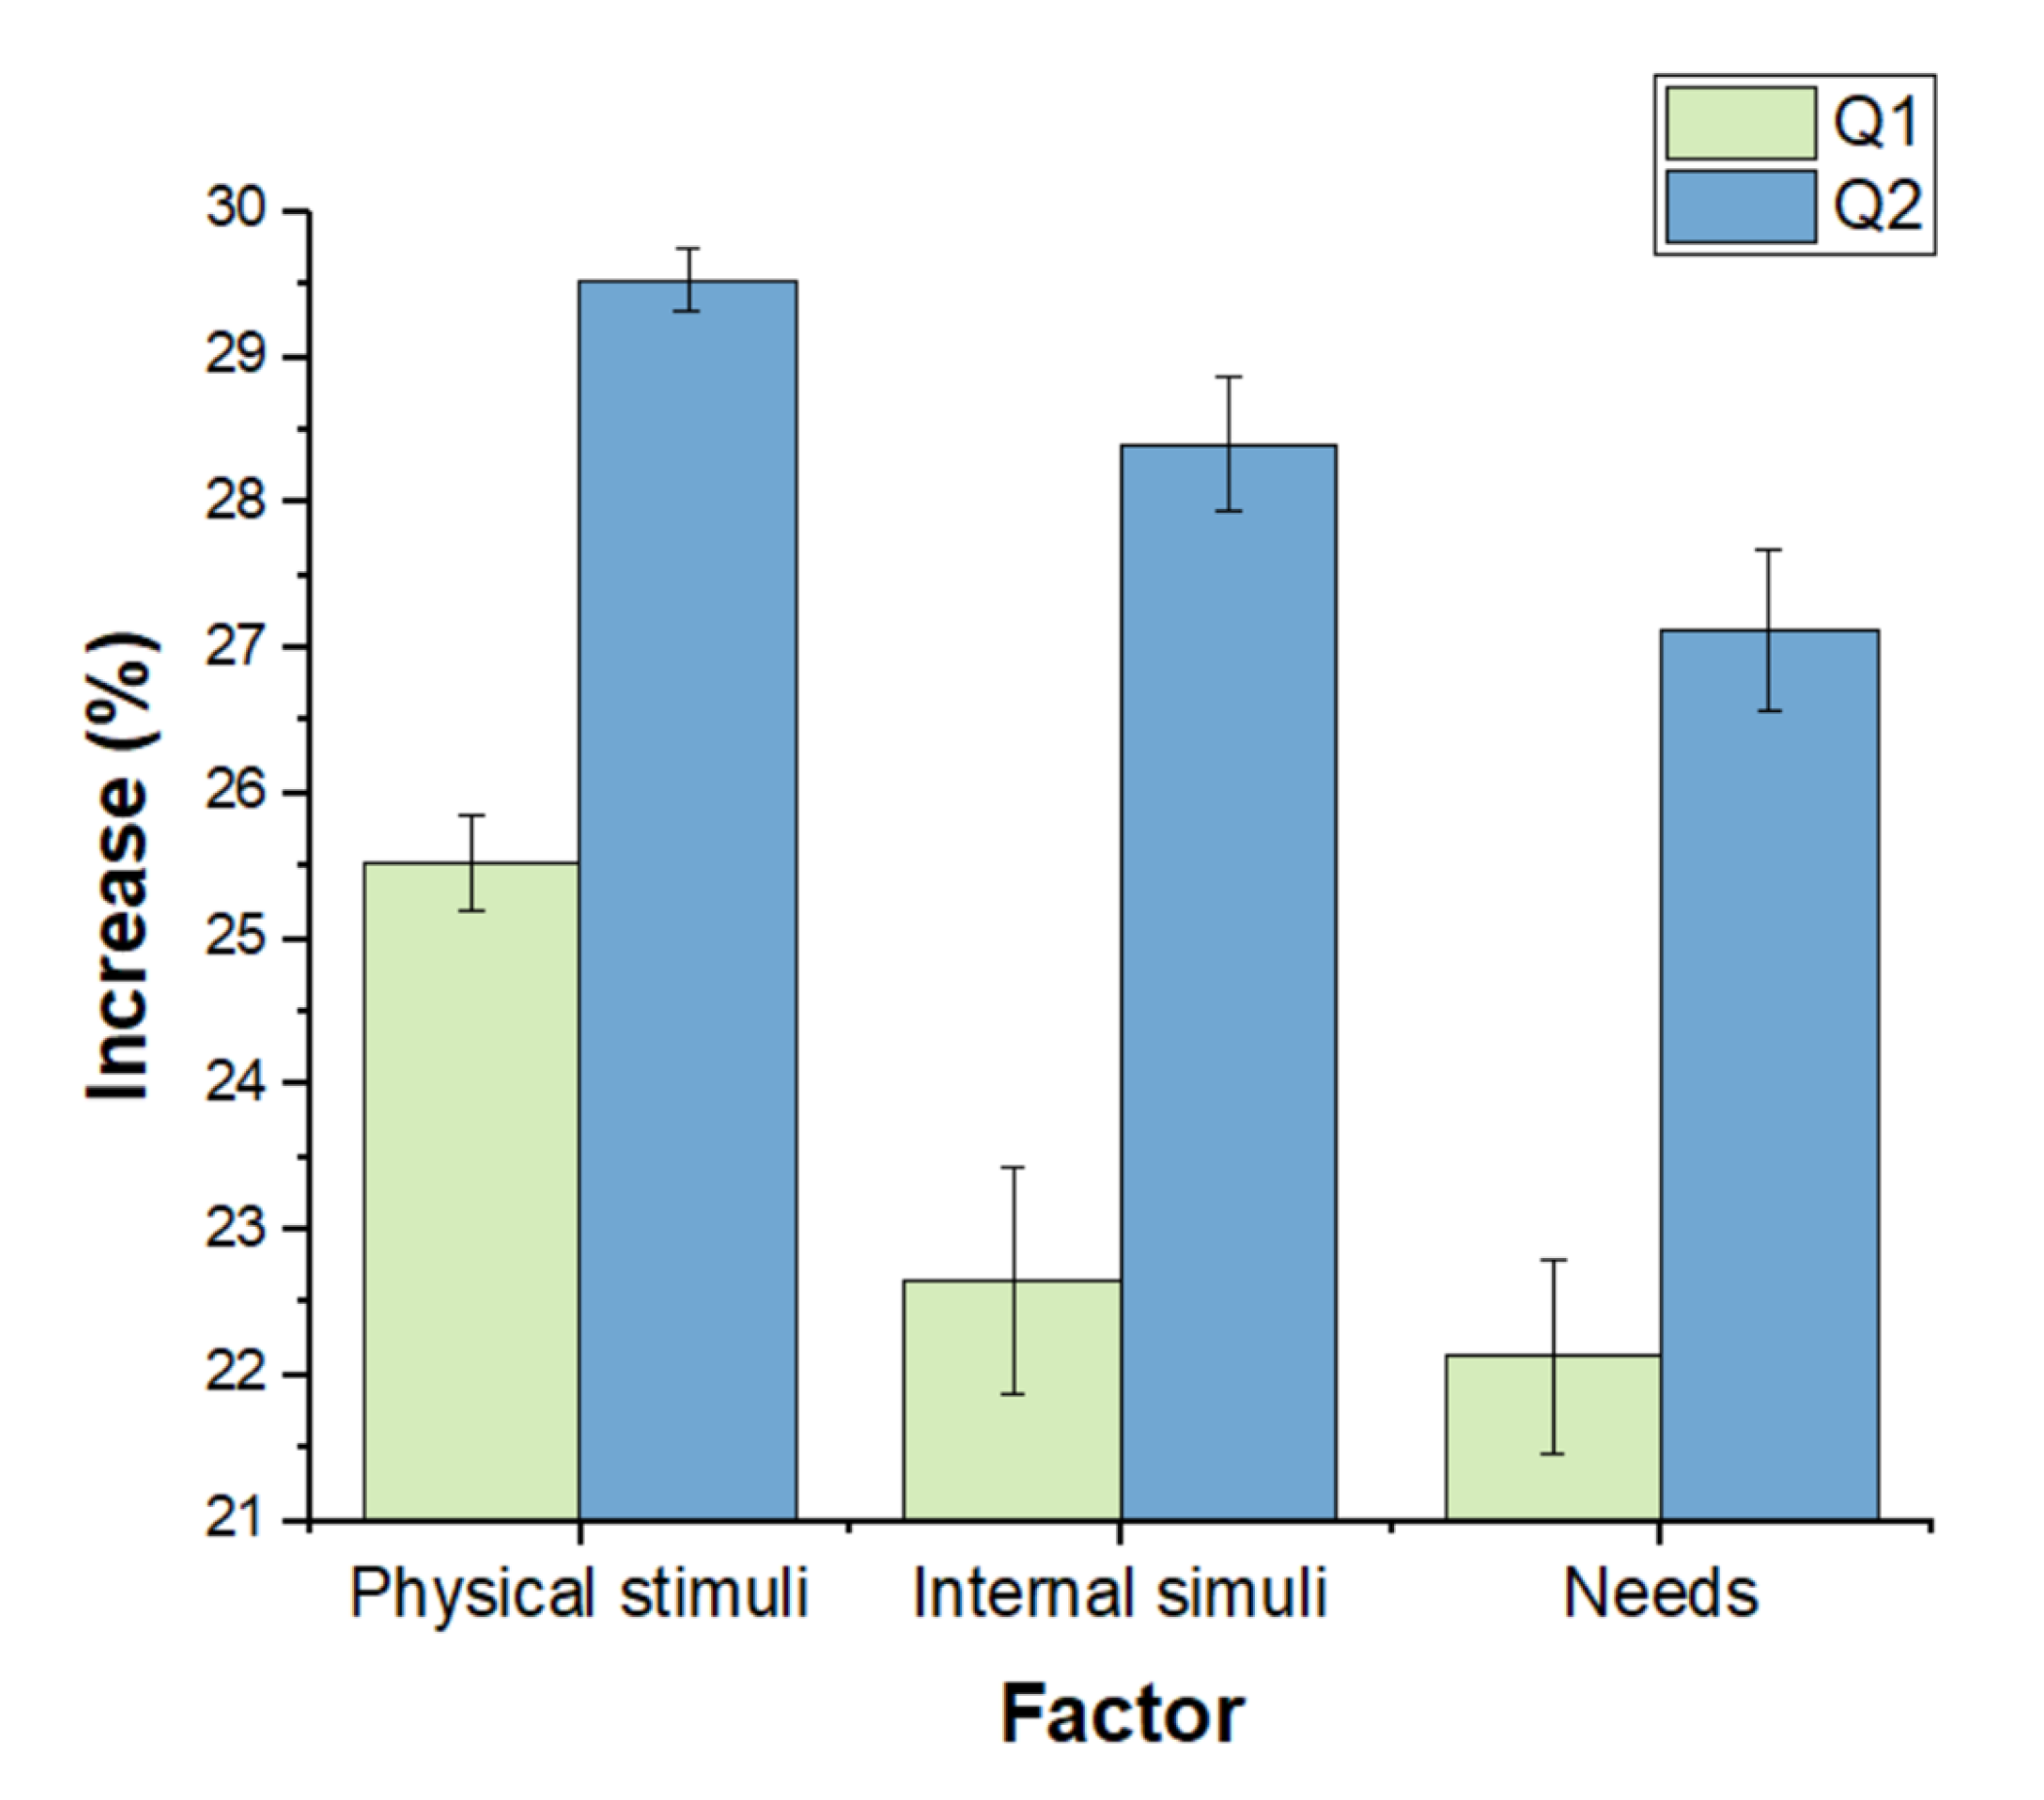
3.1. User Perception

Within Perception, physical stimuli are the factor with the highest percentage regarding user interest and satisfaction before and after applying the EAS, with 25.53% and 29.53%, respectively (Figure 4) and (Table 1). The factor with the highest increase after applying the strategy with 5.74% was that of internal stimuli; the user, not perceiving the intimidating biodigester model, understands its operation and can identify the parts that make it up, showing a positive idea of the use of a biodigester according to the desires, needs, and experiences of each user, organize the information that is being provided, and develop a perception of the product [34], while considering that the biodigester can be adapted to household activities without representing extra time, they maintain their interest and motivation for the use of this ecotechnology, agree to allocate organic waste to the biodigester, and consider that its handling is easy to understand.

3.2. Process Acceptance

Within the Acceptance stage of the process, the Experience Satisfaction factor registered a higher percentage before applying the EAS with 24.53%; after applying the strategy, the factor that registered a higher percentage was the Adoption of the process with 29.33% (Table 2). The one with the greatest increase after the strategy was the Willingness to pay for it, registering 7% (Figure 5). The mind, perceiving that the new information provided is related to its empirical knowledge and previous experiences, generates an acceptance of the process, facilitating the reception of information by the user, causing the Adoption factor of the process to register a higher percentage, and causing an increase in the Willingness to pay it. The mind, by relating the new information with previous knowledge, facilitates the acceptance of a new process [26], since the knowledge that the user has directly affected the value that they will assign to the product [35]. Long et al. [36] sought to address user acceptance issues embedded in the adoption of reusable packaging systems, emphasizing that increasing the rate of user adoption is tied to user experience.

3.3. Perceived Benefits

Within the Benefits stage, the factor with the highest record was the Economic, registering 29.20% before applying the EAS and 31.20% after the strategy (Figure 6) and (Table 3); however the factor with the highest increase was the Environmental with a 10.4%, followed by the Social with 3.26% and finally the Economic with 2%. Since the user does not represent a monetary expense for the sanitation and management of organic waste in their home, they did not detect monetary savings; on the other hand, people recognised fewer unpleasant odors, greater control of waste, and that the biodigester does not generate flies, therefore the Environmental factor was the one that increased the most. When faced with a purchase decision, the consumer makes a comparison between cost and benefit, obtaining a value for each brand or product, which will be considered for the final decision [37].

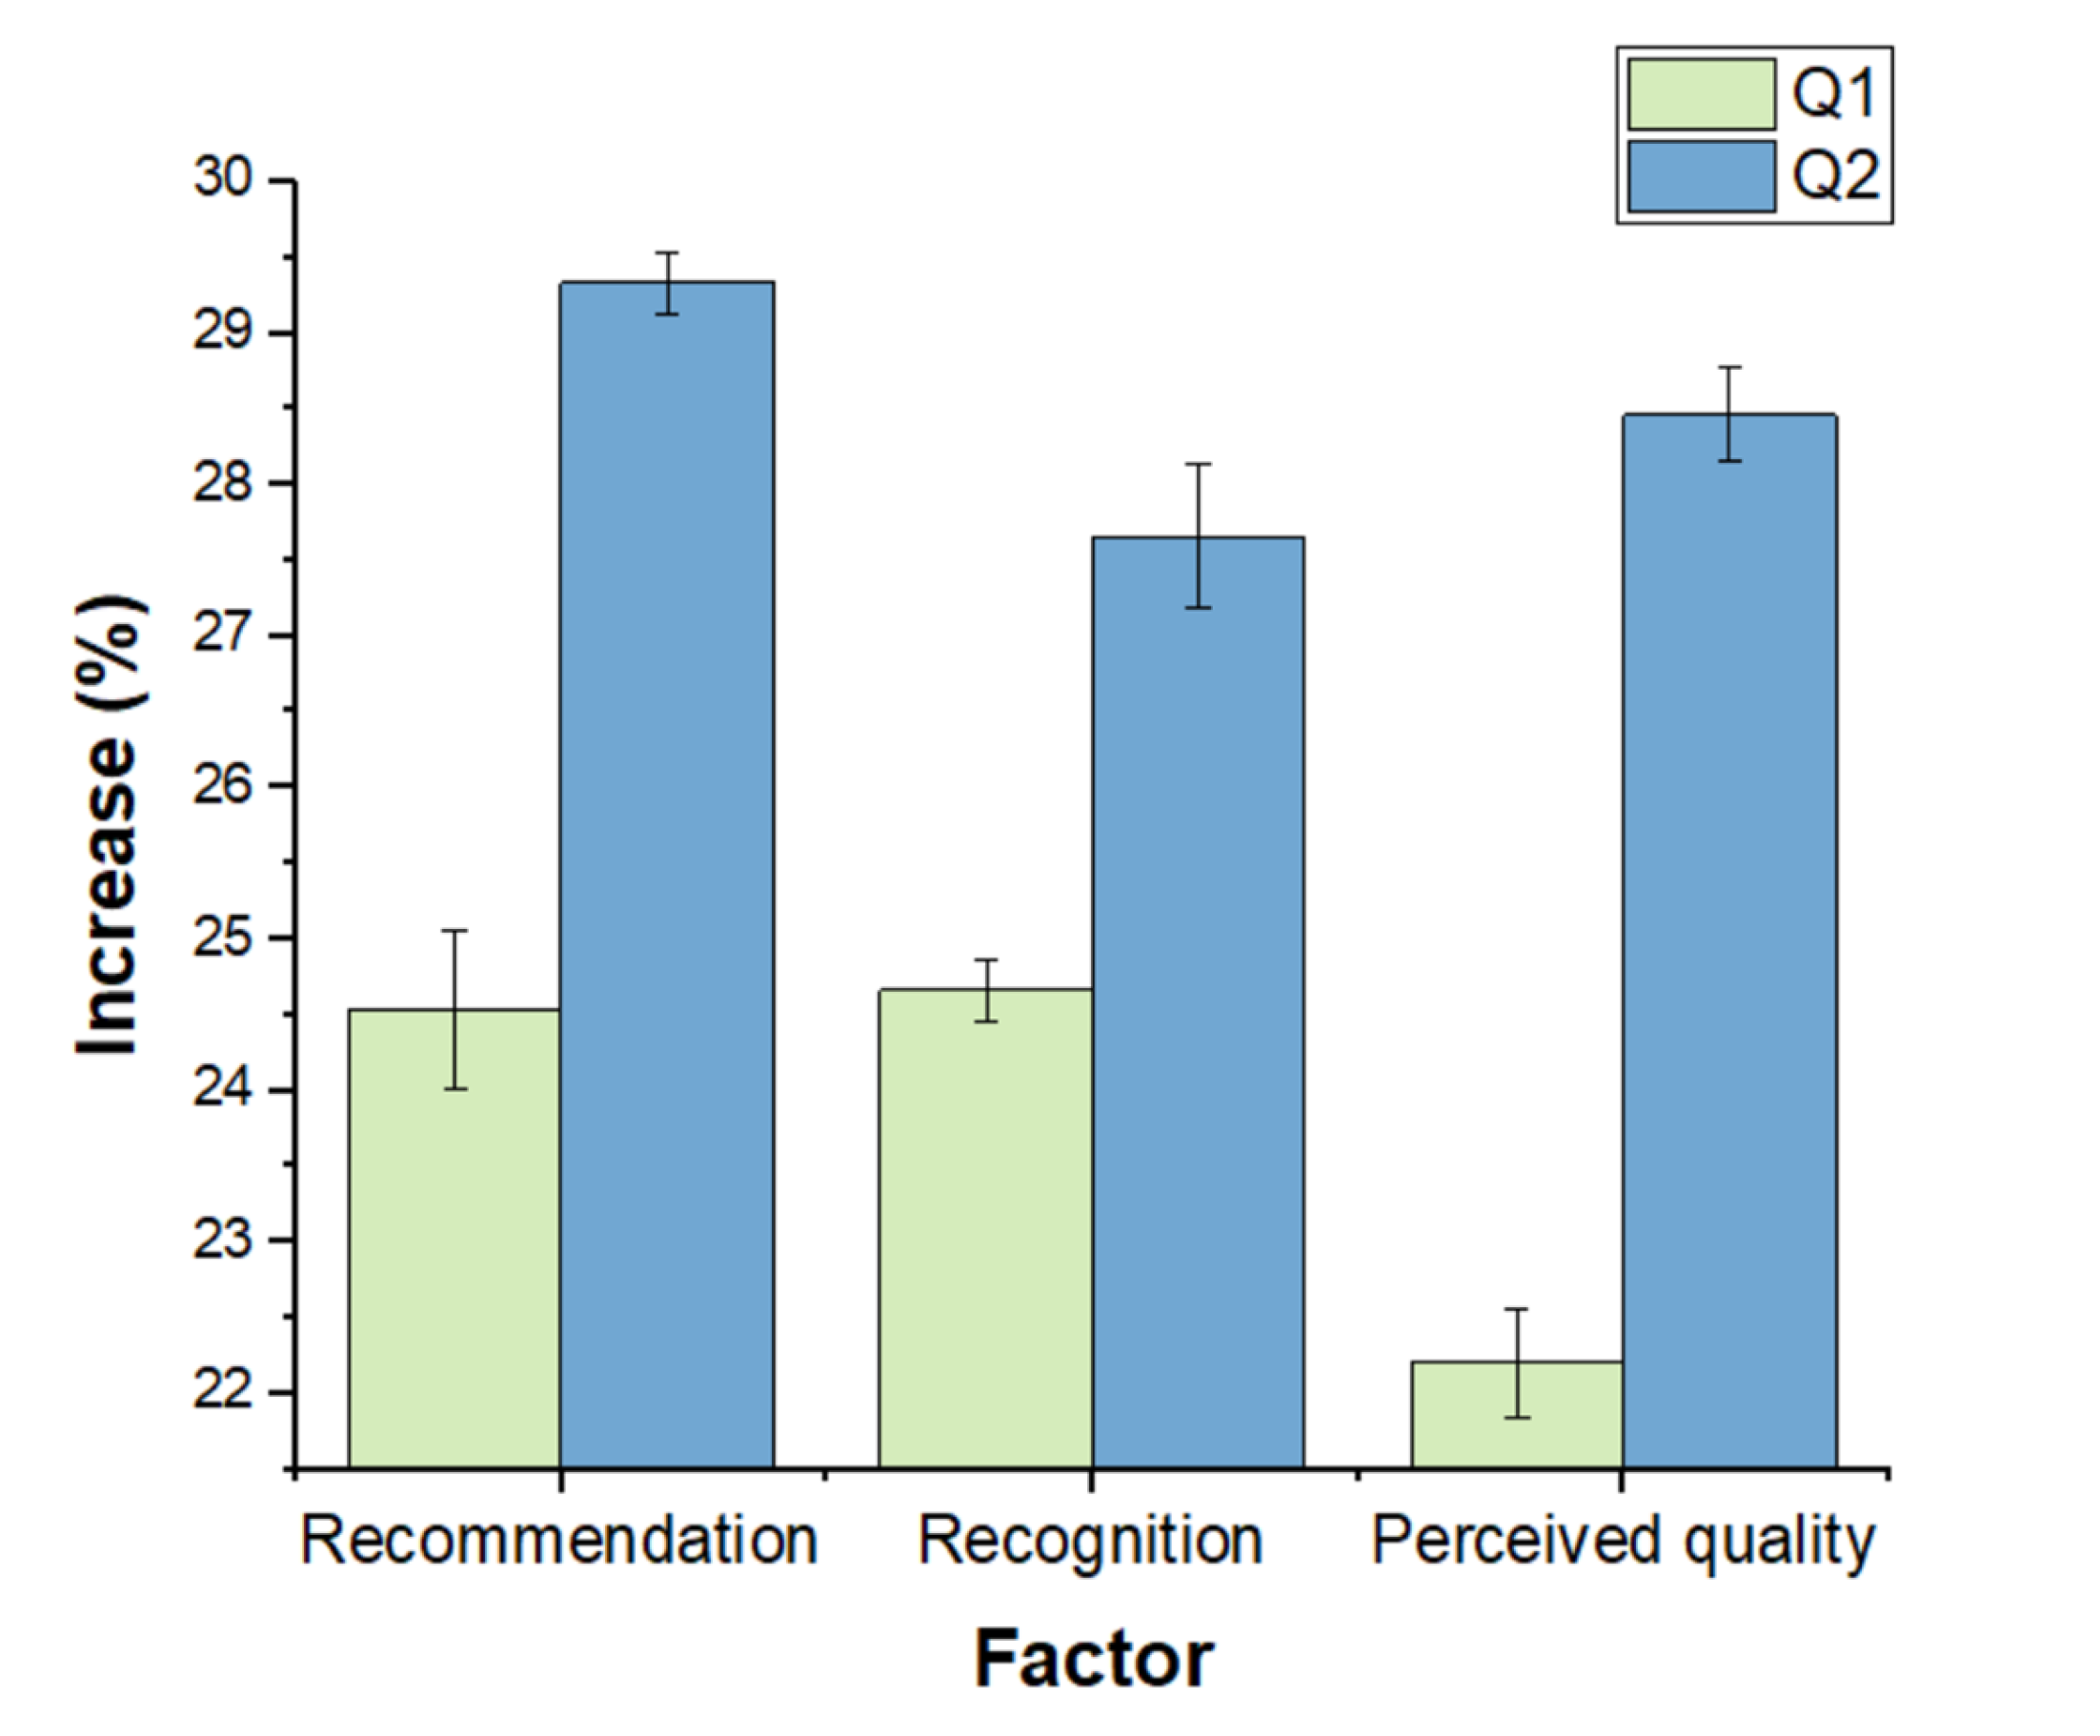
3.4. Adoption of Ecotechnology

Finally, in the Adoption stage, the factor with the highest percentage is Recognition, with 24.66% before the EAS and 27.66% after the strategy (Table 4). It was recorded that Perceived Quality was the factor with the greatest increase of 6.26%, followed by Recommendation with 4.8% and Recognition with 3% (Figure 7). In the results of Adoption of ecotechnology, the Recommendation factor was the highest both in percentage and in increase; users would recommend the biodigester to family and friends since they consider it easy to assemble, manipulate and replicate the information that was imparted in the course. In addition to meeting their expectations, they recognize that it is a product that can cover part of their basic needs. When an increase in the value of the product is generated by the user, the vulnerability of the product towards the competition is reduced [38], obtaining as a response a loyalty towards the product [39].

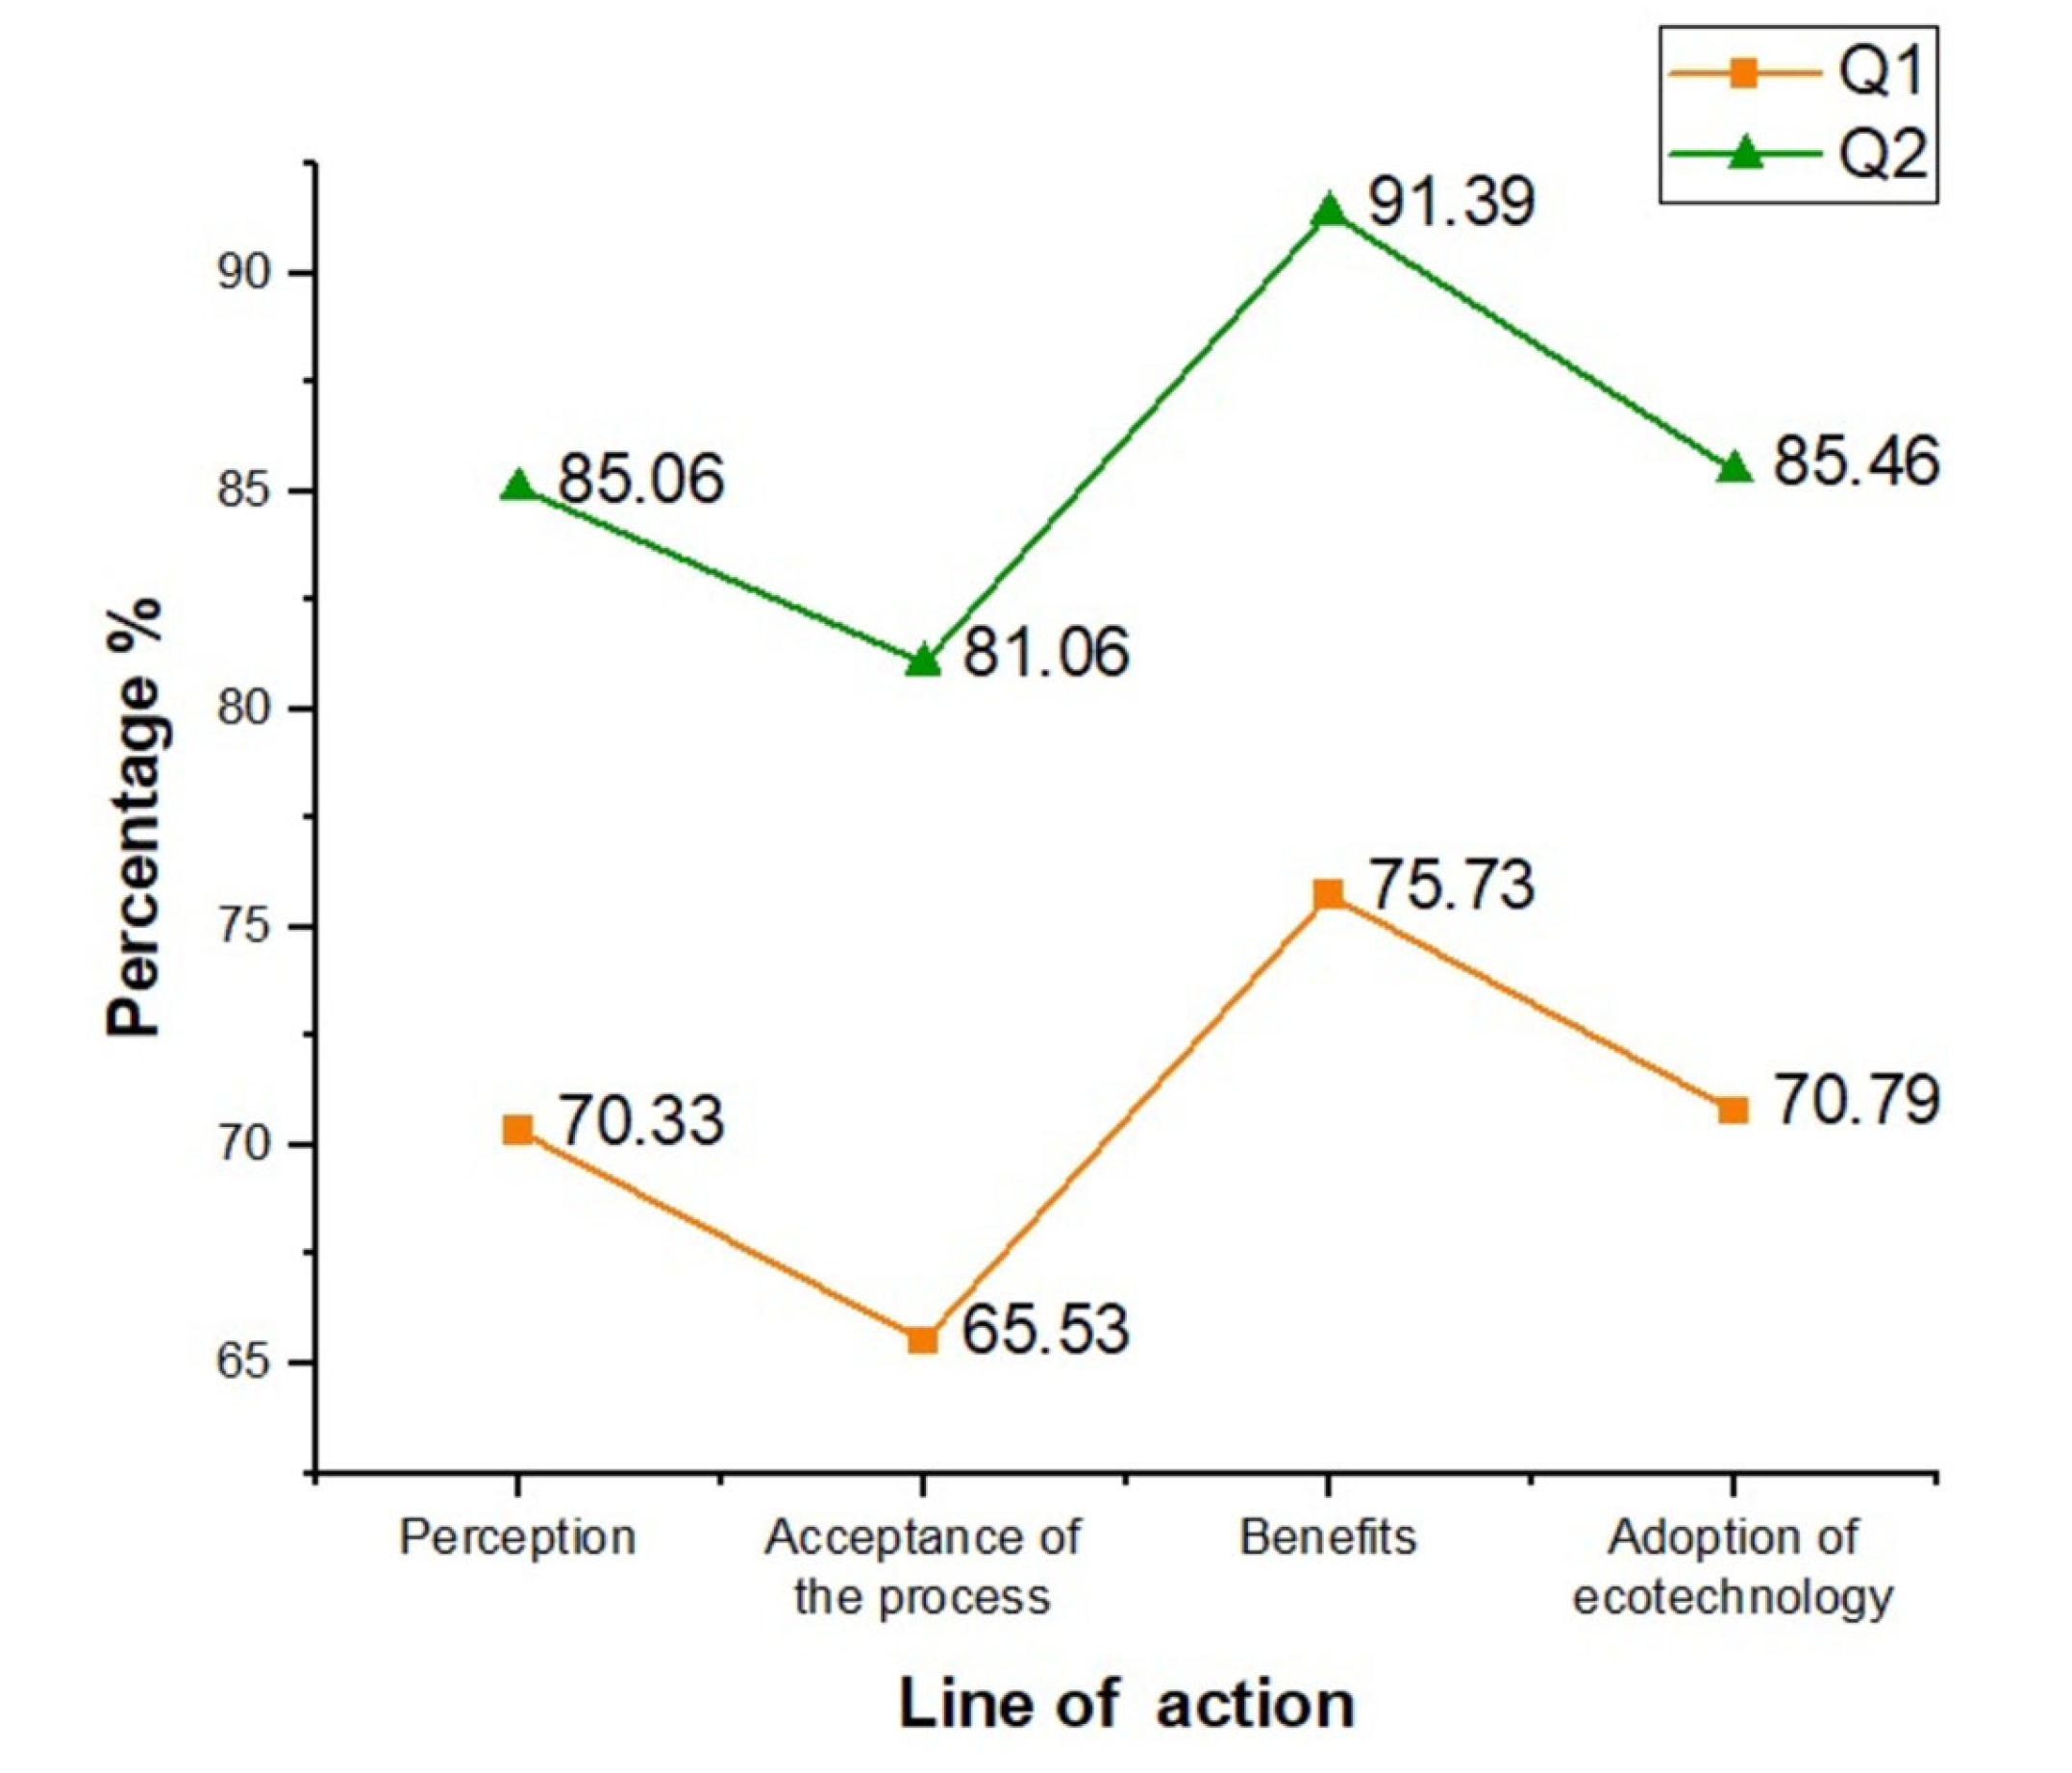
3.5. General Analysis of the Elements

The results of each stage (Figure 8) before and after applying the acceptance strategy, show the increase recorded individually, where a significant difference between the two cases can be seen. Within the axes, the Benefits are the ones that the user gave the most impact, obtaining 91.39% after applying the strategy, followed by the Adoption of ecotechnology with 85.46%, the Perception with 85.06%, and the Acceptance of the process. with 81.06%. Together, the axes increased over the biodigester by 15%, compared to its current method of sanitation, waste separation, and energy supply. For the user, obtaining a real benefit is the axis that has the most impact, causing a direct effect on the Adoption of the technology. In the case of perception, the user correctly receives the information about the biodigester; this allows the acceptance of the process to increase significantly by not representing more time than planned and they are simple activities that they can carry out without representing a conflict for the user. This ecotechnology acceptance strategy shows a framework for behavior analysis that is oriented towards informative, forceful feedback (primary user stimuli) or integration (adaptation to ecotechnology), due to its informative techniques (training courses, User Manual, personalized visits, etc.), allowing the analysis of behavior patterns and incentives for behavior change concerning biodigesters. Several authors have taken complete behavioral intervention models as a reference to develop sustainable design strategies that favor the participation of ecotechnologies in the population [40,41].

4. Conclusions

Acceptance of the use of biodigesters by the end-user was greater than they have with their current sanitation and waste management methods. In general terms, the user agrees to replace their current method of sanitation and waste separation with the biodigester, as well as to replace the use of chemical fertilizers with the biofertilizer generated by the biodigester for their cultivation activities. In the case of biogas, the user accepted its use as the main energy supply for cooking food. The line of action allows for a significant increase in the use of ecotechnologies, so the strategy can be applied with other eco-technologies designed according to the locality.
Since the acceptance strategy was executed under a plan that allowed constant monitoring and follow-up and that the support tools, being easy to understand, allowed the user to consult doubts when required, this caused a decrease in the probability of abandonment of the project biodigester.
The questionnaire to measure the positioning before and after the acceptance strategy helped to detect that the user was not familiar with evaluating their current methods and processes; this aroused in them the curiosity to analyze them, evaluate them, and consider the possibility of trying new alternatives. When applying the second questionnaire, they showed a more analytical evaluation comparing both methods and processes of sanitation and waste management. Dividing the strategy into stages allowed a deep analysis of each one, with each visit that was scheduled to ask the questions corresponding to each stage helping the user to feel a continuity in the project, and to be able to clarify doubts and show their progress and the modifications that they had to do to the original model to adapt it to their own environment and needs.
In the future, it is recommended to extend the measurement time to one year, to keep track of the behavior of the biodigester under the four seasons and detect which seasons lower the performance of the biodigester, thus affecting the user and being able to generate solutions according to situations of low performance that are most likely to occur.

Author Contributions

Investigation, G.M.S.-Z., M.M.F.-N., E.R.-G., S.Z.-C., G.M.-B., M.S.H.-L. and A.E.S.-G.; Writing—review & editing, G.M.S.-Z., M.M.F.-N., E.R.-G., S.Z.-C., G.M.-B., M.S.H.-L. and A.E.S.-G. All authors have read and agreed to the published version of the manuscript.

Funding

This research received no external funding.

Institutional Review Board Statement

The study was approved by the Institutional Review Board (or Ethics Committee) of Autonomous University of Queretaro (protocol code CEAIFI-042-2018-TI and 2018).

Informed Consent Statement

Informed consent was obtained from all subjects involved in the study.

Data Availability Statement

Not applicable.

Acknowledgments

The authors acknowledgement the financial support by El Consejo Nacional de Ciencia y Tecnología (CONACYT).

Conflicts of Interest

The authors declare no conflict of interest.

Appendix A

Appendix A.1

Figure A1. The general outline of the PowerPoint presentation.
Sustainability 14 09389 g0a1

Appendix A.2

Figure A2. Evaluation Questionnaire.
Sustainability 14 09389 g0a2

Appendix A.3

Figure A3. Quality Function Deployment of the biodigester model.
Sustainability 14 09389 g0a3

References

  1. Kaza, S.; Yao, L.C.; Bhada, T.P.; Van, W.F. What a Waste 2.0: A Global Snapshot of Solid Waste Management to 2050; Urban Development: Washington, DC, USA, 2018. [Google Scholar]
  2. Coneval. Diagnóstico del Derecho a la Vivienda Digna y Decorosa 2018, Primera ed, 2018. Available online: https://www.coneval.org.mx/Evaluacion/IEPSM/Documents/Derechos_Sociales/Estudio_Diag_Vivienda_2018.pdf (accessed on 9 August 2021).
  3. UNESCO; WWAP. The United Nations World Water Development Report, Leaving No One Behind, the United Nations Human Rights Council (UNHRC), 2019. Available online: http://www.unwater.org/publications/world-water-development-report-2019/ (accessed on 22 September 2021).
  4. Schrader, K.K.; Liu, A. Informe del Banco Mundial: Los Desechos a Nivel Mundial Crecerán un 70% Para 2050, a Menos que se Adopten Medidas Urgentes, 2018. Available online: https://www.bancomundial.org/es/news/press-release/2018/09/20/global-waste-to-grow-by-70-percent-by-2050-unless-urgent-action-is-taken-world-bank-report (accessed on 22 October 2021).
  5. Organización Panamericana de la Salud OPS. Saneamiento Básico. Saneam. Rural y Salud/Guia Para Acciones a Niv. Local. 2010, 38. Available online: https://iris.paho.org/handle/10665.2/52823 (accessed on 4 September 2021).
  6. CONAGUA. Programa Nacional para Captación de Agua de Lluvia y Ecotecnias en Zonas Rurales (PROCAPTAR), 2017. Available online: https://www.gob.mx/conagua/acciones-y-programas/programa-nacional-para-captacion-de-agua-de-lluvia-y-ecotecnias-en-zonas-rurales-procaptar (accessed on 22 October 2021).
  7. Gómez, O.L.; Tacuba, S.A. La política de desarrollo rural en México? Existe correspondencia entre lo formal y lo real? The rural development policy in Mexico. Is there correspondence between the formal and the real? EconomíaUNAM 2017, 14. [Google Scholar] [CrossRef]
  8. Da Silva Lanna, M.C.; Viancelli, A.; Michelon, W.; Carvalho, S.V.C.; Dos Reis, D.D.A.; de Salles, L.A.F.; Sant’Anna, I.H.; Resende, L.T.; de Souza Ferreira, C.; das Chagas, I.A.; et al. Household-based biodigesters promote reduction of enteric virus and bacteria in vulnerable and poverty rural área. Environ. Pollut. 2019, 252, 8–13. [Google Scholar] [CrossRef] [PubMed]
  9. Mahmudul, H.M.; Rasul, M.G.; Akbar, D.; Narayanan, R.; Mofijur, M. A comprehensive review of the recent development and challenges of a solar-assisted biodigester system. Sci. Total Environ. 2021, 753, 141920. [Google Scholar] [CrossRef] [PubMed]
  10. Kulkarni, I.; Zang, J.W.; Leandro, W.M.; Parikh, P.; Adler, I.; da Fonseca-Zang, W.A.; Campos, L.C. Closed-Loop Biodigesters on Small-Scale Farms in Low- and Middle-Income Countries: A Review. Water 2021, 13, 2744. [Google Scholar] [CrossRef]
  11. RedBioLAC. RedBiolac Cuarta edición 2020; Rev. RedBioLAC, Uarta Edición: 2019. Available online: http://redbiolac.org/wp-content/uploads/2020/12/RedBioLAC-2020-3M.pdf (accessed on 22 October 2021).
  12. Kajau, G.; Madyira, D.M. Analysis of the Zimbabwe biodigester status. Procedia Manuf. 2019, 35, 561–566. [Google Scholar] [CrossRef]
  13. Rupf, G.V.; Bahri, P.A.; de Boer, K.; McHenry, M.P. Broadening the potential of biogas in Sub-Saharan Africa: An assessment of feasible technologies and feedstocks. Renew. Sustain. Energy Rev. 2016, 61, 556–571. [Google Scholar] [CrossRef]
  14. Li, Y.; Park, S.Y.; Zhu, J. Solid-state anaerobic digestion for methane production from organic waste. Renew. Sustain. Energy Rev. 2011, 15, 821–826. [Google Scholar] [CrossRef]
  15. Augusto de Lemos Chernicharo, C. Biological wastewater treatment: Anaerobic reactors. Belo Horiz. Dep. Eng. Sanitária e Ambient. Univ. Fed. Minas Gerais 2007, 5, 379. [Google Scholar]
  16. Sener. Reporte de Inteligencia Tecnológica “Biocombustibles Sólidos,” Mapas Ruta Tecnológica Para Los Centros Mex. Innovación En Energía. 2017, 73. Available online: https://www.gob.mx/cms/uploads/attachment/file/306072/Inteligencia_Tecnologica_BCS_220218.pdf (accessed on 17 December 2021).
  17. García-Lozano, M.; Lira, I.O.E.; Huber, D.H.; Balagurusamy, N. Spatial Variations of Bacterial Communities of an Anaerobic Lagoon-Type Biodigester Fed with Dairy Manure. Processes 2019, 7, 408. [Google Scholar] [CrossRef] [Green Version]
  18. Lee, J.; Han, G.; Shin, S.G.; Koo, T.; Cho, K.; Kim, W.; Hwang, S. Seasonal monitoring of bacteria and archaea in a full-scale thermophilic anaerobic digester treating food waste-recycling wastewater: Correlations between microbial community characteristics and process variables. Chem. Eng. J. 2016, 300, 291–299. [Google Scholar] [CrossRef]
  19. SEMARNAT. Informe de la Situación del Medio Ambiente en México. Naturales. Syria Stud. 2015, 7, 37–72. Available online: https://apps1.semarnat.gob.mx:8443/dgeia/informe15/tema/pdf/Informe15_completo.pdf (accessed on 17 December 2021).
  20. Cruz-Santos, M.M.; Macías-Franco, M.R.; Herrera-Medina, K.S.; Diaz-Ruiz, E.; Chandel, A.K.; da Santos, J.C.; da Silva, S.S.; Ramesh, P.T.; Sánchez-Muñoz, M.A. Governmental Policies to Promote Biogas Production, Boosting Role of Biogas in Economic Growth of Developing Nations. In Biogas Production: From Anaerobic Digestion to a Sustainable Bioenergy Industry; Balagurusamy, N., Chandel, A.K., Eds.; Springer International Publishing: Cham, Switzerland, 2020; pp. 447–469. [Google Scholar] [CrossRef]
  21. Acunzo, M.; Pafumi, M.; Torres, C.; Tirol, M. Manual de Comunicación Para el Desarrollo Rural. Organización de las Naciones Unidas Para La Alimentación y La Agricultura (FAO): Rome, Italy, 2016; Available online: https://www.fao.org/documents/card/es/c/62aae887-ab20-465a-aa37-1cbc15fcd868/ (accessed on 17 December 2021).
  22. Najjar, D.A.; Normandin, A.M.; Strait, E.A.; Esvelt, K.M. Driving towards ecotechnologies. Pathog. Glob. Health 2017, 111, 448–458. [Google Scholar] [CrossRef] [Green Version]
  23. Cervantes, G.I.; Pérez, R.H. Mitigation Strategies, the Biodigester Program in Yucatan, Mexico. Península 2018, 13, 235–262. [Google Scholar]
  24. Fuchs, C.; Diamantopoulos, A. Customer-perceived positioning effectiveness: Conceptualization, operationalization, and implications for new product managers. J. Prod. Innov. Manag. 2012, 29, 229–244. [Google Scholar] [CrossRef]
  25. FAO. Manual del Biogás, Proy. CHI/00/G32. 2011, 120. Available online: http://www.fao.org/docrep/019/as400s/as400s.pdf (accessed on 18 December 2021).
  26. Schunik, W.; Mora, F. El Posicionamiento, La Guerra por un Lugar en la Mente del Consumidor; Venez. Amolca, 2009; p. 44. Available online: https://docplayer.es/29449624-El-posicionamiento-autores-fabiola-mora-walter-schupnik-la-guerra-por-un-lugar-en-la-mente-del-consumidor.html (accessed on 18 December 2021).
  27. Hernández, W.R. Branding sustentable. Rev. Cent. Investig. Univ. Salle 2012, 10, 95–99. [Google Scholar]
  28. Ortega, M.S.; Ceballos, P.B. Design Thinking: Lidera el Presente. Crea el Futuro; Esic Editorial: Pozuelo de Alarcón, Madrid, 2015. [Google Scholar]
  29. CONEVAL. Consejo Nacional de Evaluación de la Política de Desarrollo Social, Informe de Pobreza y Evaluación, Querétaro 2018, 2020, 117. Available online: https://bit.ly/2QexnU2 (accessed on 18 December 2021).
  30. IMPLAN. Plan Estratégico del Municipio de Querétaro a Largo Plazo. Inst. Munic. Planeación 2020. Available online: http://implanqueretaro.gob.mx/v2/im/st/0/mod_p2050/MunicipioDeQueretaro_PLAN2050.pdf (accessed on 18 December 2021).
  31. CONEVAL. Consejo Nacional de Evaluación de la Política de Desarrollo Social, Informe Anual Sobre la Situación de Pobreza y Rezago Social. Inf. Anu. Sobre La Situación Pobr. Y Rezago Soc. 2018, 2. Available online: http://www.dof.gob.mx/SEDESOL/Chiapas_108.pdf (accessed on 22 February 2022).
  32. SEDESOL. Annual Report on Poverty and Social Backwardness 2016, Tequisquiapan, Querétaro Tequisquiapan. Querétaro 2016, 2015–2016. Available online: http://diariooficial.gob.mx/SEDESOL/2016/Queretaro_017.pdf (accessed on 5 March 2022).
  33. Spiegel, M.R.I.; John, J.; Srinivasan, R. Probabilidad y Estadística/Murray R. Spiegel, John J. Schiller y R. Alu Srinivasan., 2013. Available online: https://eduvirtual.cuc.edu.co/moodle/pluginfile.php/523771/mod_resource/content/1/EstadisticadeSchaum.pdf (accessed on 22 February 2022).
  34. Coca, M. Importancia y Concepto del Posicionamiento una Breve Revisión Teórica. Perspectivas 2007, 20, 105–114. [Google Scholar]
  35. Keller, P.A.; McGill, A.L. Differences in the relative influence of product attributes under alternative processing conditions: Attribute importance versus attribute ease of imagability. J. Consum. Psychol. 1994, 3, 29–49. [Google Scholar] [CrossRef]
  36. Long, Y.; Ceschin, F.; Harrison, D.; Terzioğlu, N. Exploring and Addressing the User Acceptance Issues Embedded in the Adoption of Reusable Packaging Systems. Sustainability 2022, 14, 6146. [Google Scholar] [CrossRef]
  37. Merlo, F.J.V. La promoción de ventas y los beneficios percibidos por el consumidor. Rev. Eur. Dir. Y Econ. La Empres. 2005, 14, 209–222. [Google Scholar]
  38. Barrie, C.A.; Gallo, M.P.; Pérez, J.A.P. Análisis de la Innovación de Marcas de Distribuidor y de su Influencia en la Aceptación de Productos Nuevos de Gran Consumo en España; Universidad Complutense de Madrid: Madrid, Spain, 2009. [Google Scholar]
  39. Martínez, J.V. Perfil de valor de marca y la medición de sus componentes. Acad. Rev. Latinoam. Adm. 2008, 41, 69–89. [Google Scholar]
  40. Bocken, N.M.P.; Bom, C.A.; Lemstra, H. Business-led sustainable consumption strategies: The case of HOMIE. In Proceedings of the 18th ERSCP Conference, Skiathos Island, Greece, 1–5 October 2017. [Google Scholar]
  41. Bhamra, T.; Lilley, D.; Tang, T. Design for Sustainable Behaviour: Using Products to Change Consumer Behaviour. Des. J. 2011, 14, 427–445. [Google Scholar] [CrossRef]
Figure 1. Map of the municipality of Tequisquiapan, Queretaro, Mexico, indicating Priority Attention Zones (PAZ) and localities with the greatest social backwardness [32].
Sustainability 14 09389 g001
Figure 2. General system of the strategy of acceptance of ecotechnologies for the execution of the line of action with its main axes of intervention.
Sustainability 14 09389 g002
Figure 3. Measurement time of each stage.
Sustainability 14 09389 g003
Figure 4. Comparison of the increase in the factors of the Perception stage between Q1 (before applying the acceptance strategy) and Q2 (after applying the acceptance strategy).
Sustainability 14 09389 g004
Figure 5. Comparison of the increase in the factors of the Acceptance of the process stage between Q1 (before applying the acceptance strategy) and Q2 (after applying the acceptance strategy).
Sustainability 14 09389 g005
Figure 6. Comparison of the increase in the factors of the Perceived benefits stage between Q1 (before applying the acceptance strategy) and Q2 (after applying the acceptance strategy).
Sustainability 14 09389 g006
Figure 7. Comparison of the increase in the factors of the Adoption of ecotechnology stage between Q1 (before applying the acceptance strategy) and Q2 (after applying the acceptance strategy).
Sustainability 14 09389 g007
Figure 8. Comparison the increase in the four main intervention axes of the line of action between Q1 (before applying the acceptance strategy) and Q2 (after applying the acceptance strategy).
Sustainability 14 09389 g008
Table 1. Analysis of the increase in the factors of the Perception stage before and after applying the strategy.
FactorQ1 (%)Q2 (%)
Physical stimuli25.53 ± 0.3329.53 ± 0.21
Internal stimuli22.66 ± 0.7828.40 ± 0.46
Needs22.13 ± 0.6727.13 ± 0.55
Table 2. Analysis of the increase in the factors of the Acceptance of the process stage before and after applying the strategy.
FactorQ1 (%)Q2 (%)
Willingness to pay18.46 ± 0.5125.46 ± 0.23
Satisfaction in the experience24.53 ± 0.4126.26 ± 0.82
Adoption of the process22.53 ± 0.6329.33 ± 0.29
Table 3. Analysis of the increase in the factors of the Perceived benefits stage before and after applying the strategy.
FactorQ1 (%)Q2 (%)
Economic29.20 ± 0.1731.20 ± 0.09
Social27.40 ± 0.9330.66 ± 0.37
Environmental19.13 ± 0.7429.53 ± 0.16
Table 4. Analysis of the increase in the factors of the Adoption of ecotechnology stage before and after applying the strategy.
FactorQ1 (%)Q2 (%)
Recommendation24.53 ± 0.5327.86 ± 0.20
Recognition24.06 ± 0.2027.66 ± 0.48
Perceived quality22.20 ± 0.3528.46 ± 0.31
Publisher’s Note: MDPI stays neutral with regard to jurisdictional claims in published maps and institutional affiliations.

