Article

Social Capital Typologies and Sustainable Development: Spatial Patterns in the Central and Southern Regions of Malawi

School of Geography and Environmental Sciences, University of Southampton, Southampton SO17 1BJ, UK
*
Author to whom correspondence should be addressed.
Sustainability 2022, 14(15), 9374; https://doi.org/10.3390/su14159374
Submission received: 31 May 2022 / Revised: 18 July 2022 / Accepted: 22 July 2022 / Published: 31 July 2022
(This article belongs to the Special Issue Social Capital and Sustainability: Spatial Evidence)

Abstract

:
Bonding, bridging and linking social capital can be a useful mechanism to promote sustainable development in low-income countries. Social capital typologies vary spatially, with the rural poor having a specific combination. Similarly, bonding, bridging and linking social capital’s association with sustainable development is also likely to differ spatially across a country, but there is limited research in low-income countries. This study aims to improve understanding of the spatial variation of bonding, bridging and linking social capital in low-income countries using Malawi as a case study. Using secondary data and spatial statistics, including kriging and geographically weighted regression, we explore the spatial variation of social capital typologies and their spatial associations with various sustainable development indicators. There were three key combinations of bonding, bridging and linking social capital, which differ from the standard model of social capital typologies for the rural poor. We also found social capital’s association with sustainable development indicators depends on the social capital typology, study area and the sustainable development indicator in question. With this in mind, development practitioners, researchers and policymakers should aim to understand the specific social capital context prior to sustainable development research or project implementation.

1. Introduction

Characterising and understanding social capital has grown as a research topic over the past two decades and has been applied to many different contexts, including sustainable development. Within sustainable development, social capital has been defined as “the institutions, relationships, attitudes and values that govern interactions among people and contribute to economic and sustainable development” [1].
Social capital has been associated with, and deemed useful within, sustainable development and is now an important explanatory concept for sustainable development [2,3]. Community groups, a common proxy for social capital, have been linked with sustainable agriculture practises such as improved water efficiency, uptake of agroforestry and improvement of soil health [4]. Similarly, the local social network structure required for rural sustainable development relies on strong social capital [5]. Communities that rely on one another and have active community groups live by a set of social norms and rules, which keep one another accountable, resulting in more sustainable practises. Research has also found higher amounts of social capital are associated with lower poverty [6], higher incomes [7], better public health [8] and successful climate adaptation [9]. Social capital is particularly important in resource-dependent communities as it is the backbone of sustainable resource management and adaptation to climate change [4,10]. Without good resource management and adaptation, these communities may be vulnerable to a multitude of issues such as extreme weather events, environmental degradation and food insecurity.
In low-income, resource-dependent communities, social capital is integral to many parts of life such as health, finances and accessing food. Social capital can be used to improve access to credit or enterprise loans needed to invest in livelihoods [11] or for the poorest in society is used to access informal loans required to pay for basic needs [12]. Similarly, social capital may improve health outcomes and has been associated with better access to health facilities [13], improved neonatal health outcomes in Uganda [14] and the development of community-based health insurance in Nepal [15]. Finally, both rural and urban food security can be influenced by social capital through urban agriculture groups in South Africa [16] and women’s social groups in rural Ethiopia [17].
Although existing research has identified social capital as an important concept within sustainable development, a deeper understanding of how social capital and sustainable development are associated is lacking. Spatial patterns in the different types of social capital and how they relate to specific sustainable development indicators are not widely known. The widely used social capital theory and measurements are also based on social capital in high-income countries; however, the social capital context in low-income countries is different to that of high-income countries [18]. A lack of understanding of the aforementioned issues has limited the use and impact of social capital within sustainable development projects and policy. This study provides original contributions to the literature by exploring the spatial patterns of social capital typologies and their associations with sustainable development in a low-income context.

Social Capital

Social capital has experienced renewed interest since the 1990′s after Putnam’s research found civic engagement was declining in the USA and questioned its impact on democracy [19]. Putnam’s work on social capital, along with two other key scholars [20,21], is a key source of social capital theory in current social capital research. Social capital can be used to meet objectivess, grasp new opportunities, build collective action and manage crises [19] and can exist from the individual to the multinational level. Within each relation or interaction, there are positive externalities that can manifest as resources or information. Social capital is interlinked with other capitals; financial, human, physical and natural [22] and can influence various parts of an individual’s life and wider society.
The World Bank’s Social Capital Institute was a key source of research on social capital, with a specific focus on economic development [1]. In the case of economic development, social capital plays a role in enhancing incomes and employment and decreasing transaction costs. At the sub national level, social capital was the second most important predictor of GDP growth in the USA [23], with a multi-country and multidecadal study showing a similar result [24], although it must be noted no low-income countries were included.
Social capital’s relevance is particularly important in contexts where formal institutions and government planning are limited [25] and social capital acts as a source of information and resources that would otherwise be difficult to access. For example, in countries where formal credit is only accessible by large-scale farming businesses, small-scale farmers set up their own informal credit systems [12]. Similarly, Social Impact Bonds are established between the private and public sector to tackle social problems, such as crime or youth unemployment, to account for the public sector’s shortcomings which have failed to find a solution [26]. Social capital’s relevance varies depending on the type of social capital, context and level of analysis; however, research agrees it plays a role in people’s social relations, livelihoods and ability to withstand crises.
Social capital is multidimensional and can be unpacked into its different dimensions, typologies and levels. The three dimensions are cognitive, relational and structural [27]. Cognitive social capital represents how people feel and think about one another, as well as their shared values, whilst the relational dimension focuses on trust and norms. Structural social capital refers to the connections and networks between people and groups of people who are governed by rules. Structural social capital is more objective, open to quantitative measuring and recognises the importance of social networks and connections. Structural, cognitive and relational social capital are interlinked. For example, trustworthiness is key for the formation, continuation, and fee collection of community water management groups [28]. Although the dimensions are interlinked, often only one or two of the dimensions are adopted in research which depends on the research question, data availability and disciplinary background [27]. In the case of sustainable development, it is generally agreed that structural social capital is the most useful. Structural social capital has resources embedded within relationships, such as food or money, hence has more of an association with improvements in development outcomes [2,29].
Within the structural dimension of social capital, there are three typologies: bonding, bridging and linking [30,31,32,33]. Bonding social capital reflects relationships between people who have a shared background, culture and identity, such as family and friends [34]. Bridging social capital refers to relations between people or groups who work together for a mutual benefit [35] and can include farmer cooperatives or women’s groups. This collective action can be between people with homogenous and heterogenous characteristics, but regardless, the formal power dynamic is equal. Earlier social capital research described bonding and bridging social capital as strong and weak ties, respectively [36]. Putnam alleged that bonding social capital is used for ‘getting by’ [37], with poor rural communities using their bonding ties to ensure basic needs, such as food, water and shelter. Meanwhile, bridging social capital is for ‘getting ahead’ and can help communities take the steps needed to develop beyond just meeting basic needs.
Linking social capital was added as the third typology to acknowledge the power dynamics that exist within relationships, which Putnam was originally criticised for ignoring [38]. Linking social capital refers to relationships between people or groups that have an unequal power dynamic. Linking social capital can provide resources, information and skills to people that may struggle to access them on their own [30], so it is particularly important in resource-dependent communities. The connection between an NGO and a rural community can be described as linking social capital [30].
Although it is agreed that social capital is multidimensional and various dimensions or typologies need to be considered in research [2,39,40], there is a continued overreliance on using one social capital indicator [9,39,41,42,43]. Using multiple typologies in social capital research is paramount as bonding, bridging and linking social capital are associated with different sustainable development outcomes in different ways, which will vary depending on the context [44]. For example, bonding social capital was associated with higher food security in Nigeria, with bridging social capital having no association [45]. In contrast, bridging social capital was associated with higher food security in Uganda, with bonding social capital having no association [32]. Whilst social capital has potential to help communities develop sustainably, the association between social capital typologies and specific sustainable development outcomes needs to be well understood within the specific context.
Social capital’s usefulness within sustainable development is also limited due to spatial variations of the social capital typologies being under-acknowledged. Social capital exists in a specific space [44], meaning the locations of communities or households will impact the social capital they have and how it is used. For social capital to be maintained and utilised, people need to be able to communicate, which is dependent on face-to-face interactions or technology, although the latter may not be an option in the low-income country setting [46]. If social capital typologies are space-dependent, spatial variations will exist. Spatial variations in social capital typologies are likely to be amplified in resource-dependent communities that may have limited access and ability to maintain and utilise certain types of social capital. Recent work [47] has found spatial north–south patterns in bonding, bridging and linking social capital across the USA, which was particularly pronounced for bonding social capital. Similarly, it was theorised that the rural poor have a specific combination of social capital with high bonding, modest bridging and low linking social capital [48]. Despite spatial differences existing, there are a limited number of studies that explicitly address the spatial distribution of social capital [49,50] or spatially map social capital, instead making statistical comparisons between rural and urban areas.
Due to social capital’s importance in sustainable development, it has been stated that development practitioners and policymakers should invest in social capital [51,52,53]. However, the project or policy design depends on the social capital in the study area and the sustainable development outcome in question [2]. Social capital typologies are associated with different development outcomes and whether they have the desired outcomes depends on context. One first step practitioners need to take prior to actioning projects and policy is understanding the current levels of bonding, bridging and linking social capital in the specific context [23].
This paper aims to address the gaps in the social capital and sustainable development literature, using Malawi as an example. First, we map the bonding, bridging and linking social capital across the study area to explore whether spatial variations in the social capital typologies exist, and what the key patterns are. This will indicate the current level of bonding, bridging and linking social capital across the Southern and Central Regions of Malawi. Secondly, the paper models the spatial association between bonding, bridging and linking social capital and proxies for sustainable development using geographically weighted regression. The second aim will provide an understanding of how the social capital typologies are associated with specific sustainable development indicators and where the association exists. This paper improves the limited knowledge of social capital in Malawi but is also the first step for practitioners who wish to explore the stock of social capital typologies before implementing social capital into sustainable development projects and policy.

2. Materials and Methods

2.1. Study Site

Malawi is a small landlocked country in Southern Africa (Figure 1), which has experienced limited development. Ranked 174th out of 189 countries, Malawi has a low Human Development Index [54]. Malawi has a high level of poverty, with 69.2% of the population living on less than $1.90 a day in 2016 [55], which is below the international poverty line. Over 80% of the population is employed in agriculture, most of which are smallholder farmers [56]. Malawi is characterised by poor quality of land and is particularly vulnerable to extreme weather events, especially in the Southern Region [57]. This threatens the livelihoods of the many smallholder farmers who are dependent on rainfed agriculture for food and to make an income.
Social capital is described as being high in sub-Saharan African countries but is particularly strong in Malawi [58]. Post-Independence, there was a conscious push to maintain African values centred around tight-knit communities and a call to reject Western individualism [59]. Going to market, attending religious ceremonies and relying on family and friends for support are part of the day-to-day social fabric that results in strong social capital in Malawi [58]. Nevertheless, social capital has been shown to vary between and within communities [60]. For example, linking social capital such as NGO-led projects and extension services vary spatially in Malawi [61,62]. Communities have different combinations of social capital typologies which is likely to vary spatially; however, there is little understanding of what the spatial patterns of social capital may be. A study on social capital and health in Malawi [60] concluded that further research into bonding, bridging and linking social capital would prove useful to understanding social capital in low-income countries, as research is limited in this context. Understanding the spatial variations of bonding, bridging and linking social capital will be of use to development practitioners in Malawi who wish to implement a social capital aspect to projects and policy.

2.2. Materials

The main data source is the Fourth Malawian Integrated Household Survey (IHS4) 2016–2017, with the household and community modules being used. The IHS4 follows a stratified two-stage sampling design, and data collection took place between April 2016 and April 2017 [63]. The IHS4 survey has a focus on monitoring improvements in poverty and vulnerability, and 606 data points were available across the Central and Southern Region. Additional data were used in the geographically weighted regression (GWR) to explore the association between social capital typologies and proxies for sustainable development (Table 1). As there are a vast number of sustainable development indicators and outcomes, the Sustainable Livelihoods Framework [64] was used during conceptualisation, with a focus on the assets pentagon, vulnerability context and shocks. Secondarily, indicators were selected based on the availability of secondary data. Each sustainable development proxy’s data source and spatial resolution is given in Table 1. The specific sustainable development goal (SDG) relevance is also given, with the exception of the shock components. Data were cleaned, extracted and analysed in RStudio [65] and the IBM Statistical Package for the Social Sciences [66].
The built settlement, vulnerability and poverty data were raster datasets, so values were extracted for each Enumeration Area (EA). Values could not be extracted using the coordinates provided by the IHS4 as they are offset to ensure anonymity. The demographic and health survey (DHS) methodology for working with offset coordinates was followed [71], as the DHS and IHS4 coordinates follow a similar offset system [72].

2.3. Methods

Bonding, bridging and linking social capital were mapped across the regions by creating 3 separate indices and values were interpolated across the Central and Southern Regions of Malawi. To understand the association between social capital typologies and sustainable development and how this association may vary spatially, GWR was undertaken, resulting in three separate models. Data analysis was conducted in RStudio, and maps were produced in ArcGIS Pro.

2.4. Social Capital Indices

There are no standard proxies for estimating social capital and, therefore, no agreed-upon guidance for creating social capital indices [31]. Certain social capital proxies, such as group membership, are more widely acceptable than others [35]. Although there is no standard method to measure social capital, the social capital integrate questionnaire (SC-IQ) is the most used and consists of 6 components. In this study, the bonding, bridging and linking social capital indices are mainly constructed from group membership, group characteristics and social exchanges, which are widely agreed upon proxies. Table 2 shows the variables used to create the bonding, bridging and linking social capital indices, how they relate to elements of the SC-IQ and previous studies that use similar social capital proxies.
Creating indices from social capital proxy variables can take an inductive or deductive approach [79]. A deductive approach takes a limited number of variables that are known to reflect the construct in question, based on past research and a priori theory. Meanwhile, an inductive approach selects all variables that may be a suitable proxy for the construct, resulting in a large number of variables that then need to be minimised using a variable reduction method. Due to a limited number of social capital proxies available in the survey and the proxies being commonly used in previous research, a deductive approach was taken to create the bonding, bridging and linking indices.
Prior to creating the indices, variables were normalised for the community population size and standardised by converting values into z-scores. Variables were then summed with equal weightings and an average taken, resulting in standardised social capital indices which could be compared. Variables were given equal weighting as caution must be taken when giving weights across a large study site when the variables in question are so context-specific, such as social capital [80]. For example, bridging social capital groups may be highly important in one community but not in another community. How important variables are in different locations, and therefore the weights they should be given, would have required key informant interviews across the study area.
Bonding, bridging and linking social capital indices were created using the household and community modules in the IHS4 survey. For the bonding social capital index (SCI), a subset of questions from the household survey was used. The answers in the survey are binary, so they were summed to a bonding score for each household, which ranged between 0 and 7. The score was aggregated to the community level by averaging the household social capital scores in each community which allowed the bonding SCI to be mapped and compared to bridging and linking SCI. There are issues with aggregating individual data to the community level, such as loss of information and ecological fallacy [81], and this is a limitation to this study. Similar aggregation issues in the construction of their social capital indices have occurred in previous research [47], highlighting a downfall of using secondary data survey data in spatial social capital research. The bridging and linking social capital indices were constructed using variables from the community module of the IHS4 (Table 2).
The bonding, bridging and linking SCI were spatially interpolated across the rest of the study area to estimate the SCI in areas where there were no data points. The interpolation made predictions for the bonding, bridging and linking SCI in areas with no data points, which allowed for easier visual interpretation of spatial patterns. The ordinary kriging method was used as it is a reliable method of spatial interpolation using geostatistical methods [82]. Geostatistical methods account for spatial autocorrelation, unlike deterministic interpolation methods such as inverse distance weighted interpolation (IDW) or spline [83]. The data points in this study are not regularly spaced across the study region, again making ordinary kriging more suitable than IDW [84]. To predict values in unsampled areas, a model needs to be fit to the empirical semivariogram. The functions for the semivariogram were chosen by eye to ensure they were a good reflection of the empirical data. A gaussian semivariogram was used for the linking SCI interpolation and a spherical semivariogram for the bonding and bridging SCI interpolation. To identify areas that may have been poorly predicted, the output variance of prediction for each interpolation was also mapped (Supplementary Materials Figure S1).

2.5. Geographically Weighted Regression

Spatial autocorrelation exists in most data [85], and local variations should be accounted for using modelling techniques such as GWR. GWR allows for local variation between the dependent and independent variables and sees spatial variation as something to explore rather than a problem. Multilevel modelling and spatial lag models were considered; however, as social capital is not bound by administrative boundaries and the study does not aim to predict social capital based on its determinants, they were disregarded. It must be noted that GWR is an exploratory tool for understanding spatial variations [86,87,88], as coefficient estimates are calculated using the same data points multiple times, which can lead to high amounts of multicollinearity [89]. The risk of multicollinearity can be reduced by using sample sizes exceeding 400 [90], which this study did. Despite GWR being an exploratory method, it remains a useful method in combined environmental and social research [86,88,91,92]. As the study aims to understand the spatial association between bonding, bridging and linking social capital and proxies for sustainable development, GWR is the most suitable method.
Prior to running the GWR, the spatial autocorrelation of the bonding, bridging and linking social capital indices was estimated using the Moran’s I statistic [93]. To decide which of the many independent variables should be included in the GWR, forward stepwise linear regressions were performed. As linear regression and GWR are not multivariate techniques, three separate regressions for linear regression and then GWR were performed with bonding, bridging and linking SCI as dependent variables. GWR was performed with the spgwr package in RStudio. The GWR were run with adaptive kernels, as observations were not uniform across the region. The bandwidths were automatically selected in RStudio, with the CV bandwidth being used [94]. The adjusted R2 and Akaike Information Criterion (AICc) were calculated to assess the model performance for the linear regression and GWR [95]. GWR parameter coefficients for each independent variable were mapped, differentiating between significance (1–10%) and insignificance points [96].

3. Results

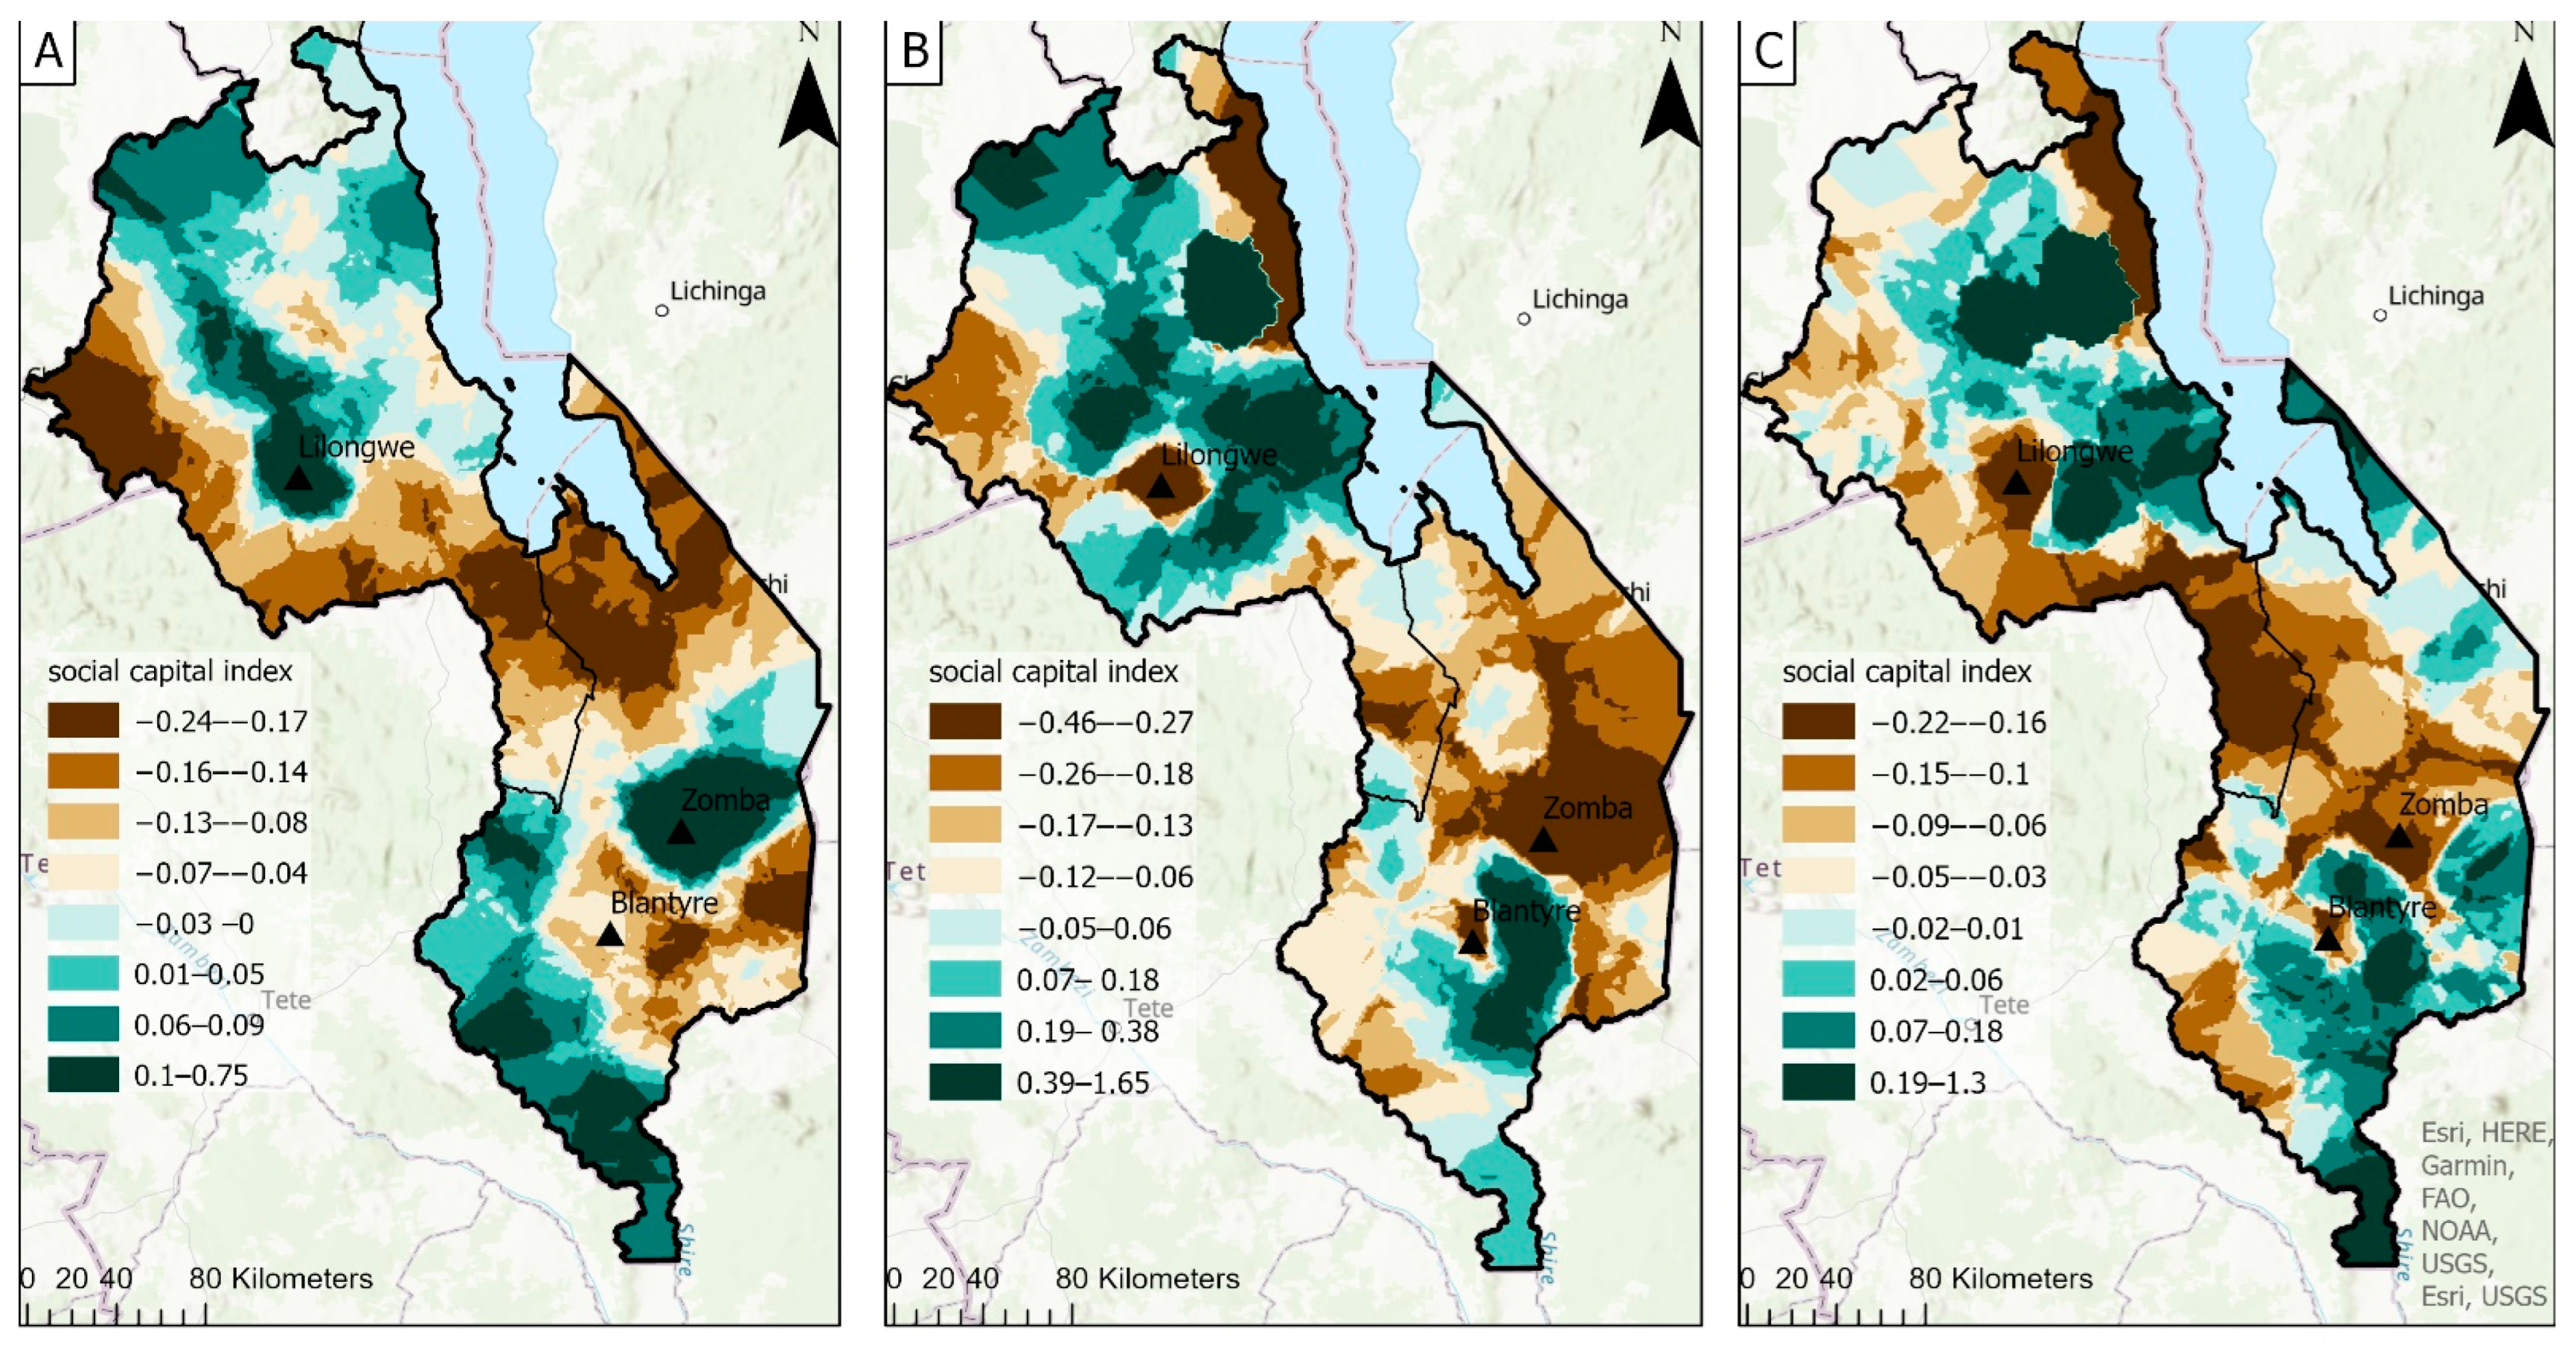
3.1. Social Capital Indices

The bonding, bridging and linking SCI interpolation maps (Figure 2) show spatial differences across the Central and Southern Regions. The bonding SCI is highest in Zomba, Lilongwe and the southwest of the Southern Region. Meanwhile, bonding SCI is lowest in the middle portion of the study area, northwest of Lilongwe and east of Blantyre. A large part of the central region has a high bridging SCI, as does a cluster near Blantyre. The bridging SCI is lowest in Blantyre, Lilongwe, Zomba, the eastern portion of the Southern Region and the north-western edge of the Central Region. Lilongwe, Zomba and an area in the middle of the study area have low linking SCI. The highest linking SCI is found in southwest of the Southern Region and a large western area in the Central Region. Based on the interpolation maps, three main combinations of different levels of bonding, bridging and linking SCI can be identified (Table 3). Combination 1 is characterised by high-moderate bonding, low bridging and low linking social capital. Meanwhile, low bonding, moderate-low bridging and moderate linking social capital are exhibited in Combination 2. Finally, Combination 3 shows high-moderate bonding, high bridging and high-moderate linking social capital.

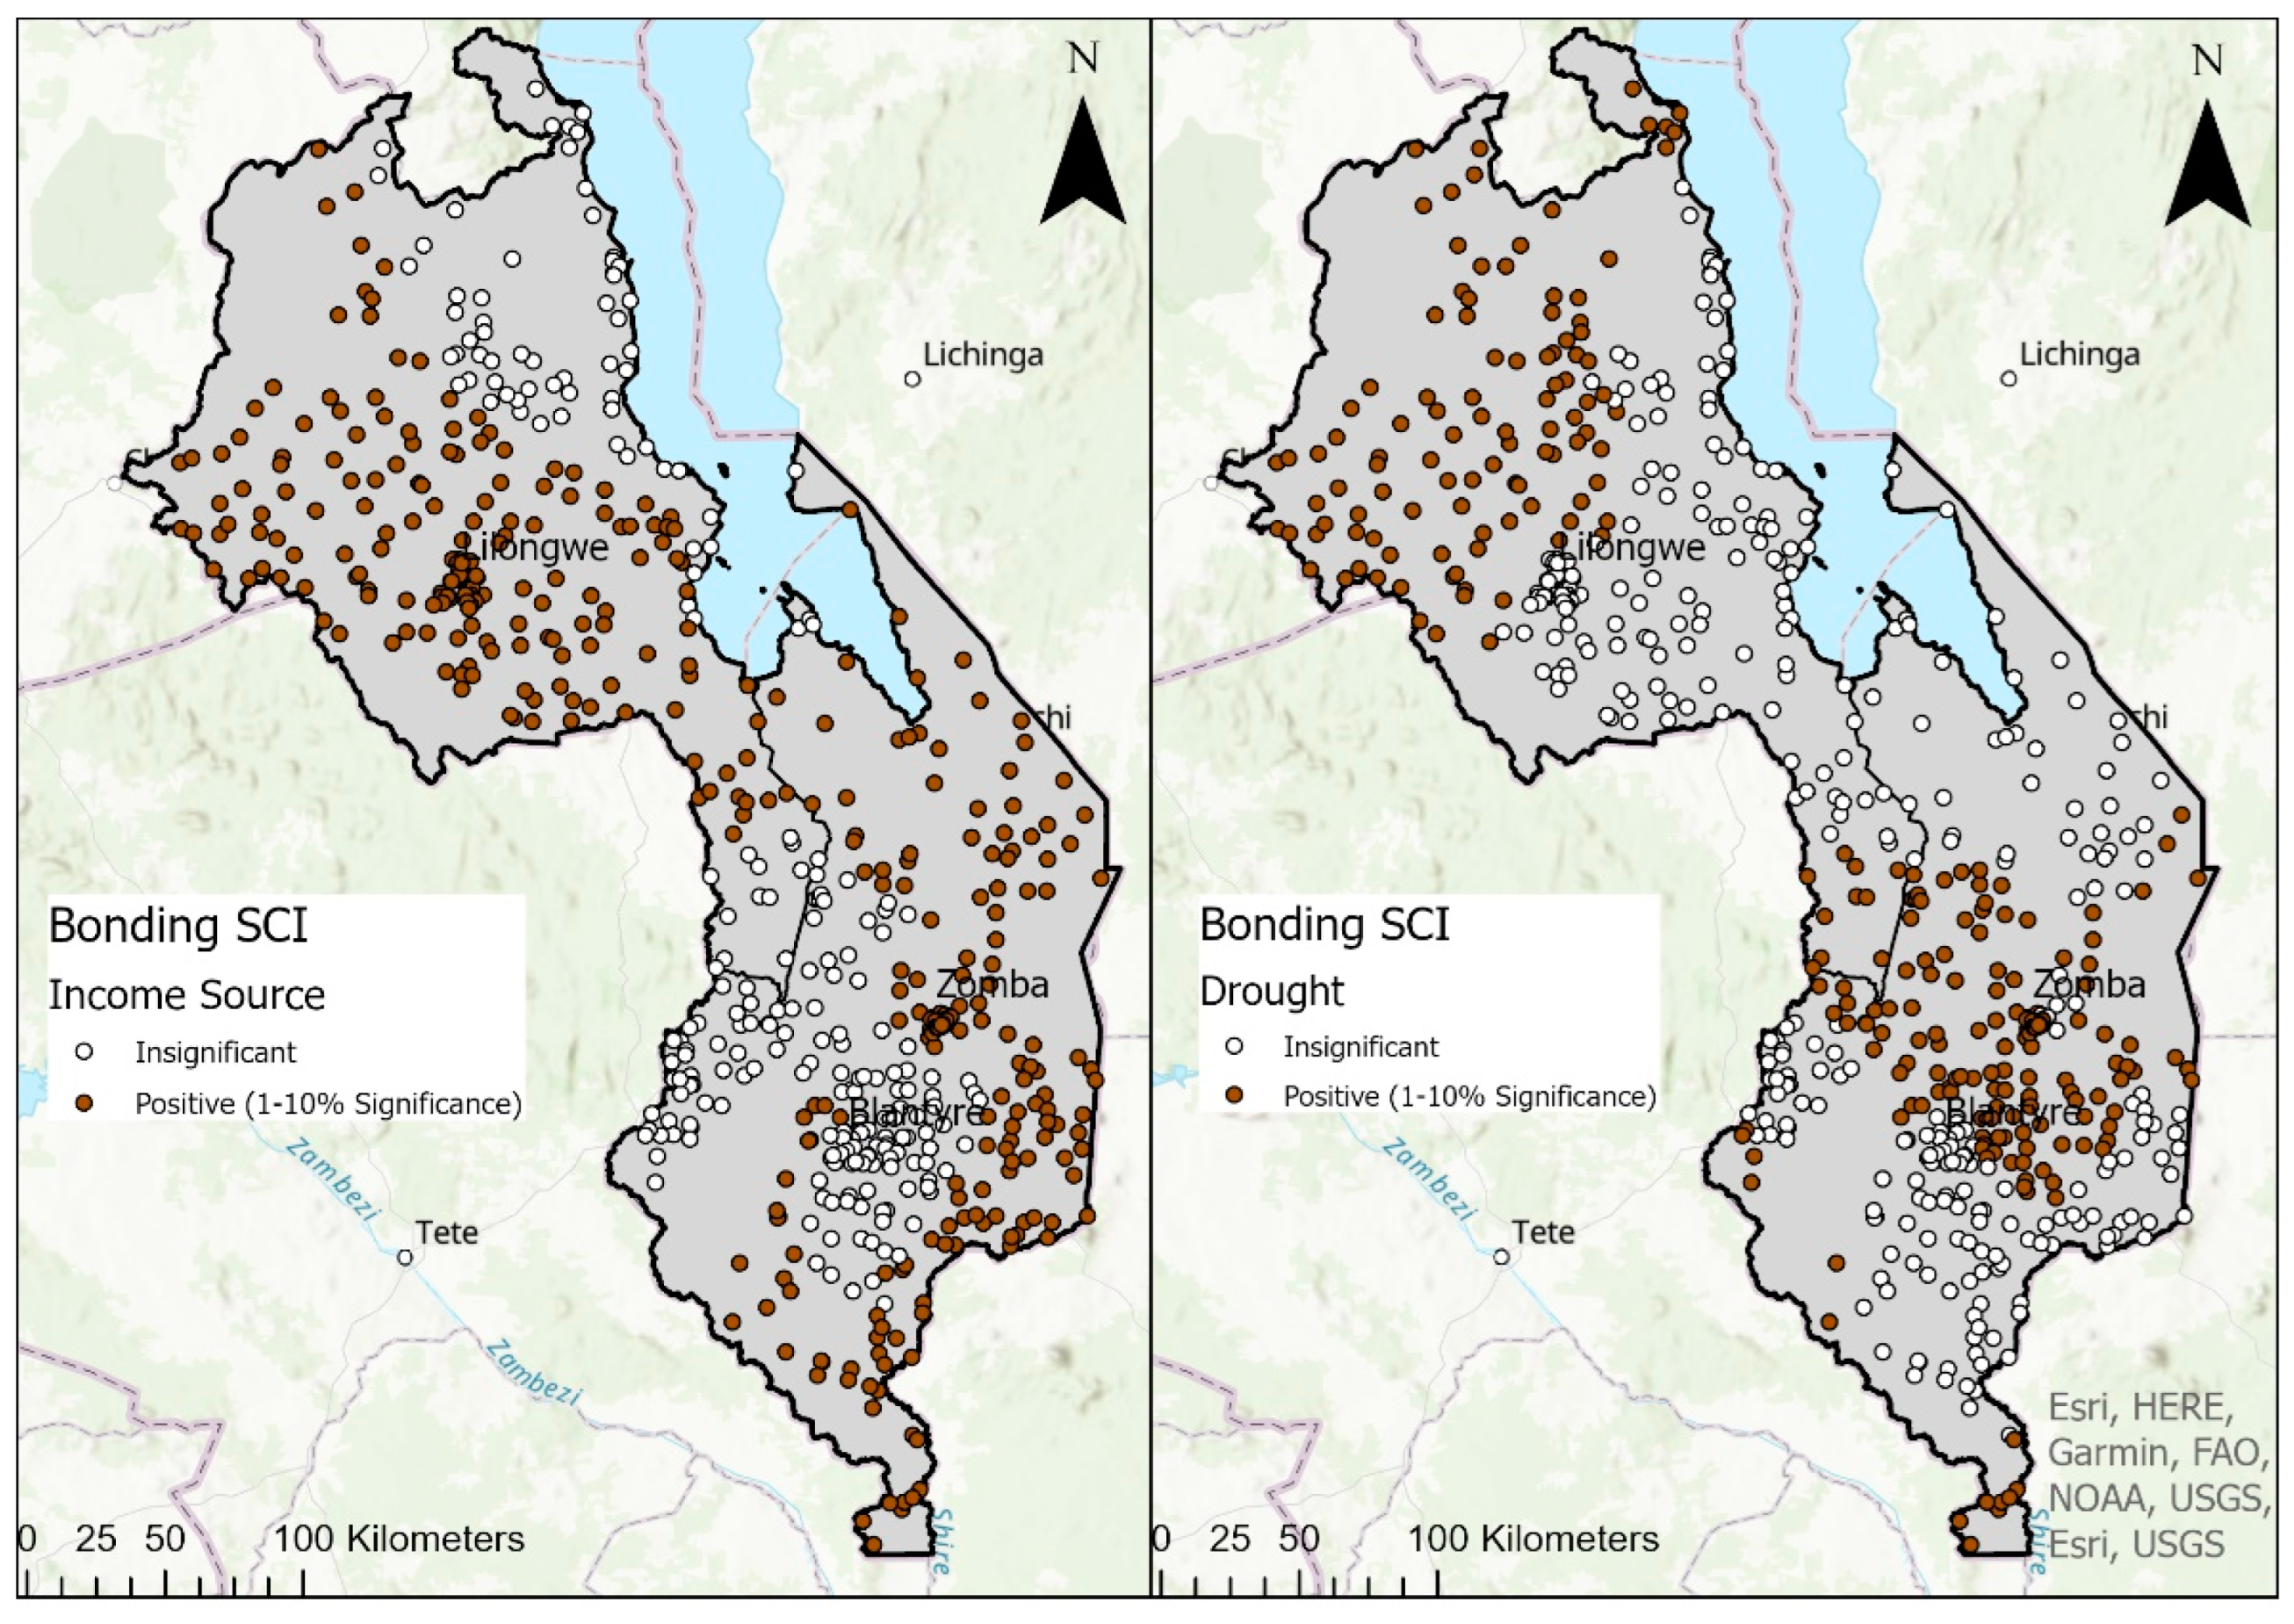
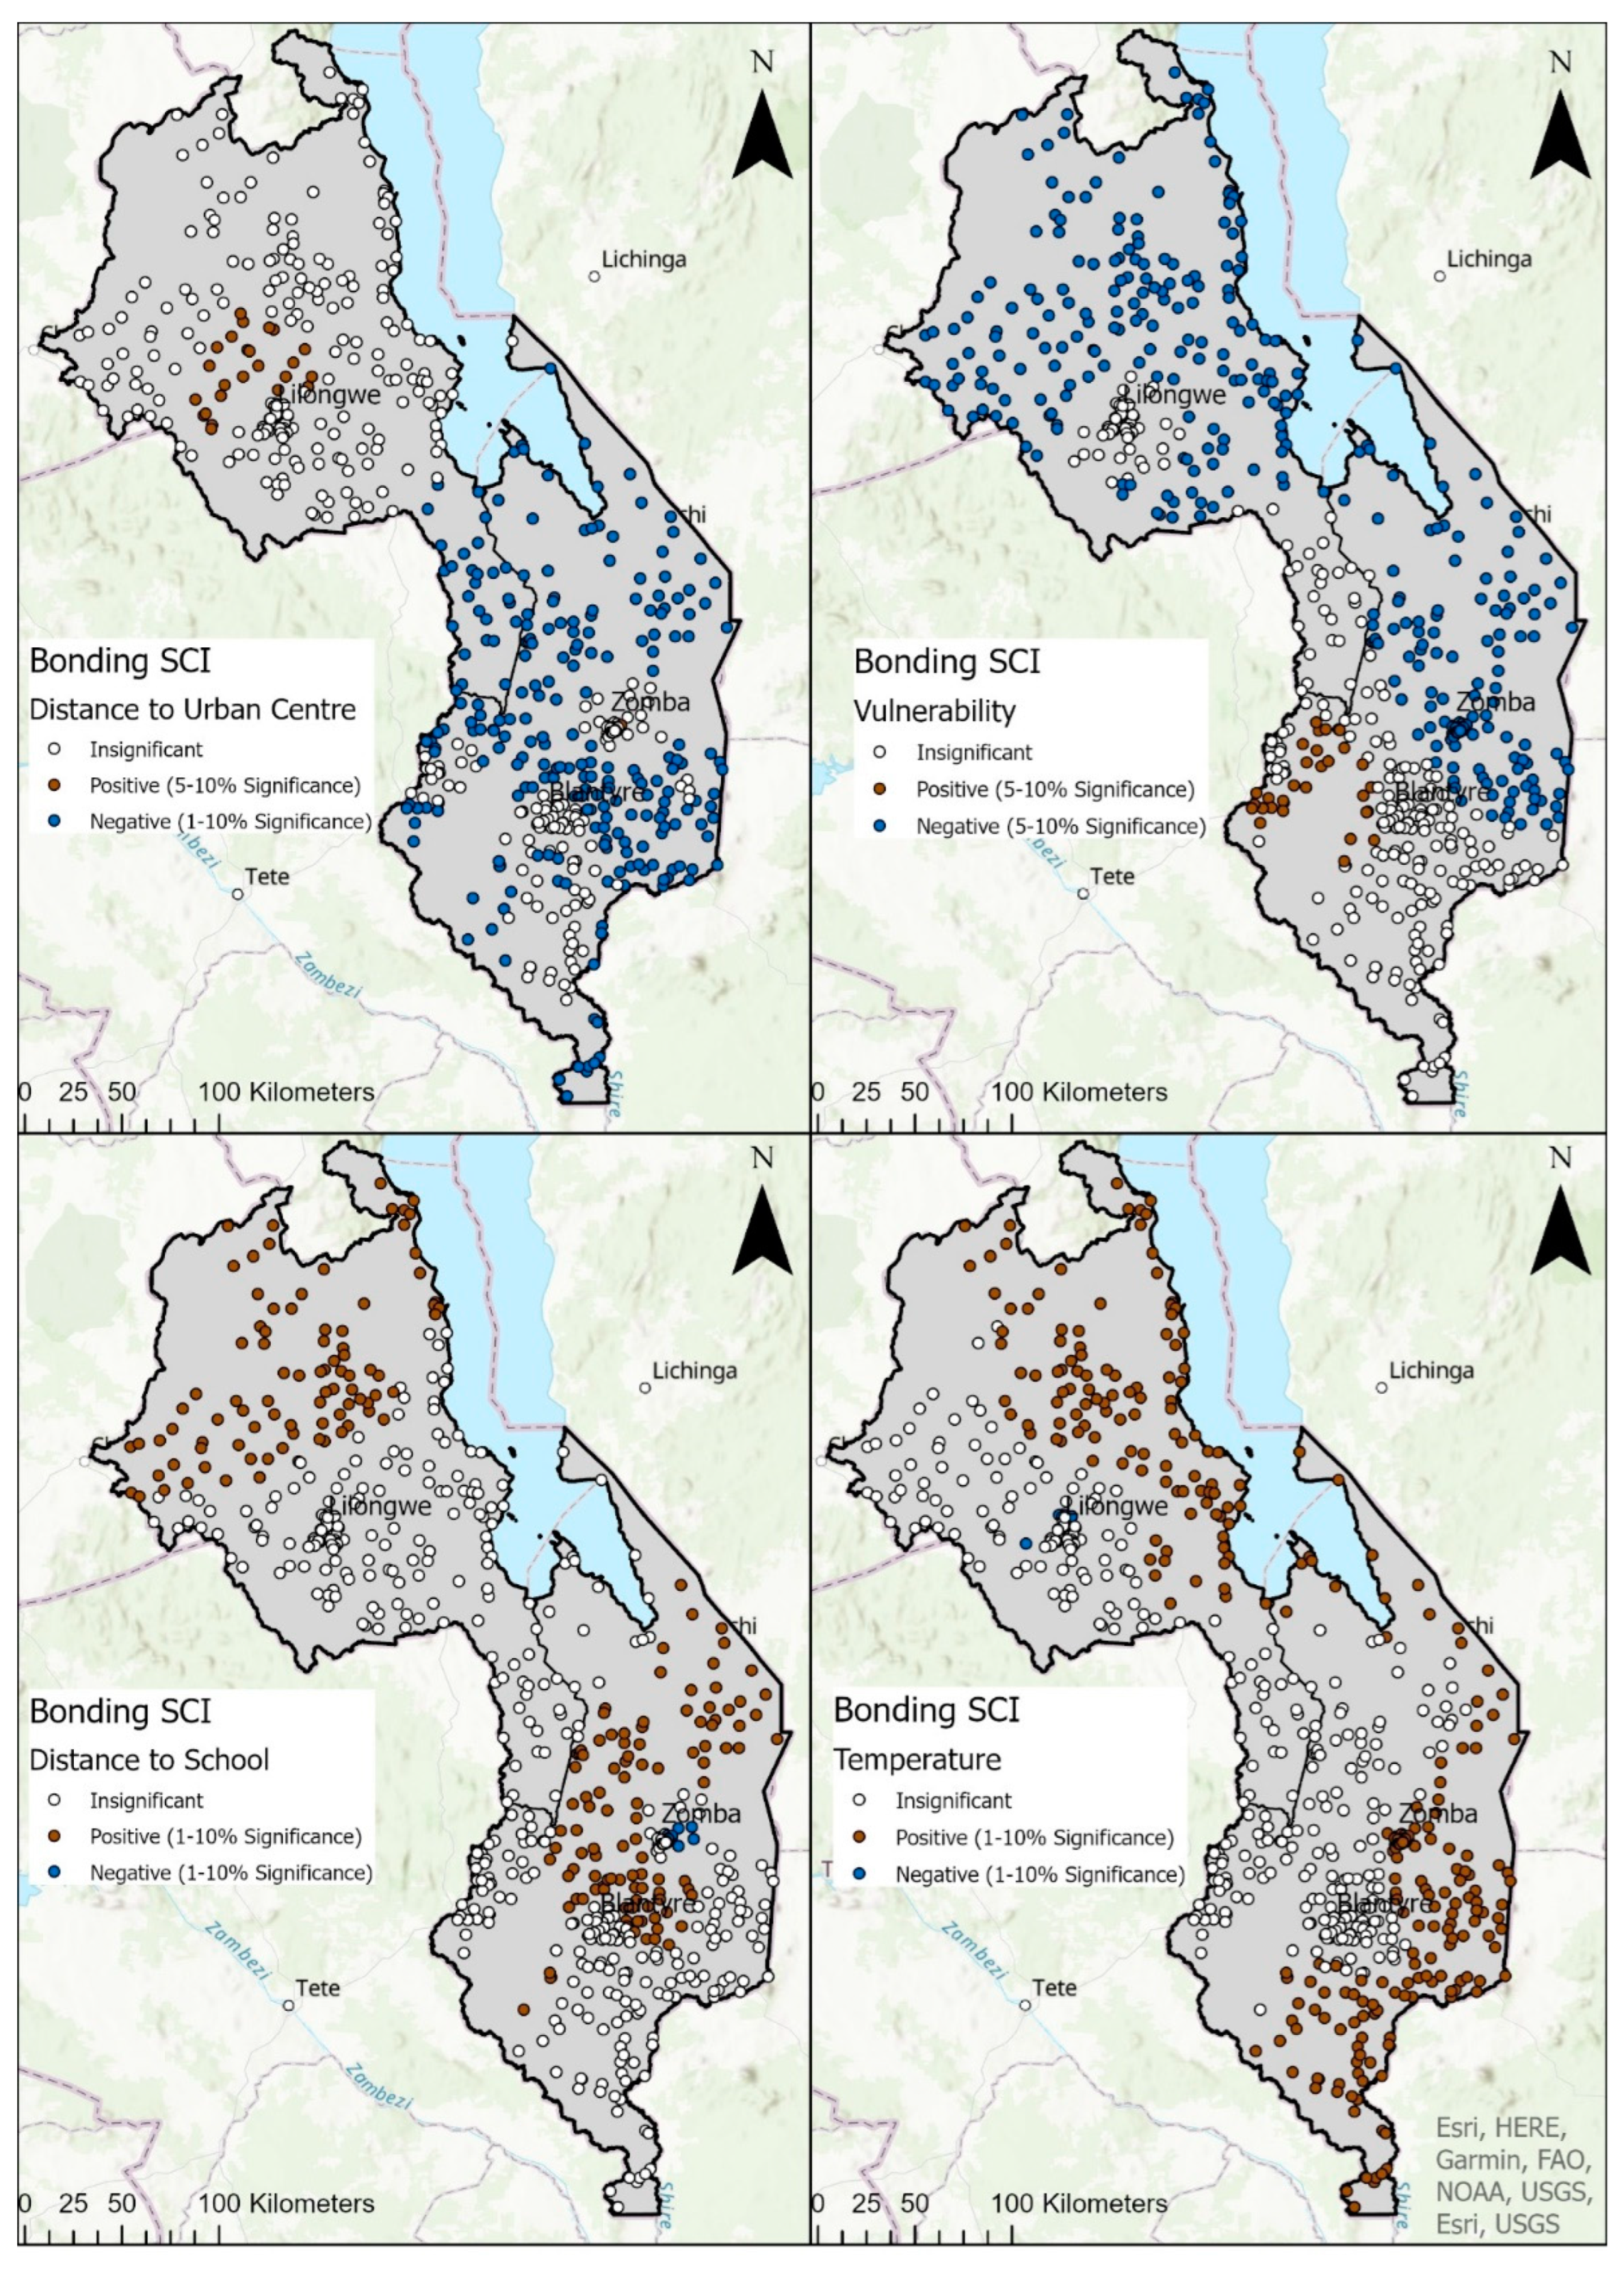
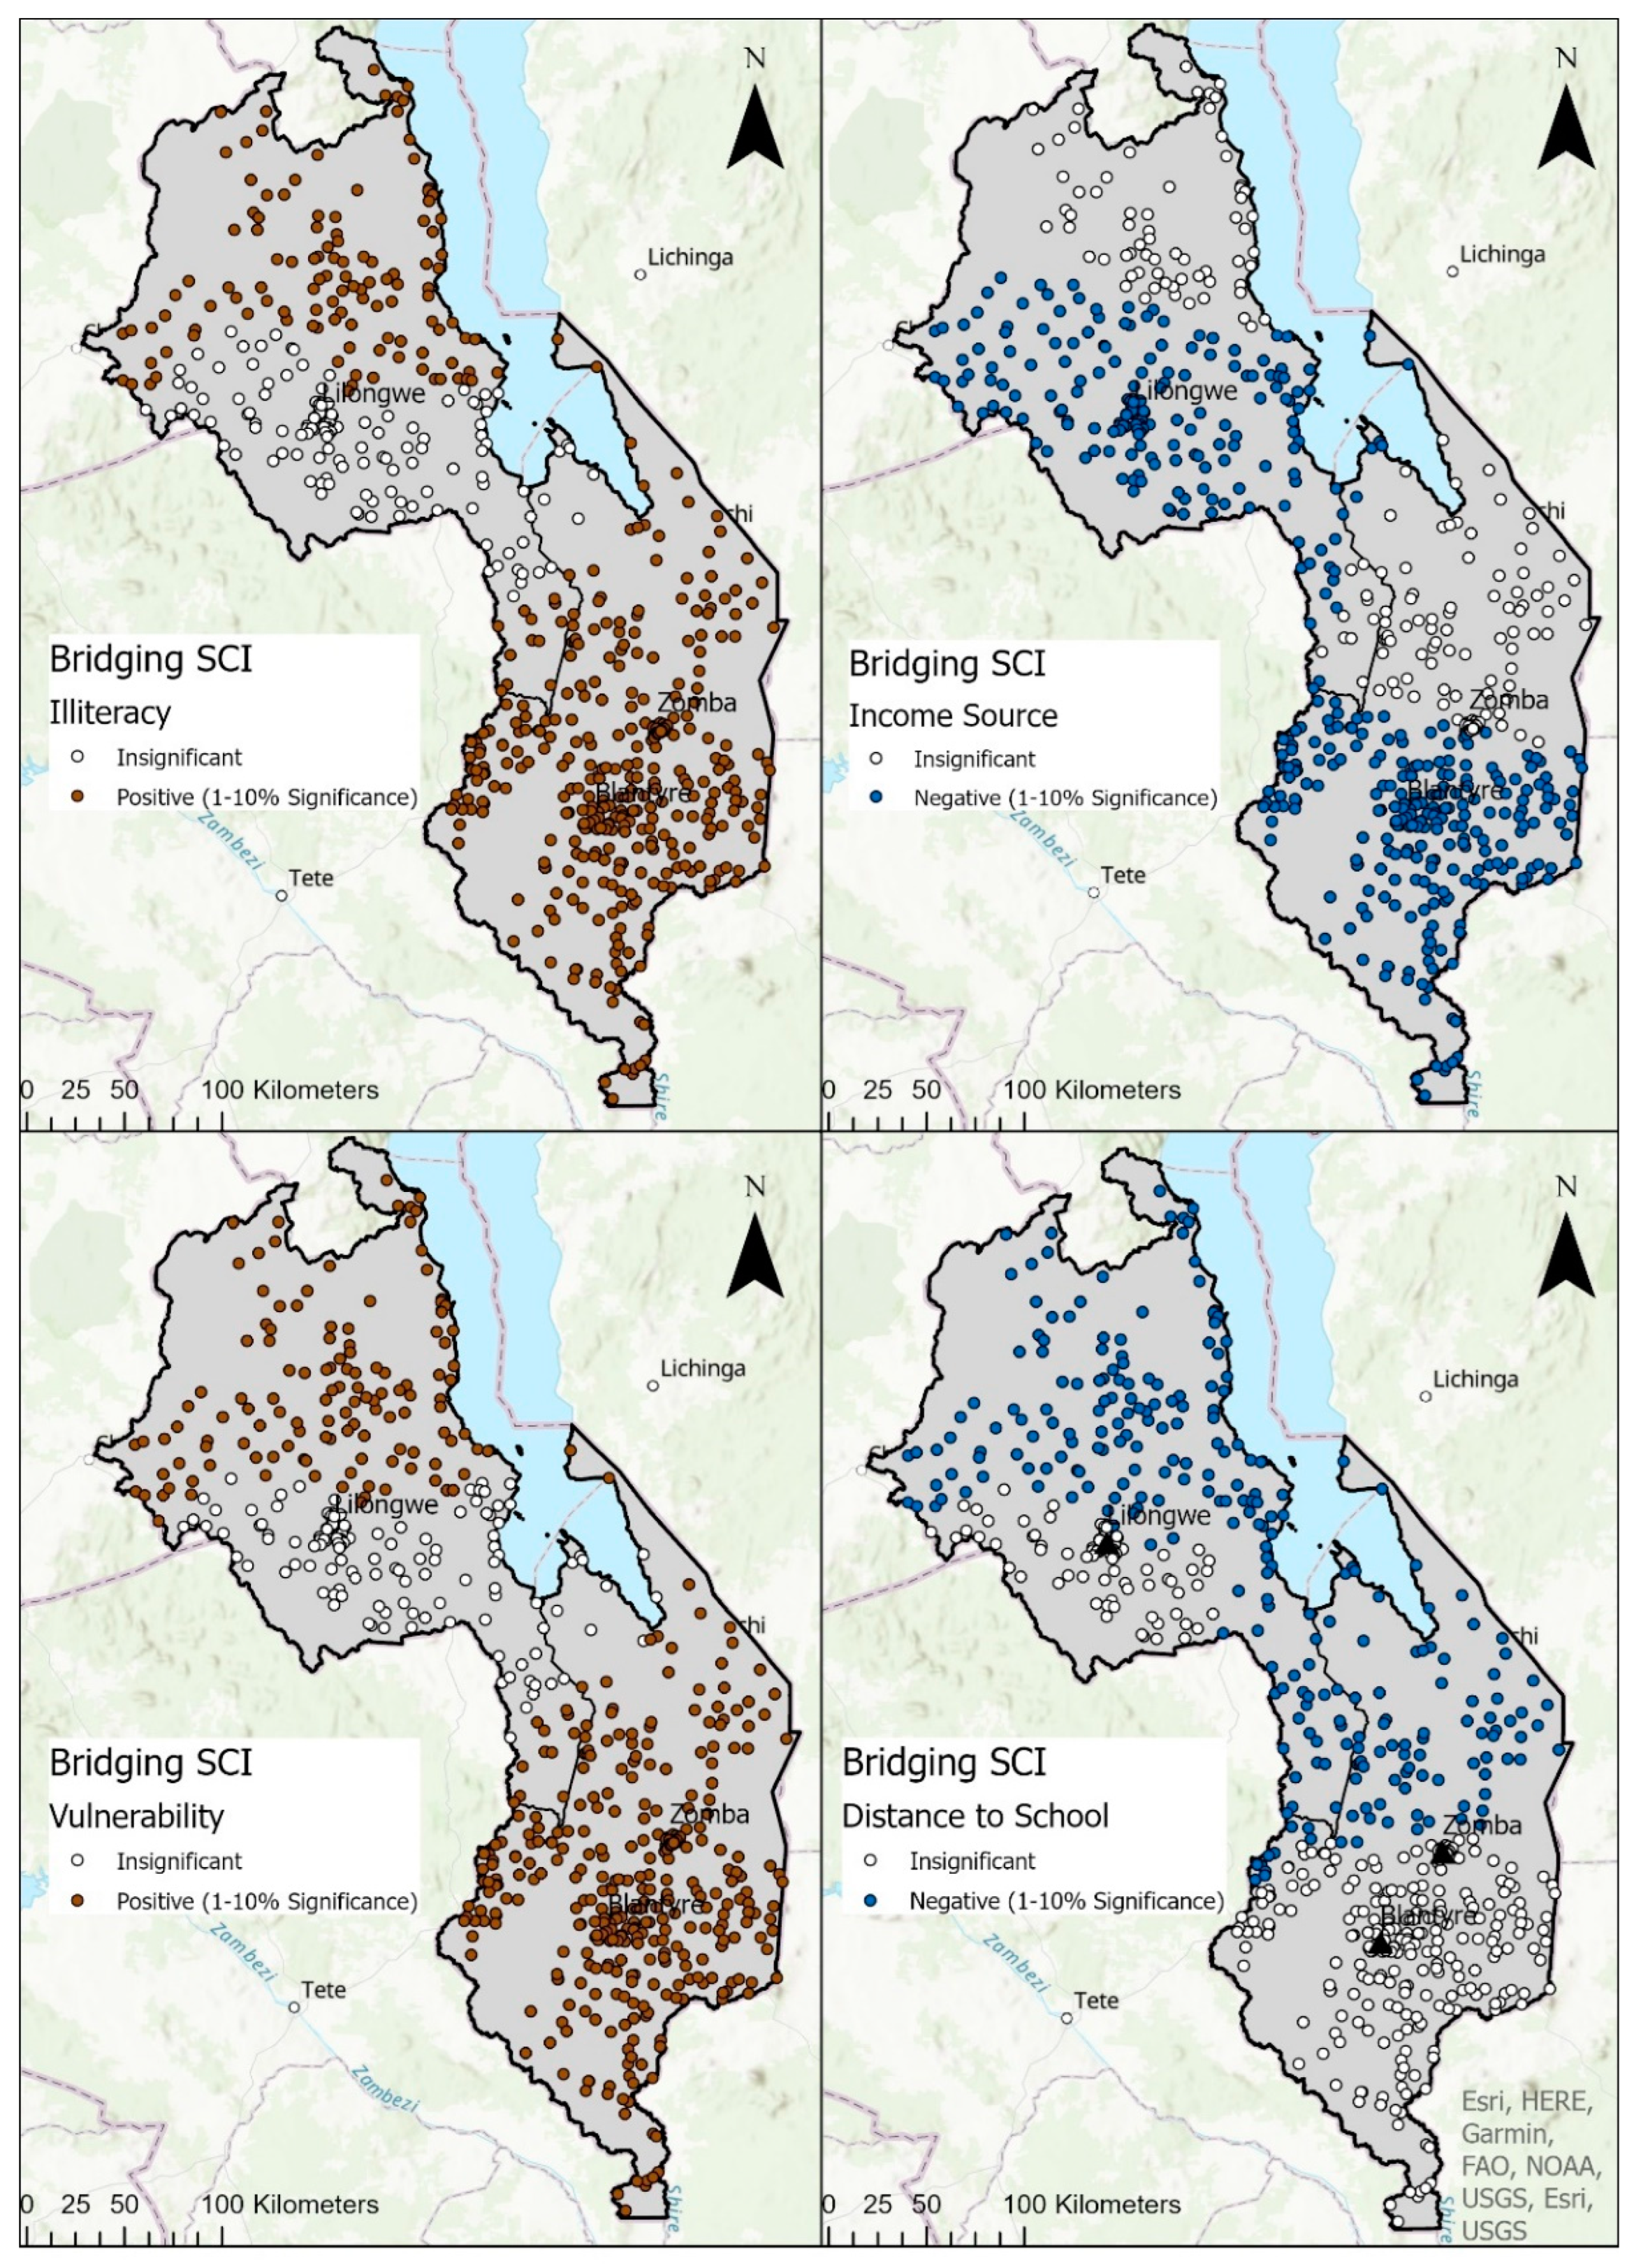
3.2. Geographically Weighted Regression

The Moran’s I test was significant for bonding (p = 0.00), bridging (p = 0.00) and linking (p = 0.01) SCI, meaning spatial autocorrelation exists for all three social capital typologies and they were suitable for GWR. The descriptive statistics of the independent variables are available in Supplementary Material Table S1. The final model and selected variables from the forward stepwise regression that were used in the GWR can be seen in Table 4, Table 5 and Table 6 with full regression tables in Supplementary Material Tables S2–S5, and the model fit in Table 7.
The performance of the linear regression and GWR models are compared to determine whether the GWR is, in fact, a better performing model. The Adjusted R2 was higher in the GWR models compared to the linear regression suggesting the GWR models performed better as they allow for local variations. The bonding and bridging social capital GWR models also had lower AICc suggesting a better fit for the local GWR model than the global OLS model. However, the AICc was lower for the OLS linking social capital model. For the linking models, the adjusted R2 suggests the GWR is more suitable, and the AICc suggests the OLS model is most suitable. The linking model overall is not a well-performing model as the adjusted R2 is <0.1 for the global OLS model and is unlikely to be reflecting robust relationships in either the global or local models [89].
The GWR models were evaluated by mapping the local R2 values (Figure 3), which range from 0 to 1, with 1 reflecting a perfect model [97]. In all three GWR models, the model performed better in the southern part of the study site. As with the adjusted R2 and AICc, the local R2 values show the bonding GWR model was most robust and the linking GWR model did not perform well.
The bonding SCI GWR maps are in Figure 4 and Figure 5. The experience of drought and a non-farming income are associated with a higher bonding SCI. There are clear spatial patterns that exist. The association between the experience of drought and the bonding SCI is only significant in the Southern Region and the northwest of the Central Region. The association with the bonding SCI and income shows significance in the Central Region and the east of the Southern Region.
Vulnerability, distance to an urban centre, temperature in the wettest month and distance to school showed both negative and positive association with the bonding SCI (Figure 5). This highlights the importance of spatial modelling, as it captures both the positive and negative associations between variables that would be masked in global modelling.
In the Southern Region, shorter distances to an urban centre are associated with a higher bonding SCI. The opposite occurs in a small number of communities in the Central Region, where longer distances are associated with a higher bonding SCI. Higher vulnerability was associated with a lower bonding SCI in north-eastern area of the Southern Region and large parts of the Central Region, excluding Lilongwe. The association was reversed in a small cluster in the west of the Southern Region, where higher vulnerability was associated with a higher bonding SCI.
Longer distances to school are associated with higher bonding SCI in the northern part of the Central Region and middle of the Southern Region. Meanwhile, longer distances to school are associated with a lower bonding SCI in a small number of communities near Zomba. Higher temperatures during the wettest month are associated with a higher bonding SCI in the east of the study area and a lower bonding SCI in a small number of communities in the Central Region.
Higher maximum temperatures, longer distances to school and having a non-farming income are associated with lower bridging SCI (Figure 6 and Figure 7). Higher vulnerability and illiteracy are associated with a higher bridging SCI (Figure 6). The spatial pattern of significance with the bridging SCI is similar for both vulnerability and illiteracy rate and is significant in most of the Southern Region and the northern half of the Central Region. Income source shows a significant association in the south of both regions. For the income source and vulnerability, the association with the bridging SCI is the opposite to the association with bonding SCI. Meanwhile, the association between the bridging SCI and maximum temperature in the wettest quarter is significant in the East of the Southern Region and North of the Central Region.
The experience of drought and distance to urban centres are positively associated with the linking SCI, suggesting the experience of drought and longer distance to urban centres are associated with a higher linking SCI (Figure 8). The association between drought and the linking SCI is only significant in the Central Region. Meanwhile the association between distance to urban centres and linking SCI is significant across the whole study site. A significant negative association between linking SCI and distance to school exists across the Central and Southern Region. Longer distances to school are associated with lower linking SCI.

4. Discussion

The study has shown that bonding, bridging and linking social capital exhibit clear spatial patterns in the Central and Southern Region of Malawi. The results also highlight the complexity of the associations between the social capital typologies and sustainable development proxies.
Spatial mapping of the social capital typologies indicates three main combinations of bonding, bridging and linking social capital (Table 3). These findings are in contrast to the standard model for social capital typologies [48] which states poor, remote areas will have high bonding, modest bridging and low linking. The combinations of social capital typologies found in this study do not reflect the standard hypothesis particularly well, as only a small zone in the south-western area of the Southern Region shows similarities.
Although Combination 2 (low bonding, moderate-low bridging and moderate linking social capital) does not align with the standard model of social capital typologies, it has some similarities with social capital combinations in a protracted crisis (low-moderate bonding, low bridging and high linking) [33]. The protracted crisis social capital combination were found in Burundi during a period of civil war and a protracted food insecurity crisis. Burundi’s social capital combinations for the rural poor also strayed away from the standard model of social capital. Combination 2’s alignment with the protracted crisis model of social capital is an unexpected and interesting finding as Malawi is not in a protracted crisis. On the other hand, Combination 3, which is characterised by a high-moderate bonding, high bridging and high-moderate linking SCI, does not align with standard model of the protracted models of social capital [33,48].
The assumption that poor rural communities have strong bonding social capital that can be called upon during a crisis may not be true in all contexts, even within the same country. Although Combinations 1 and 3 include some rural areas with higher bonding social capital, there are rural poor areas that have only moderate or low bonding social capital. If an entire community or region is struggling to access food or cash, people will not be able to give food or cash transfers, as they need it for their own survival [6,98]. Combination 2 is consistent with studies that have found bonding social capital to be weakening in rural communities in Malawi due to frequent climate shocks [98,99]. It may be that with an increased frequency of shocks, the assumption of high bonding social capital in rural poor areas no longer exists.
Similarly, the findings disagree with the standard models’ assumption that poor, rural communities lack linking social capital, as Combinations 2 and 3 are characterised by moderate and high-moderate linking social capital. This may be explained by the large presence of NGOs and aid projects operating in Malawi [100]. NGO projects and aid, for the most part, are aimed at those in need of assistance which is likely to be rural poor communities. The existence of development projects can also change the social norms around resource sharing in communities and lead to more individualistic thinking, thus reducing bonding social capital [98], which may be the case in Combination 2. Similarly, external assistance can create tension between recipients and non-recipients, resulting in the erosion of bonding social capital [101,102], which may be occurring in the areas with Combination 2.
It has been found urban and rural regions have a different social capital combination due to contrasting livelihoods and norms [103]. This study has found that, although urban-rural differences do exist, they are not as clear cut as expected. Combinations 1 and 2 include both rural and urban areas, and there are differences between urban areas, with Zomba and Lilongwe having different social capital typologies to Blantyre. This may be explained by the large number of migrants in Blantyre compared to Zomba and Lilongwe [104]. As migrants have moved into a new community, they are unlikely to have high amounts of bonding social capital to utilise. Outsiders are at the bottom of Malawi’s sharing and support hierarchy and are the last to have food or cash shared with them [98]. Although classifying communities as rural or urban and poor or non-poor helps with conceptualising social capital, it is important to recognise there will be differences in the social capital typology combinations within such classifications.

4.1. Social Capital Typologies and Sustainable Development

The GWR results show that social capital typologies have a different association with the sustainable development proxies, with associations varying spatially and directionally. Distance to urban areas is an important consideration of social capital as it impacts the quantity and quality of social interactions [105]. Other studies in Malawi have also found a community’s proximity to a road or a city influences its social capital [99,106], and this study also found distances to an urban centre were associated with bonding and linking social capital.
Communities with a longer distance to an urban centre, which can assume to be more remote and rural, are more likely to have lower bonding social capital but higher linking social capital. This finding is, once again, in contrast to the standard model, where rural communities have high bonding and low linking social capital. A higher linking SCI is associated with longer distances to urban centres, suggesting linking SCI is higher in rural, remote communities, strengthening the idea that distance is an important factor in communities’ stock of social capital. This is expected as the most remote communities are likely to have NGO or government projects, assuming projects are based on need. Yet this finding is in contrast to a previous [106] study in Malawi, which found a remote community had less linking social capital compared to a community in closer proximity to an easy to access road. The association between bonding SCI and distances to urban centres is only significant in the Southern Region, so other factors such as access and cost of transport may be contributing to the spatial differences.
Farming communities and highly vulnerable communities are associated with low bonding SCI and high bridging SCI. Farming communities are most vulnerable to climate shocks due to their dependence on rain-fed agriculture and small landholdings [107], and this has been linked to reduced bonding social capital [98]. Although farming communities may be unable to make unconditional transfers of food and cash, communities may form groups to try and improve their situation. Community groups, such as farming and village saving and loans groups, are popular in Malawi, hence the association between farming communities and the bridging SCI [58]. As bonding social capital becomes less reliable, communities may have to use and build up their bridging social capital to replace it.

4.2. Social Capital Typologies and Extreme Weather Events

There are spatial patterns in the associations between social capital typologies and drought and maximum temperatures. Although this is expected, given EWE have spatial characteristics, the findings have key implications for understanding the association between social capital typologies and EWE. Higher bonding social capital was associated with experiencing the 2015/16 drought but is only significant in areas where the 2015–2016 drought had less of an impact [108]. These communities may be less impacted or less vulnerable to shocks and, therefore, able to rely on bonding social capital [109]. However, given bonding social capital may be waning in Malawi [98,99] and extreme weather events are likely to increase in frequency in the future [110], these communities may struggle in the future.
Meanwhile, higher linking social capital was associated with experiencing the drought in the Central Region, which experienced less severe drought than the Southern Region. It is expected that communities that experienced drought would receive NGO or government assistance, as suggested by these findings, but the spatial differences between the Central and Southern Regions raise further questions. An explanation of why the positive association between linking SCI and drought is not significant in areas most effected by drought requires further research to understand the findings. Previous research in Malawi found bridging social capital was positively associated with favourable growing conditions [111] and may explain why lower maximum temperatures are associated with a higher bridging SCI in the east coast and northern area of the Central Region. These areas have lower temperatures compared to the rest of the study area, so conditions are more favourable.

4.3. Implications

Although social capital is deemed useful in sustainable development, this study has shown there are complexities that affect this relationship. The stock of bonding, bridging and linking social capital in rural poor areas are different to previous social capital research. We have shown that secondary data can be used to map social capital typologies and provides an indication of social capital across the regions which may be useful for stakeholders. Bonding, bridging and linking social capital’s association with sustainable development proxies do not always have the desired association required for communities to develop. For example, vulnerability had a negative, positive and insignificant association with bonding, bridging and linking social capital, respectively. The results strengthen the previous call for development practitioners to understand the current stock of social capital prior to project implementations [23]. We also suggest that policy or best practice should go a step further. Firstly, the stock of bonding, bridging and linking social capital should be understood, rather than one type of social capital. Secondly, an understanding of how the social capital typologies may improve, or be detrimental, to specific development outcomes should be explored during preliminary project development.

4.4. Limitations and Future Research

The linking social capital GWR model in this study does not perform well, which must be acknowledged. It is possible linking social capital is associated with other sustainable development indicators that are not present in this study. Nevertheless, it again highlights the multidimensionality of social capital and why multiple indicators are required to reflect the typologies. As with most statistical analysis, it must be recognised that the association between social capital typologies and sustainable development indicators does not imply causality. The findings from this study are complex and have found the social capital typologies of the rural poor are not as expected, thus, raising more research questions. Using secondary data analysis has proved a good first step to understanding the bonding, bridging and linking social capital in Malawi and its association with sustainable development and EWE. This study has made use of various secondary data sources to explore the spatial aspects of social capital. In the absence of surveys or up-to-date data, future research may consider mobile phone data. Mobile phone data can measure social connectivity and networks for specific time frames [112,113] and provide estimates on household expenditure, a proxy for poverty, in the absence of survey data [114]. Similarly, qualitative methods may be needed to understand some of the more unexpected results of this study.

5. Conclusions

Overall, this study has contributed to the social capital literature in four ways. Firstly, the study has shown bonding, bridging and linking social capital vary spatially. Secondly, the spatial patterns of the rural poor’s social capital typologies in Malawi do not align with previous research. Thirdly, the research confirms the need to break down social capital into its typologies as bonding, bridging and linking social capital have different spatial patterns and associations with other variables. Finally, we highlight that social capital can indeed be a useful concept in sustainable development, but it requires stakeholders to be more specific in which social capital typology will be used to improve sustainable development and that context matters.

Supplementary Materials

The following supporting information can be downloaded at: https://www.mdpi.com/article/10.3390/su14159374/s1, Figure S1. Prediction Variance for bonding, bridging and linking social capital interpolation maps. Higher values indicate lower confidence in prediction. Table S1. Descriptive statistics of the independent variables, Table S2. Independent variables in each for each GWR model (selected via stepwise linear regression). Table S3. Stepwise linear regression for variable selection for the GWR with bonding social capital as the dependent variable. Final independent variables chosen in Model 10. Table S4. Stepwise linear regression for variable selection for the GWR with bridging social capital as the dependent variable. Final independent variables chosen in Model 10. Table S5. Stepwise linear regression for variable selection for the GWR with linking social capital as the dependent variable. Final independent variables chosen in Model 3.

Author Contributions

Conceptualization, A.C., J.S. and C.W.H.; methodology, A.C.; software, A.C.; validation, A.C.; formal analysis, A.C.; writing—original draft preparation, A.C.; writing—review and editing, A.C., J.S. and C.W.H.; visualization, A.C.; supervision, J.S. and C.W.H. All authors have read and agreed to the published version of the manuscript.

Funding

This research was funded by the Economic and Social Research Council through the South Coast Doctoral Training Partnership, grant number ES/P000673/1. The APC was funded by the UKRI Block Grant agreement through the University of Southampton.

Institutional Review Board Statement

The study was conducted in accordance with the University of Southampton Ethics and Research Governance Board (date of approval 21 September 2020).

Informed Consent Statement

Not applicable.

Data Availability Statement

Publicly available datasets were analyzed in this study. Links to the datasets can be found in the reference list.

Conflicts of Interest

The authors declare no conflict of interest.

References

  1. Grootaert, C.; van Bastelaer, T. Understanding and Measuring Social Capital; World Bank: Washington, DC, USA, 2002. [Google Scholar]
  2. Seferiadis, A.A.; Cummings, S.; Zweekhorst, M.B.M.; Bunders, J.F.G. Producing Social Capital as a Development Strategy: Implications at the Micro-Level. Prog. Dev. Stud. 2015, 15, 170–185. [Google Scholar] [CrossRef]
  3. Jordan, J.C. Swimming Alone? The Role of Social Capital in Enhancing Local Resilience to Climate Stress: A Case Study from Bangladesh. Clim. Dev. 2015, 7, 110–123. [Google Scholar] [CrossRef]
  4. Pretty, J.; Attwood, S.; Bawden, R.; van den Berg, H.; Bharucha, Z.P.; Dixon, J.; Flora, C.B.; Gallagher, K.; Genskow, K.; Hartley, S.E.; et al. Assessment of the Growth in Social Groups for Sustainable Agriculture and Land Management. Glob. Sustain. 2020, 3, e23. [Google Scholar] [CrossRef]
  5. Sabet, N.S.; Khaksar, S. The Performance of Local Government, Social Capital and Participation of Villagers in Sustainable Rural Development. Soc. Sci. J. 2020. [Google Scholar] [CrossRef]
  6. Islam, M.S.; Alam, K. Does Social Capital Reduce Poverty? A Cross-Sectional Study of Rural Household in Bangladesh. Int. J. Soc. Econ. 2018, 45, 1515–1532. [Google Scholar] [CrossRef]
  7. Hassan, R.; Birungi, P. Social Capital and Poverty in Uganda. Dev. S. Afr. 2011, 28, 19–37. [Google Scholar] [CrossRef] [Green Version]
  8. Rankin, S.H.; Jong, S.; Matovu, S.; Youmans, S.; Lindgren, T. Sources of Social Capital for Malawi People Living with HIV. Glob. Qual. Nurs. Res. 2016, 3. [Google Scholar] [CrossRef] [Green Version]
  9. De Jalón, S.G.; Iglesias, A.; Neumann, M.B. Responses of Sub-Saharan Smallholders to Climate Change: Strategies and Drivers of Adaptation. Environ. Sci. Policy 2018, 90, 38–45. [Google Scholar] [CrossRef]
  10. Pretty, J. Social Capital and the Collective Management of Resources. Science 2003, 302, 1912–1914. [Google Scholar] [CrossRef] [Green Version]
  11. Nwosu, E.O.; Orji, A.; Urama, N.E.; Emecheta, C.; Chukwuma, Q.O.; Chukwuma, J.N. Social Capital, Credit Access and Household Nonfarm Enterprises in Nigeria: A New Empirical Evidence. Forum Soc. Econ. 2020. [Google Scholar] [CrossRef]
  12. Heikkilä, A.; Kalmi, P.; Ruuskanen, O.-P. Social Capital and Access to Credit: Evidence from Uganda. J. Dev. Stud. 2016, 52, 1273–1288. [Google Scholar] [CrossRef]
  13. Musinguzi, L.K.; Turinawe, E.B.; Rwemisisi, J.T.; de Vries, D.H.; Mafigiri, D.K.; Muhangi, D.; de Groot, M.; Katamba, A.; Pool, R. Linking Communities to Formal Health Care Providers through Village Health Teams in Rural Uganda: Lessons from Linking Social Capital. Hum. Resour. Health 2017, 15, 4. [Google Scholar] [CrossRef] [PubMed] [Green Version]
  14. Semwanga, A.R.; Nakubulwa, S.; Adam, T. Applying a System Dynamics Modelling Approach to Explore Policy Options for Improving Neonatal Health in Uganda. Health Res. Policy Syst. 2016, 14, 35. [Google Scholar] [CrossRef] [Green Version]
  15. Ko, H.; Kim, H.; Yoon, C.; Kim, C. Social Capital as a Key Determinant of Willingness to Join Community-Based Health Insurance: A Household Survey in Nepal. Public Health 2018, 160, 52–61. [Google Scholar] [CrossRef] [PubMed]
  16. Kanosvamhira, T.P. The Organisation of Urban Agriculture in Cape Town, South Africa: A Social Capital Perspective. Dev. S. Afr. 2019, 36, 283–294. [Google Scholar] [CrossRef] [Green Version]
  17. Anbacha, A.E.; Kjosavik, D.J. Borana Women’s Indigenous Social Network-Marro in Building Household Food Security: Case Study from Ethiopia. Pastoralism 2018, 8, 29. [Google Scholar] [CrossRef]
  18. Agampodi, T.C.; Agampodi, S.B.; Glozier, N.; Siribaddana, S. Measurement of Social Capital in Relation to Health in Low and Middle Income Countries (LMIC): A Systematic Review. Soc. Sci. Med. 2015, 128, 95–104. [Google Scholar] [CrossRef]
  19. Putnam, R.D. Tuning in, Tuning Out: The Strange Disappearance of Social Capital in America. PS Political Sci. Politics 1995, 28, 664. [Google Scholar] [CrossRef]
  20. Coleman, J.S. Social Capital in the Creation of Human Capital. Am. J. Sociol. 1988, 94, 95–120. [Google Scholar] [CrossRef]
  21. Bourdieu, P. The Forms of Capital. In Readings in Economic Sociology; Richardson, J., Ed.; Blackwell Publishers Ltd.: Oxford, UK, 1986; pp. 46–58. ISBN 978-0-470-75567-9. [Google Scholar]
  22. Volker, B. Social Capital across the Life Course: Accumulation, Diminution, or Segregation? Netw. Sci. 2020, 8, 313–332. [Google Scholar] [CrossRef]
  23. Engbers, T.A.; Rubin, B.M. Theory to Practice: Policy Recommendations for Fostering Economic Development through Social Capital. Public Adm. Rev. 2018, 78, 567–578. [Google Scholar] [CrossRef]
  24. Whiteley, P.F. Economic Growth and Social Capital. Political Stud. 2000, 48, 443–466. [Google Scholar] [CrossRef]
  25. Davenport, M.; Hassan, R. Application of Exploratory Factor Analysis to Address the Challenge of Measuring Social Capital in a Rural Communal Setting in South Africa. Agrekon 2020, 59, 218–234. [Google Scholar] [CrossRef]
  26. Fraser, A.; Tan, S.; Lagarde, M.; Mays, N. Narratives of Promise, Narratives of Caution: A Review of the Literature on Social Impact Bonds. Soc. Policy Adm. 2018, 52, 4–28. [Google Scholar] [CrossRef]
  27. Claridge, T. Dimensions of Social Capital-Structural, Cognitive and Relational; Social Capital Research: Dunedin, New Zealand, 2018. [Google Scholar]
  28. Kelly, E.; Lee, K.; Shields, K.F.; Cronk, R.; Behnke, N.; Klug, T.; Bartram, J. The Role of Social Capital and Sense of Ownership in Rural Community-Managed Water Systems: Qualitative Evidence from Ghana, Kenya, and Zambia. J. Rural. Stud. 2017, 56, 156–166. [Google Scholar] [CrossRef]
  29. Bebbington, A. Social Capital. In International Encyclopedia of Human Geography; Kitchin, R., Thrift, N., Eds.; Elsevier: Oxford, UK, 2009; pp. 165–170. ISBN 978-0-08-044910-4. [Google Scholar]
  30. Claridge, T. Functions of Social Capital–Bonding, Bridging, Linking; Social Capital Research: Dunedin, New Zealand, 2018; p. 7. [Google Scholar]
  31. Pendley, S.C.; Mock, N.B.; Theall, K.P. How You Measure Matters; Defining Social Capital in Drought-Prone Areas. Int. J. Disaster Risk Reduct. 2020, 50, 101715. [Google Scholar] [CrossRef]
  32. Sseguya, H.; Mazur, R.E.; Flora, C.B. Social Capital Dimensions in Household Food Security Interventions: Implications for Rural Uganda. Agric. Hum. Values 2018, 35, 117–129. [Google Scholar] [CrossRef]
  33. Vervisch, T.G.A.; Vlassenroot, K.; Braeckman, J. Livelihoods, Power, and Food Insecurity: Adaptation of Social Capital Portfolios in Protracted Crises—Case Study Burundi. Disasters 2013, 37, 267–292. [Google Scholar] [CrossRef]
  34. Szreter, S. The State of Social Capital: Bringing Back in Power, Politics, and History. Theory Soc. 2002, 31, 573–621. [Google Scholar] [CrossRef]
  35. Engers, T.; Thompson, M.; Slaper, T. Theory and Measurement in Social Capital Research. Soc. Indic. Res. 2017, 132, 537–538. [Google Scholar] [CrossRef]
  36. Villalonga-Olives, E.; Kawachi, I. The measurement of social capital. Gac. Sanit. 2015, 29, 62–64. [Google Scholar] [CrossRef] [PubMed]
  37. Putnam, R. Bowling Alone: The Collapse and Revival of America Community; Simon & Schuster: New York, NY, USA, 2000. [Google Scholar]
  38. Woolcock, M. Microenterprise and Social Capital: A Framework for Theory, Research, and Policy. J. Socio-Econ. 2001, 30, 193–198. [Google Scholar] [CrossRef]
  39. Kansanga, M.M.; Luginaah, I.; Kerr, R.B.; Lupafya, E.; Dakishoni, L. Beyond Ecological Synergies: Examining the Impact of Participatory Agroecology on Social Capital in Smallholder Farming Communities. Int. J. Sustain. Dev. World Ecol. 2020, 27, 1–14. [Google Scholar] [CrossRef]
  40. Weiss, I.; Paxton, P.; Velasco, K.; Ressler, R.W. Revisiting Declines in Social Capital: Evidence from a New Measure. Soc. Indic. Res. 2019, 142, 1015–1029. [Google Scholar] [CrossRef]
  41. Dean, W.R.; Sharkey, J.R. Food Insecurity, Social Capital and Perceived Personal Disparity in a Predominantly Rural Region of Texas: An Individual-Level Analysis. Soc. Sci. Med. 2011, 72, 1454–1462. [Google Scholar] [CrossRef] [Green Version]
  42. Martin, J.C.; Moran, L.J.; Teede, H.J.; Ranasinha, S.; Lombard, C.B.; Harrison, C.L. Exploring Diet Quality between Urban and Rural Dwelling Women of Reproductive Age. Nutrients 2017, 9, 586. [Google Scholar] [CrossRef] [Green Version]
  43. Nwachukwu, I.N.; Ihunweze, M.C.; Anyanwu, C.I. Effect of Social Capital on Food Security among Rural Farming Households in Abia State, Nigeria. Niger. Agric. J. 2014, 45, 81–88. [Google Scholar] [CrossRef]
  44. Adger, W.N. Social Capital, Collective Action, and Adaptation to Climate Change. Econ. Geogr. 2003, 79, 387–404. [Google Scholar] [CrossRef]
  45. Lamidi, E.O. Household Composition and Experiences of Food Insecurity in Nigeria: The Role of Social Capital, Education, and Time Use. Food Sec. 2019, 11, 201–218. [Google Scholar] [CrossRef]
  46. Rutten, R.; Westlund, H.; Boekema, F. The Spatial Dimension of Social Capital. Eur. Plan. Stud. 2010, 18, 863–871. [Google Scholar] [CrossRef] [Green Version]
  47. Kyne, D.; Aldrich, D. Capturing Bonding, Bridging, and Linking Social Capital through Publicly Available Data. Risk Hazards Crisis Public Policy 2019, 11, 61–86. [Google Scholar] [CrossRef]
  48. UNESCO. Social Capital and Poverty Reduction: Which Role for the Civil Society Organizations and the State? United Nations Educational, Scientific and Cultural Organisation: Paris, France, 2002. [Google Scholar]
  49. Lo, A.Y.; Cheung, L.T.O. Geographies of Social Capital: Catastrophe Experience, Risk Perception, and the Transformation of Social Space in Postearthquake Resettlements in Sichuan, China. Ann. Am. Assoc. Geogr. 2016, 106, 874–890. [Google Scholar] [CrossRef] [Green Version]
  50. Harrison, J.L.; Montgomery, C.A.; Jeanty, P.W. A Spatial, Simultaneous Model of Social Capital and Poverty. J. Behav. Exp. Econ. 2019, 78, 183–192. [Google Scholar] [CrossRef]
  51. Pretty, J.; Ward, H. Social Capital and the Environment. World Dev. 2001, 29, 209–227. [Google Scholar] [CrossRef]
  52. Kiboro, C.N. Influence of Social Capital on Livelihood Outcomes for the Internally Displaced Persons in Kenya: A Social Capital Approach. Eur. Sci. J. 2017, 13, 266–280. [Google Scholar] [CrossRef] [Green Version]
  53. Savioli, M.; Patuelli, R. Social Capital, Institutions and Policymaking; Social Science Research Network: Rochester, NY, USA, 2016. [Google Scholar]
  54. UNDP Human Development Index. Available online: https://hdr.undp.org/data-center/human-development-index#/indicies/HDI (accessed on 7 March 2022).
  55. World Bank Malawi Poverty Rate 2021; World Bank: Lilongwe, Malawi, 2021.
  56. Government of Malawi. National Agriculture Policy; Ministry of Agriculture, Irrigation and Water Development, Government of Malawi: Lilongwe, Malawi, 2016; p. 116.
  57. Asfaw, S.; McCarthy, N.; Paolantonio, A.; Cavatassi, R.; Reda, M.A.; Lipper, L. Livelihood Diversification and Vulnerability to Poverty in Rural Malawi; Social Science Research Network: Rochester, NY, USA, 2015. [Google Scholar]
  58. Myroniuk, T.W.; Anglewicz, P. Does Social Participation Predict Better Health? A Longitudinal Study in Rural Malawi. J. Health Soc. Behav. 2015, 56, 552–573. [Google Scholar] [CrossRef] [Green Version]
  59. Forster, P.G. Culture, Nationalism, and the Invention of Tradition in Malawi. J. Mod. Afr. Stud. 1994, 32, 477–497. [Google Scholar] [CrossRef]
  60. Rippon, S.; Beattie, T.K.; Lungu, K.; Kumwenda, S.; Morse, T. Social Capital Insights from Healthy Settings Needs Assessment in Malawi. PLoS ONE 2018, 13, e0206156. [Google Scholar] [CrossRef]
  61. Kita, S.M. “Government Doesn’t Have the Muscle”: State, NGOs, Local Politics, and Disaster Risk Governance in Malawi. Risk Hazards Crisis Public Policy 2017, 8, 244–267. [Google Scholar] [CrossRef]
  62. Brown, B.; Nuberg, I.; Llewellyn, R. Research Capacity for Local Innovation: The Case of Conservation Agriculture in Ethiopia, Malawi and Mozambique. J. Agric. Educ. Ext. 2018, 24, 249–262. [Google Scholar] [CrossRef]
  63. NSO. Malawi Fourth Integrated Household Survey (IHS4) 2016–2017. Basic Information Document; National Statistics Office: Zomba, Malawi, 2017; pp. 1–49.
  64. DFID. Sustainable Livelihoods Guidance Sheets; The Department of International Development: London, UK, 1999.
  65. RStudio RStudio: Integrated Development for R. Boston, MA. Available online: http://www.rstudio.com/ (accessed on 29 April 2021).
  66. SPSS Inc. SPSS Statistics for Windows; IBM Corp: Armonk, NY, USA, 2017. [Google Scholar]
  67. RCMRD. Malawi National Vulnerability Index. 2015. Available online: http://geoportal.rcmrd.org/layers/servir%3Amalawi_national_vulnerability_index#more (accessed on 2 May 2022).
  68. RCMRD. Malawi National Literacy Levels. 2015. Available online: http://geoportal.rcmrd.org/layers/servir%3Amalawi_national_literacy_levels (accessed on 2 May 2022).
  69. WorldPop. Malawi 1 km Poverty. 2017. Available online: https://eprints.soton.ac.uk/440039/ (accessed on 2 May 2022). [CrossRef]
  70. WorldPop. Global 100 m BSGM Outputs. 2018. Available online: https://eprints.soton.ac.uk/441839/ (accessed on 2 May 2022). [CrossRef]
  71. Perez-Heydrich, C.; Warren, J.L.; Burgert, C.R.; Emch, M. Guidelines on the Use of DHS GPS Data; USAID: Washington, DC, USA, 2013. [Google Scholar]
  72. Jagger, P.; Perez-Heydrich, C. Land Use and Household Energy Dynamics in Malawi. Environ. Res. Lett. 2016, 11, 125004. [Google Scholar] [CrossRef] [PubMed]
  73. Kaiser, M.; Barnhart, S.; Huber-Krum, S. Measuring Social Cohesion and Social Capital within the Context of Community Food Security: A Confirmatory Factor Analysis. J. Hunger. Environ. Nutr. 2019, 15, 591–612. [Google Scholar] [CrossRef]
  74. Smith, L.C.; Frankenberger, T.R. Does Resilience Capacity Reduce the Negative Impact of Shocks on Household Food Security? Evidence from the 2014 Floods in Northern Bangladesh. World Dev. 2018, 102, 358–376. [Google Scholar] [CrossRef]
  75. Cofré-Bravo, G.; Klerkx, L.; Engler, A. Combinations of Bonding, Bridging, and Linking Social Capital for Farm Innovation: How Farmers Configure Different Support Networks. J. Rural. Stud. 2019, 69, 53–64. [Google Scholar] [CrossRef]
  76. Tamako, N.; Thamaga-Chitja, J.M. Does Social Capital Play a Role in Climate Change Adaptation among Smallholder Farmers for Improving Food Security and Livelihoods? J. Fam. Ecol. Consum. Soc. 2017, 2, 16–27. [Google Scholar]
  77. Ng’ang’a, S.K.; Bulte, E.H.; Giller, K.E.; Ndiwa, N.N.; Kifugo, S.C.; McIntire, J.M.; Herrero, M.; Rufino, M.C. Livestock Wealth and Social Capital as Insurance against Climate Risk: A Case Study of Samburu County in Kenya. Agric. Syst. 2016, 146, 44–54. [Google Scholar] [CrossRef]
  78. Borges, C.M.; Campos, A.C.V.; Vargas, A.D.; Ferreira, E.F.; Kawachi, I. Social Capital and Self-Rated Health among Adolescents in Brazil: An Exploratory Study. BMC Res. Notes 2010, 3, 338. [Google Scholar] [CrossRef] [Green Version]
  79. Yoon, D.K. Assessment of Social Vulnerability to Natural Disasters: A Comparative Study. Nat. Hazards 2012, 63, 823–843. [Google Scholar] [CrossRef]
  80. Adger, W.N.; Brooks, N.; Bentham, G.; Agnew, M.; Eriksen, S. New Indicators of Vulnerability and Adaptive Capacity; Tyndall Centre for Climate Change Research: Norwich, UK, 2004. [Google Scholar]
  81. Pollet, T.V.; Stulp, G.; Henzi, S.P.; Barrett, L. Taking the Aggravation out of Data Aggregation: A Conceptual Guide to Dealing with Statistical Issues Related to the Pooling of Individual-Level Observational Data. Am. J. Primatol. 2015, 77, 727–740. [Google Scholar] [CrossRef]
  82. Moonchai, S.; Chutsagulprom, N. Semiparametric Semivariogram Modeling with a Scaling Criterion for Node Spacing: A Case Study of Solar Radiation Distribution in Thailand. Mathematics 2020, 8, 2173. [Google Scholar] [CrossRef]
  83. Briggs, D.; Forer, P.; Jarup, L.; Stern, R. GIS for Emergency Preparedness and Health Risk Reduction; Kluwer Academic Publishers: Dordrecht, The Netherlands, 2002. [Google Scholar]
  84. Burrough, P.A. Principles of Geographical Information Systems for Land Resources Assessment; Oxford University Press: New York, NY, USA, 1986. [Google Scholar]
  85. Harris, R.; Jarvis, C. Statistics for Geography and Environmental Science, 1st ed.; Routledge: London, UK, 2011. [Google Scholar]
  86. Watmough, G.R. Exploring the Spatial Associations between Census Based Socioeconomic Conditions and Remotely Sensed Environmental Metrics in Assam Northeast India. Ph.D. Thesis, University of Southampton, Southampton, UK, 2011. [Google Scholar]
  87. Park, Y.M.; Kim, Y. A Spatially Filtered Multilevel Model to Account for Spatial Dependency: Application to Self-Rated Health Status in South Korea. Int. J. Health Geogr. 2014, 13, 6. [Google Scholar] [CrossRef] [PubMed] [Green Version]
  88. Pearsall, H.; Christman, Z. Tree-Lined Lanes or Vacant Lots? Evaluating Non-Stationarity between Urban Greenness and Socio-Economic Conditions in Philadelphia, Pennsylvania, USA at Multiple Scales. Appl. Geogr. 2012, 35, 257–264. [Google Scholar] [CrossRef]
  89. Oshan, T.M.; Smith, J.P.; Fotheringham, A.S. Targeting the Spatial Context of Obesity Determinants via Multiscale Geographically Weighted Regression. Int. J. Health Geogr. 2020, 19, 11. [Google Scholar] [CrossRef] [PubMed]
  90. Páez, A.; Farber, S.; Wheeler, D. A Simulation-Based Study of Geographically Weighted Regression as a Method for Investigating Spatially Varying Relationships. Environ. Plan. A 2011, 43, 2992–3010. [Google Scholar] [CrossRef]
  91. Wu, D. Spatially and Temporally Varying Relationships between Ecological Footprint and Influencing Factors in China’s Provinces Using Geographically Weighted Regression (GWR). J. Clean. Prod. 2020, 261, 121089. [Google Scholar] [CrossRef]
  92. Wang, C.-H.; Chen, N. A Geographically Weighted Regression Approach to Investigating the Spatially Varied Built-Environment Effects on Community Opportunity. J. Transp. Geogr. 2017, 62, 136–147. [Google Scholar] [CrossRef]
  93. Rogerson, P. Statistical Methods for Geography: A Student’s Guide, 5th ed.; SAGE Publishing: Thousand Oaks, CA, USA, 2019. [Google Scholar]
  94. Fotherington, S.; Charlton, M. Geographically Weighted Regression: A Tutorial Using GWR in ArcGIS 9.3; National Center for Geocomputaion: Maynooth, Ireland, 2009. [Google Scholar]
  95. He, X.; Mai, X.; Shen, G. Poverty and Physical Geographic Factors: An Empirical Analysis of Sichuan Province Using the GWR Model. Sustainability 2021, 13, 100. [Google Scholar] [CrossRef]
  96. Mennis, J. Mapping the Results of Geographically Weighted Regression. Cartogr. J. 2006, 43, 171–179. [Google Scholar] [CrossRef] [Green Version]
  97. Chun, H.; Chi, S.; Hwang, B.G. A Spatial Disaster Assessment Model of Social Resilience Based on Geographically Weighted Regression. Sustainability 2017, 9, 2222. [Google Scholar] [CrossRef] [Green Version]
  98. Margolies, A.; Aberman, N.-L.; Gelli, A. Traditional Leadership and Social Support in Southern Malawi; International Food Policy Research Institute: Lilongwe, Malawi, 2017; p. 4. [Google Scholar]
  99. McNamara, T. “Me and the NGO Staff, We Live Like Azungu”: Malawian Moral Economies of Development. Hum. Organ. Okla. City 2019, 78, 43–53. [Google Scholar] [CrossRef]
  100. Khomba, D.C.; Trew, A. Aid and Local Growth in Malawi. School of Economics and Finance Discussion Paper 1612; University of St Andrews: St Andrews, UK, 2016. [Google Scholar]
  101. Ndlovu, T.; Ndlovu, S. Are Cash Transfers the Panacea to Local Involvement in Humanitarian Decision-Making? Evidence from World Vision Projects in Umzingwane. JAMBA-J. Disaster Risk Stud. 2019, 11, a486. [Google Scholar] [CrossRef] [PubMed] [Green Version]
  102. Ellis, F. ‘We Are All Poor Here’: Economic Difference, Social Divisiveness and Targeting Cash Transfers in Sub-Saharan Africa. J. Dev. Stud. 2012, 48, 201–214. [Google Scholar] [CrossRef] [Green Version]
  103. Sørensen, J.F.L. Rural–Urban Differences in Bonding and Bridging Social Capital. Reg. Stud. 2016, 50, 391–410. [Google Scholar] [CrossRef]
  104. Lanati, M.; Sanfilippo, M.; Santi, F. Aid and Internal Migration in Malawi; European University Institute: Florence, Italy, 2021. [Google Scholar]
  105. Foster, K.A.; Smith, R.J.; Bell, B.A.; Shaw, T.C. Testing the Importance of Geographic Distance for Social Capital Resources. Urban Aff. Rev. 2019, 55, 231–256. [Google Scholar] [CrossRef]
  106. OPM Qualitative Research and Analyses of the Economic Impacts of Cash Transfer Programmes in Sub-Saharan Africa Malawi Country Case Study Report; Food and Agriculture Organization: Rome, Italy, 2014.
  107. McCarthy, N.; Kilic, T.; Brubaker, J.; Murray, S.; de la Fuente, A. Droughts and Floods in Malawi: Impacts on Crop Production and the Performance of Sustainable Land Management Practices under Weather Extremes. Environ. Dev. Econ. 2021, 26, 432–449. [Google Scholar] [CrossRef]
  108. World Bank. Malawi Drought 2015–2016: Post-Disaster Needs Assessment (PDNA); The World Bank: Washington, DC, USA, 2016; pp. 1–113. [Google Scholar]
  109. Wossen, T.; Berger, T.; Haile, M.G.; Troost, C. Impacts of Climate Variability and Food Price Volatility on Household Income and Food Security of Farm Households in East and West Africa. Agric. Syst. 2018, 163, 7–15. [Google Scholar] [CrossRef]
  110. IPCC. Climate Change 2014: Synthesis Report; Contribution of Working Groups I, II and III to the Fifth Assessment Report of the Intergovernmental Panel on Climate Change; Intergovernmental Panel on Climate Change: Geneva, Switzerland, 2014; p. 151. [Google Scholar]
  111. McCarthy, N.; Kilic, T. The Nexus between Gender, Collective Action for Public Goods and Agriculture: Evidence from Malawi. Agric. Econ. 2015, 46, 375–402. [Google Scholar] [CrossRef]
  112. Yabe, T.; Ukkusuri, S.V.; C. Rao, P.S. Mobile phone data reveals the importance of pre-disaster inter-city social ties for recovery after Hurricane Maria. Appl. Netw Sci. 2019, 4, 98. [Google Scholar] [CrossRef] [Green Version]
  113. Wilkin, J.; Biggs, E.; Tatem, A.J. Measurement of Social Networks for Innovation within Community Disaster Resilience. Sustainability 2019, 11, 1943. [Google Scholar] [CrossRef] [Green Version]
  114. Gao, J.; Zhang, Y.C.; Zhou, T. Computational Socioeconomics. Phys. Rep. 2019, 817, 1–104. [Google Scholar] [CrossRef] [Green Version]
Figure 1. Map of Malawi and study areas.
Sustainability 14 09374 g001
Figure 2. Interpolation maps for (A) bonding social capital index, (B) bridging social capital index and (C) linking social capital index. Areas in brown show the lowest social capital indices and green the highest.
Sustainability 14 09374 g002
Figure 3. Local R2 values the geographically weighted regression with (A) bonding social capital, (B) bridging social capital and (C) linking social capital as dependent variables.
Sustainability 14 09374 g003
Figure 4. Geographically weighted regression maps with bonding social capital index as the dependent variable.
Sustainability 14 09374 g004
Figure 5. Geographically weighted regression maps with bonding social capital index as the dependent variable.
Sustainability 14 09374 g005
Figure 6. Geographically weighted regression maps with bridging social capital index as the dependent variable.
Sustainability 14 09374 g006
Figure 7. Geographically weighted regression maps with bridging social capital index as the dependent variable.
Sustainability 14 09374 g007
Figure 8. Geographically weighted regression maps with linking social capital index as the dependent variables.
Sustainability 14 09374 g008
Table 1. Variables used in the study and their link to the Sustainable Livelihoods Framework. Data sources of variables stated. IHS4—Fourth Malawian Integrated Household Survey; RCMRD—Regional Centre for Mapping of Resources for Development [67,68,69,70].
Sustainable Development Component Sustainable Development IndicatorSource Spatial ResolutionRelevant SDG
Human Population density (people/km2)IHS4Community3, 11
Teacher/pupil ratio IHS4 Community4.1
Illiteracy rate (%)RCMRD District4.6
Distance to primary school (km)IHS4Community1.4
Natural Agricultural cover (% in 1 km buffer)IHS4Community2.3/15
Forest cover (% in community)IHS4 Community15.1
Average land size in community (Acre)IHS4 Community2.3
Financial Main income source (farmer/non-farmer)IHS4 Community8.3
Distance to microfinance (km) IHS4 Community1.4
Physical Distance to market (km)IHS4Community1.4
Built settlements (yes or no)WorldPop 100 m11
Distance to urban centre (km)IHS4 Community1.4
Distance to bus stop (km)IHS4Community11.2
Vulnerability Vulnerability Index (0–100, 100 is very high vulnerability)RCMRD Not listed 13.1/1.5
Poverty (proportion under $1.25 a day)WorldPop100 m1.1
Shocks 2015 flood/drought experience (Yes or No)IHS4 Community
Price shock in 2013/14 (Yes or No)IHS4 Community
Wettest month (mm)IHS4Community
Mean temperature during wettest quarter (C0)IHS4Community
Table 2. Six elements of the SC-IQ, proxies in the elements of the SC-IQ, variables used in this study that relate to the SC-IQ and their use in other studies.
Social Capital TypologyVariables Used in This Study SC-IQ Category Questions/Variables in SC-IQ Studies Using Similar Proxies
BondingCash, food and in-kind transfers
Relied unconditionally on help from family and friends
Groups and Networks Group membership, group characteristics and mutual support[3,31,73,74]
BridgingNumber of bridging groups
Number of bridging group members
Number of bridging group meetings
Groups and Networks Group membership, group characteristics and mutual support[4,32,52,75,76,77]
Bridging group action
Collective Action Frequency and extent of collective action, the type of the activities undertaken collectively and participation in collective action[25,75,78]
LinkingNumber of linking groups
Number of linking group members
Number of linking group meetings
Groups and Networks Group membership, group characteristics and mutual support[4,32,77]
Linking group action
Collective Action Frequency and extent of collective action, the type of the activities undertaken collectively and participation in collective action[25]
MP Visit Empowerment and political action Filing petitions, attending public meetings, meeting with politicians, participating in demonstrations and campaigns, and voting in elections.[25]
Table 3. Identified combinations of different levels of social capital typologies by sub-region.
Sub RegionBonding
Social Capital
Bridging Social
Capital
Linking Social Capital
Combination 1Zomba (and surrounding area)High Low Low
LilongweHighLowLow
Northwest lake shoreHigh-moderateLowLow
SouthwestHighModerate-lowLow-moderate
Combination 2West of central regionLowModerate-lowModerate-low
Blantyre Moderate-lowModerateModerate
Top southern regionLowModerateModerate
Combination 3Southern tipHighHighHigh
Middle central region (exc. Lilongwe)High-moderateHighModerate-high
Table 4. Final model selection using stepwise linear regression with bonding social capital index as the dependent variable. Variables entered model at p-value < 0.10 and removed at p-value > 0.15.
Independent VariablesStandardized Coefficients BetaT-Statisticp-Value
Distance to urban centre−0.266−4.7770.000
Forest cover0.2256.3340.000
Drought0.1664.7000.000
Income source0.1543.2740.001
Population density0.1563.2210.001
Land size0.1012.5780.010
Flood0.0812.2100.027
Distance to school0.0882.4770.014
Temperature0.1613.1860.002
Vulnerability−0.162−2.8060.005
Constant −3.4990.001
Table 5. Final model selection using stepwise linear regression with bridging social capital index as the dependent variable. Variables entered model at p-value < 0.10 and removed at p-value > 0.15.
Independent VariablesStandardized Coefficients BetaT-Statisticp-Value
Income−0.154−3.0770.002
Distance to microfinance−0.146−3.3910.001
Illiteracy0.1663.5650.000
Temperature−0.211−3.7340.000
Vulnerability0.1972.9800.003
Precipitation (wettest month)−0.071−1.6640.097
population density−0.112−2.1320.033
Forest cover−0.080−1.9920.047
Distance to school−0.073−1.8270.068
Distance to market0.0671.6590.098
Constant 4.1330.000
Table 6. Final model selection using stepwise linear regression with linking social capital index as the dependent variable. Variables entered model at p-value < 0.10 and removed at p-value > 0.15.
Independent VariablesStandardized Coefficients BetaT-Statisticp-Value
Distance to school−0.124−3.0440.002
Distance to urban centre0.1002.4310.015
Drought0.0691.7020.089
Constant −1.2960.196
Table 7. Model fit results from the bonding, bridging and linking SCI geographically weighted models and linear regression models.
OLSGWR
ModelAdjusted R2AICc Adjusted R2AICc
Bonding0.288−142.1510.6667−369.938
Bridging0.1111327.7290.28671280.839
Linking 0.025 1152.0920.03261152.891
Publisher’s Note: MDPI stays neutral with regard to jurisdictional claims in published maps and institutional affiliations.

