Article

Field Applicability of Earthwork Volume Calculations Using Unmanned Aerial Vehicle

1
Department of Construction Policy Research, Korea Institute of Civil Engineering and Building Technology, Goyang-si 10223, Korea
2
Meissa Inc., Seoul 06128, Korea
3
Department of Architecture, Sahmyook University, Seoul 01795, Korea
*
Author to whom correspondence should be addressed.
Sustainability 2022, 14(15), 9331; https://doi.org/10.3390/su14159331
Submission received: 21 June 2022 / Revised: 20 July 2022 / Accepted: 25 July 2022 / Published: 29 July 2022
(This article belongs to the Section Green Building)

Abstract

:
The earthwork volume must be calculated as accurately as possible for economical construction and cost savings. In particular, when calculating the areas and volumes of irregular curved terrains such as mountains, reservoirs, lakes, and coasts, the vertical assumptions for the boundary equation must be rationally and systematically established. This study focuses on earthwork volume calculation technology using UAV (unmanned aerial vehicle). UAV can be used for various types of work, including checking the progress of construction at construction sites and calculating the earthwork volume for large areas. However, earthwork volume calculation technology using UAV is inefficient in terms of information production, management, and reuse because the quantitative guidelines for UAV operations are insufficient, and the output quality, analysis method, and analysis results differ. To solve these problems, the authors investigated an earthwork volume calculation method for construction sites that use UAV to automate the on-site calculation of construction errors and support an on-site monitoring system using building information modeling (BIM). To calculate the earthwork volume of the target site, a chain method with a planned plane map based on the average end-area method was used as a representative earthwork volume calculation method. The digital surface model method was applied to review the optimization of the earthwork volume calculation using UAV. This study is a process of analyzing construction data, and aims to strengthen the linkage of 3D data and provide construction management information specialized in excavation work. Through this earthwork analysis using UAV, it is possible to intuitively review the progress of earthwork in 3D by linking the current site with the planned plane.

1. Introduction

The South Korean Ministry of Land, Infrastructure, and Transport announced the smart construction technology roadmap in 2018. Its goal is to build the foundation for utilizing smart construction technologies by 2025 and complete construction automation by 2030 to activate smart construction technologies, thereby providing an opportunity for a new leap forward in the construction industry based on advanced technologies [1]. Smart construction technologies are defined as technologies that combine traditional construction technologies with leading-edge technologies, such as building information modeling (BIM), unmanned aerial vehicle (UAV), robots, the Internet of things, big data, and artificial intelligence [2]. The development direction of construction technologies presented through the roadmap entails shifting from the traditional experience-dependent industry to a knowledge-based high-technology industry by actively utilizing big data and simulation, while sharing various types of information generated during the construction process [3,4].
Consequently, the South Korean construction industry is rapidly transforming based on three-dimensional (3D) geospatial information [5]. Recently, related South Korean ministries, including the Ministry of Land, Infrastructure, and Transport, have established legal and institutional systems through a smart construction technology project (with a budget of KRW 141.8 billion), a smart construction roadmap, and the introduction of smart technologies in turnkey construction projects [6].
During the design stage, it is necessary to automate the design process based on big data after establishing a digital information model using a UAV survey and full-scale BIM [7]. During the construction stage, the entire construction process should be automated after developing equipment automation and assembly work control technologies. To this end, field measurement and monitoring technologies based on 3D geospatial information are essential.
In large-scale construction projects such as expressways, railways, pipelines, or ports, earthwork accounts for a large portion of the total construction cost [8]. The earthwork volume must be calculated as accurately as possible for economical construction and cost savings [9]. In particular, when calculating the areas and volumes of irregular curved terrains such as mountains, reservoirs, lakes, and coasts, the vertical assumptions for the boundary equation must be rationally and systematically established [10].
During the construction stage, four-dimensional (4D) process simulation functions linked to the project schedule and 3D objects based on a 3D model created in the prior design stage can be used [11]. Because construction management work is performed using 4D objects in the 3D-based construction stage, work breakdown schedule codes, schedule information linked with them, and connection functions for 3D objects are required to set up a 4D model [12]. If process progress status management functions for quarterly progress management consultation among participants are developed in addition to the visualization of simple construction schedules, the current numerical progress management can be converted to visual concepts [13,14].
Recent rapid developments in micro electro mechanical system (MEMS) technology have advanced the development of scanning equipment such as survey UAV and lidar. As a result, it is possible to acquire a high-density point cloud in a short time. Research to quickly and accurately calculate the amount of earthwork using the point cloud has begun in earnest.
Yilmaz [15] calculated the amount of earthwork by using a short-range ground photogrammetric measurement method before UAV measurement technology was developed. The volume was calculated through ground photogrammetric survey and ground survey by the total station. Total station showed an accuracy of 5.34% and laser scanners of 0.05%. This has verified the superiority of the laser scanning method with high point density. Hugenholtz [16] identified the amount of change in aggregates deposited by UAV measurement method and proved the accuracy of quantity calculation. It was confirmed that there was a slight difference between the UAV survey and the actual aggregate amount of about 2.5%. In Raeva et al. [17], there was a slight difference of 1.1% in volume between UAV and GNSS methods. The difference gap in analysis between the two methods was not large, but UAVs were significantly higher in data processing time. Ekpa et al. [18] calculated the volume of the yard by using UAV photogrammetric survey and ground survey using a total station. In this paper, a variety of software was used, but the Sufer software was not suitable for volume calculation. Agisoft Photoscan and Autocad Civil 3D have been found to be ideal for vector data calculations.
In particular, Yi et al. [19] recently conducted a study that could effectively analyze changes in earthwork through oblique photographic surveys of UAV. This study explored the use of UAV oblique photography for the deformation monitoring of the foundation pit slope and calculation of earthwork volume changes. Aiming at the problems of low efficiency and complicated operation of traditional data collection methods, Bin et al. [20] studied the earthwork calculation method based on drone tilt photogrammetry technology. The research shows that the technology has greatly improved the field data collection efficiency and the internal business processing. Study of Rotnicka [21] is to compare precise GPS-RTK transects across a section of the South Baltic coast in Poland with those obtained from a DEM based on high-resolution and high-accuracy images obtained by a wind-resistant, high-quality fixed-wing UAV during beyond visual line of sight operation (BVLOS). The study revealed that the uncertainty of the UAV-derived DEM increases together with increasing slope inclination and, to a lesser degree, with increasing general slope curvature.
As described above, most of the previous studies on the calculation of the earthwork amount examined the possibility of calculating the volume of UAV, and the applicability could be seen through comparison with the ground survey according to the average method of both cross-sections.
This study focuses on earthwork volume calculation technology using UAV. The biggest advantage of UAV is their ability to make observations from positions that are inaccessible to humans. In addition, UAV can be used for various types of work, including checking the progress of construction at construction sites and calculating the earthwork volume for large areas [22]. However, they are inefficient in terms of information production, management, and reuse because the quantitative guidelines for UAV operations are insufficient, and the output quality, analysis method, and analysis results differ [23,24].
To solve these problems, the authors investigated an earthwork volume calculation method for construction sites that use UAV to automate the on-site calculation of construction errors and supports an on-site monitoring system. This study included actual earthwork site tests. To calculate the earthwork volume of the target site, the chain method with a planned plane map using the average end-area method was employed, which is a representative earthwork volume calculation method [25]. The digital surface model (DSM) method was applied to review the optimization of the earthwork volume calculation using UAV.
In the detailed method used in this study, the earthwork volume calculations of the chain method using a planned plane map were classified by the earthwork volume calculation interval (20, 10, or 5 m). The results were then compared with the earthwork volume calculations using the DSM method, and each calculation method was analyzed. The objective of this study was to examine the field applicability of the earthwork volume calculation technology using a 3D-based UAV based on the values derived by calculating the earthwork volume of the corresponding site using each method. The details of this study are shown in Figure 1 below.

2. Application of 3D Modeling and UAV Technology for Earthwork Volume Calculation during the Construction Stage

2.1. Earthwork Volume Calculation Technology for the Construction Stage

The calculation of the earthwork volume for earth filling and cutting in large-scale construction projects is mainly performed by transport, soil, and survey engineers [26]. Because earthwork accounts for a large portion of the total construction cost, the earthwork volume for expressways, canals, railways, dams, and pipelines should be calculated as accurately as possible to achieve economical construction and cost savings [27]. In civil engineering work, there is a high possibility of construction setbacks because it is difficult to secure a soil excavation site. Therefore, performing an earthwork volume calculation that is consistent with real topography is a critical process [28]. If the construction site is located in an irregular curved area where the terrain shape is not straight, such as a mountain, reservoir, lake, or coastal area, the area and volume need to be calculated rationally and systematically [29]. In the general earthwork volume calculation method, the entire area is divided into grids and the height of each intersection is measured. Typical earthwork volume calculation methods include the section method, which is mainly used in the construction of long routes such as roads, railways, and rivers, and the spot height method, in which the volume is calculated by multiplying the average area by the average height using zoning triangles and rectangles in earthwork calculations for large areas [30]. The earthwork volume is calculated using the average end-area method, which is a representative section method used in general construction projects. To examine the application of UAV to construction sites, earthwork volume calculation methods that use chains and DSMs with planned plane maps were analyzed.
In this study, Earthwork volume analysis of the chain method is performed using the average end-area method. This study aims to analyze whether the amount of earthwork in this chain method differs in accuracy according to the interval of the chain. This study has a differentiation from the existing method by analyzing the field applicability according to the direct chain interval.

2.2. Introduction and Effects of Construction Stage UAV Technology

The current level of UAV utilization in the construction field consists only of supporting decision-making by checking images photographed with UAV or obtaining the required information through data post-processing [22]. Such a photogrammetry-based data post-processing process has become generalized and can easily be used by anyone. Public corporations in South Korea, such as Korea land & housing corporation, Land extraordinary corporation, and Korea Expressway corporation, have established UAV introduction and utilization plans and are trying to apply UAV images in their work.
An examination of the use of UAV in construction reveals that they are mainly used to collect information through cameras. Owing to recent improvements in camera performance, a spatial resolution of 4 cm can be achieved at an altitude of 100 m when a 4 K or higher class camera is used. Some experts have attempted to use UAV in various applications such as building deterioration evaluation, sinkhole detection, soil moisture content analysis, and slope management using thermal imaging cameras, multispectral cameras, and lidar. However, using UAV equipped with expensive equipment at construction sites places a large burden on the operator [22]. Moreover, the UAV images obtained for standard types of work at various construction sites are not immediately usable for existing work processes. UAV images have the disadvantage of requiring post-processing of the data with applications such as Recap, Pix4D, and Metashape.
Data collection using UAV has the advantage of covering a large area within a short time. Technologies to control UAV in indoor spaces are also being developed, and it is expected that UAV that fly safely and quickly through narrow and complex interior spaces will be commercially available in the future. However, the most effective application of UAV at construction sites is for topographic surveys, which are applicable to types of work that require a precision of ~2 cm. Typical types of work that require a precision of 2 cm or higher among the standard types of work done at construction sites include preconstruction status investigations and obstacle investigations [22]. If data are recorded before construction using UAV, inadequate parts of a large-scale status survey can be identified in advance, and problems can be addressed.
Typical types of work that require millimeter-scale precision include the investigation of cracks in structures and in situ soil surveys. In the case of crack investigation, UAV can best be used to investigate cracks in concrete structures at the time of completion. Crack investigations to evaluate the safety of old facilities have practical limitations. An in situ soil survey also requires millimeter-scale point clouds to obtain intact terrain data by removing ground obstacles. Using UAV in a smart construction environment requires specific designs to determine which equipment to use for each purpose, what data should be acquired, and how the data should be processed.

3. Application of the 3D-Based Earthwork Volume Calculation Method

3.1. Creation of a 3D Model and Linking Field Earthwork Volume Data

The process of visualizing the 3D model file used in the field requires a technology to implement the function to visualize the earthwork volume calculation by linking the 3D model generated in the system with data recorded through a UAV.
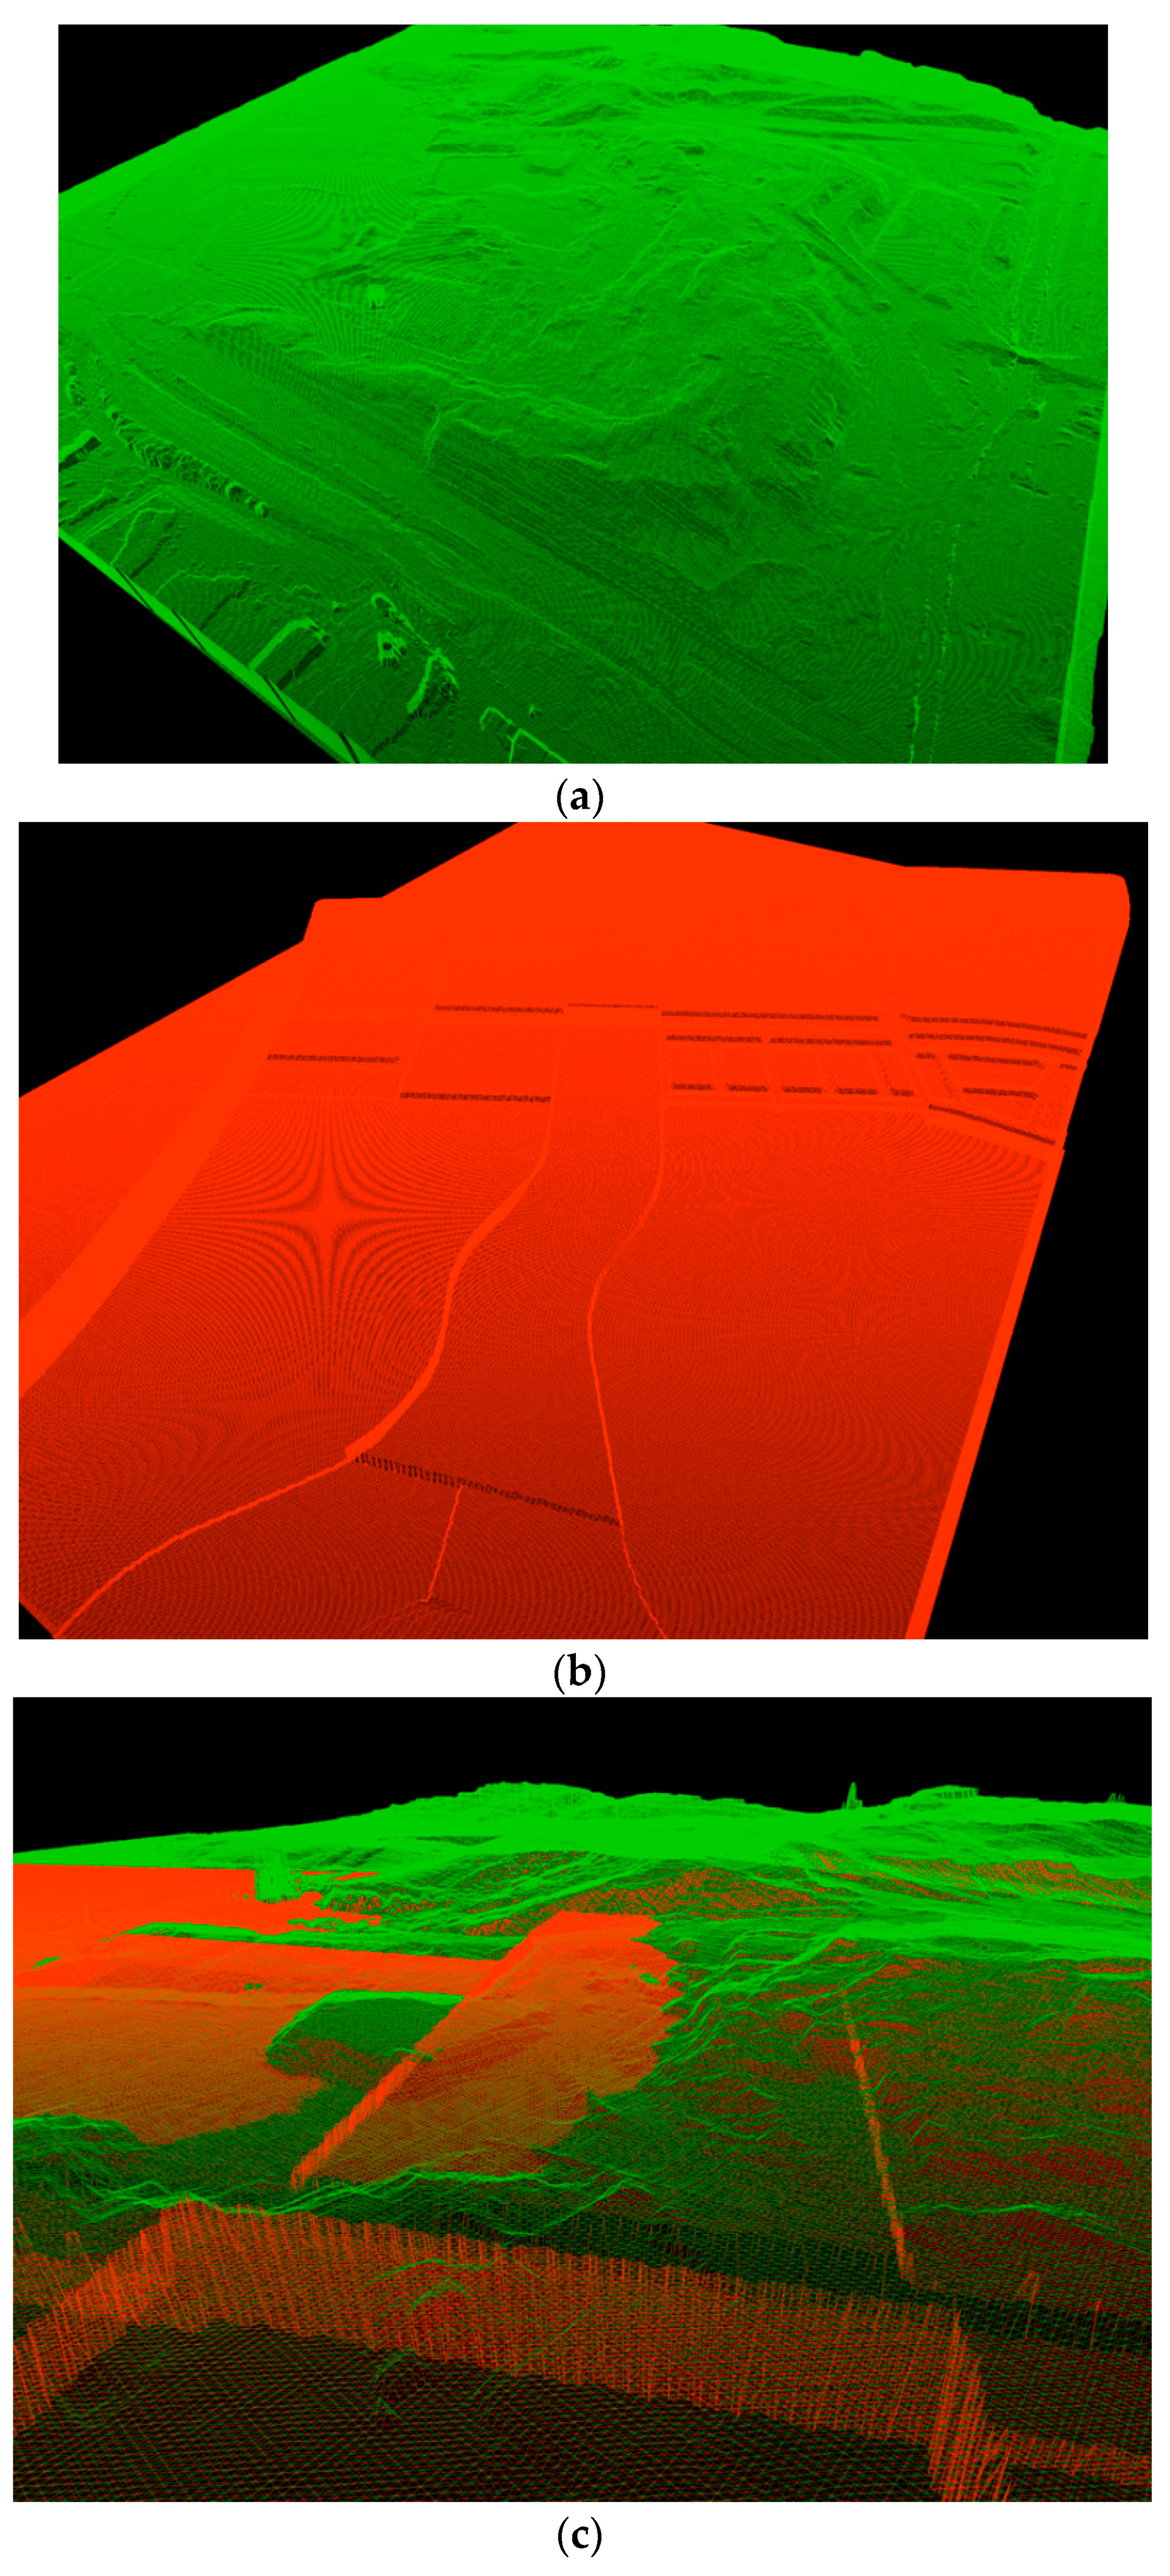
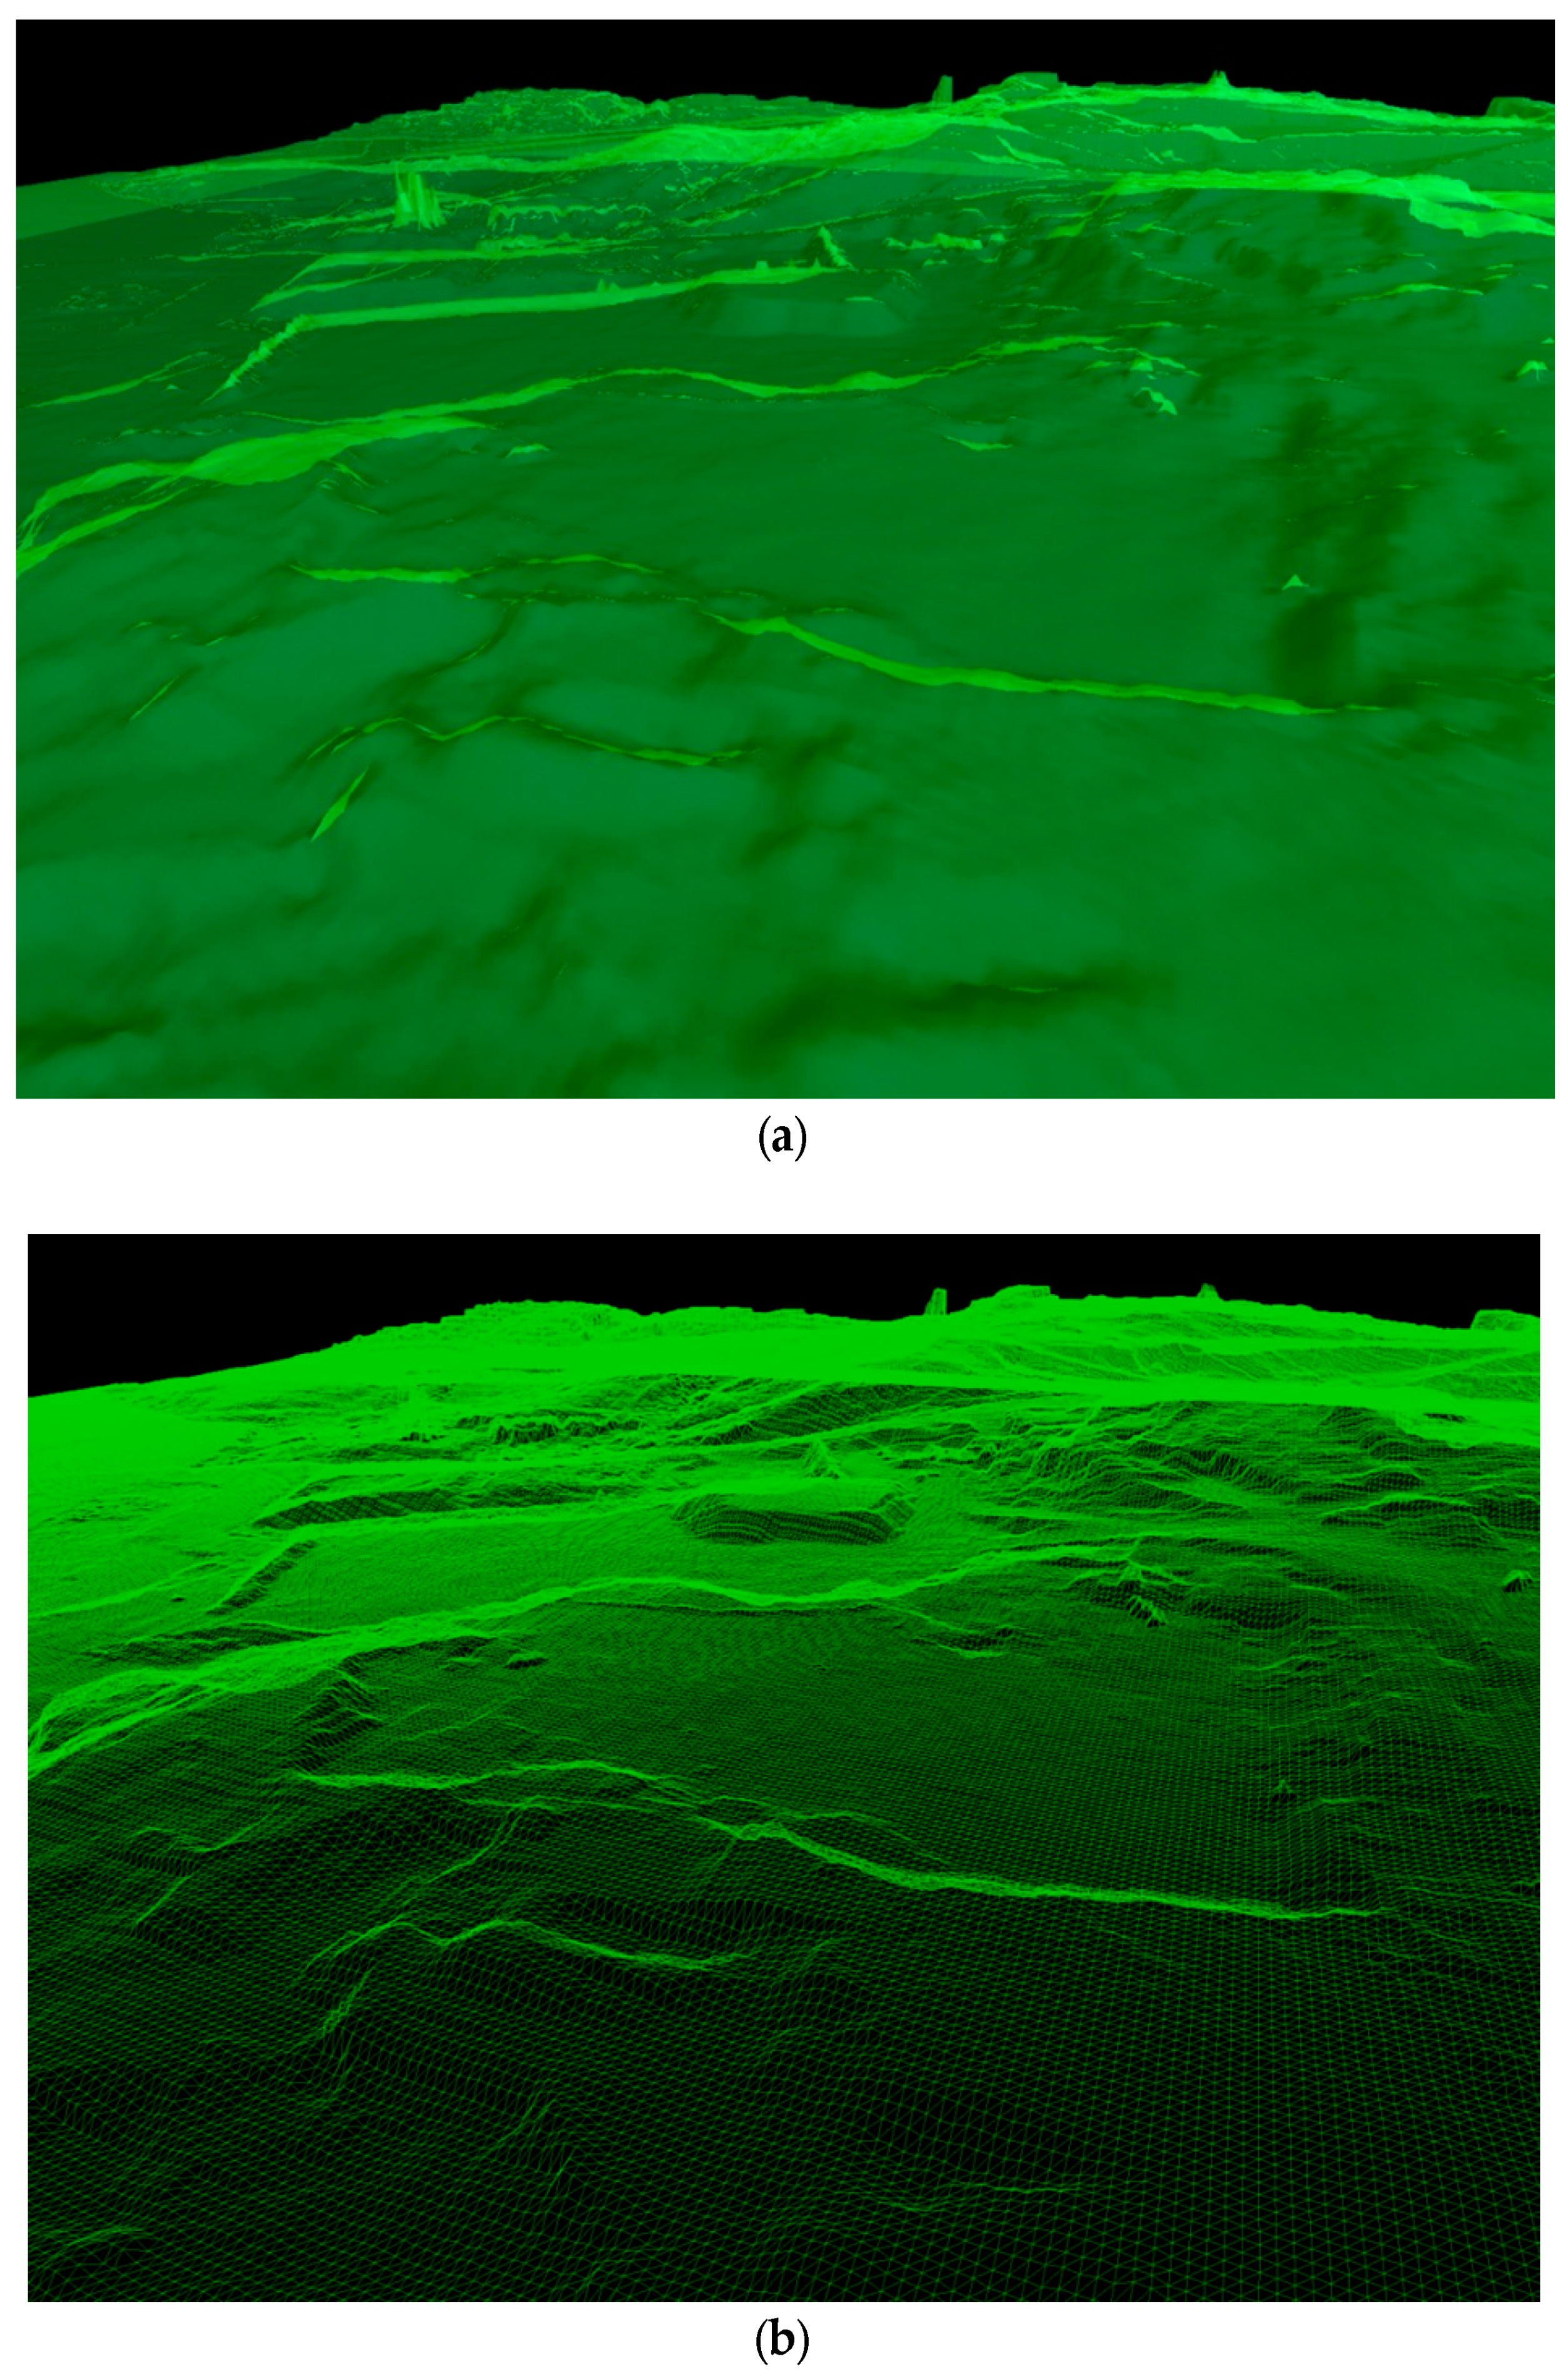
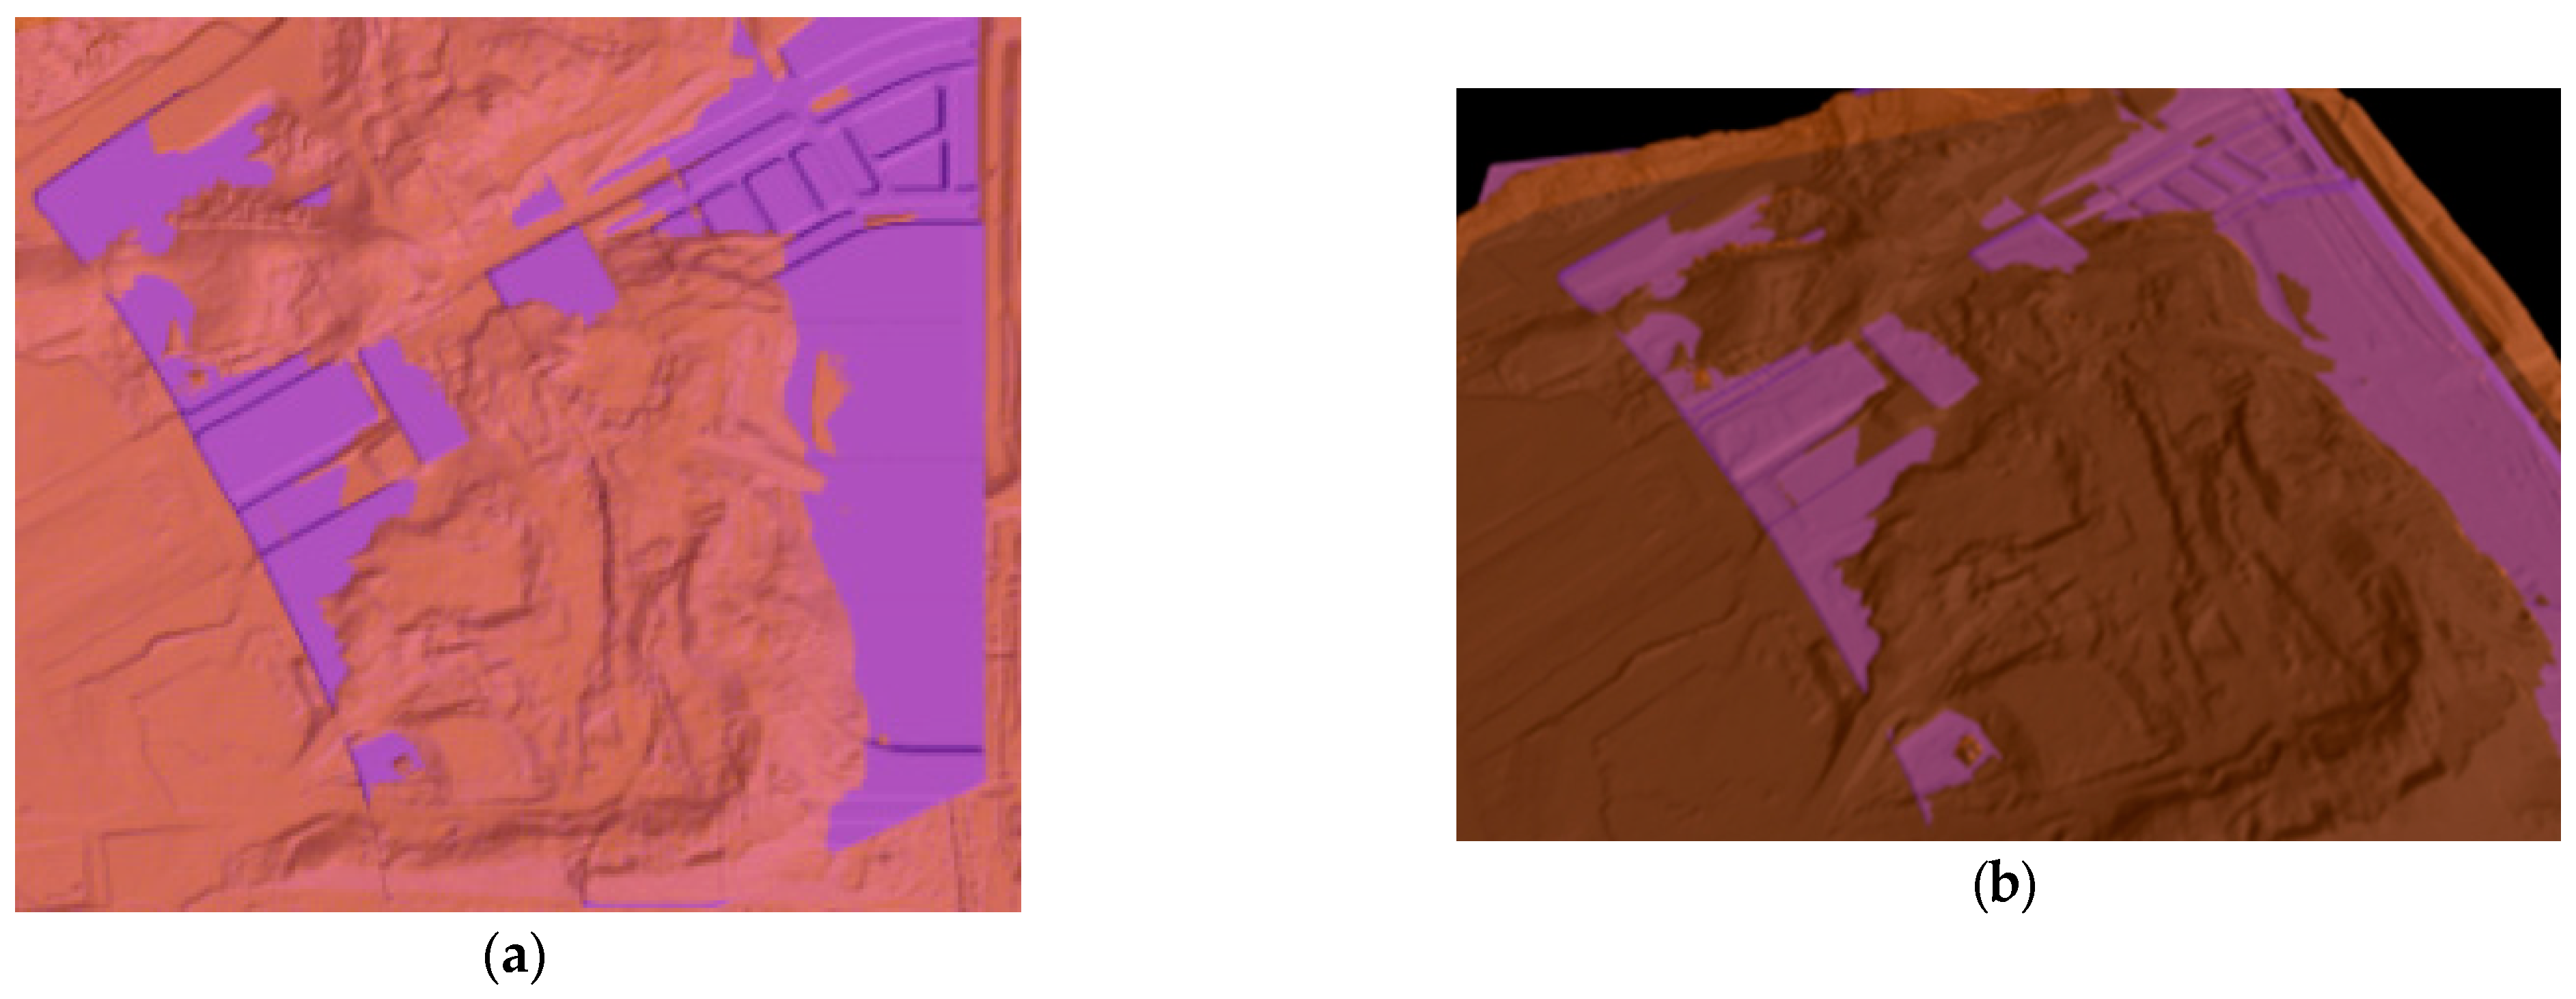
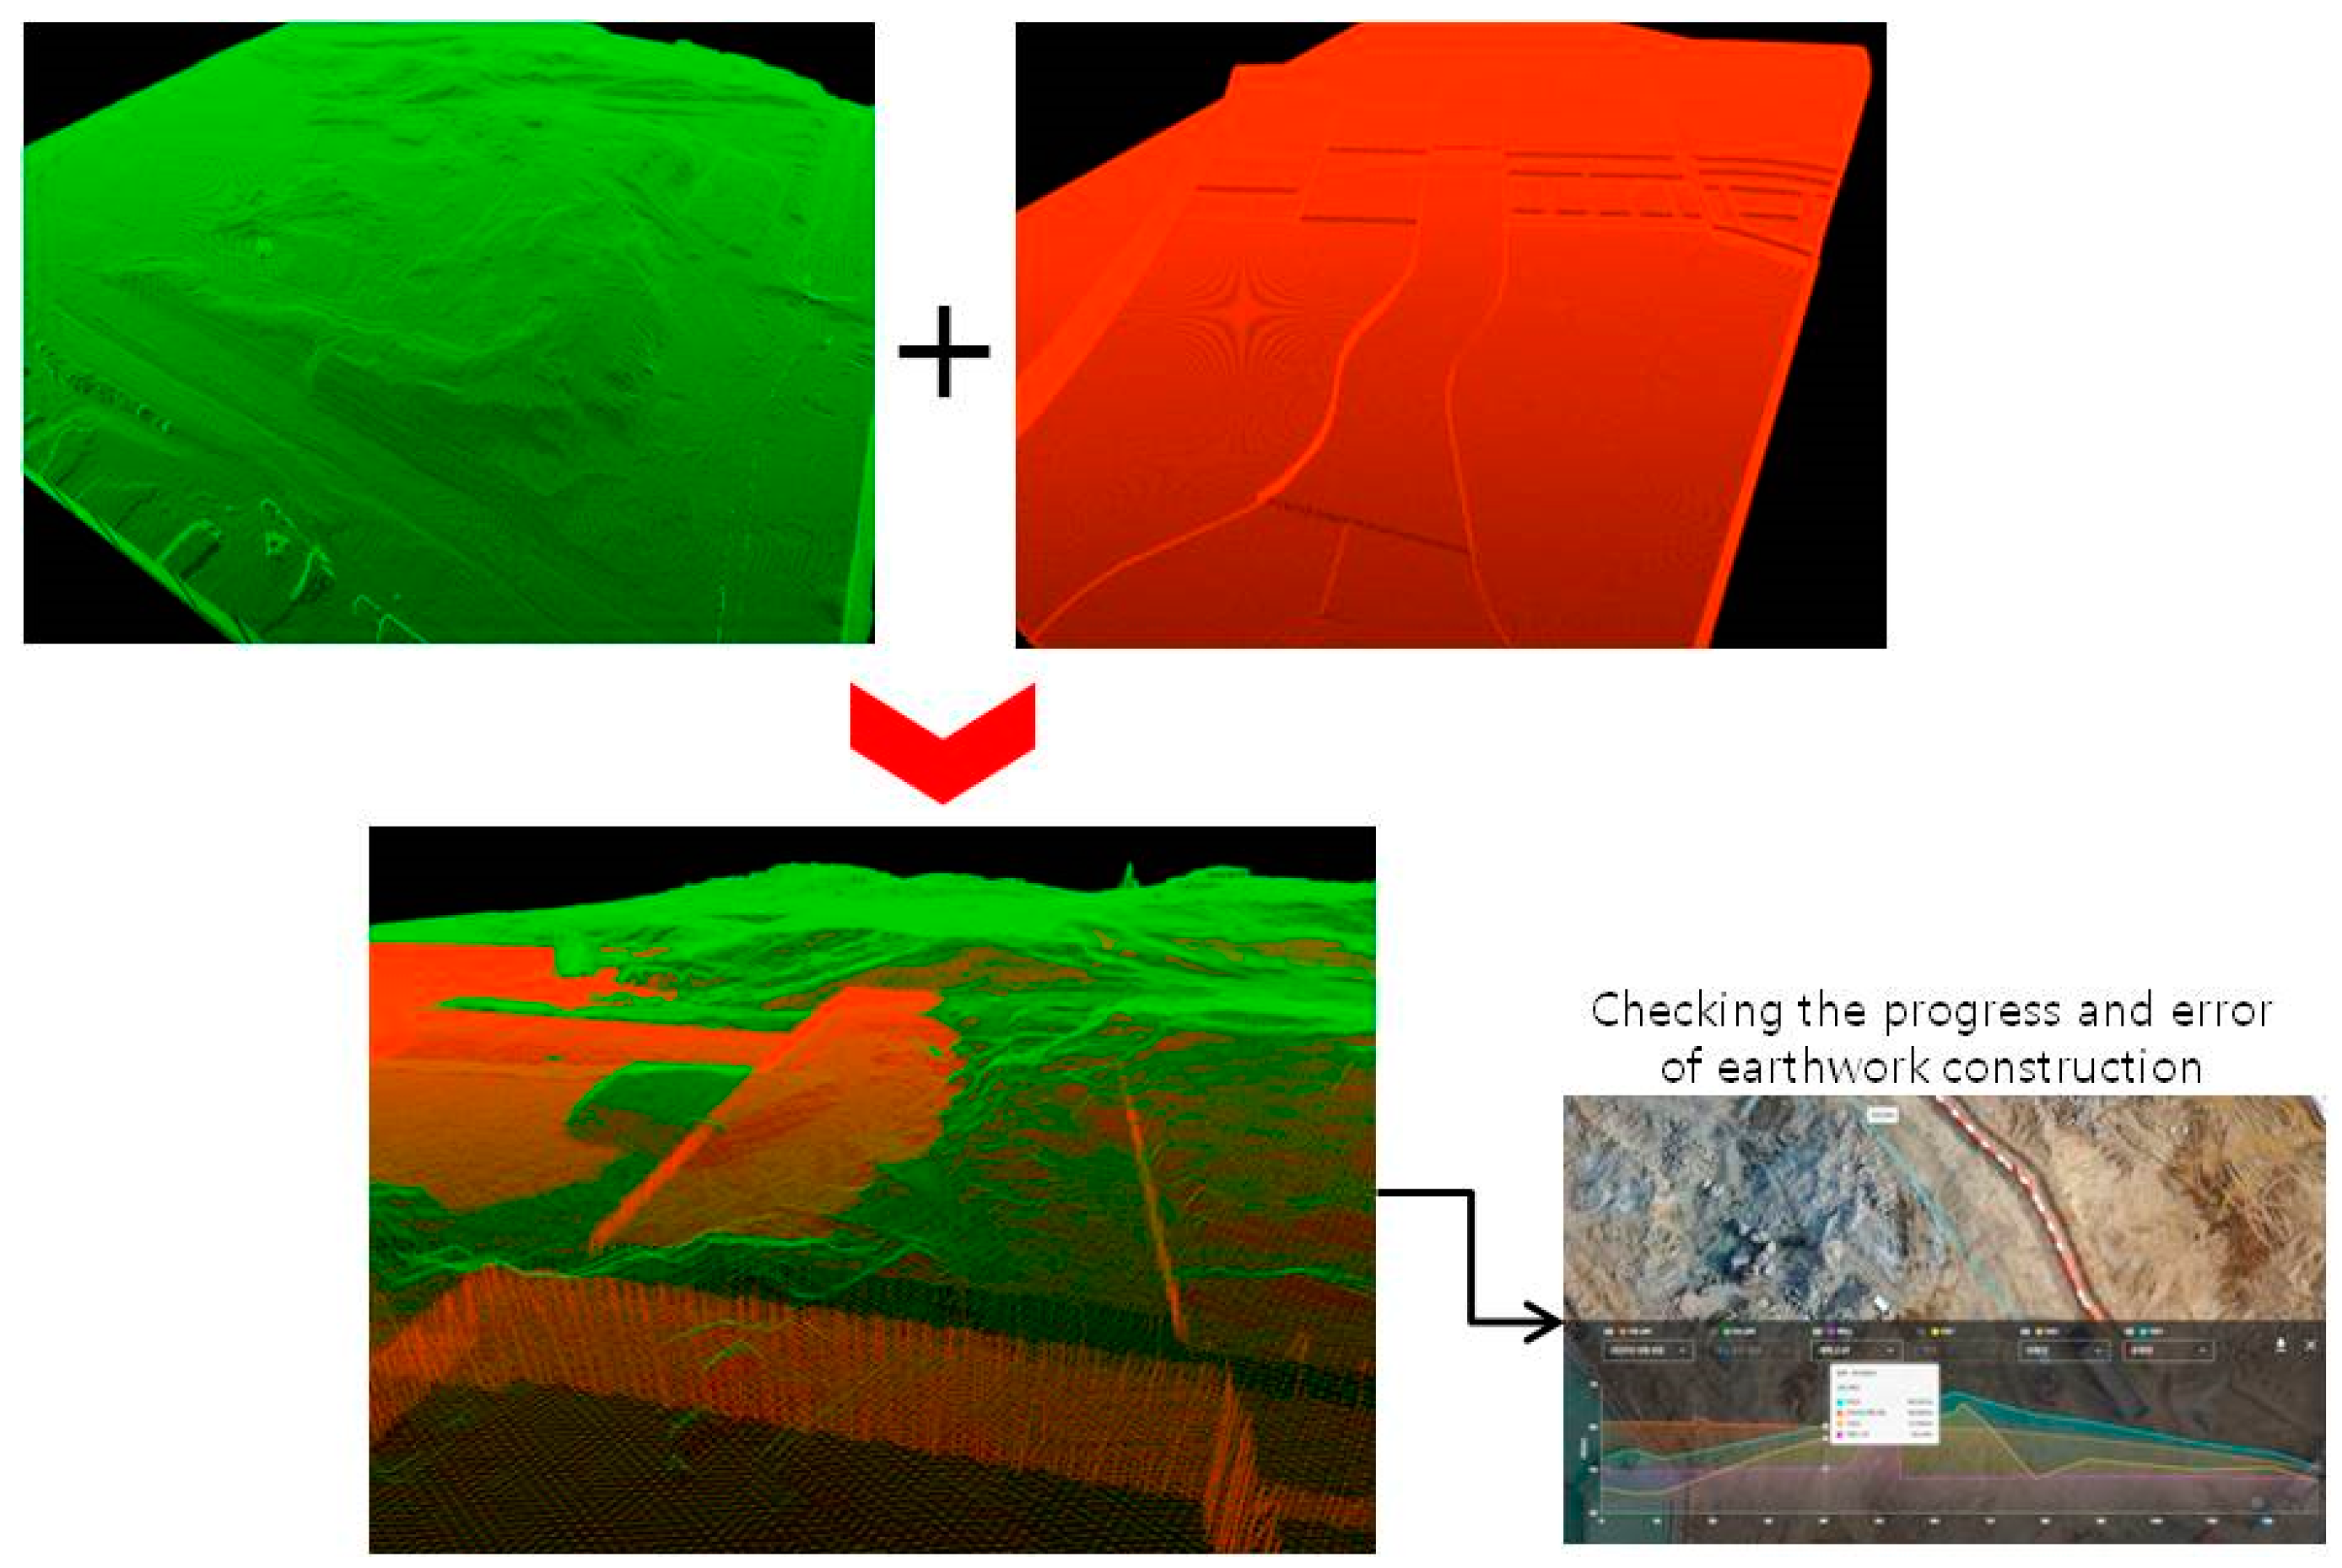
As a data visualization linking method, a 3D model file that coincided with the coordinate system used in the field was created in the Revit program. The created Revit program file (rvt file) was converted to, a drawing file (dwg file) that could be viewed in AutoCAD. The dwg file was finally converted to a tif file, a file format that could be viewed in the visualization system, as shown in Figure 2. In Figure 2, Figure 2b shows 3D modeling of the current and design level, and Figure 2a shows the 3D modeling created by UAV photograph.
In general, 3D models through a UAV are created through orthomosaic collected through UAV flights. The creation of 3D model applied to this study is also performed when coordinate recognition taken on UAV flights is possible. In general, when an object having redundancy is photographed with two or more photos, the photographed information may recognize the 3D coordinates of the object even if the information does not have coordinate information of the object. According to this principle, when the ground is photographed using UAV, it is possible to produce topographic information having 3D coordinates by interpreting multiple superimposing points.
This field applicability test can qualitatively check the progress of civil engineering work at a glance by superimposing and visualizing the 3D model information (Figure 2b) of the construction site with the 3D model (Figure 2a) created by drone photographing. In addition, by superimposing and visualizing the two models, quantitative analysis of progress is possible by calculating the volume between the two models.
As the information of the 3D model and linkage shown in Figure 2 is provided, after the internal objects in each layer were formed in the design model, the visualization function can be activated or deactivated by selecting only the objects desired by the user. Furthermore, a function was implemented that enabled the separate calculation of earth cutting and filling quantities when only the layer desired by a user was applied. As shown in Figure 2c, it was possible to implement a function that showed the earth cutting and filling parts at the site at a glance by superimposing and visualizing the current level and design level. In this figure, the design level is indicated in red, and the 3D model created using UAV photogrammetry is indicated in green. Consequently, data visualization was achieved in such a way that it was easy to see the parts that required earth cutting or filling in each construction section.

3.2. Chain Method for the Earthwork Volume Calculation Using a Planned Plane Map Based on the Average End-Area Method

For the earthwork volume calculation in this study, after cross sections from every chain of the planned plane map were extracted, the average end-area method was used for each cross section to calculate the volume for the corresponding planned plane map. The average end-area method was used to compare and verify the earthwork volume through the chain generated for each cross section.
For the average end-area method, an appropriate earthwork volume calculation formula using the volume of the target cross section and the distance between cross sections was applied [10]. As shown in Figure 3, in the average end-area method, if the areas of two cross sections of the target area for the determination of the earthwork volume are A1 and A2, and the distance between them is , the final earthwork volume V can be expressed as follows:
V = 1 2 ( A 1 + A 2 )
By using this calculation method, a 3D model was created from the field photogrammetry taken by a UAV, and a DSM was created from the 3D model. The DSM was cut out in line with the area of the site, as shown in Figure 4a–c, and chains and cross sections were generated at fixed intervals from the top. The intervals for generating the chains and cross sections were set to 20, 10, and 5 m, and the starting and ending points of each chain were indicated on the DSM, as shown in Figure 4.

3.3. Earthwork Volume Calculation by Using the DSM Method

The basic principle of this calculation method is to determine the difference in the earthwork volume using the differences in the altitudes of the site topography. If the current level at an earlier date between two compared dates is lower than the current level of the later date, the site is considered to be a filled site and added to the earth fill volume. Then, the change in volume between the two dates is estimated. The DSM was used to measure the volumes in a 3D model. When the user selects the edge of the terrain to measure the volume in the DSM as dots, a polygon is generated according to the selected sequence of the dots, and the volume of the polygonal terrain can be calculated [31].
The volume is calculated by using the Delaunay triangulation of the selected polygon, as shown in Figure 5. The Delaunay triangulation can be obtained from a Voronoi diagram, which is a partition of a plane divided into sets of points that are closest to a given point [32]. A Delaunay triangle can be obtained when the points contained in the Voronoi diagram are connected. The triangle generated by Delaunay triangulation has the characteristic that the circumcircle of the triangle does not contain any vertices of other triangles. Therefore, because this method is advantageous for creating a plane from points, it was applied to the technology for estimating the volume of a 3D model.
However, the Delaunay triangulation calculated in this way also includes the outer part of the region of interest selected by the user. Therefore, as indicated by the bold black line in Figure 5, a region of interest is separately selected by the user, and only the triangle inside the region of interest is used for volume measurement.
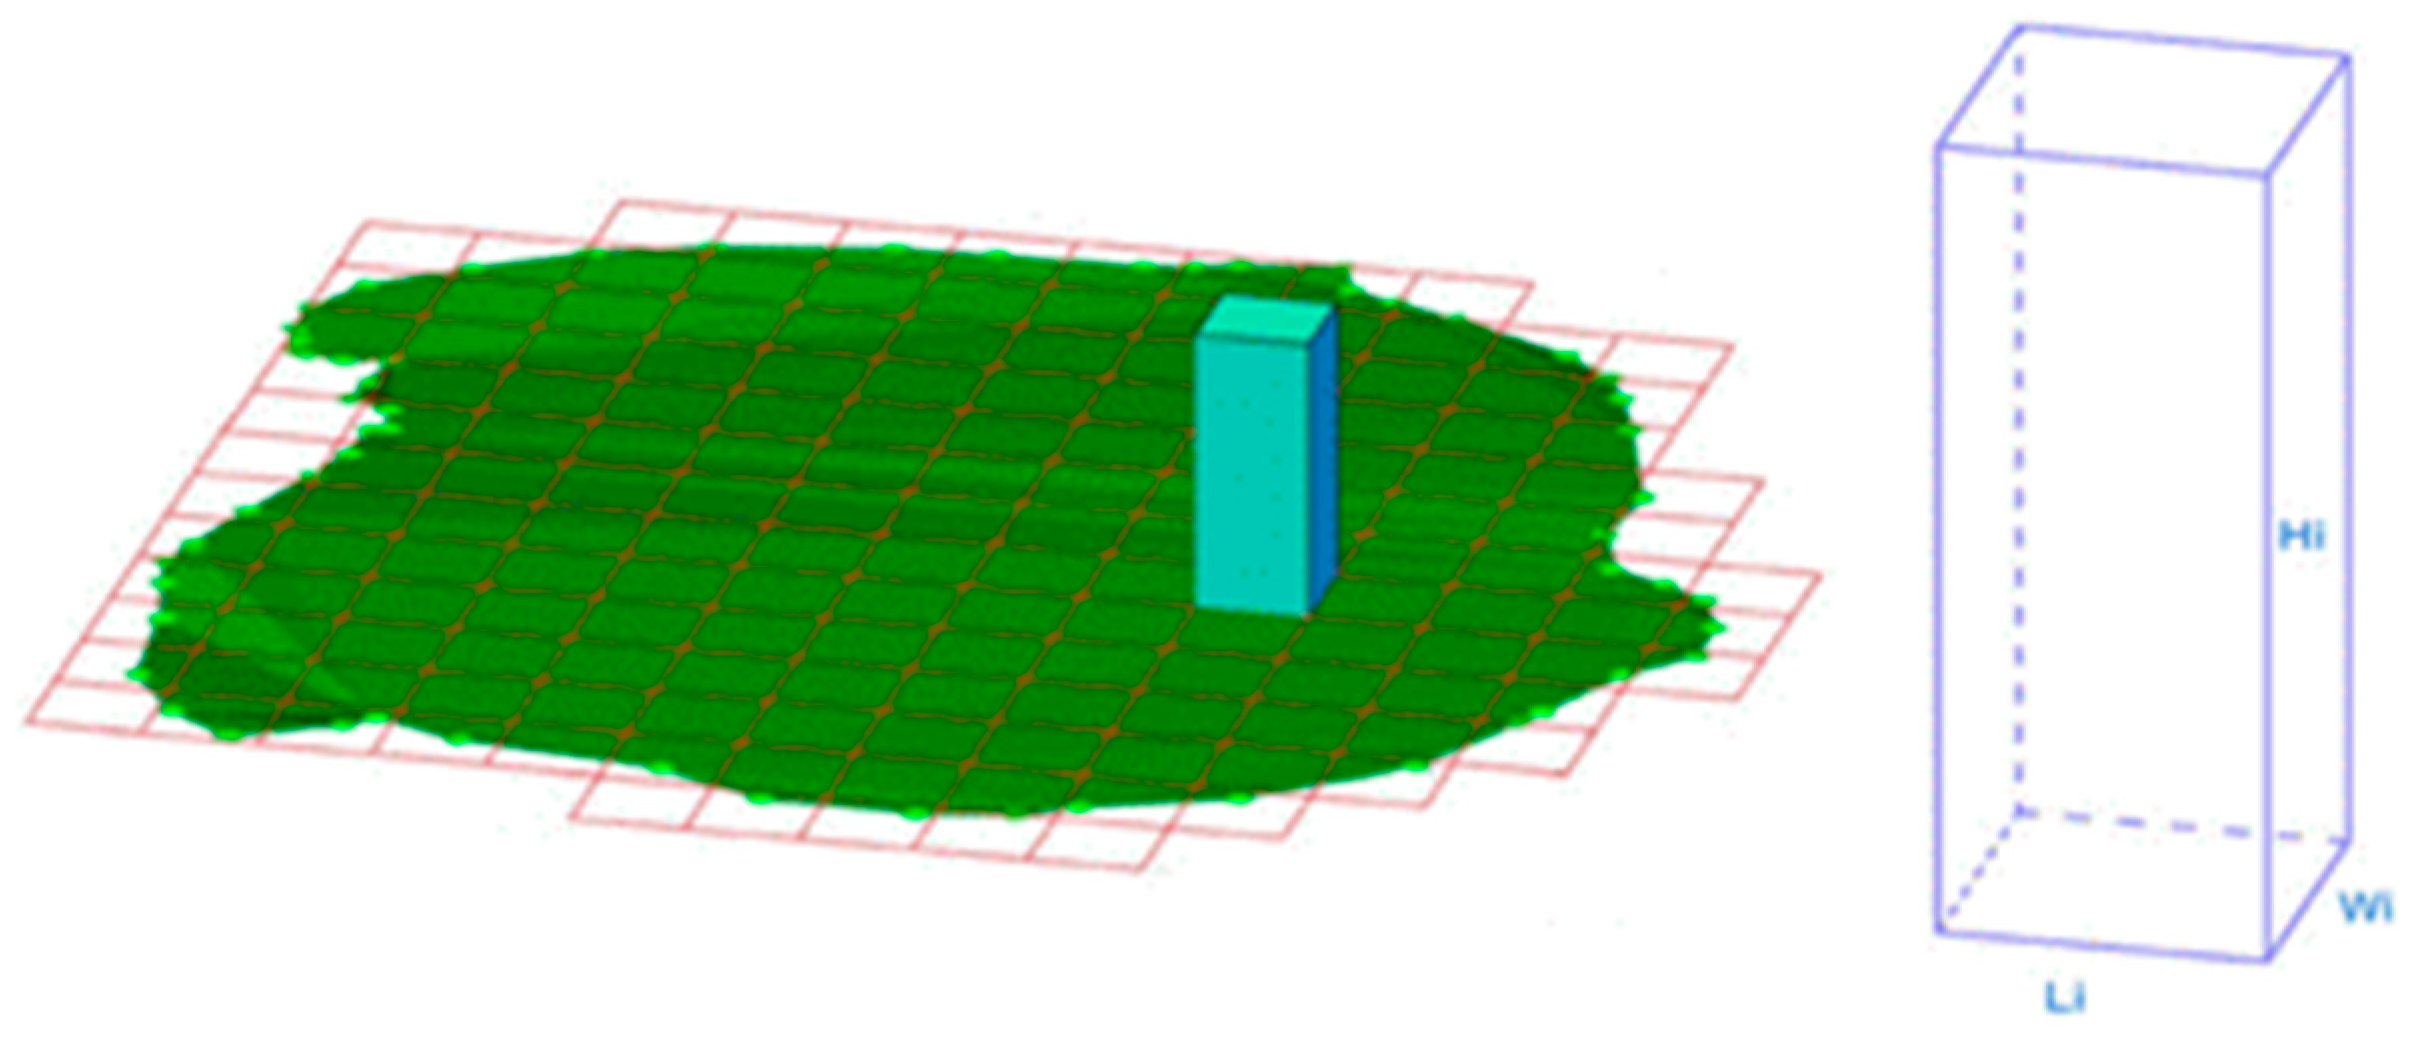
The triangulated polygon provides the height of the upper limit z axis for the cut terrain and the height of the lower limit z axis for the filled terrain. Once the reference height is calculated, the volume of a micro-cuboid is calculated by multiplying the square divided into certain sizes of the horizontal and vertical axes according to the size of the ground sampling distance (GSD) set by the user by the calculated reference height of the a axis. The volume of the 3D model can be estimated by repeating this process and adding all the values.
For example, if the user sets the GSD to 0.05 m, the volume of the micro-cuboid is given as shown in Figure 6. For convenience, the horizontal and vertical lengths of the GSD were assumed to be the same:
volume of micro-cuboid = horizontal length of GSD (0.05 m) × vertical length of GSD (0.05 m) × height (z value − height of the pixel).
In addition,
Σ(volume of micro-cuboid) = actual volume of the 3D model.
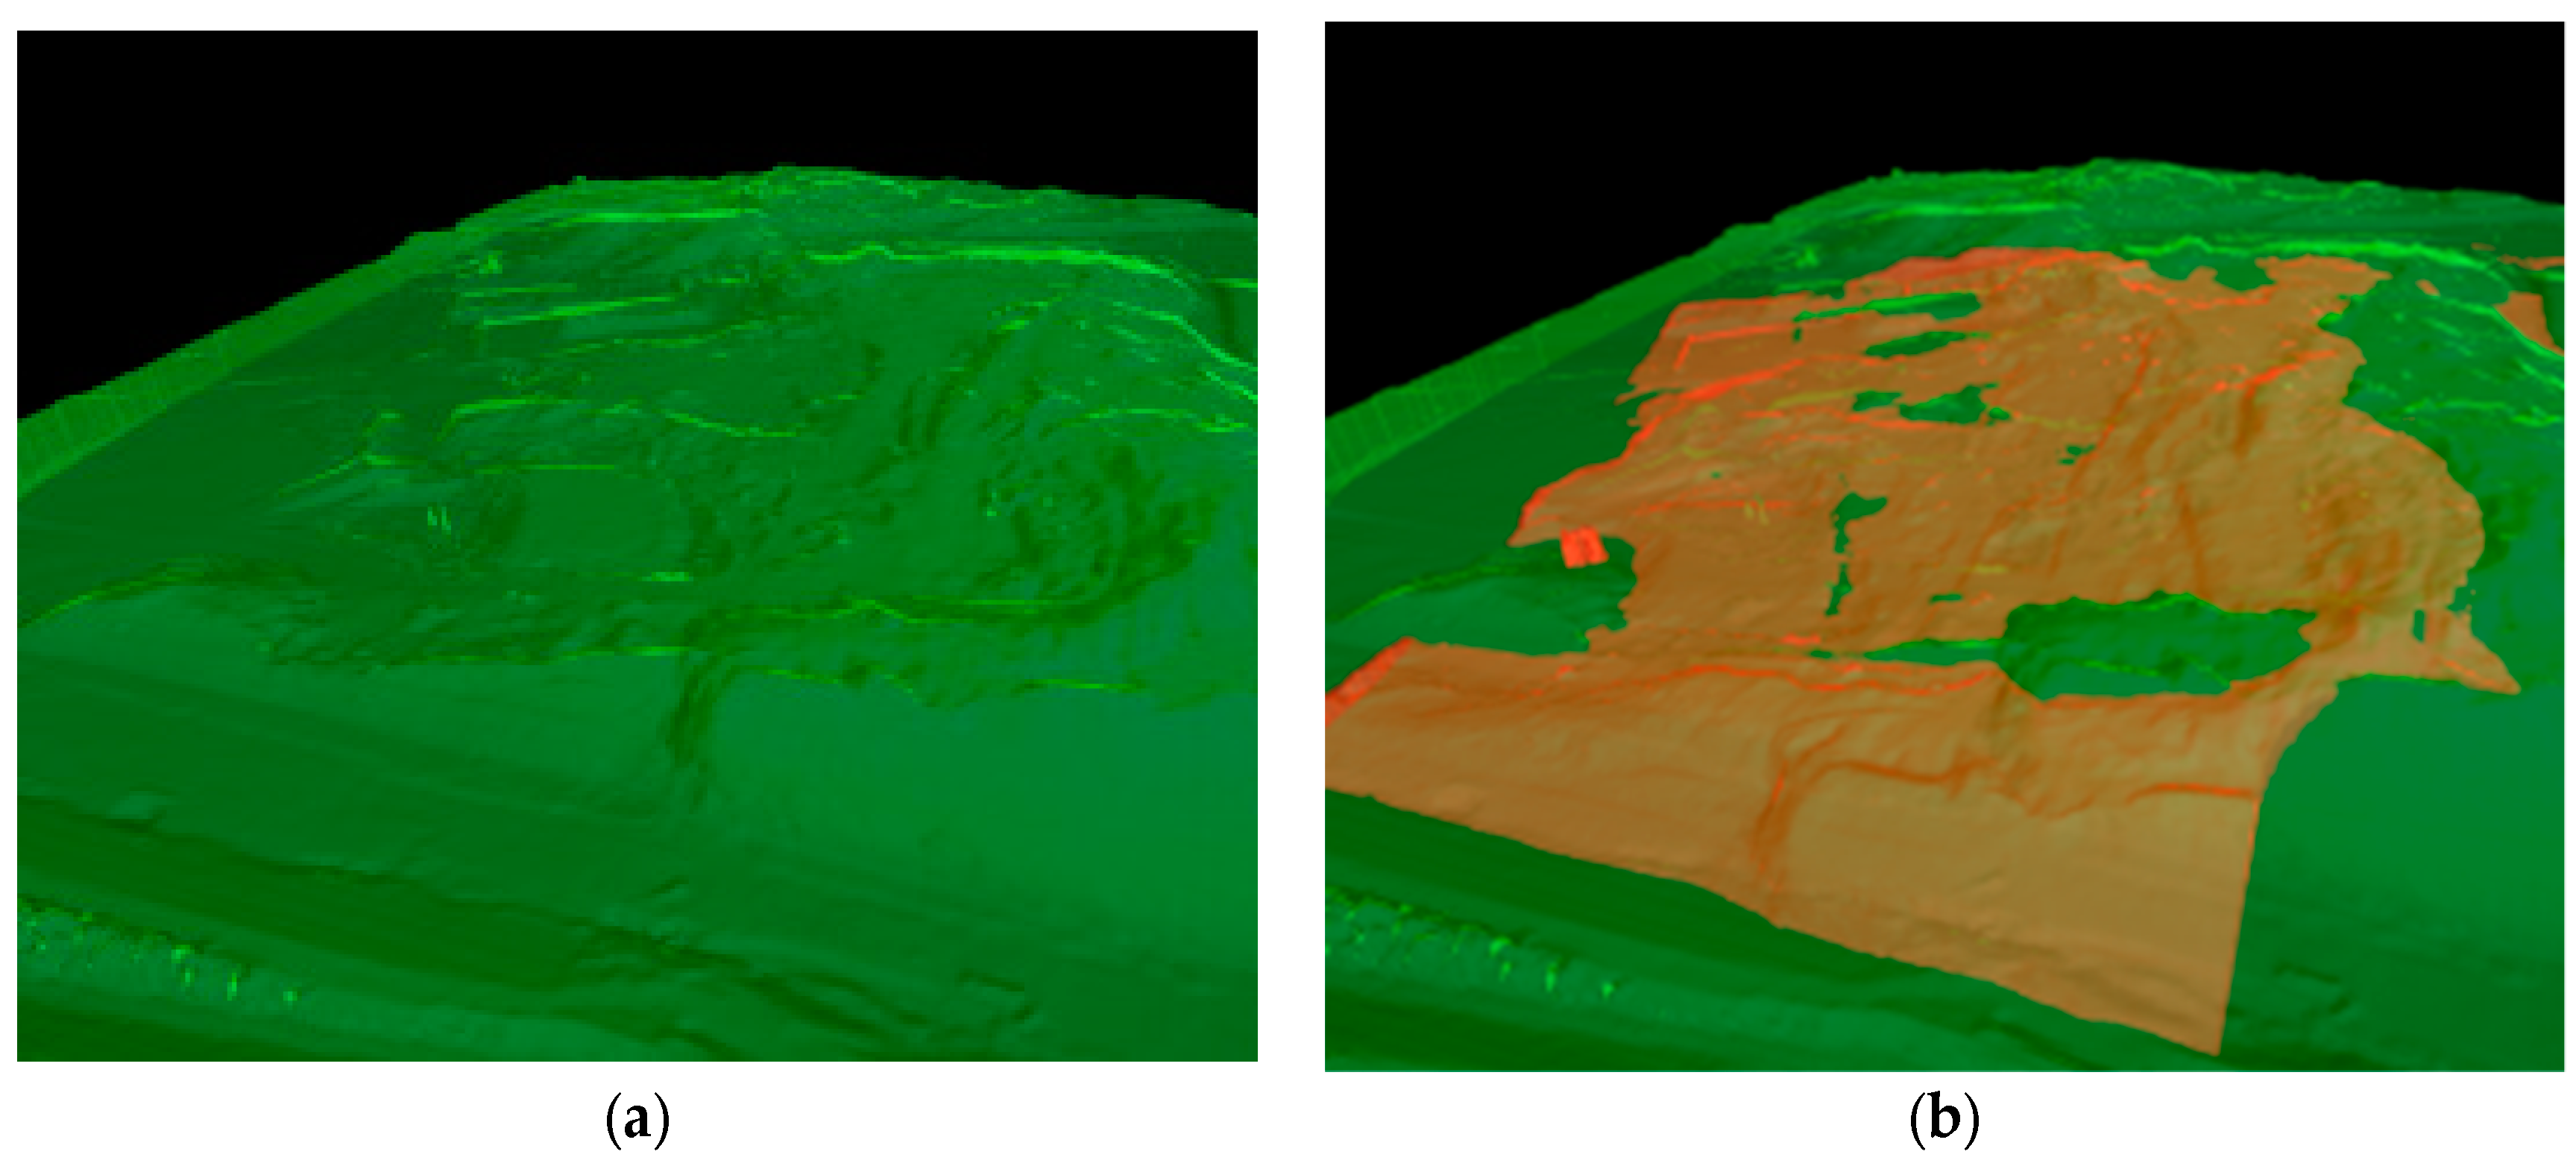
By using this calculation method, the volume difference between two 3D models from two different dates was calculated by dividing the 3D model into 3D square pillars. The size of the square pillar required for the calculation of the volume was 5 cm along the x and y axes. Figure 7 shows the earthwork volume calculation process using the date comparison conducted in this study.

4. Field Applicability

4.1. Test Design

4.1.1. Overview of the Test Site

To test the possibility of earthwork volume calculation using UAV, a large-scale development area was selected. The test site chosen in this study was a large-scale housing development project site at the S Construction Company located in Incheon, South Korea. After prior consultation with related agencies, some areas of the construction site were selected, and aerial photogrammetry were taken with a UAV. To identify the construction progress, which was the change in the earthwork volume, field measurements were performed twice for the same points on 13 October and 10 November 2020. The test site and field measurement conditions of the 3D-based earthwork volume calculation technology using UAV are summarized in Table 1 and Figure 8.

4.1.2. Field Survey and UAV Photogrammetry

The ground control points (GCPs) for on-site calibration were measured using UAV photography along with a field survey. The GCP measurement results are summarized in Figure 8. Points that could be used to optimize the UAV mapping were secured by selecting the target site for the earthwork volume calculation.
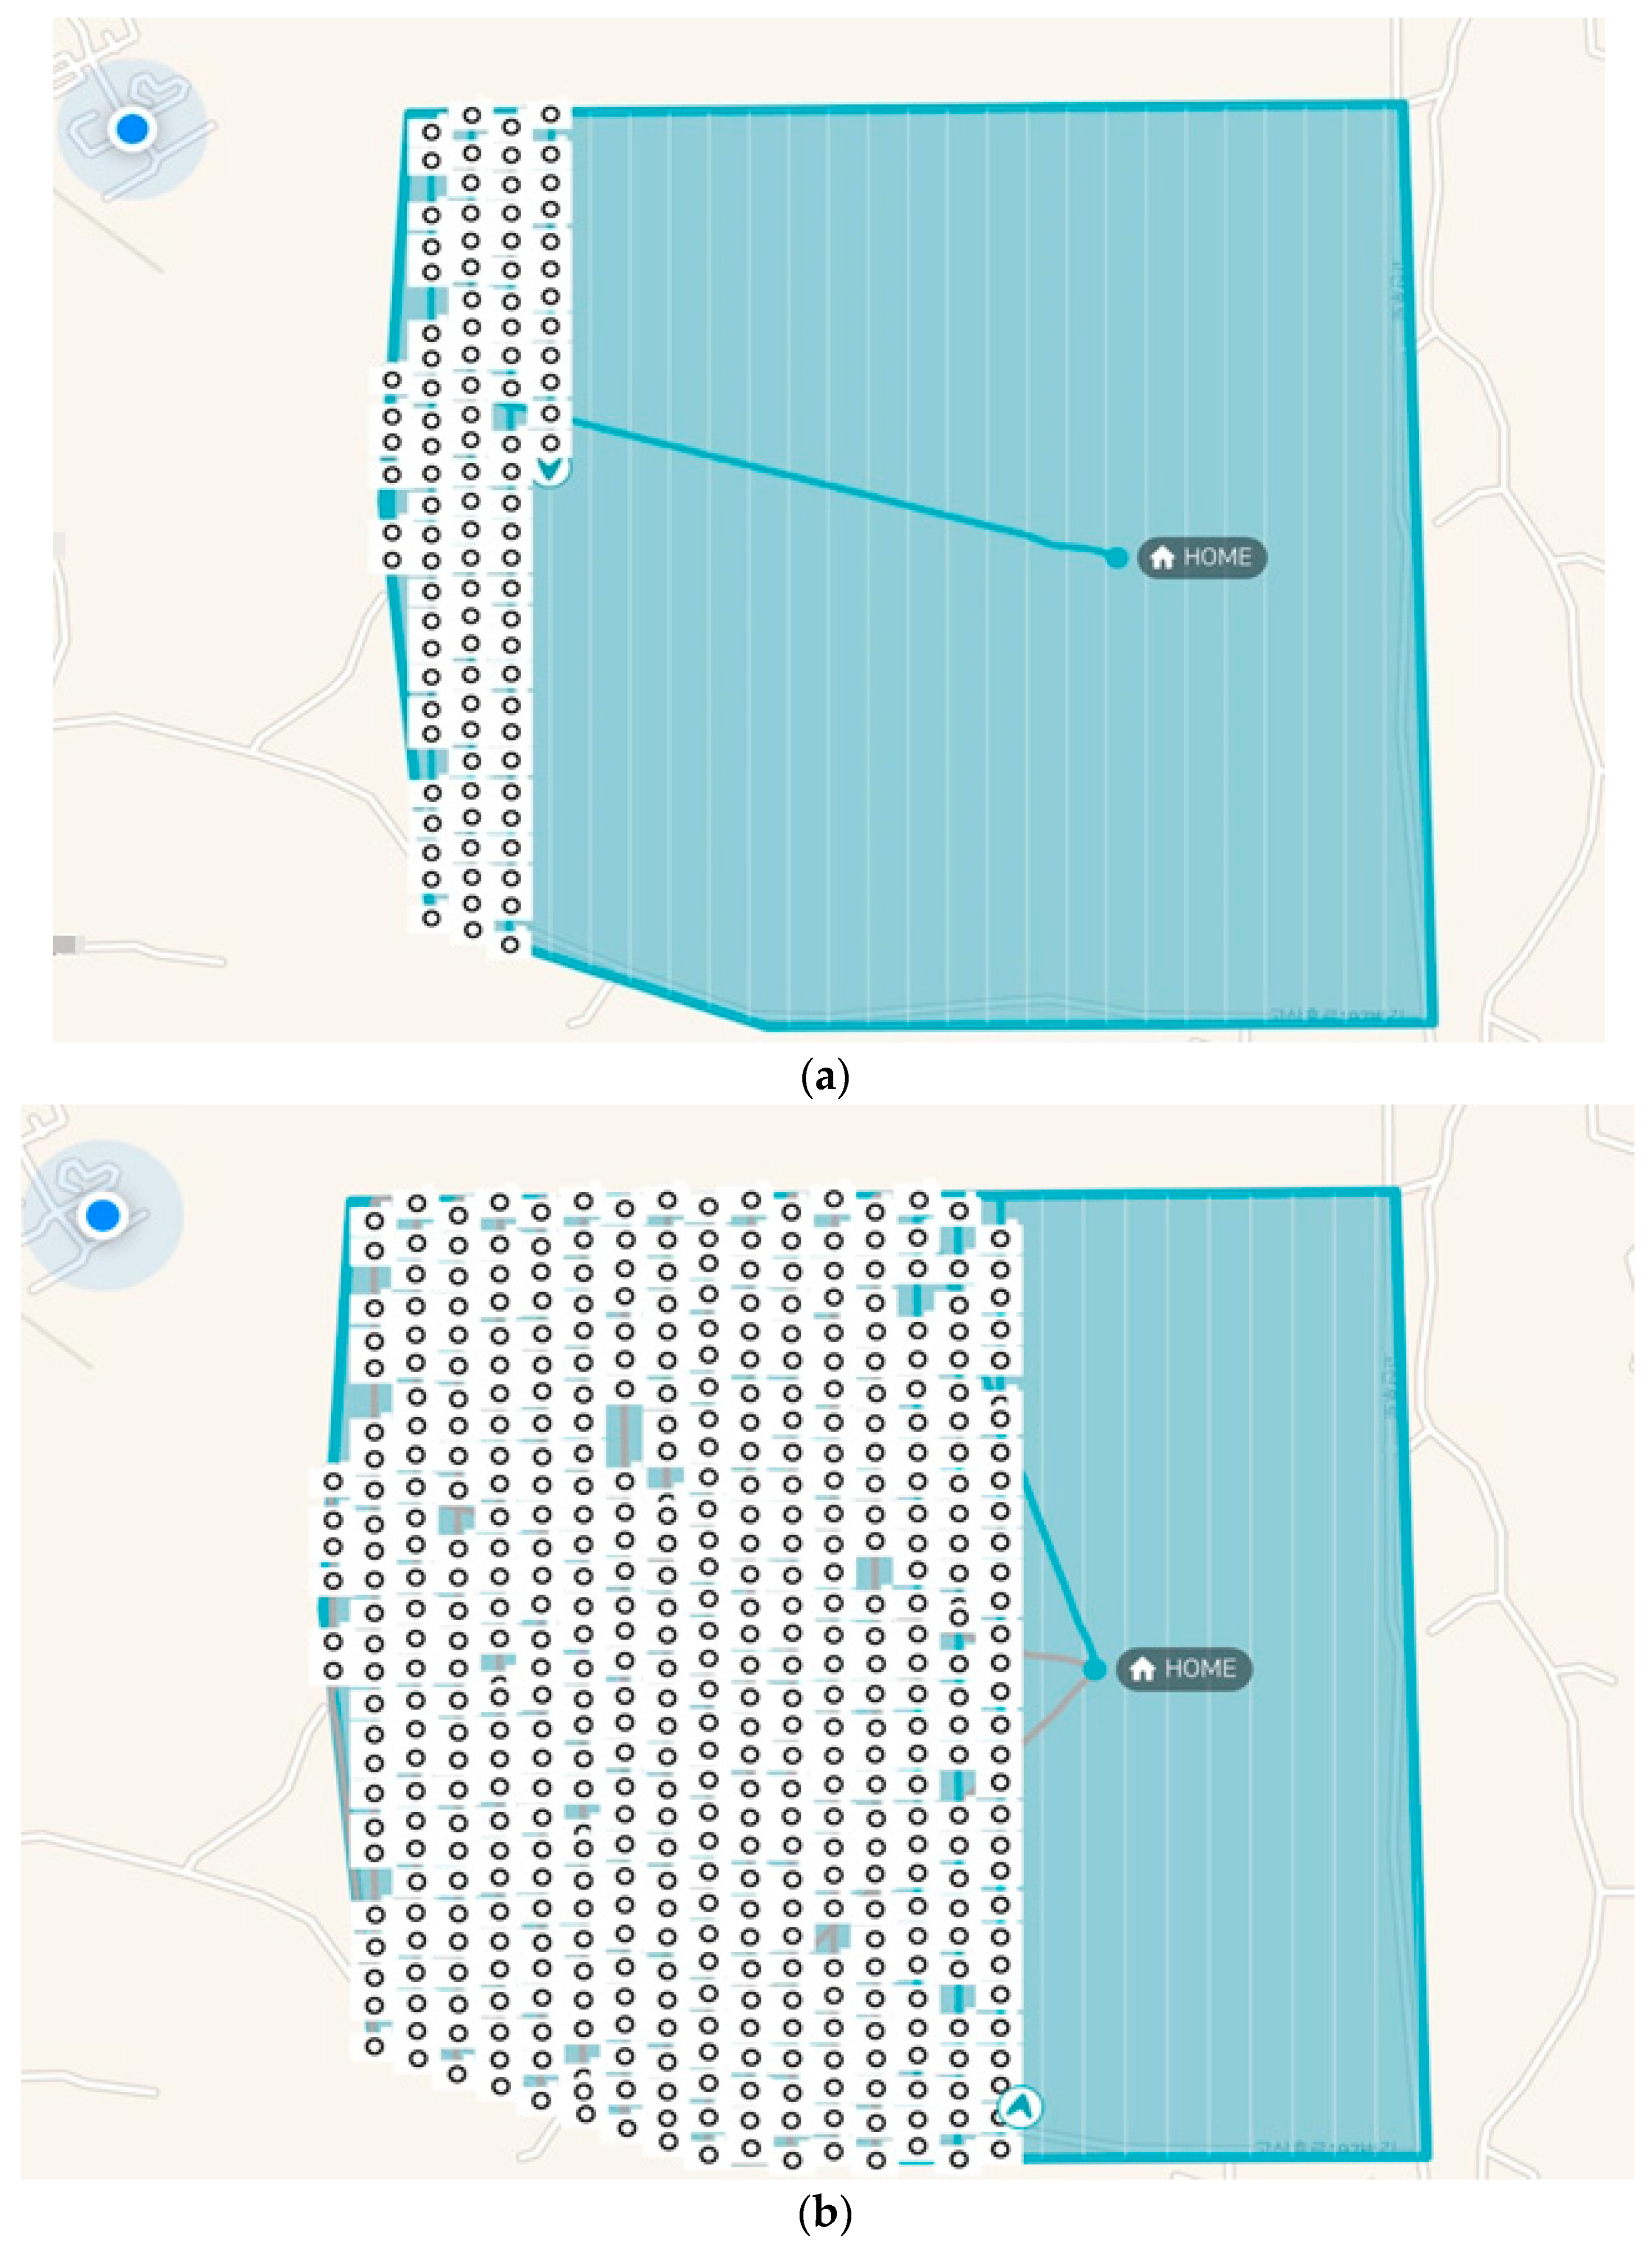
The site was aerial-photographed using a photogrammetric program with the earthwork volume data linking system and UAV photogrammetric program based on the BIM design described in Section 3.1. As shown in Figure 9, the route of the flight was selected, and the photogrammetric survey took 1 h and 15 min. The area photographed during this time was ~450,000 m2.
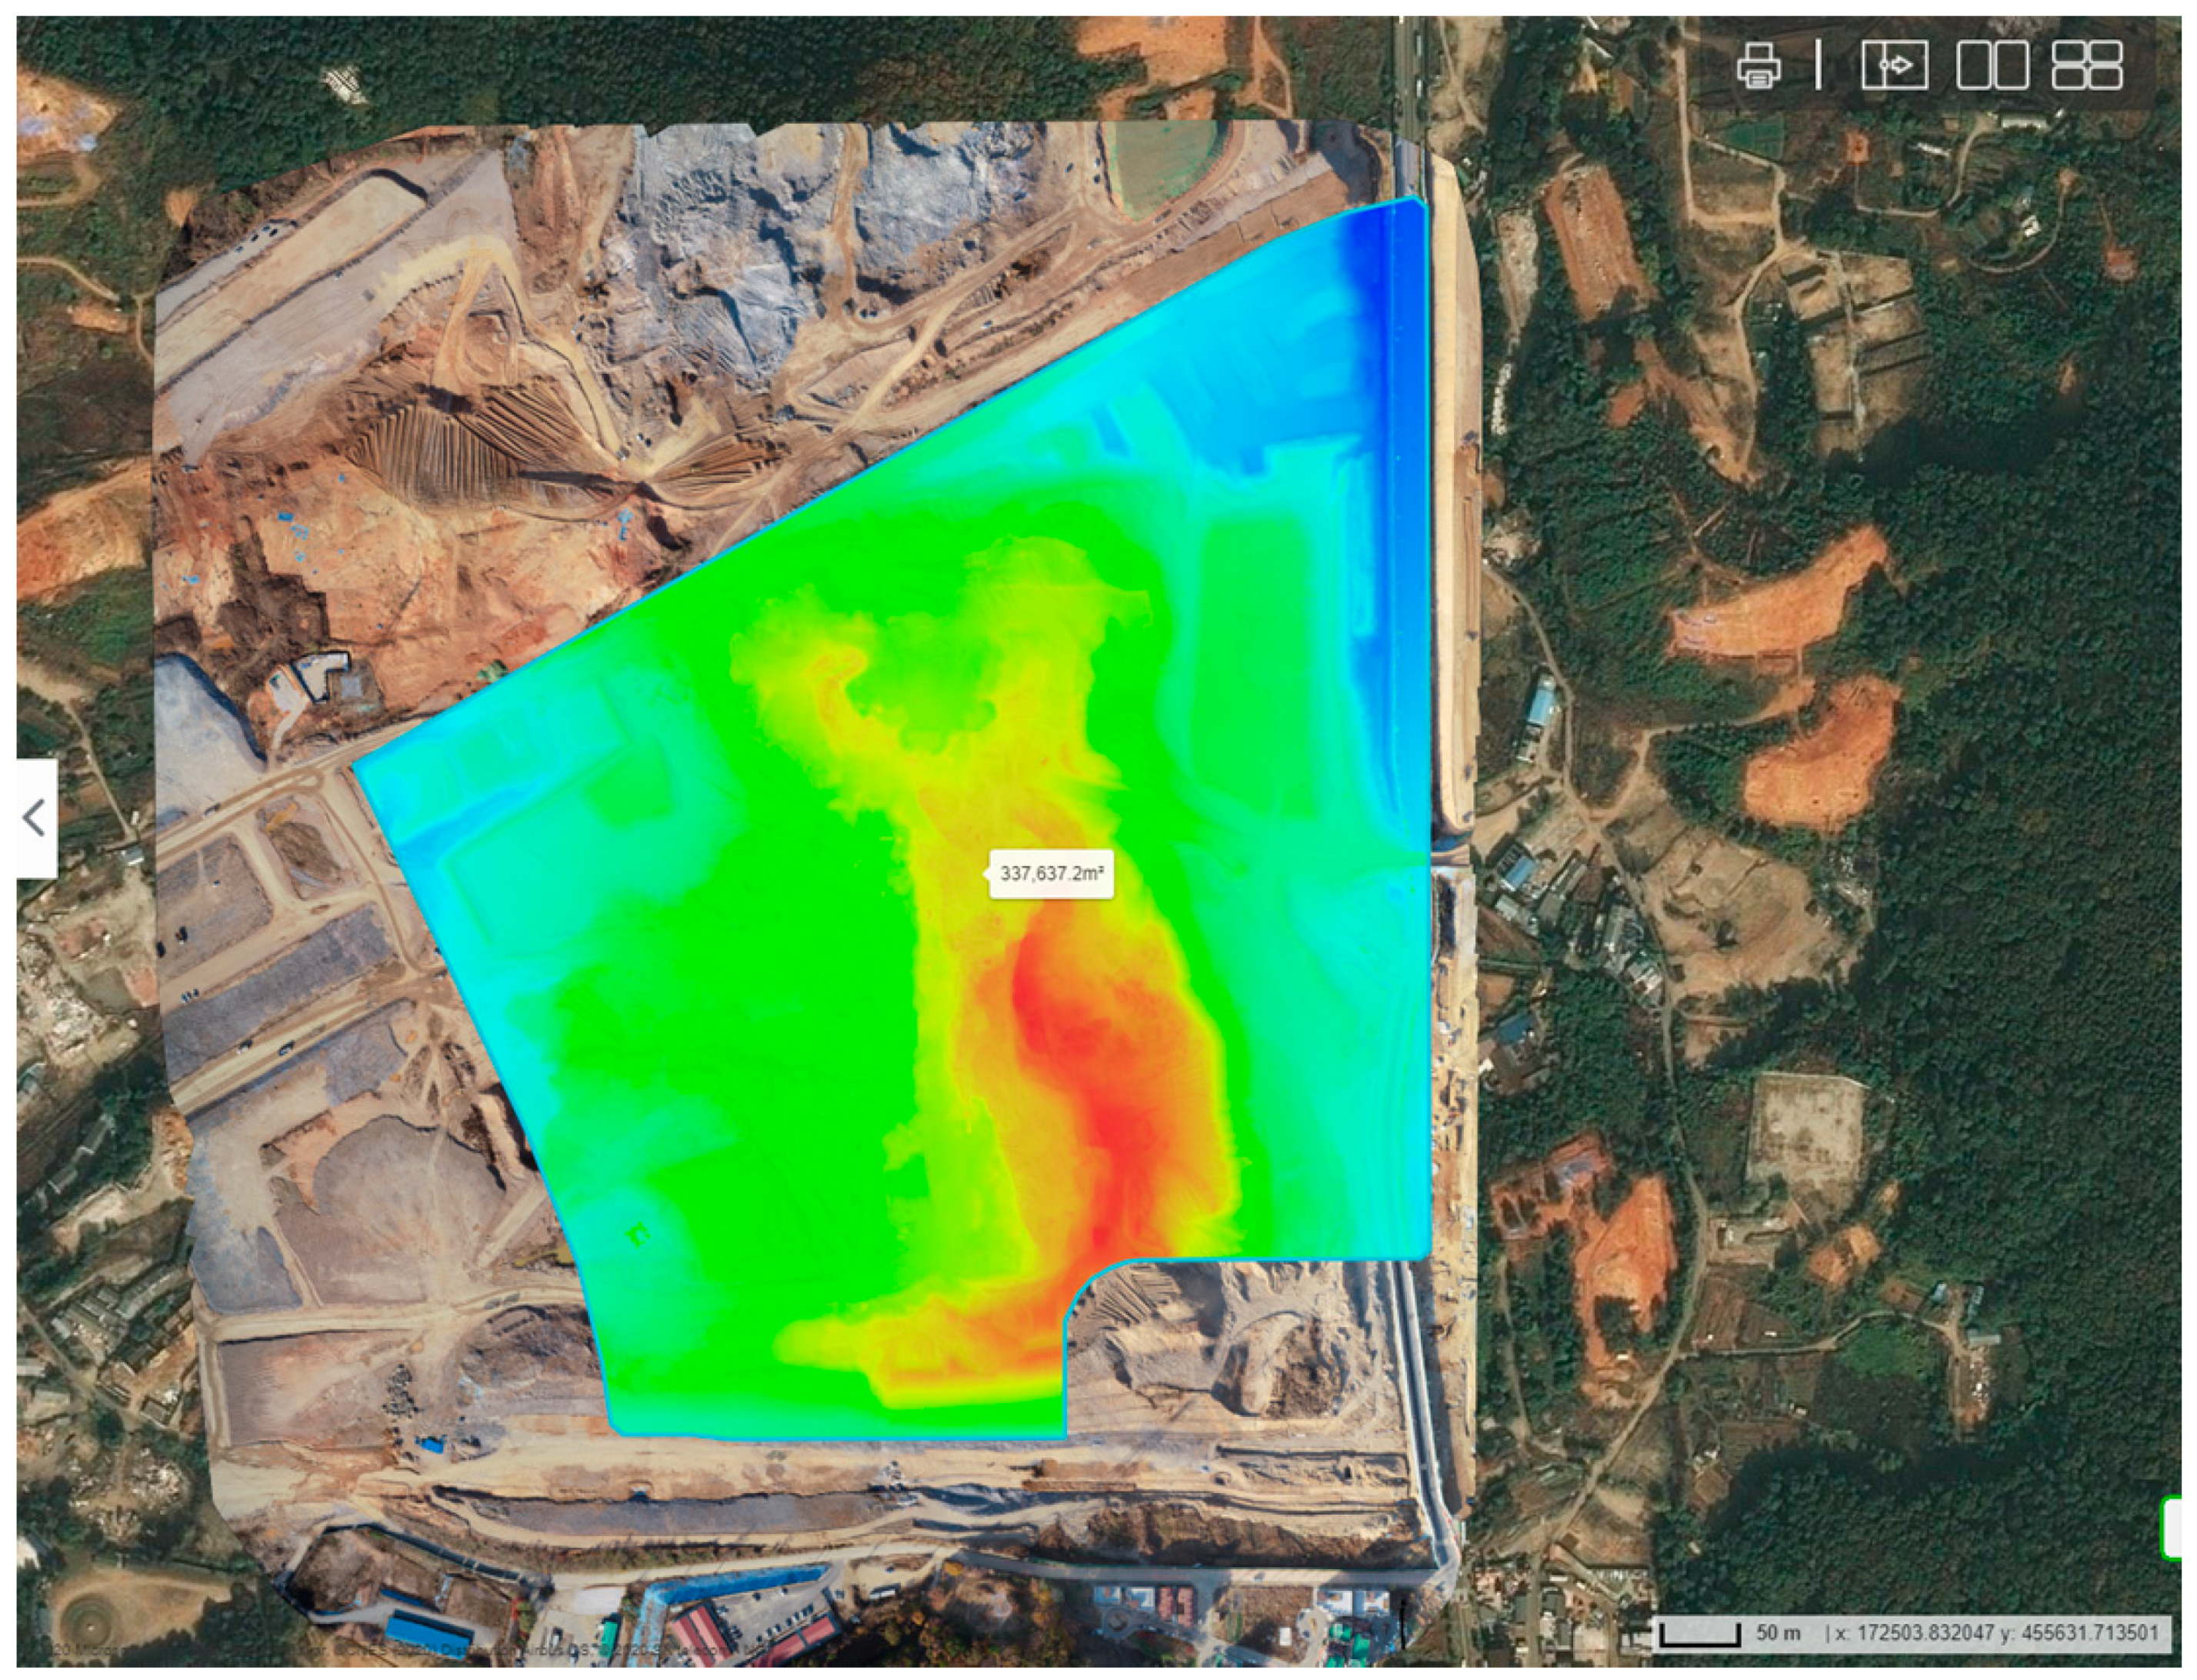
Furthermore, the site area used for the earthwork volume calculation in the total UAV photogrammetric area was 337,637 m2, as shown in Figure 10. This was set as the earthwork volume calculation area according to the design level.

4.2. Test Procedure and Application Method

4.2.1. Generation of the Conventional BIM Design Model

As shown in Figure 11, when the conventional BIM design model file is uploaded after changing it to the appropriate format, various services can be provided through a user interface. First, a function is provided to show the BIM design model, together with the DSM, which enables the user to simultaneously see the cross section at the desired location generated by the UAV photogrammetry superimposed over the cross section for the design level based on the BIM design model. Furthermore, it becomes possible to extract the images as universal drawing files that can be used in commercial CAD programs. In addition, the progress of the process can easily be seen at a glance by visualizing a 3D model generated by UAV photogrammetry with the BIM design model. However, it can be used limitedly in Autodesk Civil 3D or similar suits.

4.2.2. Acquisition of GCPs

To generate an accurate 3D model, calibration was performed using a GPS measuring instrument, as well as a GPS device embedded in the UAV. When the site was mapped using a UAV, seven GCPs were secured, as shown in Figure 12, and used for calibration.

4.2.3. Generation of 3D Point Clouds Using UAV

The internal parameters and detailed locations of the camera were calculated using the structure from motion method with the bundle adjustment technique from the latitude, longitude, altitude, and camera tilt of the images taken by the UAV.
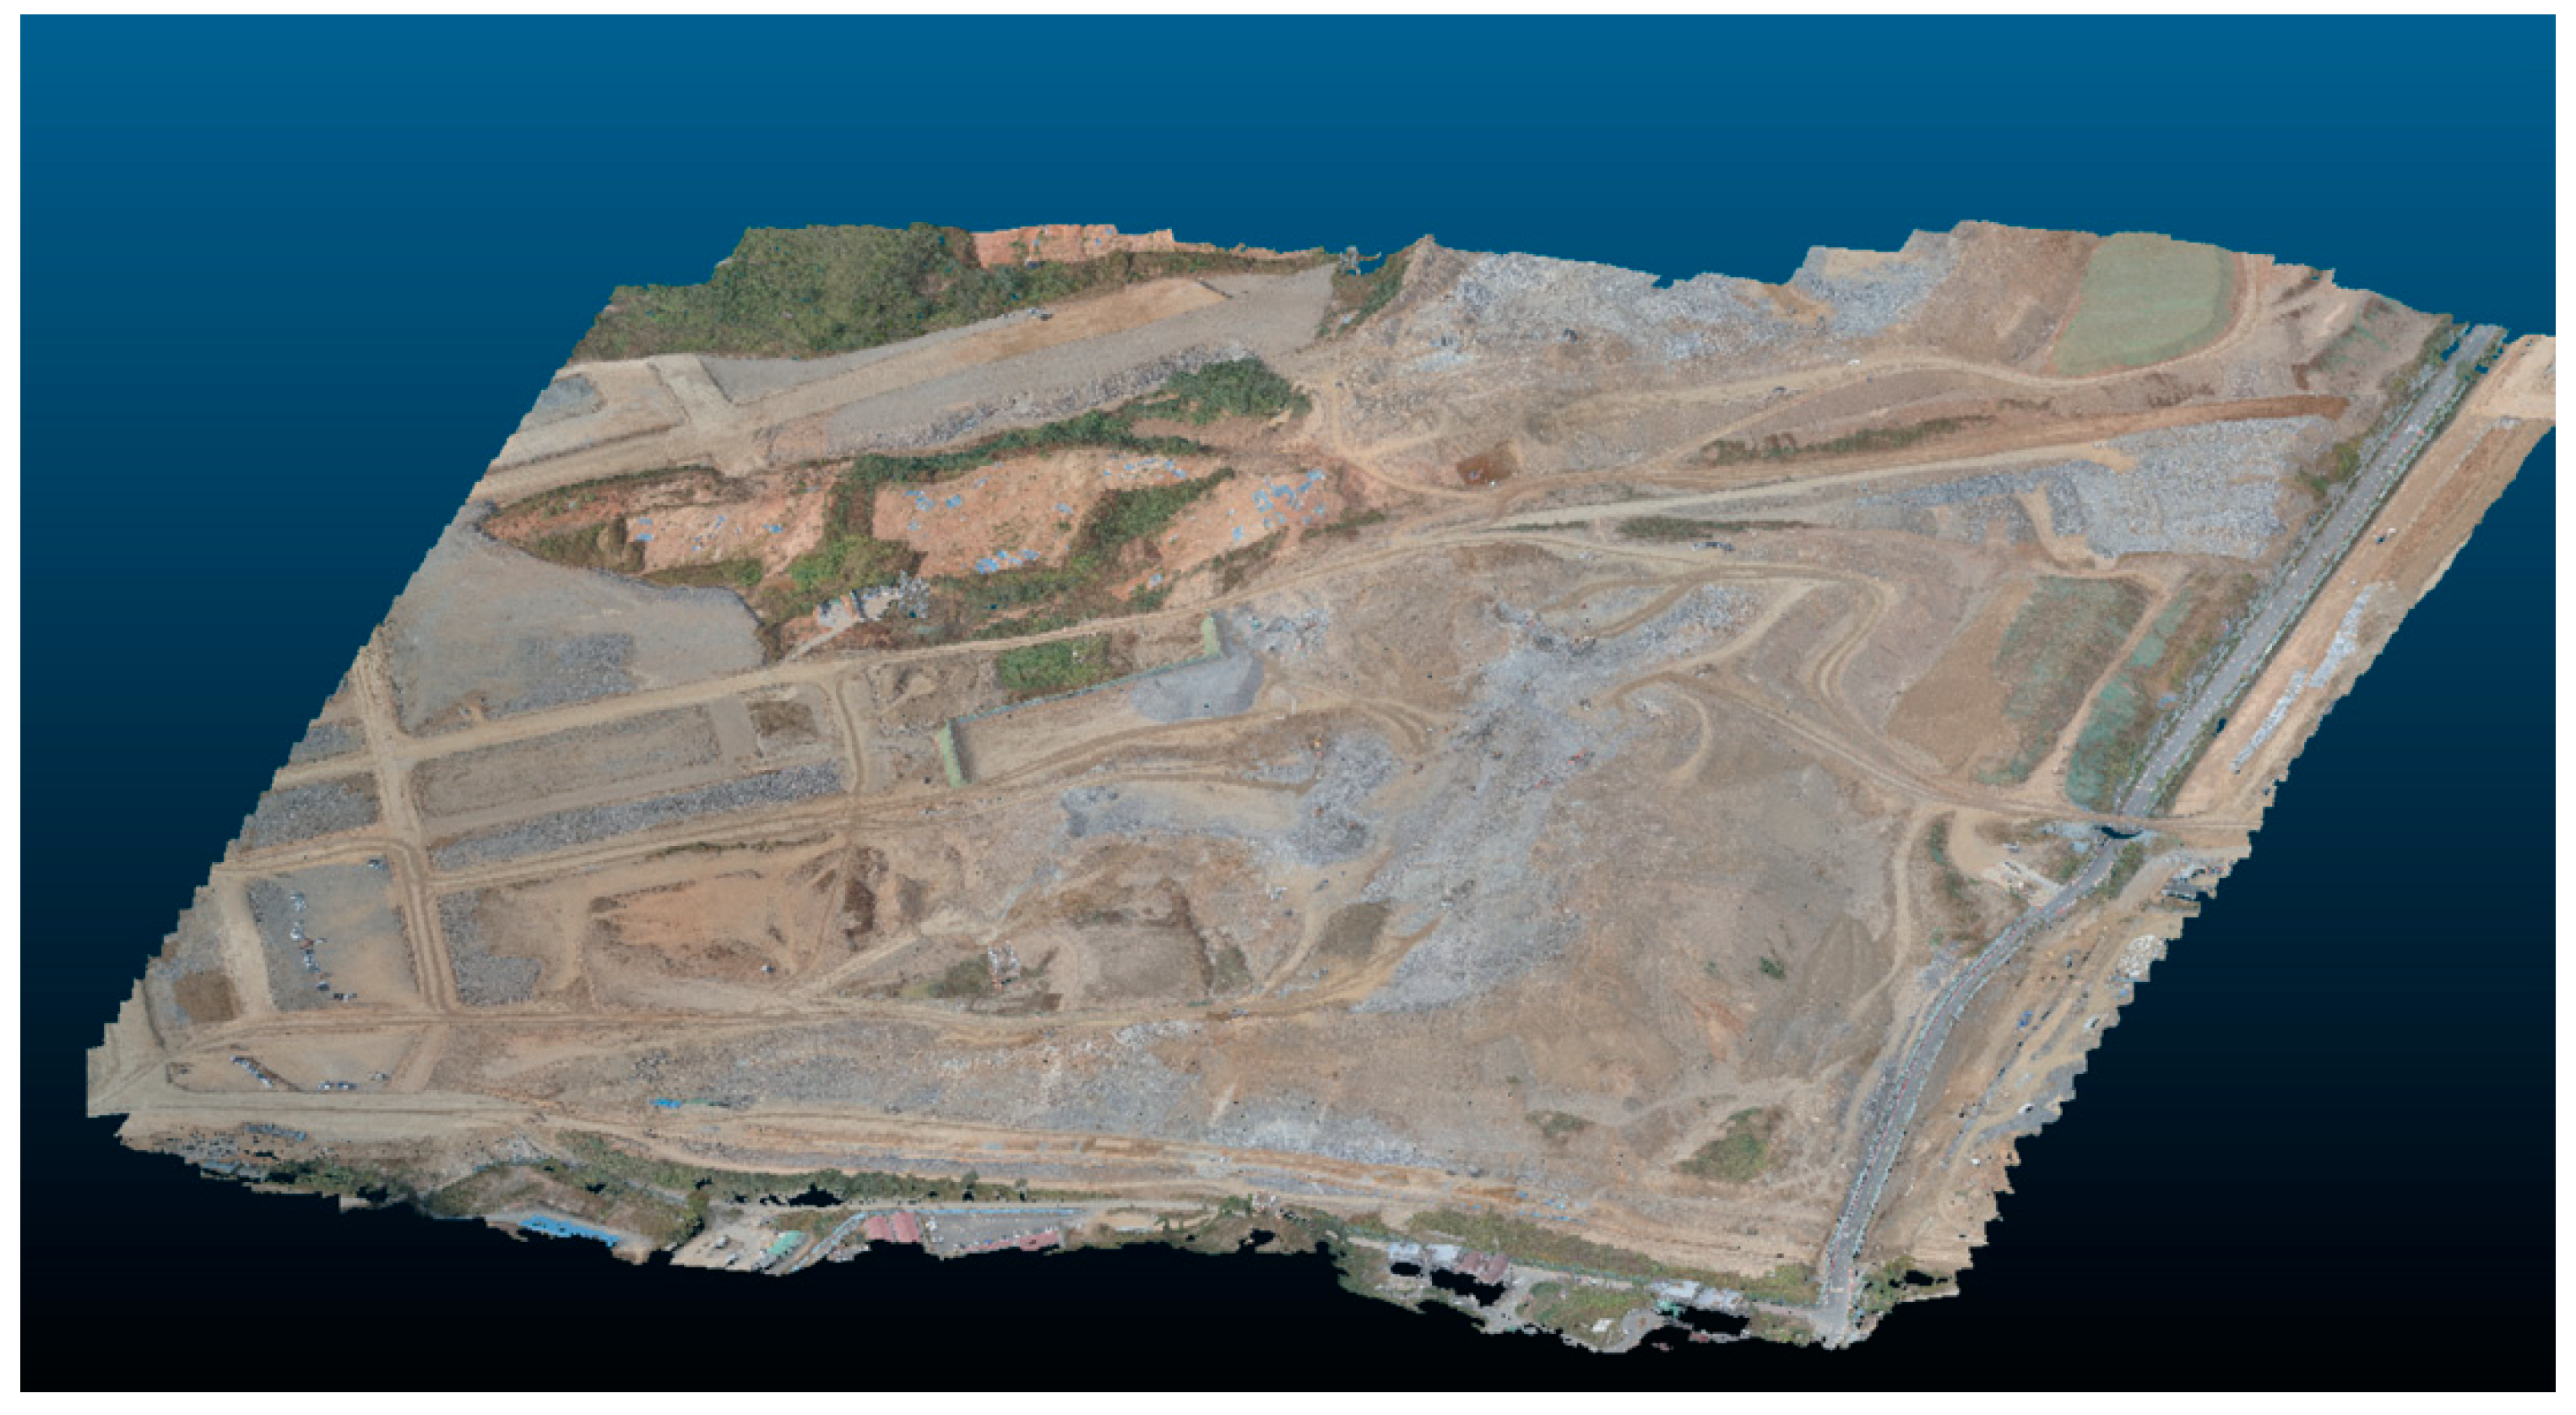
The point cloud data can be obtained by extracting the estimated camera position information and feature points of the image set from the results of the bundle adjustment. Figure 13 shows an image from which the outliers were removed by optimal values using a repeated trial-and-error method for the outliers that occurred in the point cloud data. The point cloud data were generated, as shown in Figure 14, using the camera position information obtained through the bundle adjustment of the depth map obtained from each image.

4.2.4. DSM Generation

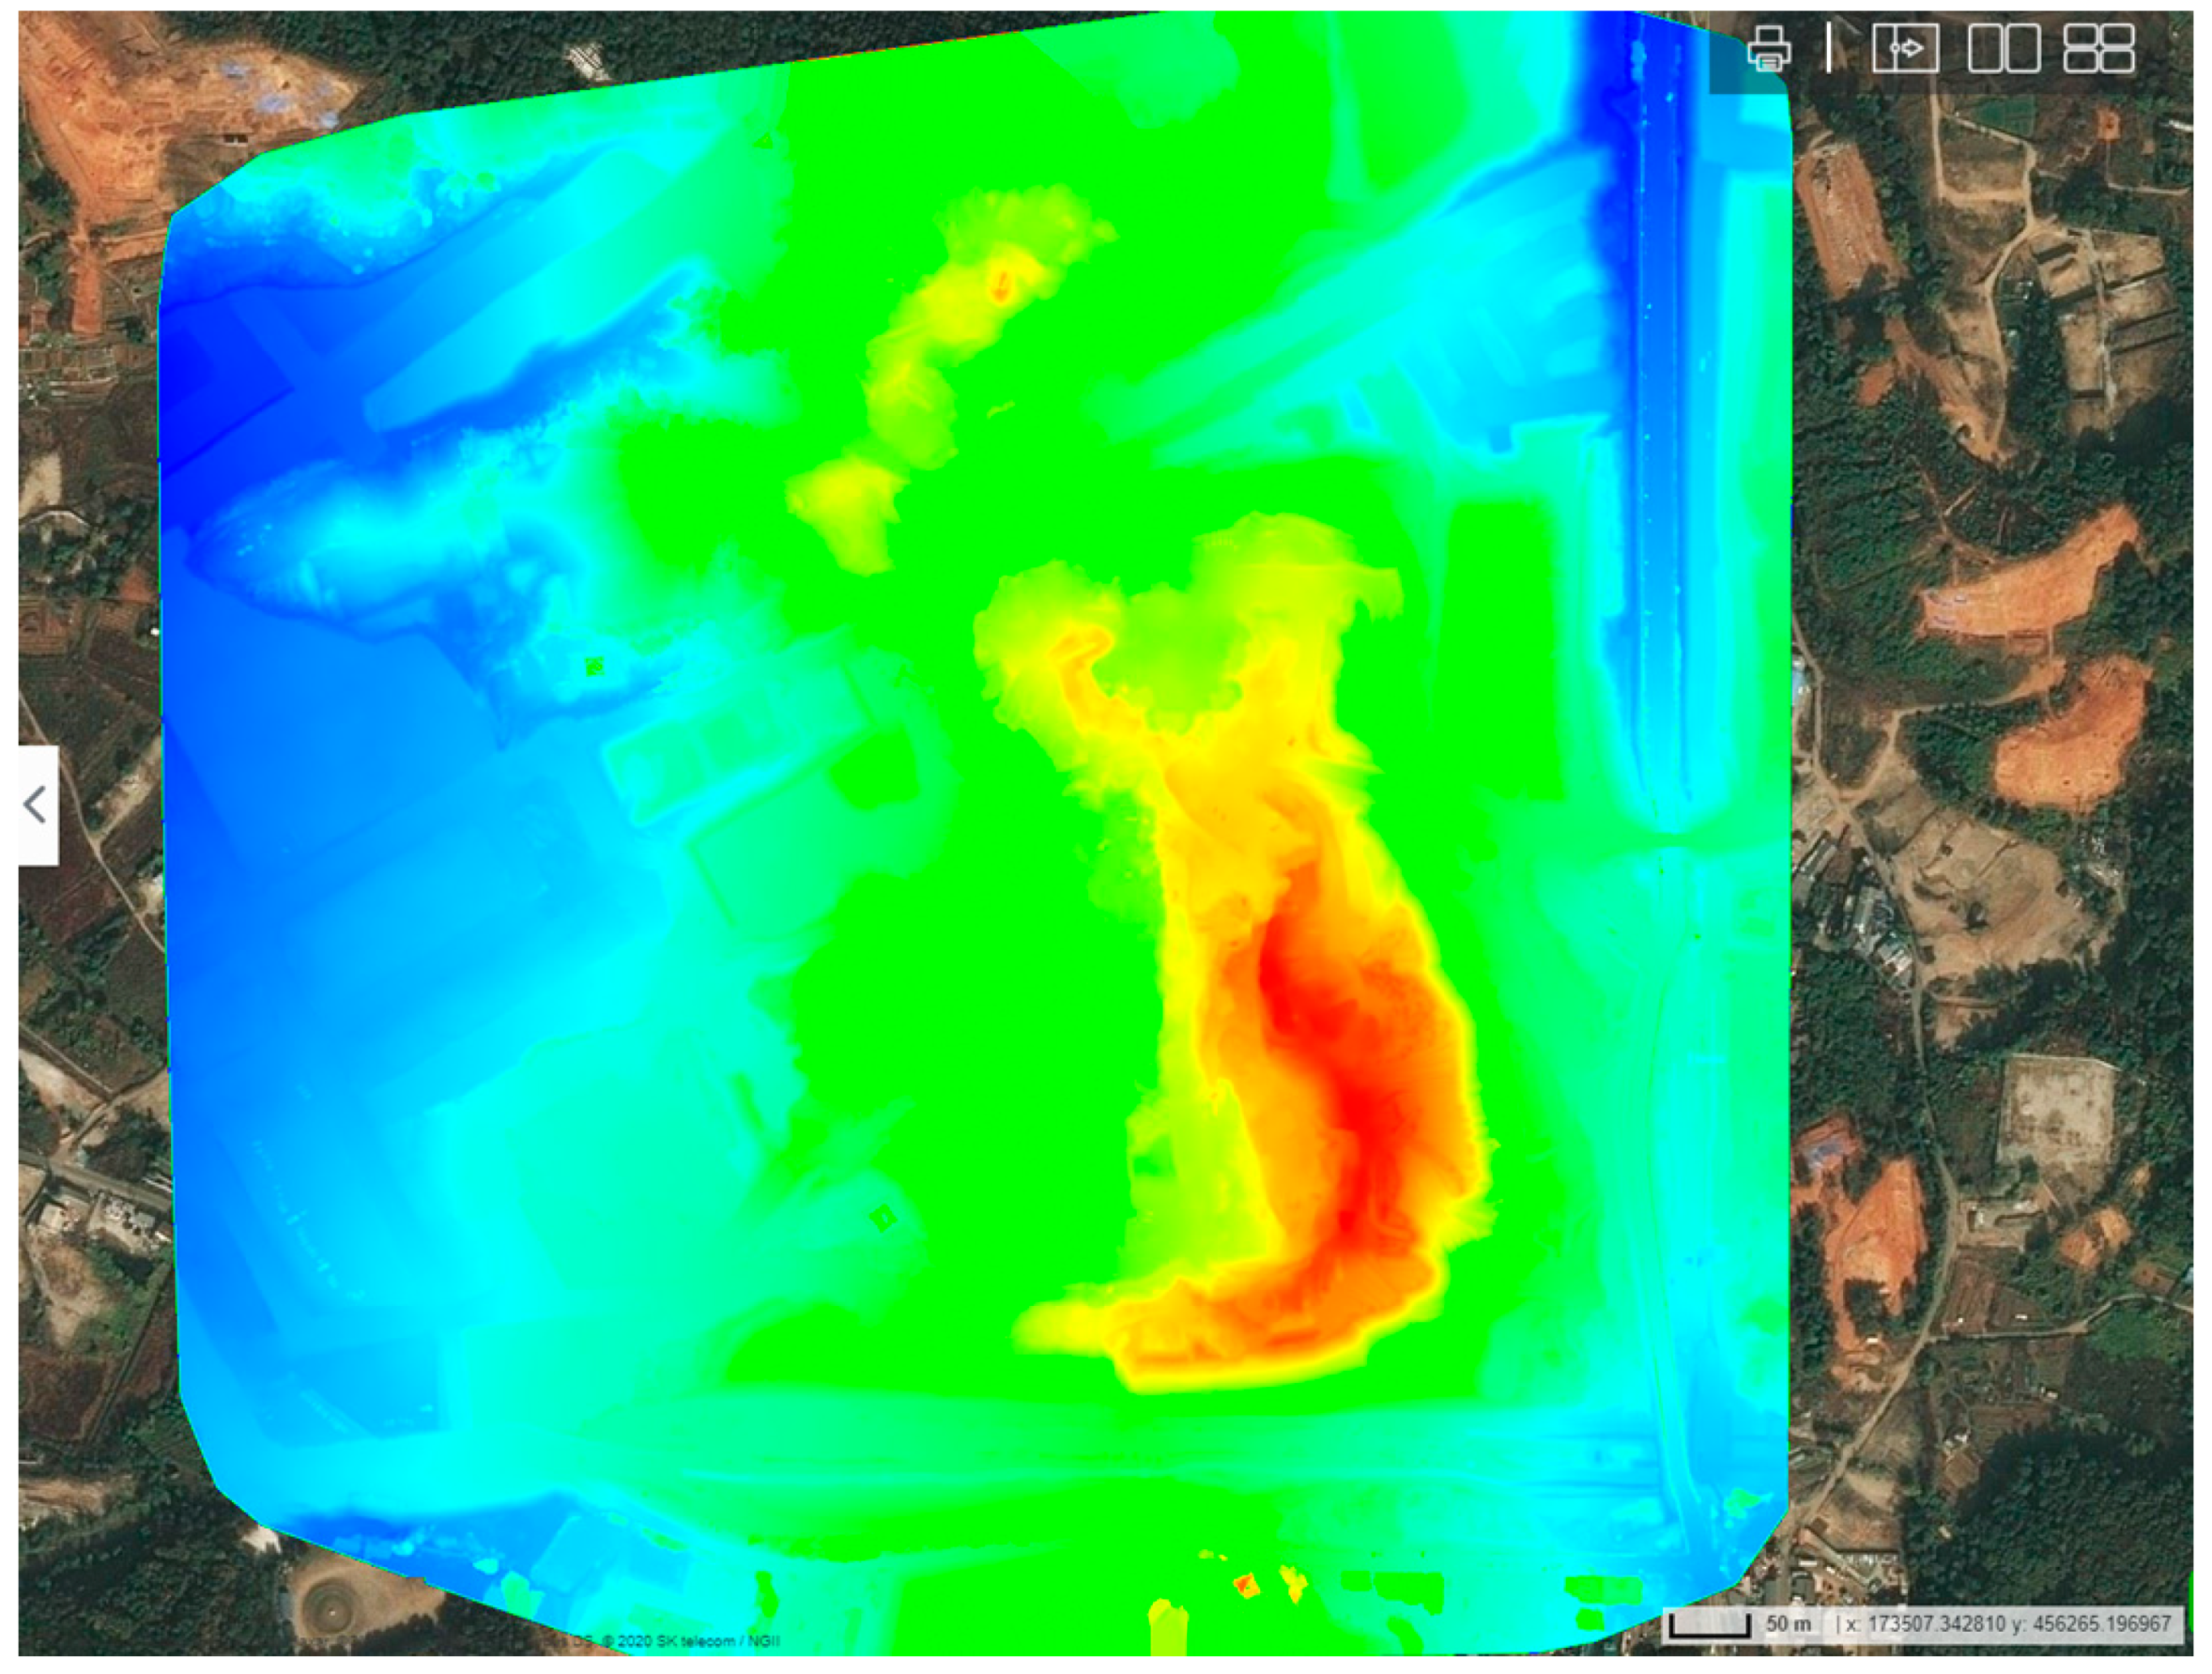
A DSM was generated from the 3D point clouds generated by applying the coordinate system and coordinate values of the planned plane map at the site (see Figure 14).
A DSM is a raster image file with a special format that stores the z value for the position of each pixel. Furthermore, because the DSM uses the coordinate system for the site, the 3D model also uses the coordinate system and coordinate values. Therefore, it is possible to generate a 3D model that can be visualized in three dimensions, as shown in Figure 15, by reducing the z values of the model pixels of the DSM to 3D values on the coordinate system of the corresponding DSM.

4.2.5. Matching with Planned Plane Map Coordinates

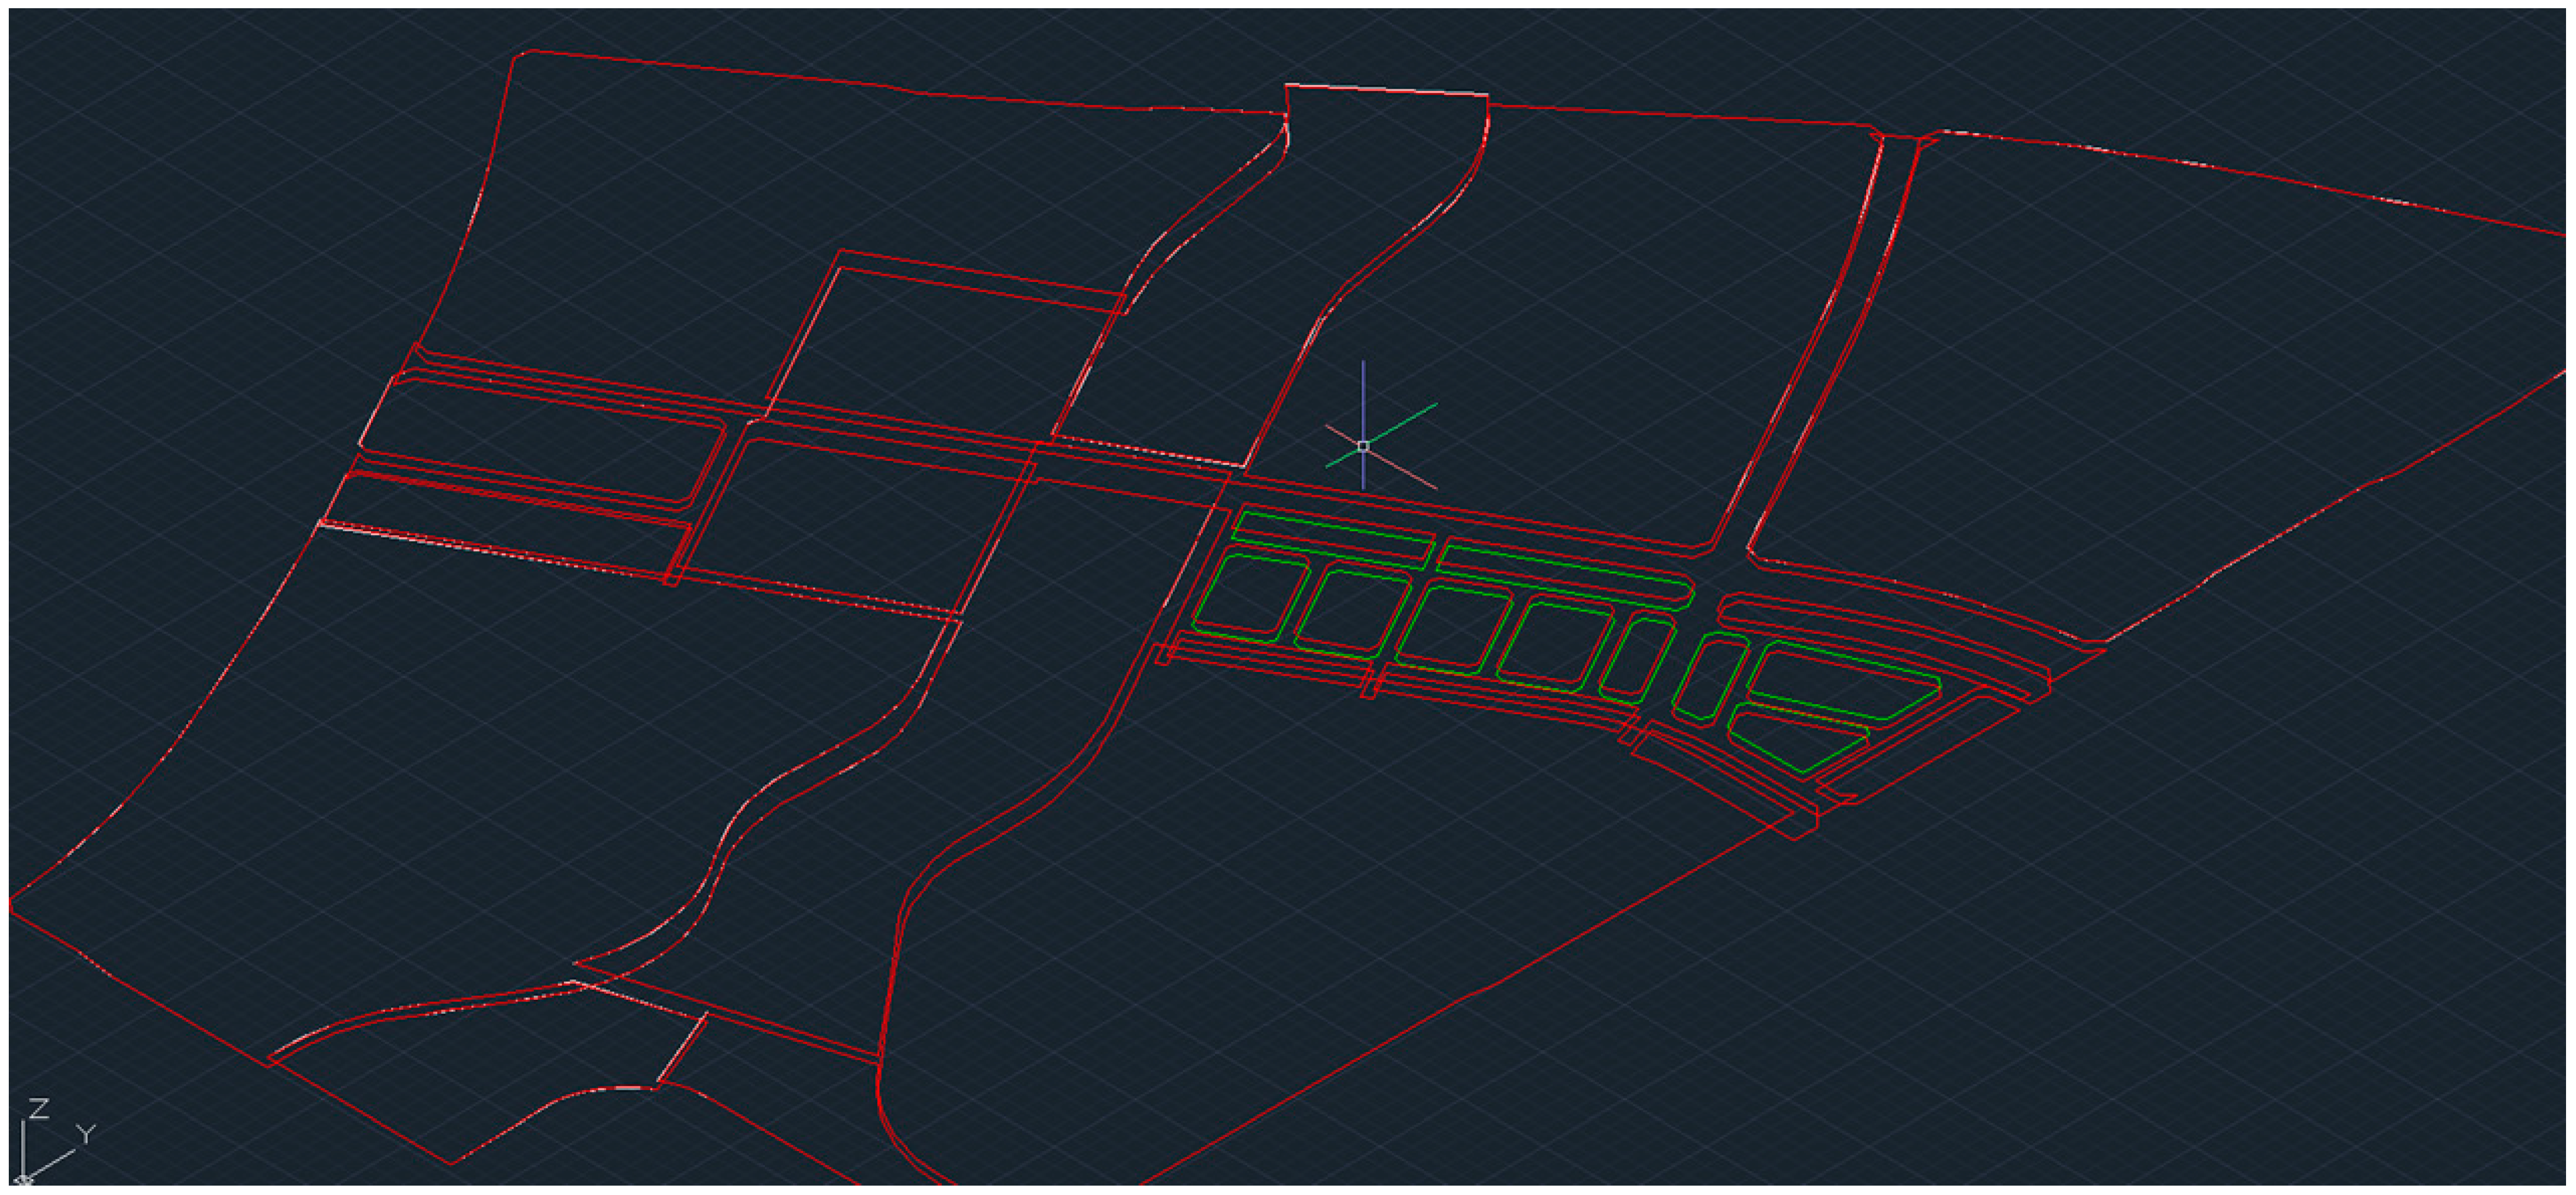
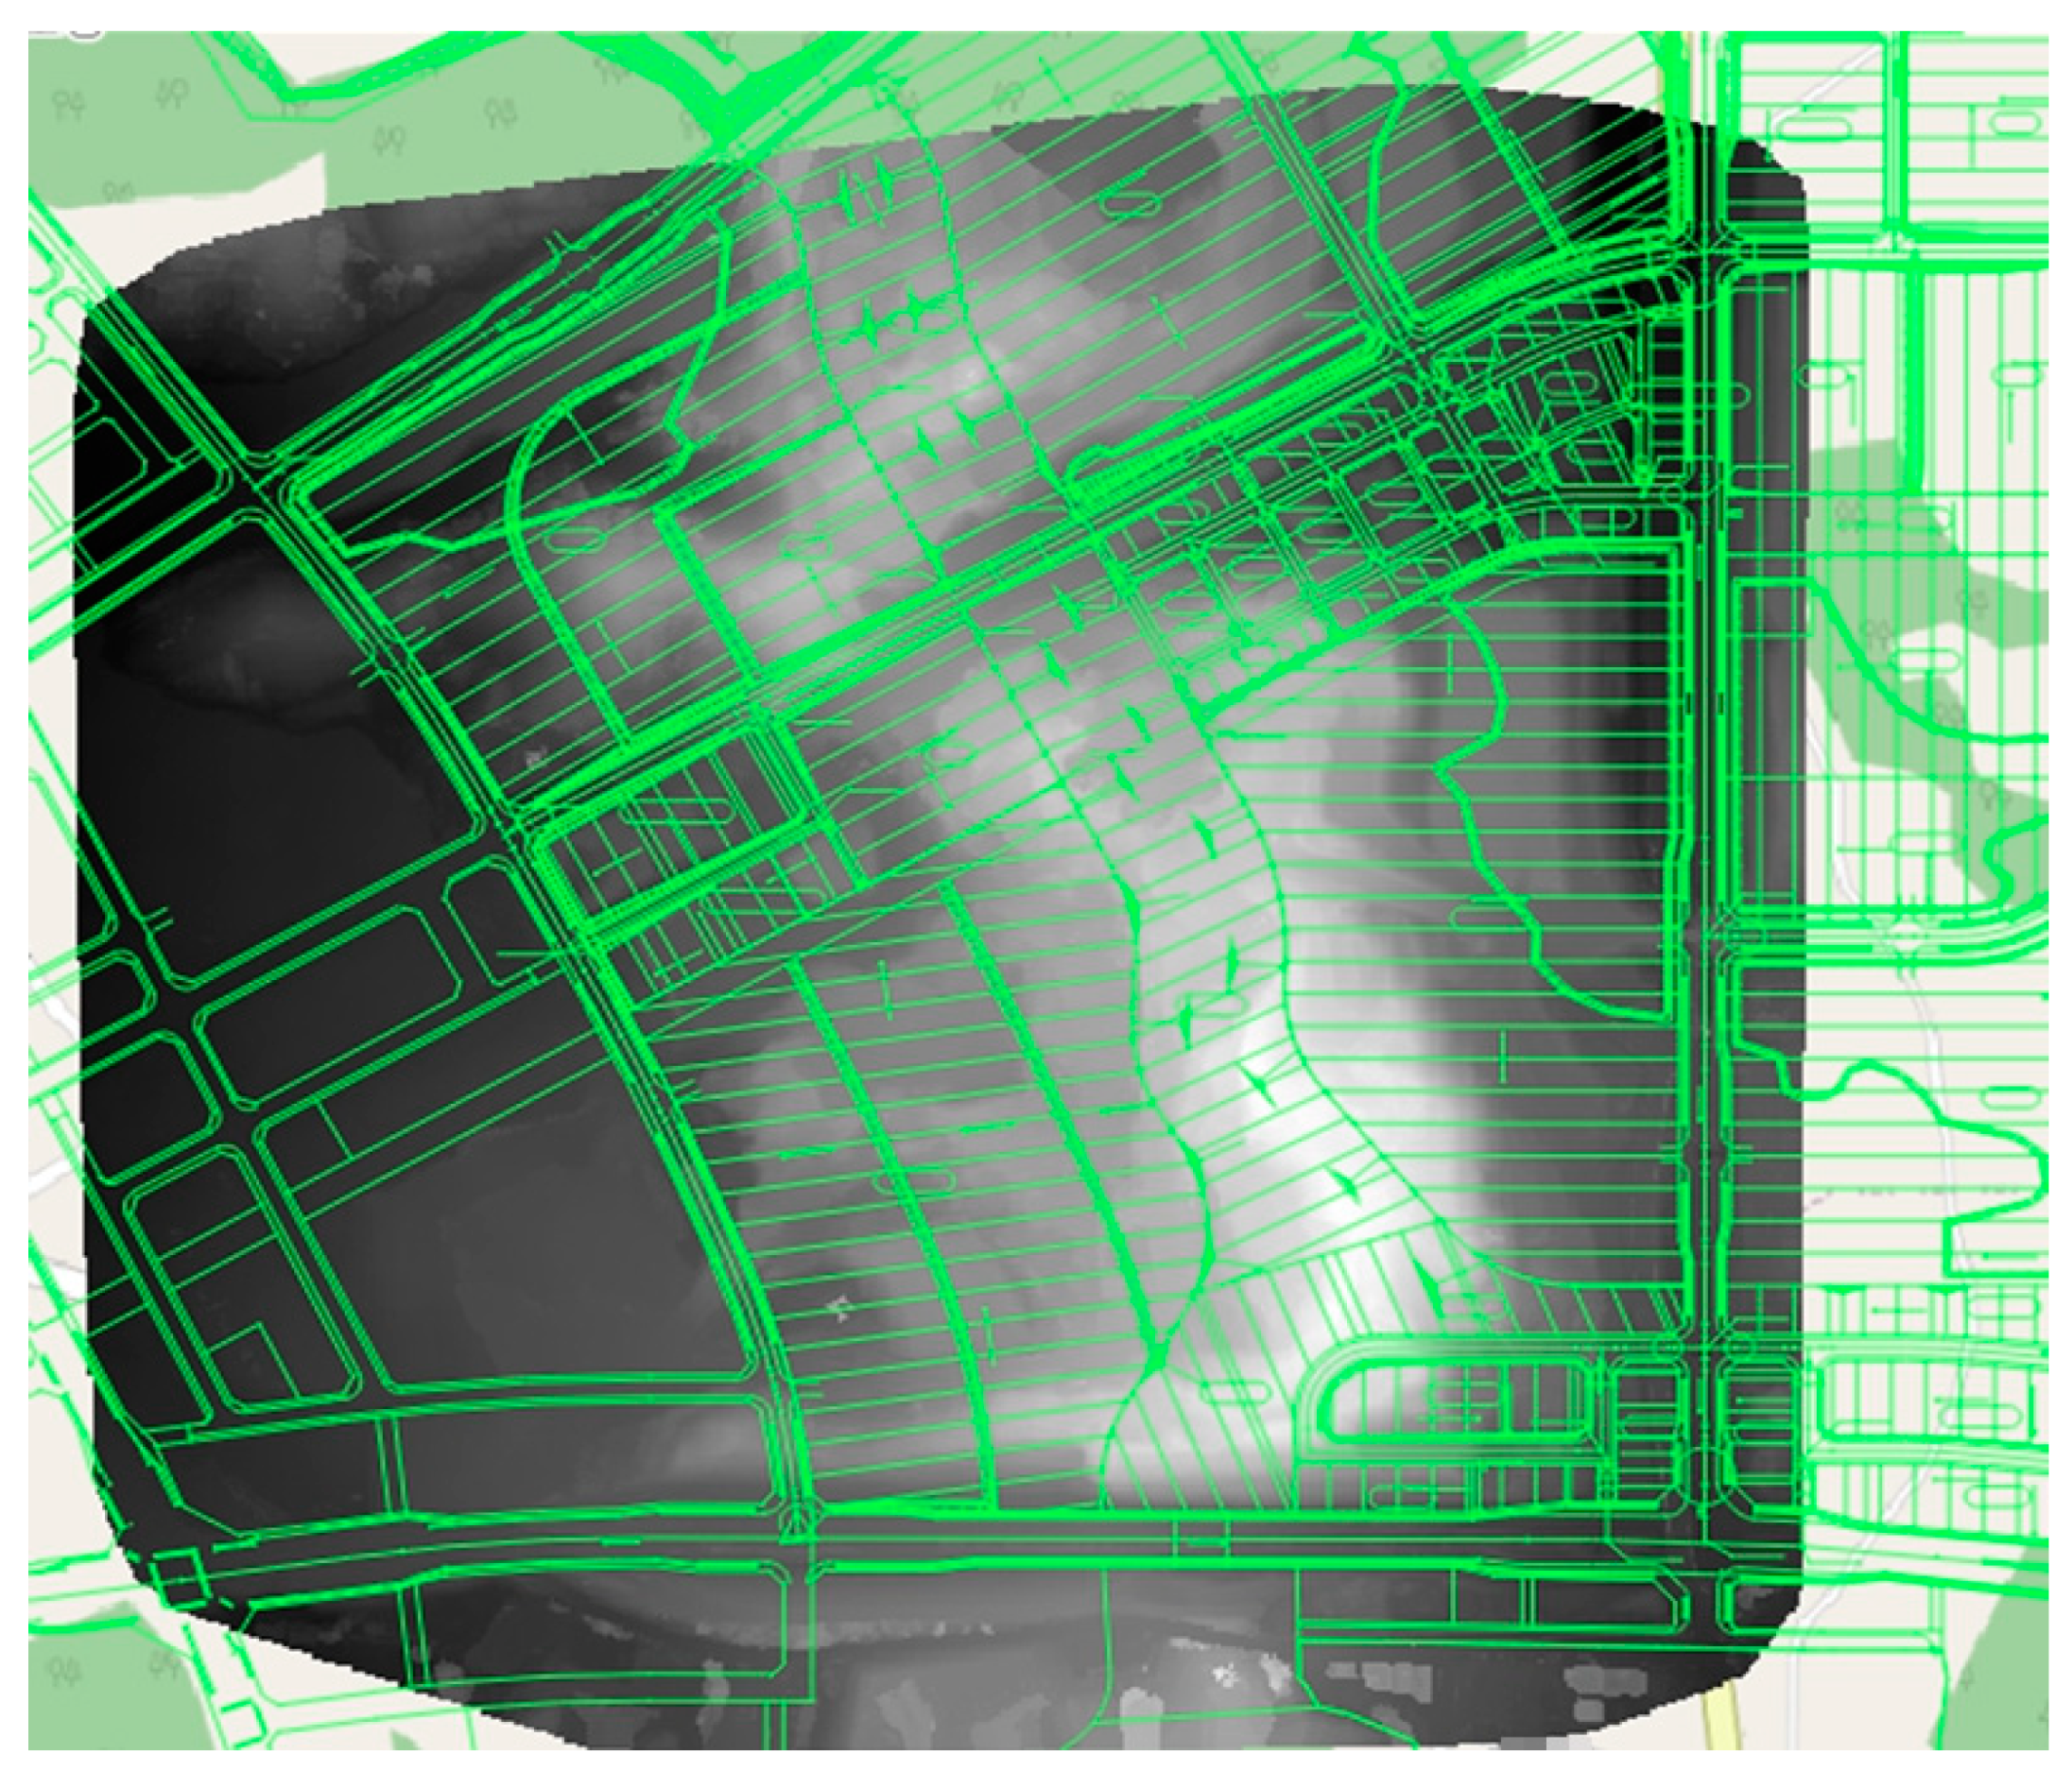
This task is the process for comparing the line-form 3D model generated with a DSM of 3D point cloud data previously collected and generated as shown above. It entails matching the drawing information with the position information by matching the control points with the coordinates on the planned plane map. For this task, the coordinates of the planned plane map were read and accurately matched with the DSM, as shown in Figure 16.
The coordinate information for the measuring instrument used for the status survey to match the planned plane map to the DSM is given in Box 1.
Box 1. Coordinates of the measuring instrument used for the status survey.
PROJCS [“Korean 1985/Modified Central Belt”,
  GEOGCS [“Korean 1985”,
    DATUM [“Korean_Datum_1985”,
      SPHEROID [“Bessel 1841”,6377397.155,299.1528128,
        AUTHORITY [“EPSG”,“7004”]],
      AUTHORITY [“EPSG”,“6162”]],
    PRIMEM [“Greenwich”,0,
      AUTHORITY [“EPSG”,“8901”]],
    UNIT [“degree”,0.0174532925199433,
      AUTHORITY [“EPSG”,“9122”]],
    AUTHORITY [“EPSG”,“4162”]],
  PROJECTION [“Transverse_Mercator”],
  PARAMETER [“latitude_of_origin”,38],
  PARAMETER [“central_meridian”,127.0028902777778],
  PARAMETER [“scale_factor”,1],
  PARAMETER [“false_easting”,200,000],
  PARAMETER [“false_northing”,500,000],
  UNIT [“metre”,1,
    AUTHORITY [“EPSG”,“9001”]],
  AUTHORITY [“EPSG”,“5174”]]

4.2.6. Extraction of the Site Cross Section from the Planned Plane Map

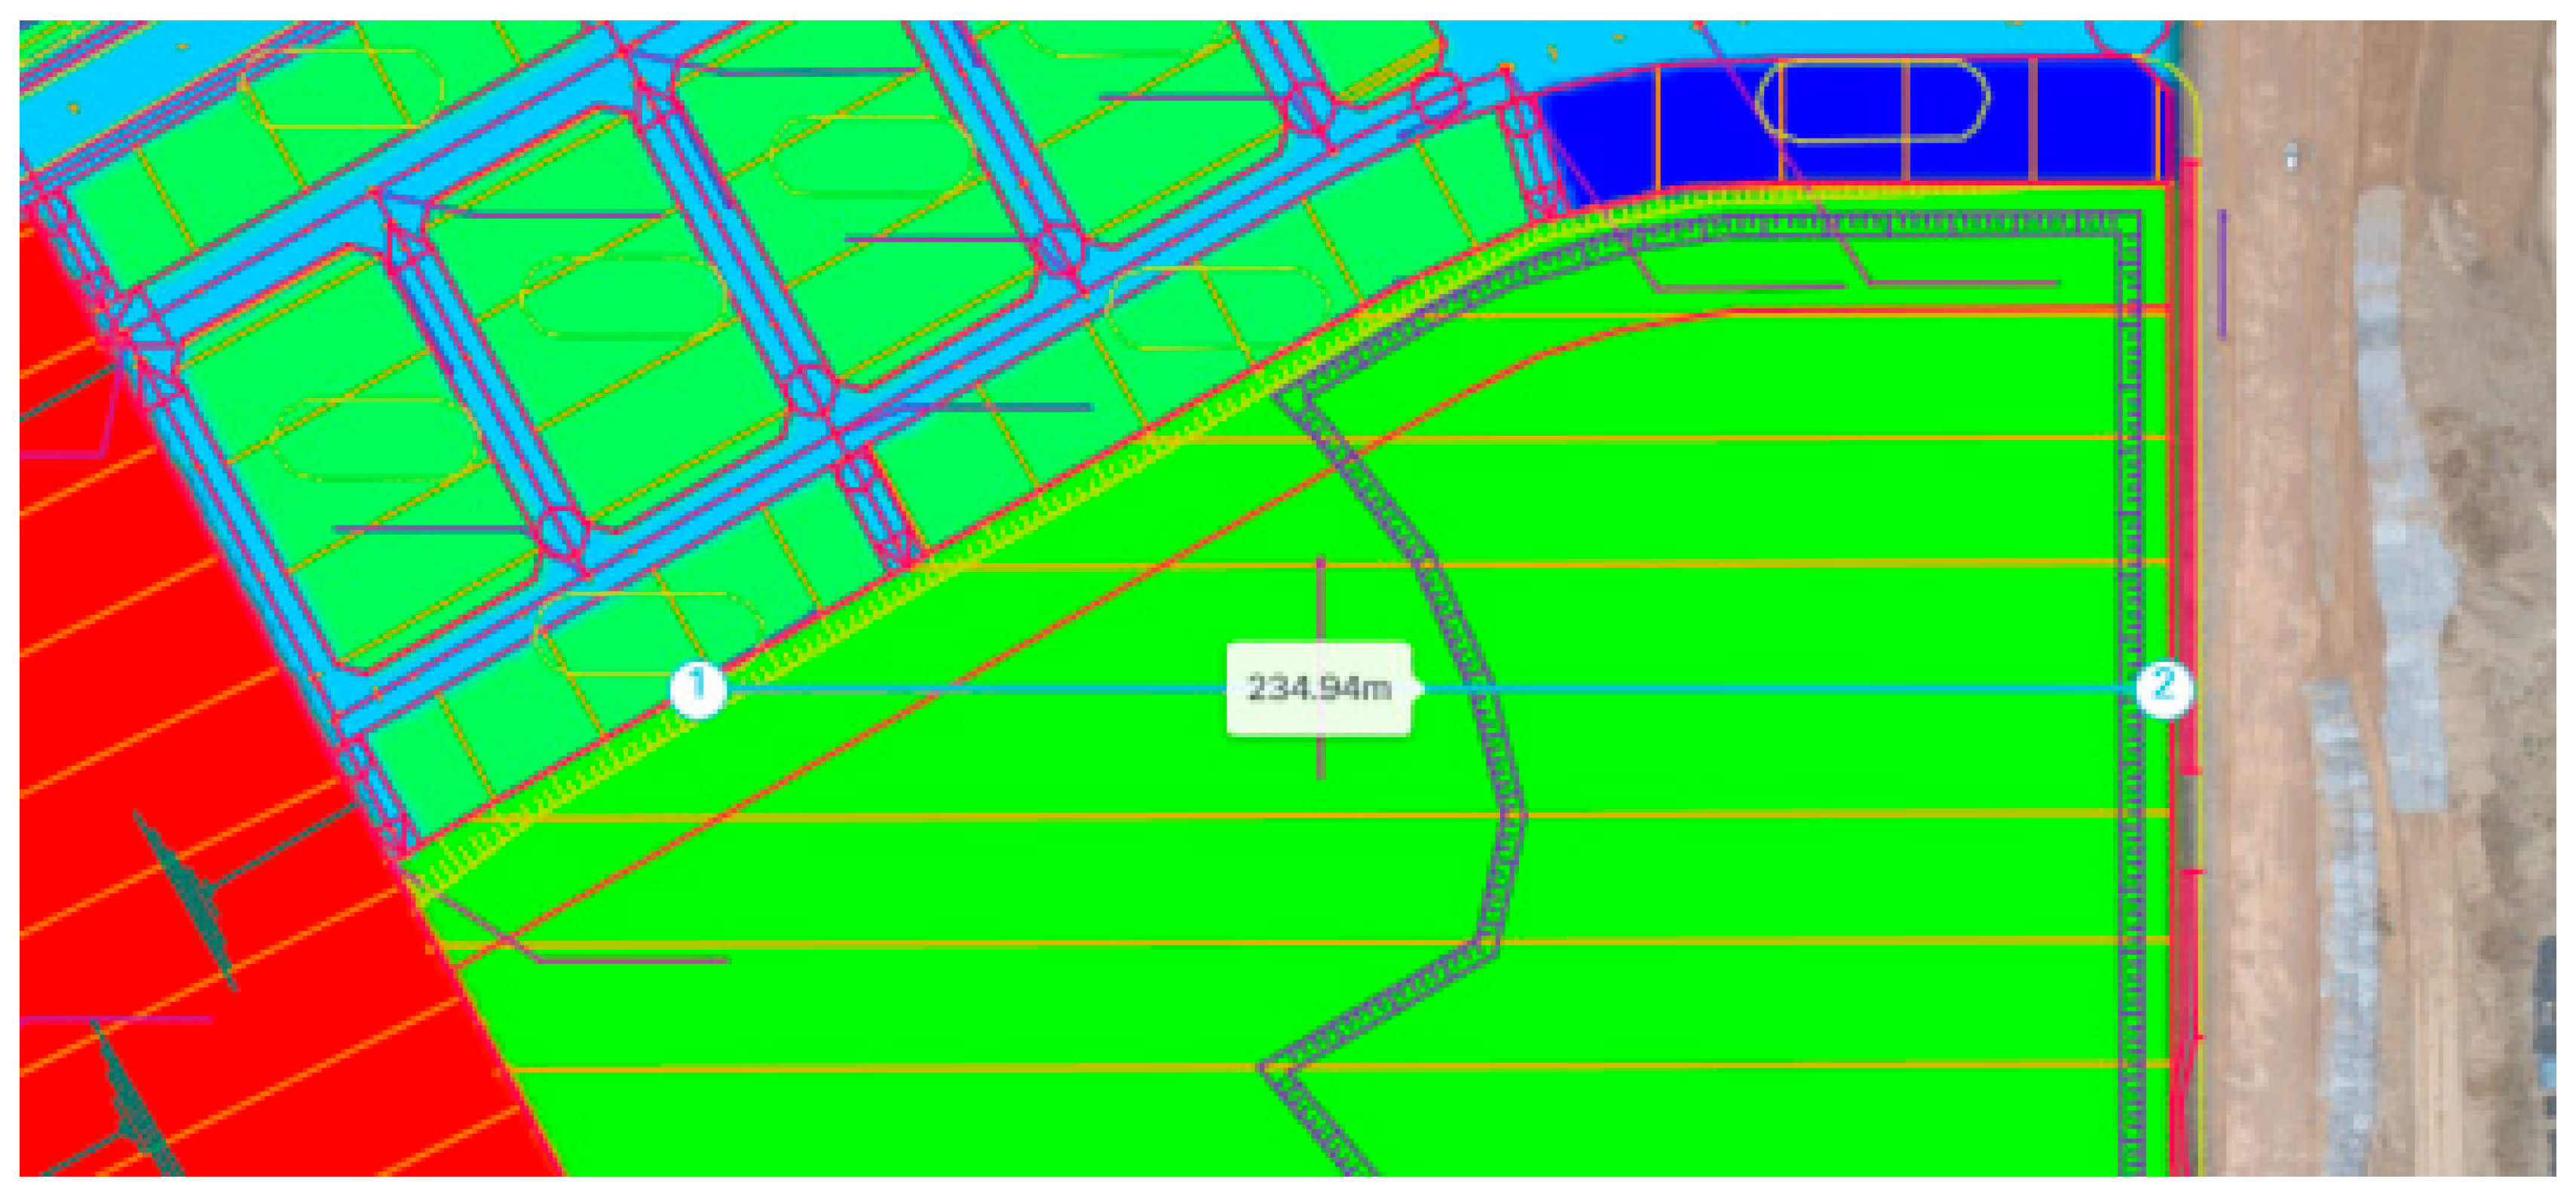
This task involves the process of setting straight lines to be compared using the cross-sectional chains in the planned plane map to calculate the earthwork volume and extract the cross sections corresponding to these straight lines after matching the planned plane map with the DSM. As shown in Figure 17, line segments that matched the cross-sectional chains in the planned plane map were generated. In the figure, points 1 and 2 are given an arbitrary line segment with cross-sectional chain.
Cross sections were then extracted from the site of the data when they were surveyed with a UAV using the corresponding line segments. This not only enables the volume calculation but also allows verification of the construction progress by checking the progress at the site and the cross sections of the planned plane map, as shown in Figure 18.

4.2.7. Volume Calculation and Comparison of Earthwork Volume

The main goal of this study is to develop a technical concept that would allow users to easily see the current progress of construction at a glance by superimposing and visualizing the 3D design model used for a construction site that was photographed with a UAV with the design model for the construction site.
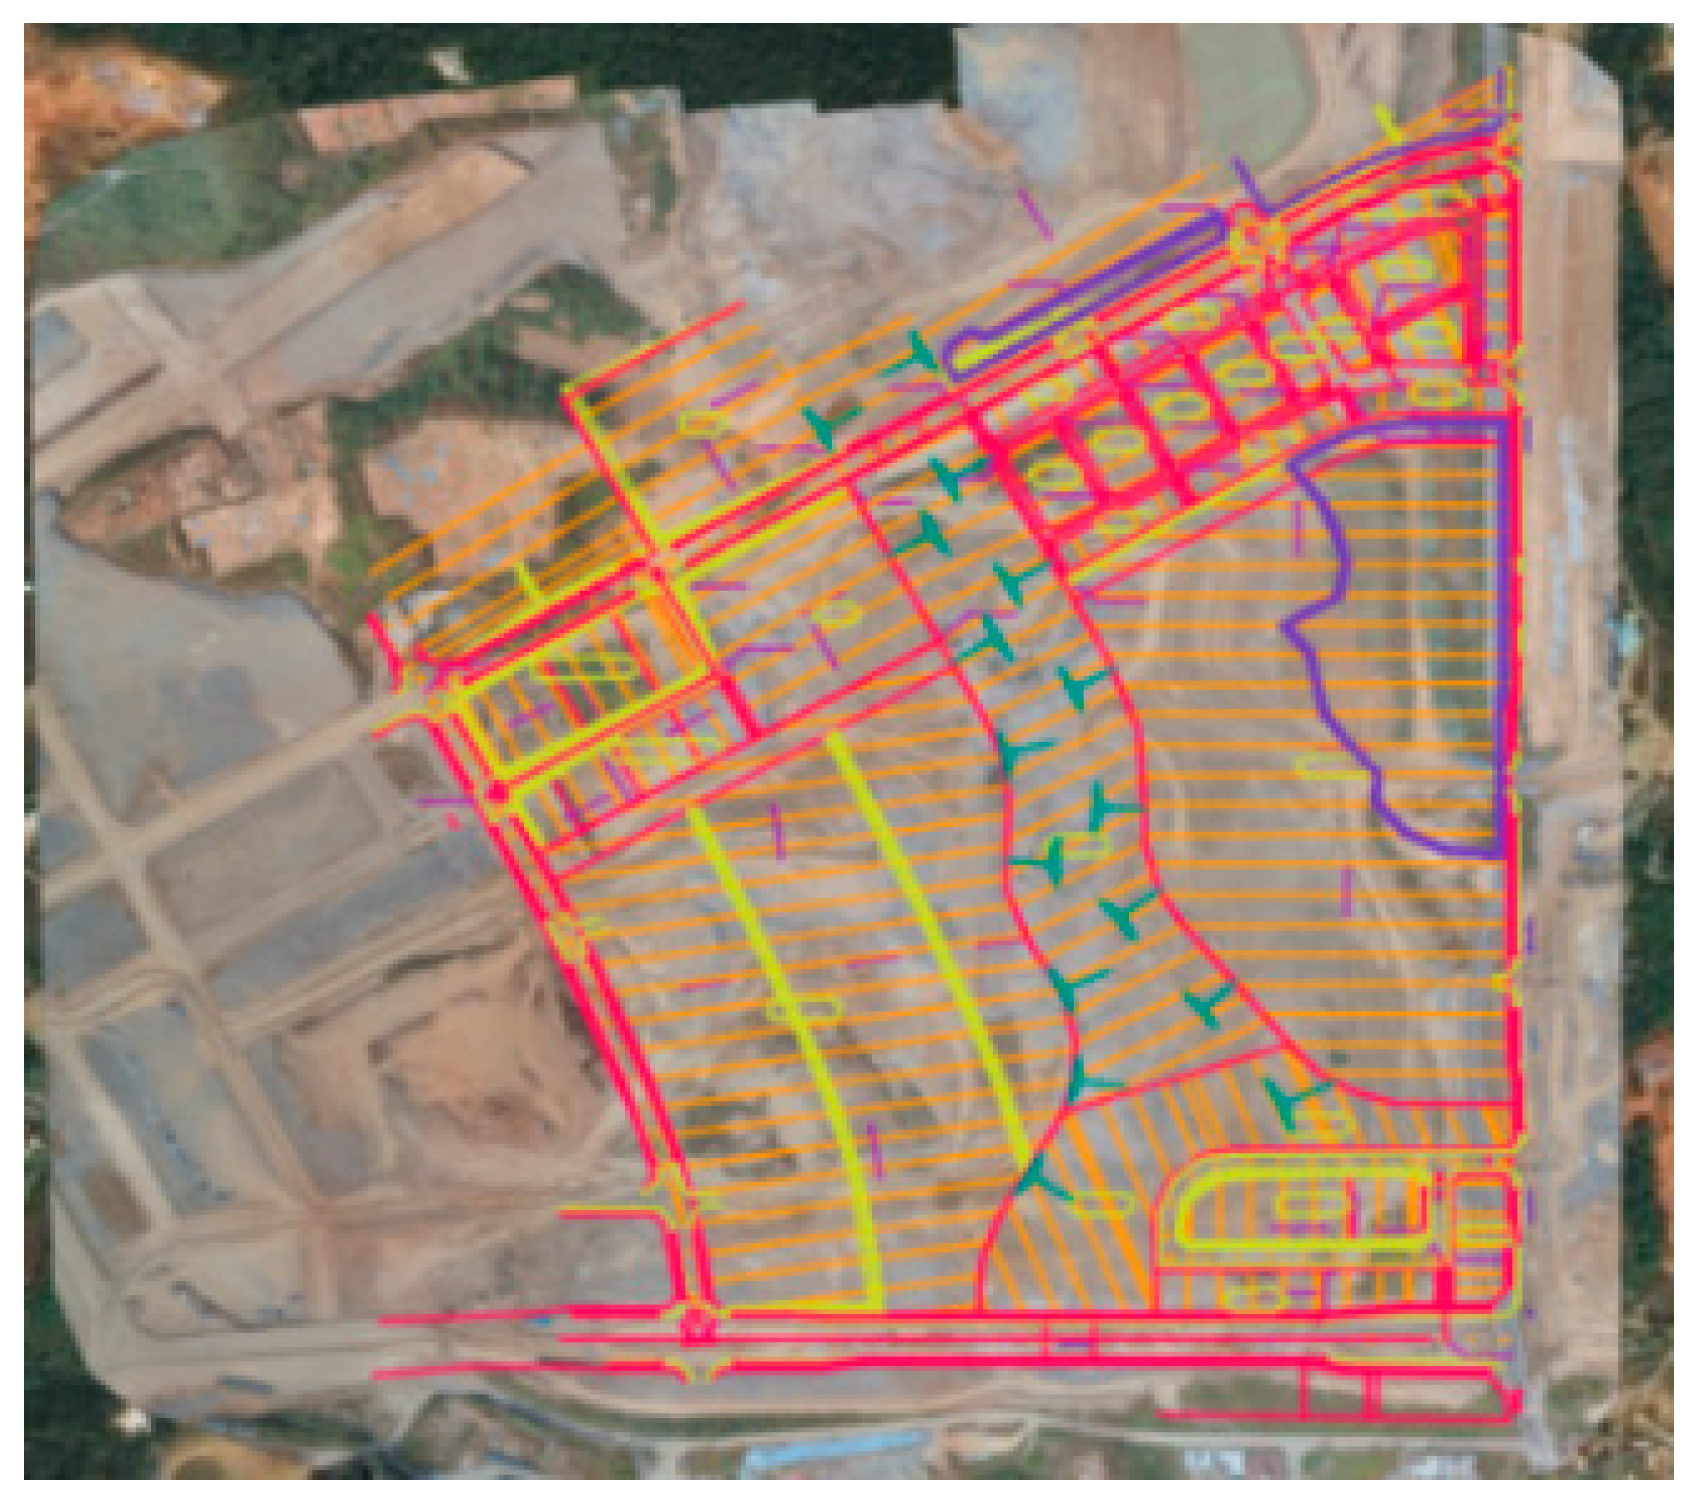
Therefore, the coordinates of the 3D model on different dates were read as shown in Figure 19 and positioned in the same coordinate space, as shown in Figure 20. The change in earthwork volume (progress of construction) was then evaluated.

5. Results

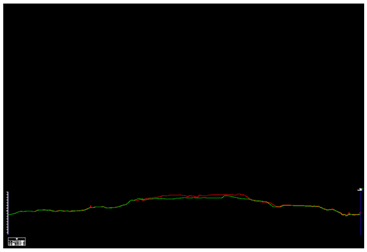
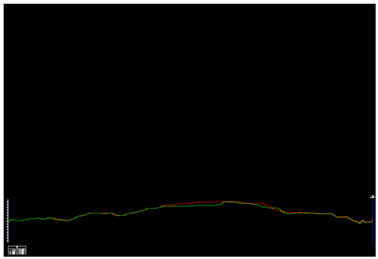
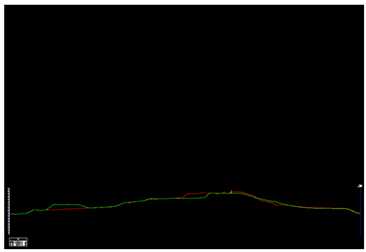
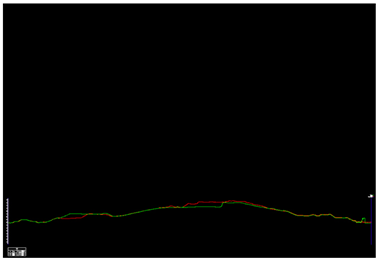
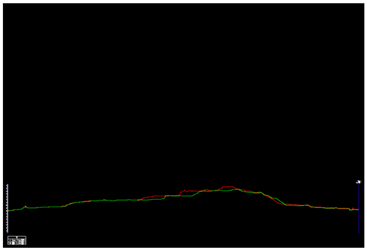
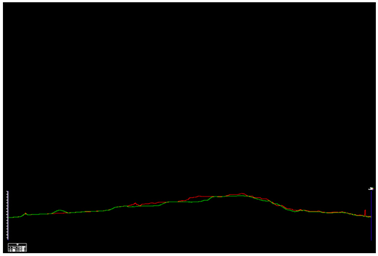
Table 2 lists the cross sections with 20-m intervals on two different dates used to determine the construction progress. In the cross section figure, the change in the earthwork of the site according to the actual construction progress was compared by two dates. It was found that the actual earthwork volume changed between 13 October and 10 November. In the figure, the green line is the existing planned plane map information, and the red line is the earthwork volume information measured by UAV. The changed area was calculated by comparing the heights of the drawings on different dates at each cross section, and the final volume was calculated using this area and the intervals between chains.
Table 3 lists the results of the area and volume analyses at each measuring point used in the average end-area method with 20-m intervals. In Table 3, 20 m intervals are shown as examples instead of tables calculated at 10 m and 5 m intervals. Table 3 refers to the cumulative value of the relative distance from the station and the start. The table is calculated information with an interval of 20 m, and the distance is set to be the same as 20 m. According to the location of each measurement point, the area and volume size of the Earth cutting and Earth filling were analyzed, respectively.
Table 4 lists the volumes calculated using the average end-area method for cross sections obtained by generating chains at each interval to determine the changes according to the construction progress. The calculated earthwork volumes of the earth cutting and filling were compared with the earthwork volumes obtained from the DSM. The results of this comparison indicated that, in the case of the earth cutting section, a shorter chain interval made the results more similar to the earthwork volume based on the DSM; in the case of the earth filling section, a smaller chain-based earthwork volume was generally measured compared to the DSM-based earthwork volume.

6. Discussion

The results of the earthwork volume calculation using a UAV in this study were derived by comparing the earthwork volume calculated using the DSM method with the earthwork volume calculated using the chain method with a planned plane map. The earthwork volume of the chain method with a planned plane map was calculated by creating chains with 20-, 10-, and 5-m intervals and extracting the cross section corresponding to each chain. Then, the total earthwork volume was calculated using the average end-area method for the corresponding cross sections. In the earthwork volume calculation using this method, it was assumed that as the chain interval became closer to 5 m, that is, when the chains were closer to each other, the calculated earthwork volume would be closer to the actual earthwork volume. Likewise, it was assumed that the earthwork volume calculated using the DSM method would be closer to the actual earthwork volume than that calculated using the chain-based earthwork volume calculation method. Therefore, the field applicability of the DSM-based earthwork volume calculation method was verified by comparing the trend of the earthwork volume results according to the chain interval in the chain-based earthwork volume calculation method with the DSM-based earthwork volume.
As a result of this comparison, in the earth cut sections, as the chain interval decreased, the results became more similar to the DSM-based earthwork volume, and in the earth fill sections, the chain-based earthwork volume was generally smaller than the DSM-based earthwork volume. When the 5-m chain-based earthwork volume was compared with the DSM-based earthwork volume, there was an error of 5.3% in the earth cutting sections and an error of 2.44% in the earth fill sections. Theoretically, the DSM-based earthwork volume calculation method was the result of converging an infinitesimal chain interval at the level of 5 cm in the chain-based earthwork volume calculation method. Therefore, it is expected that the DSM-based earthwork volume calculation method will be applicable to the earthwork volume calculation process at real construction sites using UAV.
Theoretically, DSMs contain more meaningful information than 2D-based cross sections. Therefore, the DSM-based earthwork volume calculation method is expected to have higher applicability in the field because it yields a result that is closer to the actual value.
The purpose of this analysis is to develop a function that makes it easy to see filling section and cutting section in the field by overlapping and visualizing the current height and the planned height. When this analysis technology is applied, the currently planned height is displayed in red, and the 3D model generated by UAV photographing can be displayed in green. Therefore, it is easy to see the parts that require cutting or filling for each section of the construction as shown in Figure 21. Furthermore, it is possible to apply a color value according to the amount of cutting and filling soil required on the 3D viewer. If such a function is developed, it can provide more user-friendly technology.

7. Conclusions

UAV photogrammetry or images are still required to utilize the data acquired from UAV by linking them with existing 3D model. To determine the current site conditions and objects, correction and registration analysis are required for the data extracted through UAV and digital scanning. For earthwork volume calculation, it is necessary to devise efficient and appropriate calculation methods, along with more precise data extraction methods using UAV and 3D model.
The results of this study demonstrated that for earthwork volume calculation using UAV, in the case of earth cut sections, a shorter chain interval will allow the calculated earthwork volume to be closer to the DSM-based earthwork volume. Furthermore, in the case of the earth fill sections, the chain-based earthwork volume was generally smaller than the DSM-based earthwork volume. Theoretically, DSMs contain more meaningful information than 2D-based cross sections. Therefore, the DSM-based earthwork volume calculation method is expected to have higher applicability in the field because it yields a result that is closer to the actual value.
This study is a process of analyzing construction data, and aims to strengthen the linkage of 3D data and provide construction management information specialized in excavation work. Through this earthwork analysis using UAV, it is possible to intuitively review the progress of earthwork in 3D by linking the current site with the planned plane.
Although the DSM-based earthwork volume calculation method has the disadvantage of requiring more time and memory, it is expected to greatly reduce the time and cost of the method currently used by construction or survey companies.
UAV will be applied more widely in the construction field because they have advantages such as making it possible to view a construction site from positions that are inaccessible to people and monitoring large areas in a short period of time. UAV technology is expected to evolve into a technology that guarantees the convenience of automatically collecting and managing physical data collected from the real world and allowing them to be used more easily and quickly. Hence, it will be necessary to adopt the following development approaches to improve functionality in the future.
(1) Along with UAV earthwork and mapping, 3D reconstruction technology to secure data quality should be advanced.
It will be necessary to research and develop more diverse and convenient functions that can be provided through UAV data platform services such as automatic earthwork volume calculation systems, while simultaneously improving 3D reconstruction technology, which is a key technology for UAV mapping.
(2) Including UAV control technology for spatial earthwork analysis, various types of software applications have to be used for different tasks and purposes in the construction field.
Including earthwork analysis, UAV control technology should be developed by the relevant groups, including the final users and UAV technology developers, based on spatial information to ensure its effectiveness.
Finally, the earthwork volume calculation technology proposed in this study is to calculate earthwork volume through comparing the 3D model generated by UAV mapping with BIM. In this process, temporary facility objects included in the UAV mapping result may create an error in calculating the earthwork volume. Therefore, the 3D model technology generated by UAV in the future needs to provide more accurate field measurement and comparative method between detecting and interpolating outlier objects.

Author Contributions

Y.H.K. and E.S.P. were responsible for the design and development of the data analysis. S.S.S., H.K.L. and Y.H.K. were responsible for data collection and analysis. S.S.S. and H.K.L. were responsible for data interpretation. E.S.P. wrote the first draft of the article. Y.H.K. were responsible for funding acquisition. Y.H.K. and E.S.P. were responsible for supervision. All authors have read and agreed to the published version of the manuscript.

Funding

This work is supported by the Korea Institute of Civil Engineering and Building Technology, Smart Construction Promotion Center grant funded by the Ministry of Land, Infrastructure and Transport (Grant 20220212-004), and this work is supported by the Korea Agency for Infrastructure Technology Advancement(KAIA) grant funded by the Ministry of Land, Infrastructure and Transport (Grant 22CTAP-C163606-02).

Institutional Review Board Statement

Not applicable.

Informed Consent Statement

Not applicable.

Data Availability Statement

Not applicable.

Conflicts of Interest

The authors declare no conflict of interest.

References

  1. Ministry of Land, Infrastructure and Transport. Smart Construction Technology Roadmap, Technology Policy Department Report. 2018. Available online: http://www.molit.go.kr/USR/NEWS/m_71/dtl.jsp?lcmspage=2&id=95081506 (accessed on 10 March 2022).
  2. Ministry of Land, Infrastructure and Transport. Smart Construction Technology Applied on Site Guidelines, Technology Innovation Department Report. 2021. Available online: https://www.korea.kr/news/pressReleaseView.do?newsId=156439345 (accessed on 15 March 2022).
  3. Choo, S.Y. Level analysis of AI-related technology and R&D direction in architecture and construction industry. BIM Act. Korea Build. Korea 2019, 21, 25–30. [Google Scholar]
  4. Public Procurement Service. Basic Guidelines for BIM Application for Facility Project 2.0. 2019. Available online: https://www.pps.go.kr/kor/bbs/view.do?bbsSn=0001053752&key=00641&pageIndex=1&orderBy=bbsOrdr+desc&sc=&sw=%EA%B8%B0%EB%B3%B8%EC%A7%80%EC%B9%A8 (accessed on 11 March 2022).
  5. Ahn, J.H. System development for systematic BIM data. BIM Act. Korea Build. Korea 2019, 21, 18–21. [Google Scholar]
  6. Ministry of Land, Infrastructure and Transport. Criteria for Evaluating Bidding Methods for Large-Scale Construction, Etc., Technical Standards Department Report. 2019. Available online: http://www.molit.go.kr/USR/NEWS/m_71/dtl.jsp?id=95081957 (accessed on 11 March 2022).
  7. Sohn, Y.S. Real estate technology trend and building service development direction—Songdo POSCO tower case study. BIM Act. Korea Build. Korea 2019, 21, 31–37. [Google Scholar]
  8. Korea Development Institute. Changing the Road and Railway Cost Estimation Guidelines, Public and Private Infrastructure Investment Management Center Report. 2015. Available online: https://www.kdevelopedia.org/Resources/view/04201504130137646.do (accessed on 10 March 2022).
  9. Moon, D.Y. A study on the earthwork volume decision using the spline interpolation. Journal of the Korean Society of Surveying, Geodesy. Photogramm. Cartogr. 2000, 18, 305–313. [Google Scholar]
  10. Binker, R.C.; Wolf, P.R. Elementary Surveying; Harper and Row: New York, NY, USA, 1984. [Google Scholar]
  11. Song, S.G.; Yang, J.S.; Myung, T.S. Automated generation of a construction schedule based on the work method template for 4D simulation. Korean Inst. Ind. Eng. 2012, 25, 216–228. [Google Scholar] [CrossRef] [Green Version]
  12. Jo, J.; Park, J.H.; Park, W.H.; Yun, S.H.; Paek, J.H. A study on the BIM based architectural construction simulation system using combinative construction schedule creation method. J. Archit. Inst. Korea 2008, 24, 101–108. [Google Scholar]
  13. Julian, H.K.; Stuart, D.A.; Mark, J.C. Empirical Study on the Merit of Web-Based 4D Visualization in collaborative construction Planning and Scheduling. ASCE 2007, 133, 447–461. [Google Scholar] [CrossRef]
  14. Korea Expressway Corporation. EX-BIM Guideline. 2016. Available online: https://www.codil.or.kr/viewDtlConRpt.do?gubun=rpt&pMetaCode=OTKCRK170471 (accessed on 10 March 2022).
  15. Yilmaz, H.M. Close range photogrammetry in volume computing. Exp. Tech. 2010, 34, 48–54. [Google Scholar] [CrossRef]
  16. Hugenholtz, C.H.; Walker, J.; Brown, O.; Myshak, S. Earthwork volumetric with an unmanned aerial vehicle and softcopy photogrammetry. J. Surv. Eng. 2015, 141, 138. [Google Scholar] [CrossRef]
  17. Raeva, P.; Filipova, S.; Filipov, D. Volume computation of a stockpile—A study case comparing GPS and UAV Measurement in an openpit quarry. Remote Sens. Spat. Inf. Sci. 2016, 41, 999–1004. [Google Scholar]
  18. Ekpa, A.U.; Eyoh, A.E.; Ubom, O. A comparative analysis of volumetric stockpile from UAV photogrammetry and total station data. SSRG Int. J. Geoinform. Geol. Sci. 2009, 6, 29–37. [Google Scholar]
  19. Yi, J.; Weiqiao, L.; Pei, G. Application research on slope deformation monitoring and earthwork calculation of foundation pits based on UAV oblique photography. In Proceedings of the 2nd International Conference on Civil, Architecture and Urban Engineering, Xi’an, China, 14–16 August 2020. [Google Scholar]
  20. Bin, L.; Hongju, H.; Shouchao, H.; Dazhong, N. Research on Application of Engineering Earthwork Survey and Calculation Based on Tilt PhotographyChinese Full Text. Geomat. Spat. Inf. Technol. 2021, 44, 165–167. [Google Scholar]
  21. Rotnicka, J.; Dłuzewski, M.; Dabski, M.; Rodzewicz, M.; Wfodarski, W.; Zmarz, A. Accuracy of the UAV-Based DEM of Beach–Foredune Topography in Relation to Selected Morphometric Variables, Land Cover, and Multitemporal Sediment Budget. Estuaries Coasts 2020, 43, 1939–1955. [Google Scholar] [CrossRef]
  22. Ryu, J.R. Drone technology: The perspective of constructive relation occupation. BIM Act. Korea Build. Korea 2019, 21, 16–19. [Google Scholar]
  23. Seo, I.-S.; Kim, Y.-W. A Study on the Development of the Combat System for Drone-Bot, Korea Drone Innovation Asscoiation Report. 2020. Available online: https://defense.na.go.kr:444/defense/reference/reference02.do?mode=view&articleNo=666708&article.offset=0&articleLimit=10 (accessed on 2 March 2022).
  24. Ministry of Land, Infrastructure and Transport. BIM Basic Guidelines for Construction Industry, Technology Safety Policy Department Report. 2020. Available online: http://www.molit.go.kr/USR/policyData/m_34681/dtl.jsp?search=&srch_dept_nm=&srch_dept_id=&srch_usr_nm=&srch_usr_titl=Y&srch_usr_ctnt=&search_regdate_s=&search_regdate_e=&psize=10&s_category=&p_category=&lcmspage=1&id=4516 (accessed on 15 March 2022).
  25. Hwang, H.S.; Lee, J.H.; Kim, T.Y. Parametric quantity take-Off of earthwork by comparing the use of surface and solid models. Korean Inst. Build. Inf. Model. 2018, 8, 56–62. [Google Scholar] [CrossRef]
  26. Ha, C.S. Development of Automated Quantity Take Off Algorithm for Irregularly Shaped Structures Based on Surface Modelina Construction Project. Master’s Thesis, Kyeong-Sang University, Busan, Korea, 2013. [Google Scholar]
  27. Jung, G.Y.; Woo, J.W.; Gang, G.D.; Shin, J.C. Reliability analysis and utilization of BIM-based highway construction output volume. J. BIM Assoc. Korea 2013, 3, 9–18. [Google Scholar] [CrossRef] [Green Version]
  28. Lee, D.H.; Kim, Y.S.; Suh, Y.C. Analysis possibility of the landslide occurrence in Kangwon-Do using a high-resolution LiDAR-derived DEM. J. Geogr. Inf. Syst. Assoc. Korea 2009, 17, 381–387. [Google Scholar]
  29. Ha, C.S.; Moon, S.Y.; Moon, H.S.; Kang, L.S. Development of quantity take-off algorithm for irregularly shaped structures using 3D object. KSCE J. Civ. Environ. Eng. Res. 2014, 34, 655–666. [Google Scholar] [CrossRef] [Green Version]
  30. Lee, J.N.; Lee, D.H.; Lee, Y.K.; Suh, Y.C. Development of earth-volume estimation program using the precise LiDAR DEM. J. Korea Spat. Inf. Soc. 2010, 18, 143–161. [Google Scholar]
  31. Reinartz, P.; Müller, R.; Lehner, M.; Schroeder, M. Accuracy analysis for DSM and orthoimages derived from SPOT HRS Stereo data using direct georeferencing. ISPRS J. Photogramm. Remote Sens. 2006, 60, 160–169. [Google Scholar] [CrossRef]
  32. Friedrich, C. Smart volumes-adaptive Voronoi power diagramming for real-time volumetric design exploration. In Proceedings of the Virtual Systems and Multimedia, 13th International Conference, Brisbane, Australia, 23–26 September 2007. [Google Scholar]
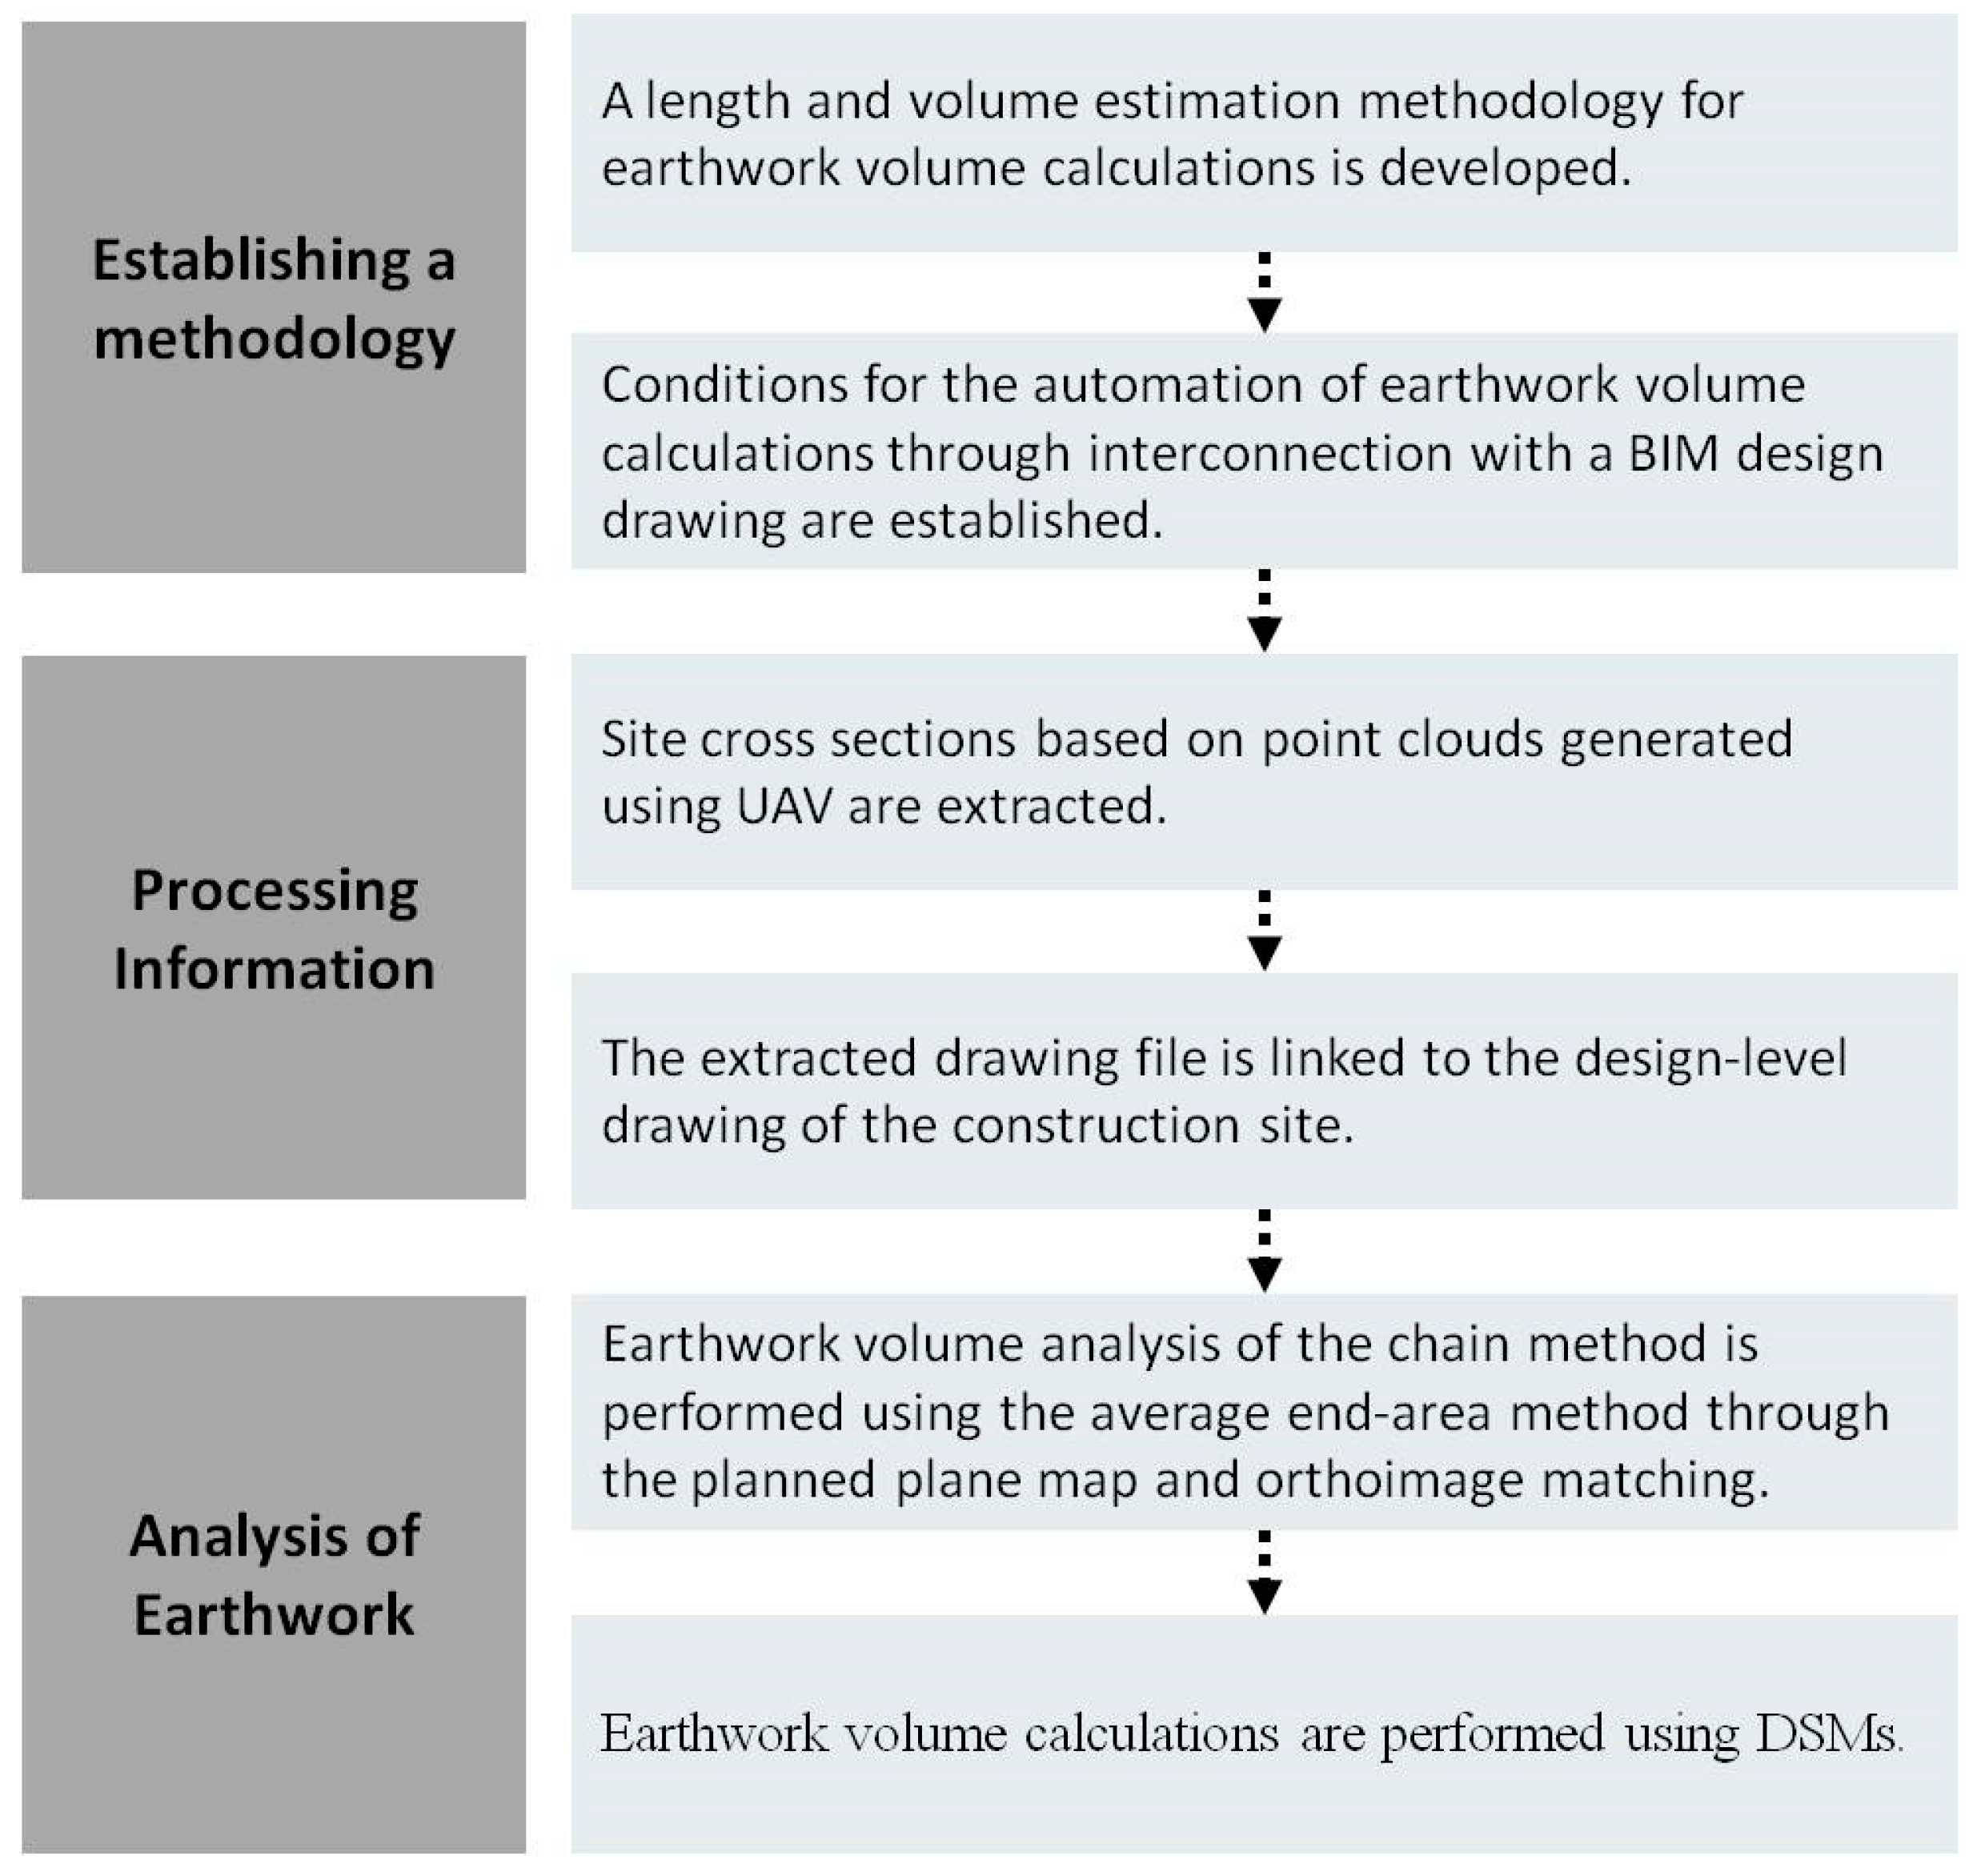
Figure 1. Scope and procedures for research.
Sustainability 14 09331 g001
Figure 2. Creation of 3D model and linkage of field earthwork volume data. (a) 3D model created using UAV photograph. (b) Visualization of 3D model of the current and design level. (c) Visualization of a 3D model created using UAV photograph and existing 3D model through superimposing models.
Sustainability 14 09331 g002
Figure 3. Calculation of volume using the average end-area method.
Sustainability 14 09331 g003
Figure 4. Starting and ending points of chains with 20-, 10-, and 5-m intervals. (a) Starting and ending points of a chain with 20-m intervals. (b) Starting and ending points of a chain with 10-m intervals. (c) Starting and ending points of a chain with 5-m intervals.
Sustainability 14 09331 g004
Figure 5. Example of a Voronoi diagram and Delaunay triangulation.
Sustainability 14 09331 g005
Figure 6. Visualization of a micro-cuboid for volume estimation.
Sustainability 14 09331 g006
Figure 7. Explanation of the process of comparing earthwork volume calculations. (a). Current model on 10 November. (b). Comparison with model on 13 October.
Sustainability 14 09331 g007
Figure 8. GCP survey status. (a). Status of GCP measurement sites. (b). GCP survey status indices.
Sustainability 14 09331 g008
Figure 9. Drone field photography using the Flight app. (a). First half of drone route flight. (b). Second half of drone route flight.
Sustainability 14 09331 g009
Figure 10. Site area used for earthwork volume calculation.
Sustainability 14 09331 g010
Figure 11. Conventional 3D model.
Sustainability 14 09331 g011
Figure 12. GCP survey and distribution of GCPs. (a). Photograph of the GCP survey site. (b). Aerial photograph of the GCP survey. (c). Distribution of GCPs.
Sustainability 14 09331 g012
Figure 13. DSM generation from 3D point clouds.
Sustainability 14 09331 g013
Figure 14. Point cloud data generated using camera position information.
Sustainability 14 09331 g014
Figure 15. 3D models generated from the DSM. (a). 3D model of the surface form generated from the DSM. (b). 3D model of the line form generated from the DSM.
Sustainability 14 09331 g015
Figure 16. Matching the planned plane map with the DSM.
Sustainability 14 09331 g016
Figure 17. Extraction of line segments to be compared with cross-sectional chains of the planned plane map.
Sustainability 14 09331 g017
Figure 18. Comparison of the site view on the drone survey date and cross section of the planned plane map using chains of the planned plane map.
Sustainability 14 09331 g018
Figure 19. Superimposing the planned plane map with the orthoimage.
Sustainability 14 09331 g019
Figure 20. Comparison and analysis of the planned plane map and the 3D model. (a). Plane derived by superimposing the planned plane map with the 3D model. (b). 3D map derived by superimposing the planned plane map with the 3D model.
Sustainability 14 09331 g020
Figure 21. Advancement of intuitive information management technology in the progress of earthworks at the current construction sites.
Sustainability 14 09331 g021
Table 1. Summary of the test of 3D-based earthwork volume calculation technology.
ClassificationDescription
Location622, Geomdan-ro, Seo-gu, Incheon
Dates13 October and 10 November 2020 (twice)
PurposeEarth cutting and filling volume measurement verification test using UAV
Flight altitude80 m
Camera parametersFocal 3755.091 [pixel], 8.807 [mm]
principal point x 2745.974 [pixel], 6.440 [mm]
principal point y 1830.178 [pixel], 4.292 [mm]
GSDOctober 13 GSD: 3.51 cm
November 10 GSD: 3.44 cm
Mean reprojection error0.092
Table 2. Part of the comparison of cross sections with 20-m intervals between different dates used to determine the progress of construction.
ClassificationFirst Measurement of Earthwork Volume (13 October)Second Measurement of Earthwork Volume (10 November)
Cross section at interval A point Sustainability 14 09331 i001 Sustainability 14 09331 i002
Cross section at interval B point Sustainability 14 09331 i003 Sustainability 14 09331 i004
Cross section at interval C point Sustainability 14 09331 i005 Sustainability 14 09331 i006
Table 3. Cut and fill area and volume analysis results at each measuring point at 20-m intervals.
Measuring Point
(m)
Distance
(m)
Earth CuttingEarth Filling
AreaVolume (m3)AreaVolume (m3)
000.81 0.00
20201674.5516,753.5814.87148.73
40201041.1927,157.484.58194.48
602049.0810,902.7316.69212.63
802076.781258.6125.55422.39
10020394.504712.8223.32488.74
12020373.307677.9838.59619.13
1402055.894291.8865.501040.88
16020114.741706.25123.481889.80
1802090.042047.74115.602390.78
20020124.552145.87159.412750.10
22020453.235777.76622.037814.47
2402030.694839.17635.9612,579.98
2602046.84775.35799.4614,354.22
2802020.86677.07672.6714,721.31
30020772.217930.69795.5714,682.47
3202055.748279.46780.0715,756.45
3402062.031177.711044.7418,248.07
3602066.331283.64859.5119,042.47
38020370.934372.66821.1016,806.07
40020663.3810,343.09568.6313,897.26
42020118.947823.13920.9714,896.00
44020119.122380.58853.3217,742.90
4602098.482176.001027.3318,806.47
48020105.582040.571404.2324,315.60
50020126.402319.801669.1730,733.99
5202083.652100.502001.1836,703.52
54020163.842474.87616.2726,174.55
56020208.703725.35374.829910.89
57919226.694136.20609.749353.30
59920226.964536.56203.698134.33
61920328.315552.76159.573632.61
63920388.867171.71125.322848.85
65920355.867447.140.001253.19
67920263.396192.5081.61816.08
69920262.855262.44449.615312.16
71920294.245570.90339.967895.65
73920412.867071.050.003399.57
75920398.268111.282.0420.43
Total 10,720.66115,631.9319,026.16372,834.71
Table 4. Volumes calculated using the average end-area method.
ClassificationCut Volume (m3)Relative Value to DSMFill Volume (m3)Relative Value to DSM
20 m115,631.939302.92372,834.717323.66
10 m118,507.486427.37370,854.539303.84
5 m119,552.355382.5370,131.6310,026.74
DSM124,934.85380,158.37
Publisher’s Note: MDPI stays neutral with regard to jurisdictional claims in published maps and institutional affiliations.