1. Introduction
The electric utility industry is probably the largest and most complex industry, globally [
1]. Qatar has witnessed a massive transformation over the past 20 years, wherein the country’s economy has multiplied due to natural gas exports. Peak demand for Qatar’s electricity system has grown from 1244 MW in 1995 to 8875 MW in 2021, and the installed capacity reached 10,576 MW in 2022 [
2,
3,
4]. This has created many challenges for the electricity network, from generation to distribution. This trend will likely be sustained if the economy keeps growing at the same rate. Qatar’s electricity sector has undergone a remarkable development in recent years, with generation reaching 42.3 TWh in 2016, almost double that of 2008. Qatar’s annual rate of increase in electricity demand is about 8%, among the world’s highest growth rates. For example, in India, power generation is growing at an annual average rate of 5.17% between 2018 and 2022 [
5].
Moreover, Qatar faces significant challenges related to the consumption and availability of natural resources while having the world’s highest per capita electricity and water consumption [
6,
7]. As part of the arrangements to host the FIFA 2022 World Cup, Qatar has invested heavily in infrastructure, such as stadiums, housing, transportation, roads, and other service facilities. In response to this, the electricity generation sector should be ready to meet the exponential rise in electricity demand, which calls for a proper peak demand forecasting approach that considers population and GDP growth along with the number of electricity meters. Forecasting helps to define potential obstacles and opportunities and establish the premises for future plans [
8,
9]. Based on the time horizon, there are three forecasting terms: short, medium, and long. Short-term forecasting is one hour to one week. The short-term electricity demand forecasting objective is to forecast the daily electricity demand to provide the required amount of generated power. This forecasting type depends on comparing the previous day’s demand values and considering temperature, humidity, day type (working/weekend), and demand from industrial consumers.
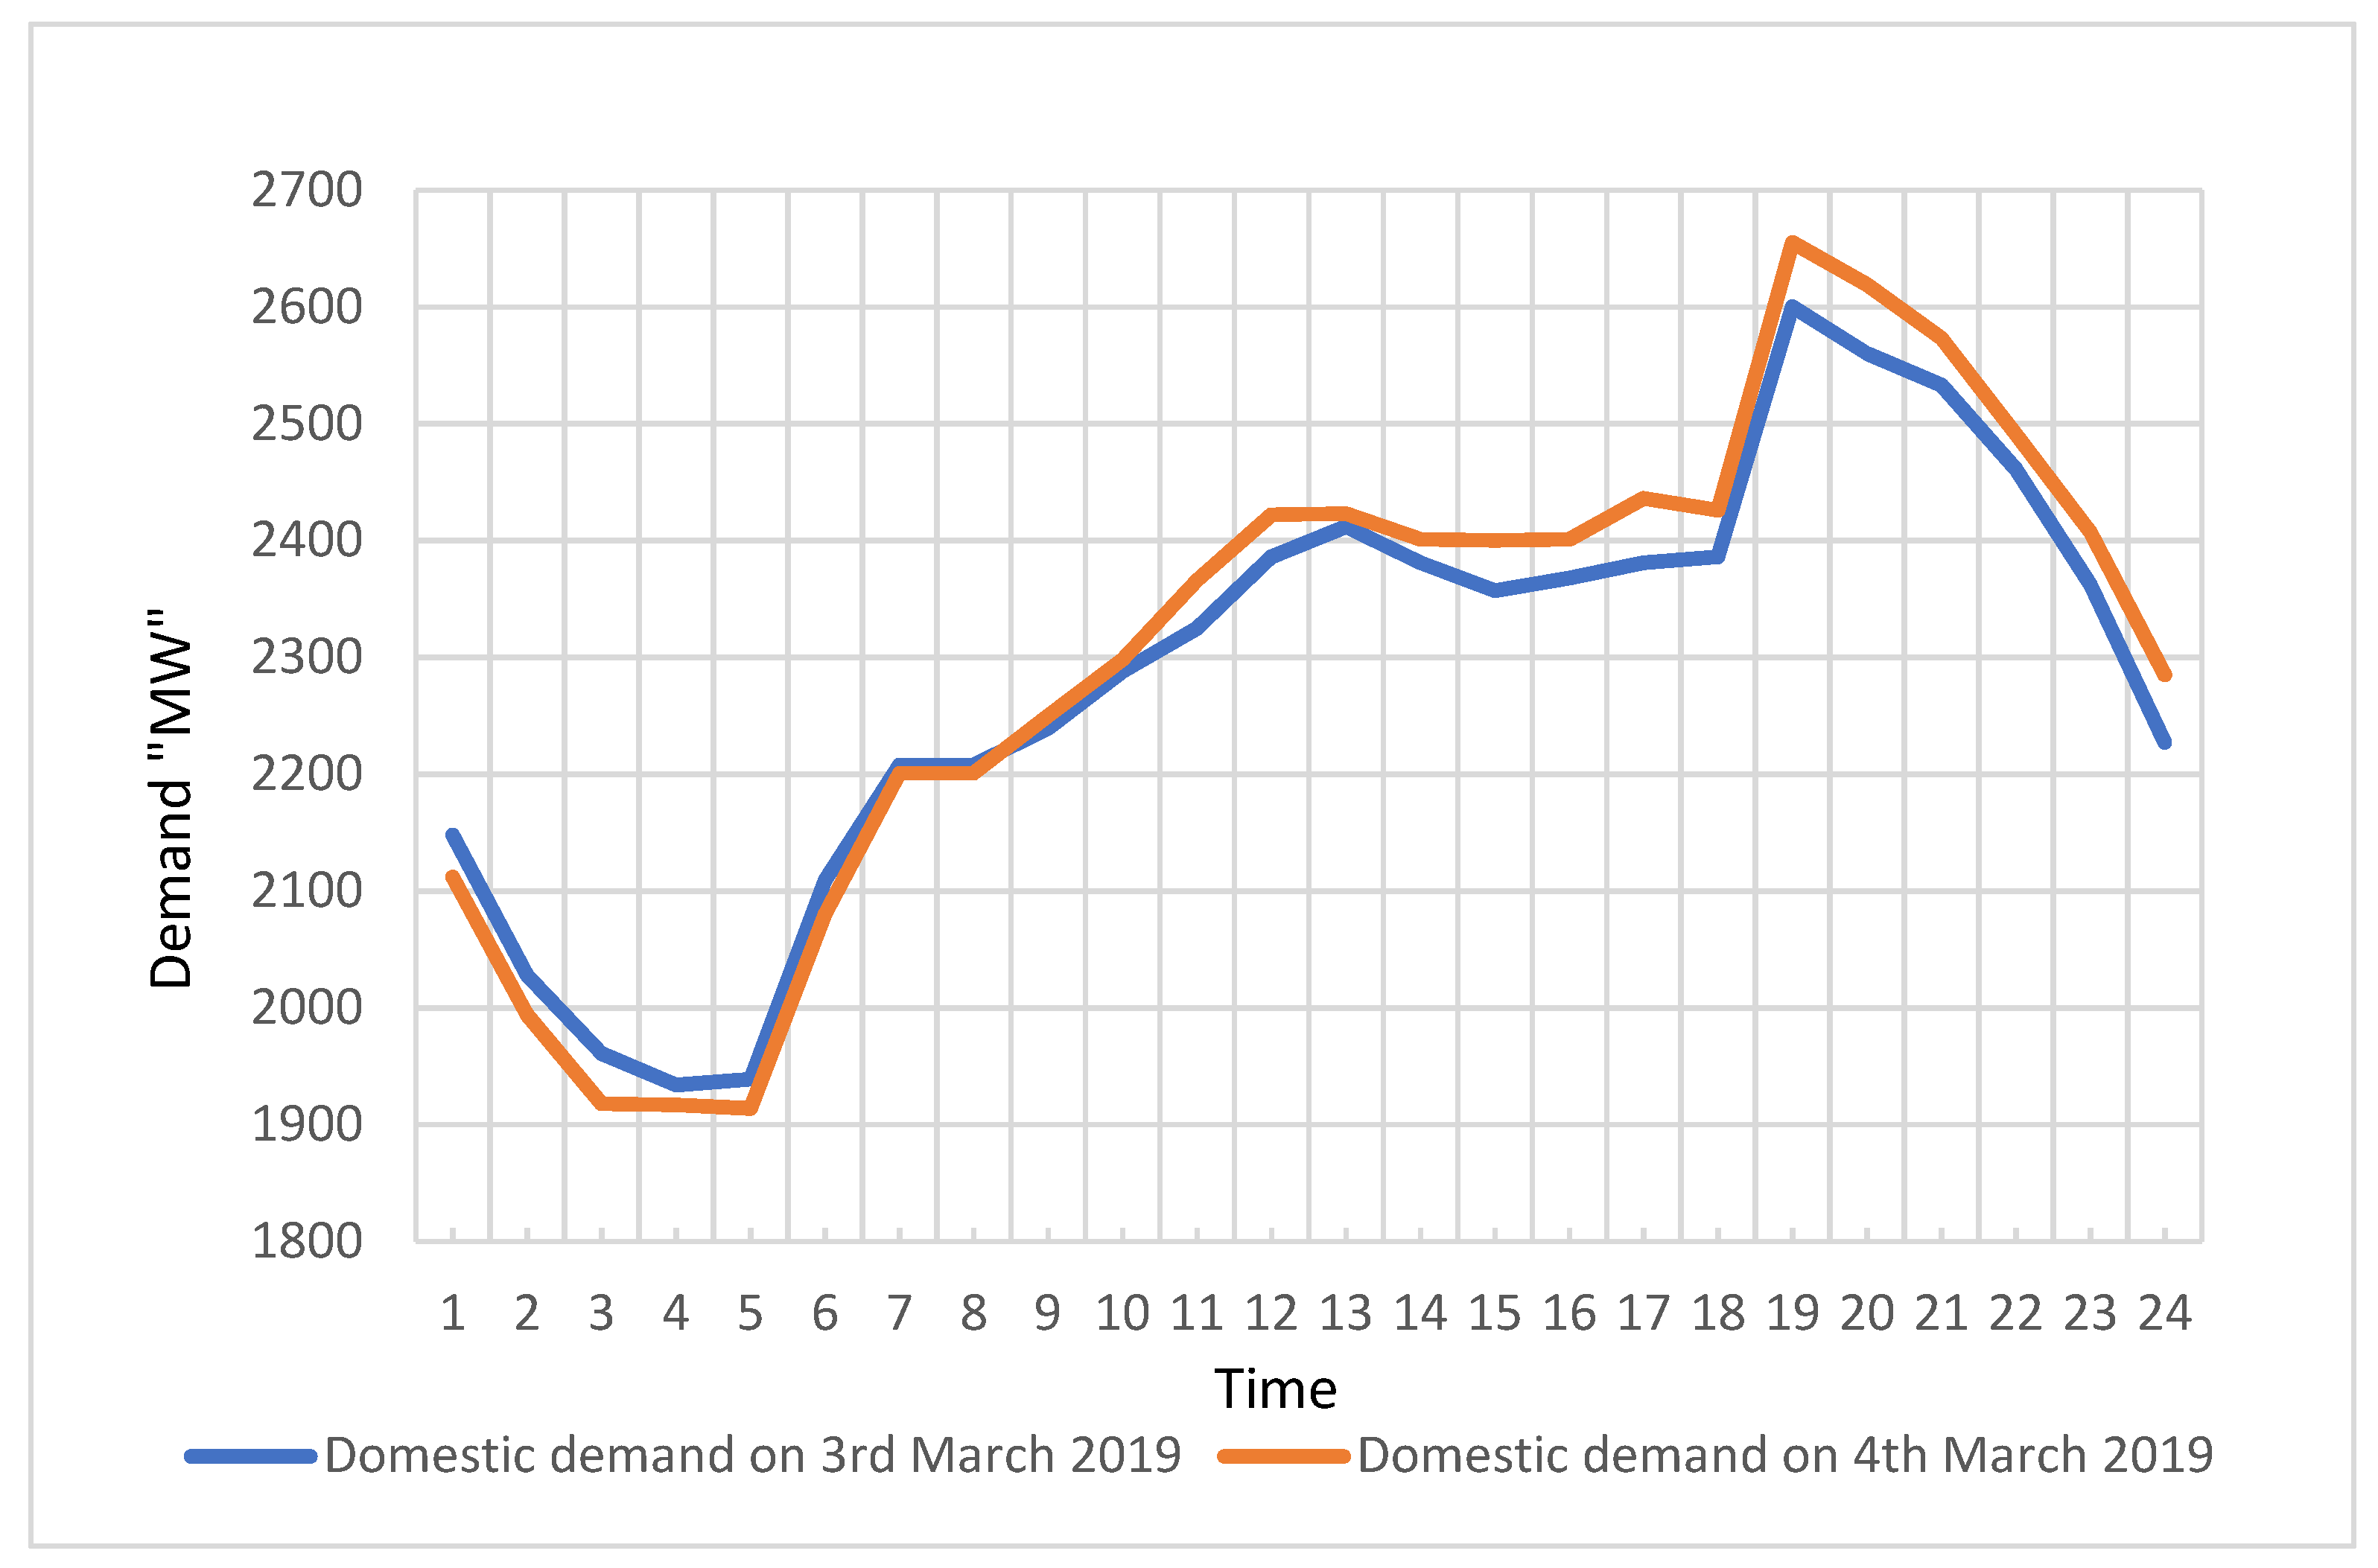
Figure 1 shows Qatar’s domestic demand for two consecutive days on the 3 and 4 March 2019).
From
Figure 1, it is noted that the electricity demands for the two days are almost identical. Short-term electricity load is affected by natural and social factors, making load forecasting more complex [
10]. For medium-term forecasting, the time horizon is one week to one year. It is made based on (i) historical load demand (both domestic and industrial); (ii) planned new load (bulk consumers, big commercial projects, government projects); (iii) outage programs of the bulk industrial consumers; and (iv) temperature and humidity. The time horizon for long-term forecasting is longer than a year and is based on (i) historical load demand (both domestic and industrial); (ii) planned new load (bulk consumers, big commercial projects, government projects); (iii) population growth; (iv) oil prices; (v) gross domestic product (GDP); and (vi) the number of electricity meters.
Forecasting methods can also be classified into three main categories: subjective, objective (time series), and objective (causal). The subjective forecasting method is based on human judgment, such as the Delphi method and cross-impact analysis. On the other hand, the time series method is based only on a phenomenon’s past values. Causal methods are based on data and independent variables (factors) that affect a dependent variable that is being forecasted [
11,
12]. Bayram et al. [
13] studied and analyzed Qatar’s electricity consumption patterns and future renewable energy integration.
In addition, they proposed a methodology, to estimate the cooling load. The authors used the Gulf Cooperation Council Interconnection Authority (GCCIA) data. They got the peak demand, only from 2009, after establishing the GCCIA [
14]. To gain a better understanding and more accurate forecasts for this paper, Qatar General Electricity and Water Corporation (KAHRAMAA, responsible for Qatar’s electricity transmission and distribution network) was approached. Total peak demand and domestic peak demand data were obtained, ranging from the years 1954 and 2001, respectively, to 2020. They also found a significant difference between summer and winter electricity demand, caused by the cooling demand in summer, with more than half of the electricity consumption in summer coming from cooling. Inglesi [
15] used regression modeling to forecast electricity demand in South Africa up to 2030, using historical data from 1980 to 2005. In 2008, South Africa faced a problem in supplying domestic and industrial consumers with electricity. The author used five variables: real GDP, actual electricity consumption, average electricity price, real disposable income, and population. The analysis showed that a unit percentage increase in electricity price could reduce the electricity demand by about 0.5%. The author also found that a unit percentage increase in the population’s disposable income can increase electricity demand growth by more than 0.4%. The evaluation was based on two scenarios: the average growth of the economy (4%), and accelerated growth (6%), between 2009 and 2030, with 1% population growth and increased electricity prices. The results showed that in the long term, income and price significantly impact the demand, whereas, in the short term, electricity demand is impacted by GDP and the population size. Li et al. [
16] highlighted that accurate load forecasting is essential for an electricity market operator’s dispatch planning. They proposed two Bayesian quantile regression models to forecast the quantiles of electricity load. They then applied their proposed models to the National Electricity Market of Australia. Cabral et al. [
17] explored the balance between demand and supply, especially with the unavailability of cost-effective energy storage systems. In addition, Elkamel et al. [
18] proposed a multiple linear regression model and a neural network model to forecast electricity demand in Florida state. The proposed models used economic, social, and climatic variables. Hadri et al. [
19] investigated three approaches to forecasting electricity consumption in buildings. Their goal was to assess the forecasting accuracy of the models at the smart meter level. Lin et al. [
20] studied how to improve the accuracy of forecasting air conditioning and lighting power consumption in a high-rise office building in Shanghai. They concluded that adding relative humidity, and scheduling, to the forecasting model would improve accuracy.
On 30 January 2020, COVID-19 was identified by the World Health Organisation as an international public health emergency [
21]. Malec et al. [
22] studied the impact of COVID-19 on electricity demand profiles for selected business clients in Poland. They concluded that the drop in electricity consumption against the expected values was 15–23% in the first lockdown. For the second lockdown, the percentage drop was less, with a maximum value of 11%. Nevertheless, the impact of abnormal conditions such as the COVID-19 pandemic on electricity demand and load forecasting has not been thoroughly investigated in relation to preparedness for such situations.
COVID-19 has thus affected all sectors of life, and researchers in numerous fields have begun studying the impact of the pandemic, especially with the spread of coronavirus variants. The research questions are: what are the impacts of the COVID-19 restrictions on Qatar’s electricity demand, and what is the relation between the restrictions and forecasting? This paper discusses the impacts of the COVID-19 pandemic on Qatar’s electricity demand. In addition, the factors that need to be considered for electricity demand forecasting are studied. The main contributions of this paper are the following:
2. The Impact of COVID-19 on Electricity Demand
COVID-19 affected all life sectors worldwide, electricity demand being just one of these sectors. There was a direct impact on the industrial demand, due to the lack of global demand for many commodities and products, such as oil and gas. The impact on domestic demand varied from country to country according to the severity of restrictions imposed. In response to the pandemic, some countries closed schools and universities, and some jobs were transferred to remote working systems. Some countries took more stringent precautions, based on the number of current and expected COVID-19 cases, and had partial or entire curfews or even complete shutdown in some cases. In Qatar, the government transferred academic study to distance learning and suspended public transport services for schools and universities [
23]. Qatar also reduced the presence and attendance of the number of workers in the government and private sectors to 20% of total employees, with the rest working from home [
24]. Qatar also closed many shops and malls, keeping pharmacies and foodstuff sales outlets open, with relatively limited opening hours. This changed the shape of the curve and the magnitude of electricity demand.
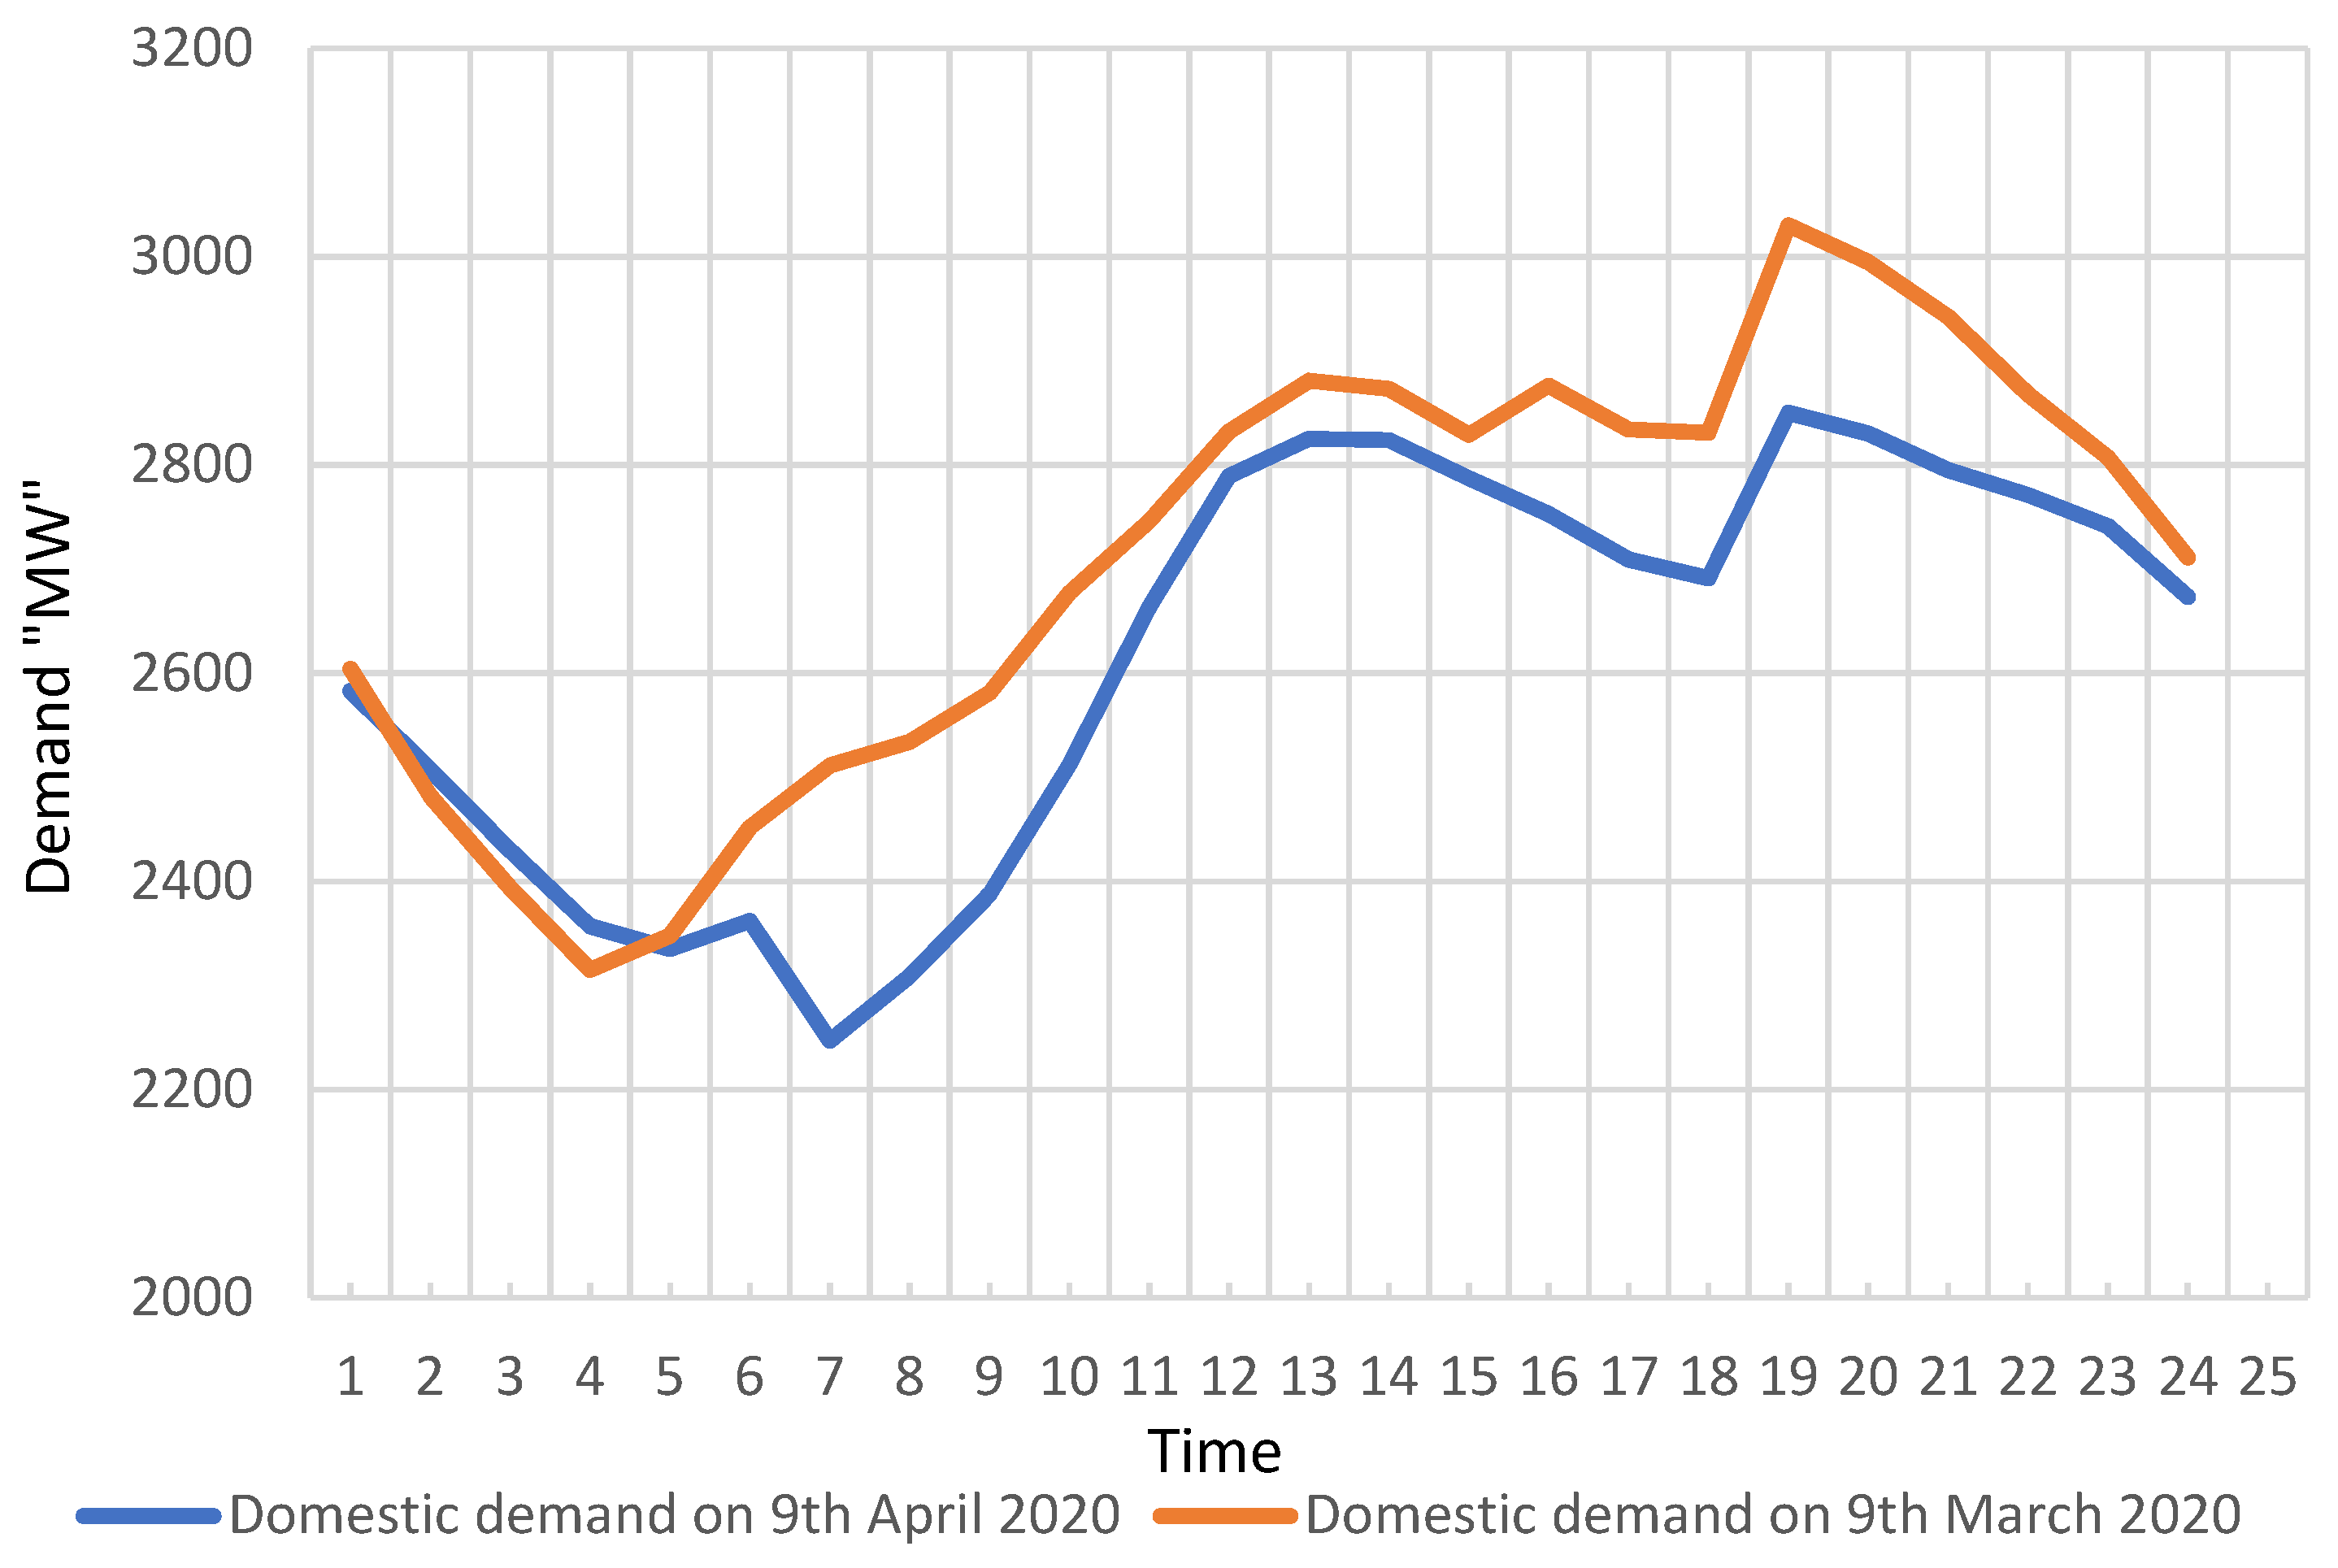
Figure 2 is an example of how the shape of the curve changed with the advent of the pandemic.
The orange plot represents the domestic demand on 9 March 2020, when people started preparing for schools, universities, and offices after 4 a.m., where the demand started increasing. However, this demand decreased in the blue plot (representing the domestic demand on 9 April 2020), after remote working and education started. Regarding the change in the magnitude of demand due to COVID-19, there were difficulties and restrictions on travel and transportation activities. The Planning and Statistics Authority monthly figures for the population within Qatar’s boundaries, at the end of each month, are shown in
Table 1.
The figures do not include:
In 2019, it is notable that the difference between April and July was almost 300,000 people, which is more than 10% of the total population. In 2020, due to the COVID-19 epidemic, there were restrictions on travel and transportation activities, and, therefore, most families spent their summer vacation in Qatar. This was reflected in June and July’s population growths of approximately 6% and 11%, respectively. As a result, the 2020 total peak demand was recorded on 30 July 2020 as 8.6 GW. Moreover, a new domestic peak was recorded on 22 July 2020, equal to 7.32 GW, with 5.6% annual growth. However, the decrease in industrial demand balanced the total demand. Energy consumption increased by more than 5% in July 2020 compared to July 2019 (from 5231 GWh to 5502 GWh). Qatar developed a four-phase plan to gradually normalize life and lift the COVID-19 restrictions. The first phase started on 15 June 2020, when shopping malls, public parks, and some mosques were reopened.
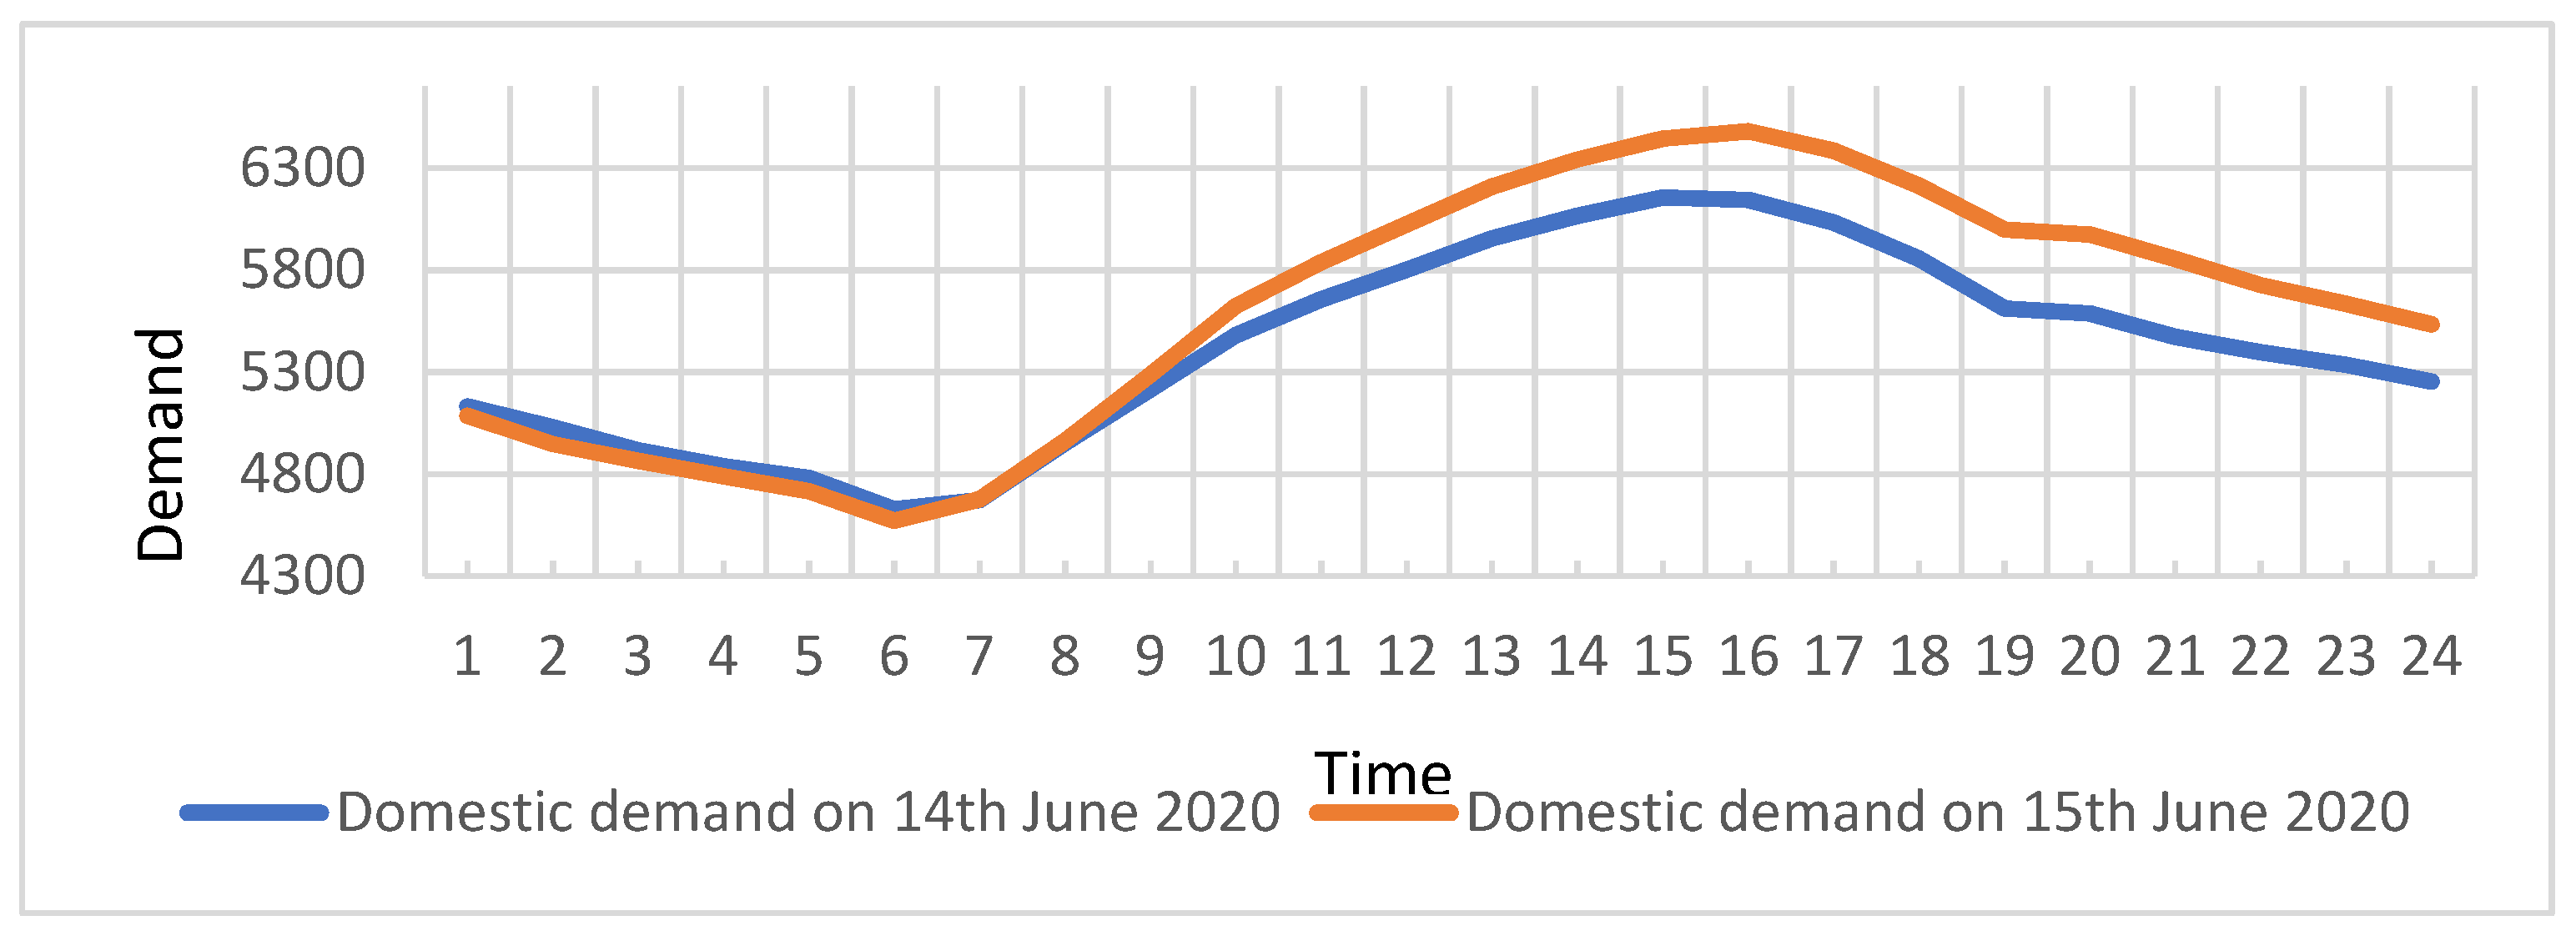
Figure 3 shows the impact of the Phase 1 implementation as the domestic demand increased on 15 June 2020, compared to the previous day.
In
Figure 3, the increase in domestic demand started at 8 am, the time of opening the shopping malls. Further, it is to be expected that the electricity demand will increase in parallel with the four phases. With the signs of a second wave of coronavirus, on the 24 March 2021, Qatar announced a series of restrictions on education, social gatherings, and business activities. The restrictions included closing gyms, spas, swimming pools, and driving schools. In addition, all social gatherings in enclosed places, and weddings, were banned. Moreover, public transport continued to operate at a maximum capacity of 30% during the weekdays and 20% during weekends. Later, on the 1 April 2021, Qatar decided to suspend blended learning and implement distance learning (online) for schools and universities. Qatar imposed new restrictions on 9 April 2021. The restrictions included reducing workplace attendance to 50% capacity, for both government and private sectors. This also included closing beauty and hair salons, cinemas, theatres, libraries, and public museums. In addition, the dine-in service at restaurants and cafés was stopped, and children under 16 years were forbidden from entering malls and markets. On 9 May 2021, Qatar declared a four-phase plan to gradually lift the restrictions, in response to a reduced number of COVID-19 cases. The first phase started on 28 May 2021, and the last phase on 3 October 2021, in which all employees and students returned to their offices, schools, and universities.
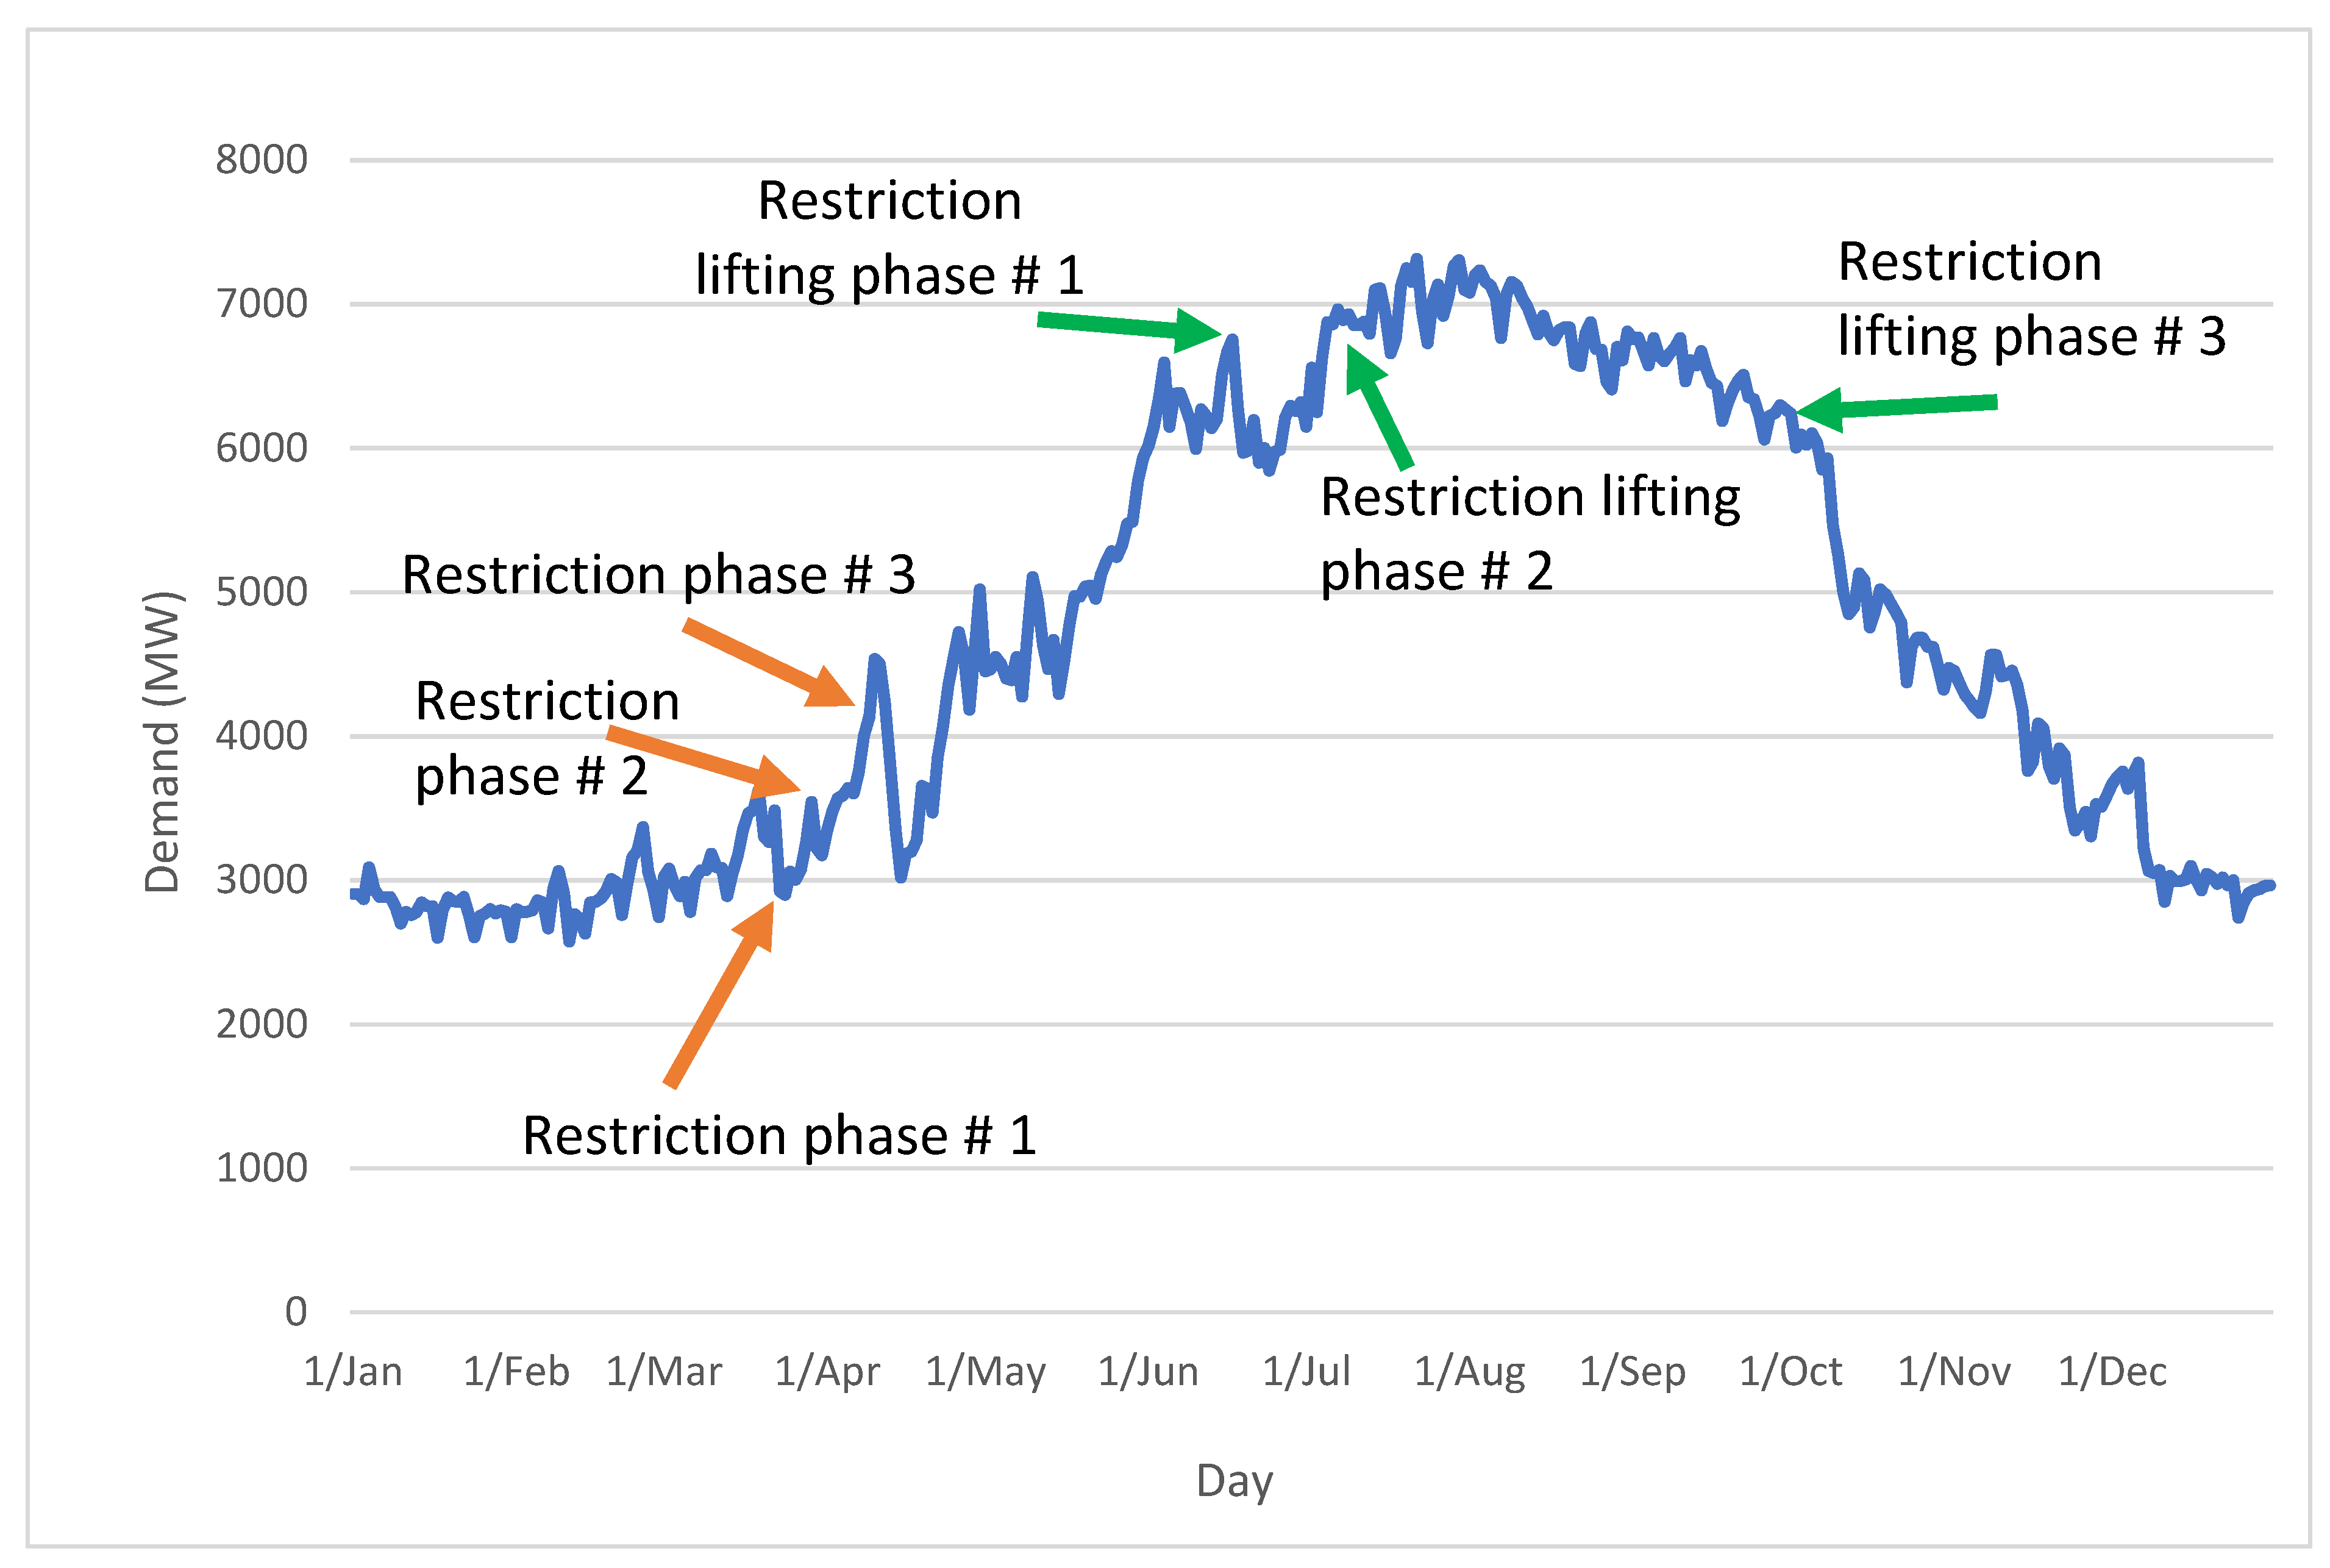
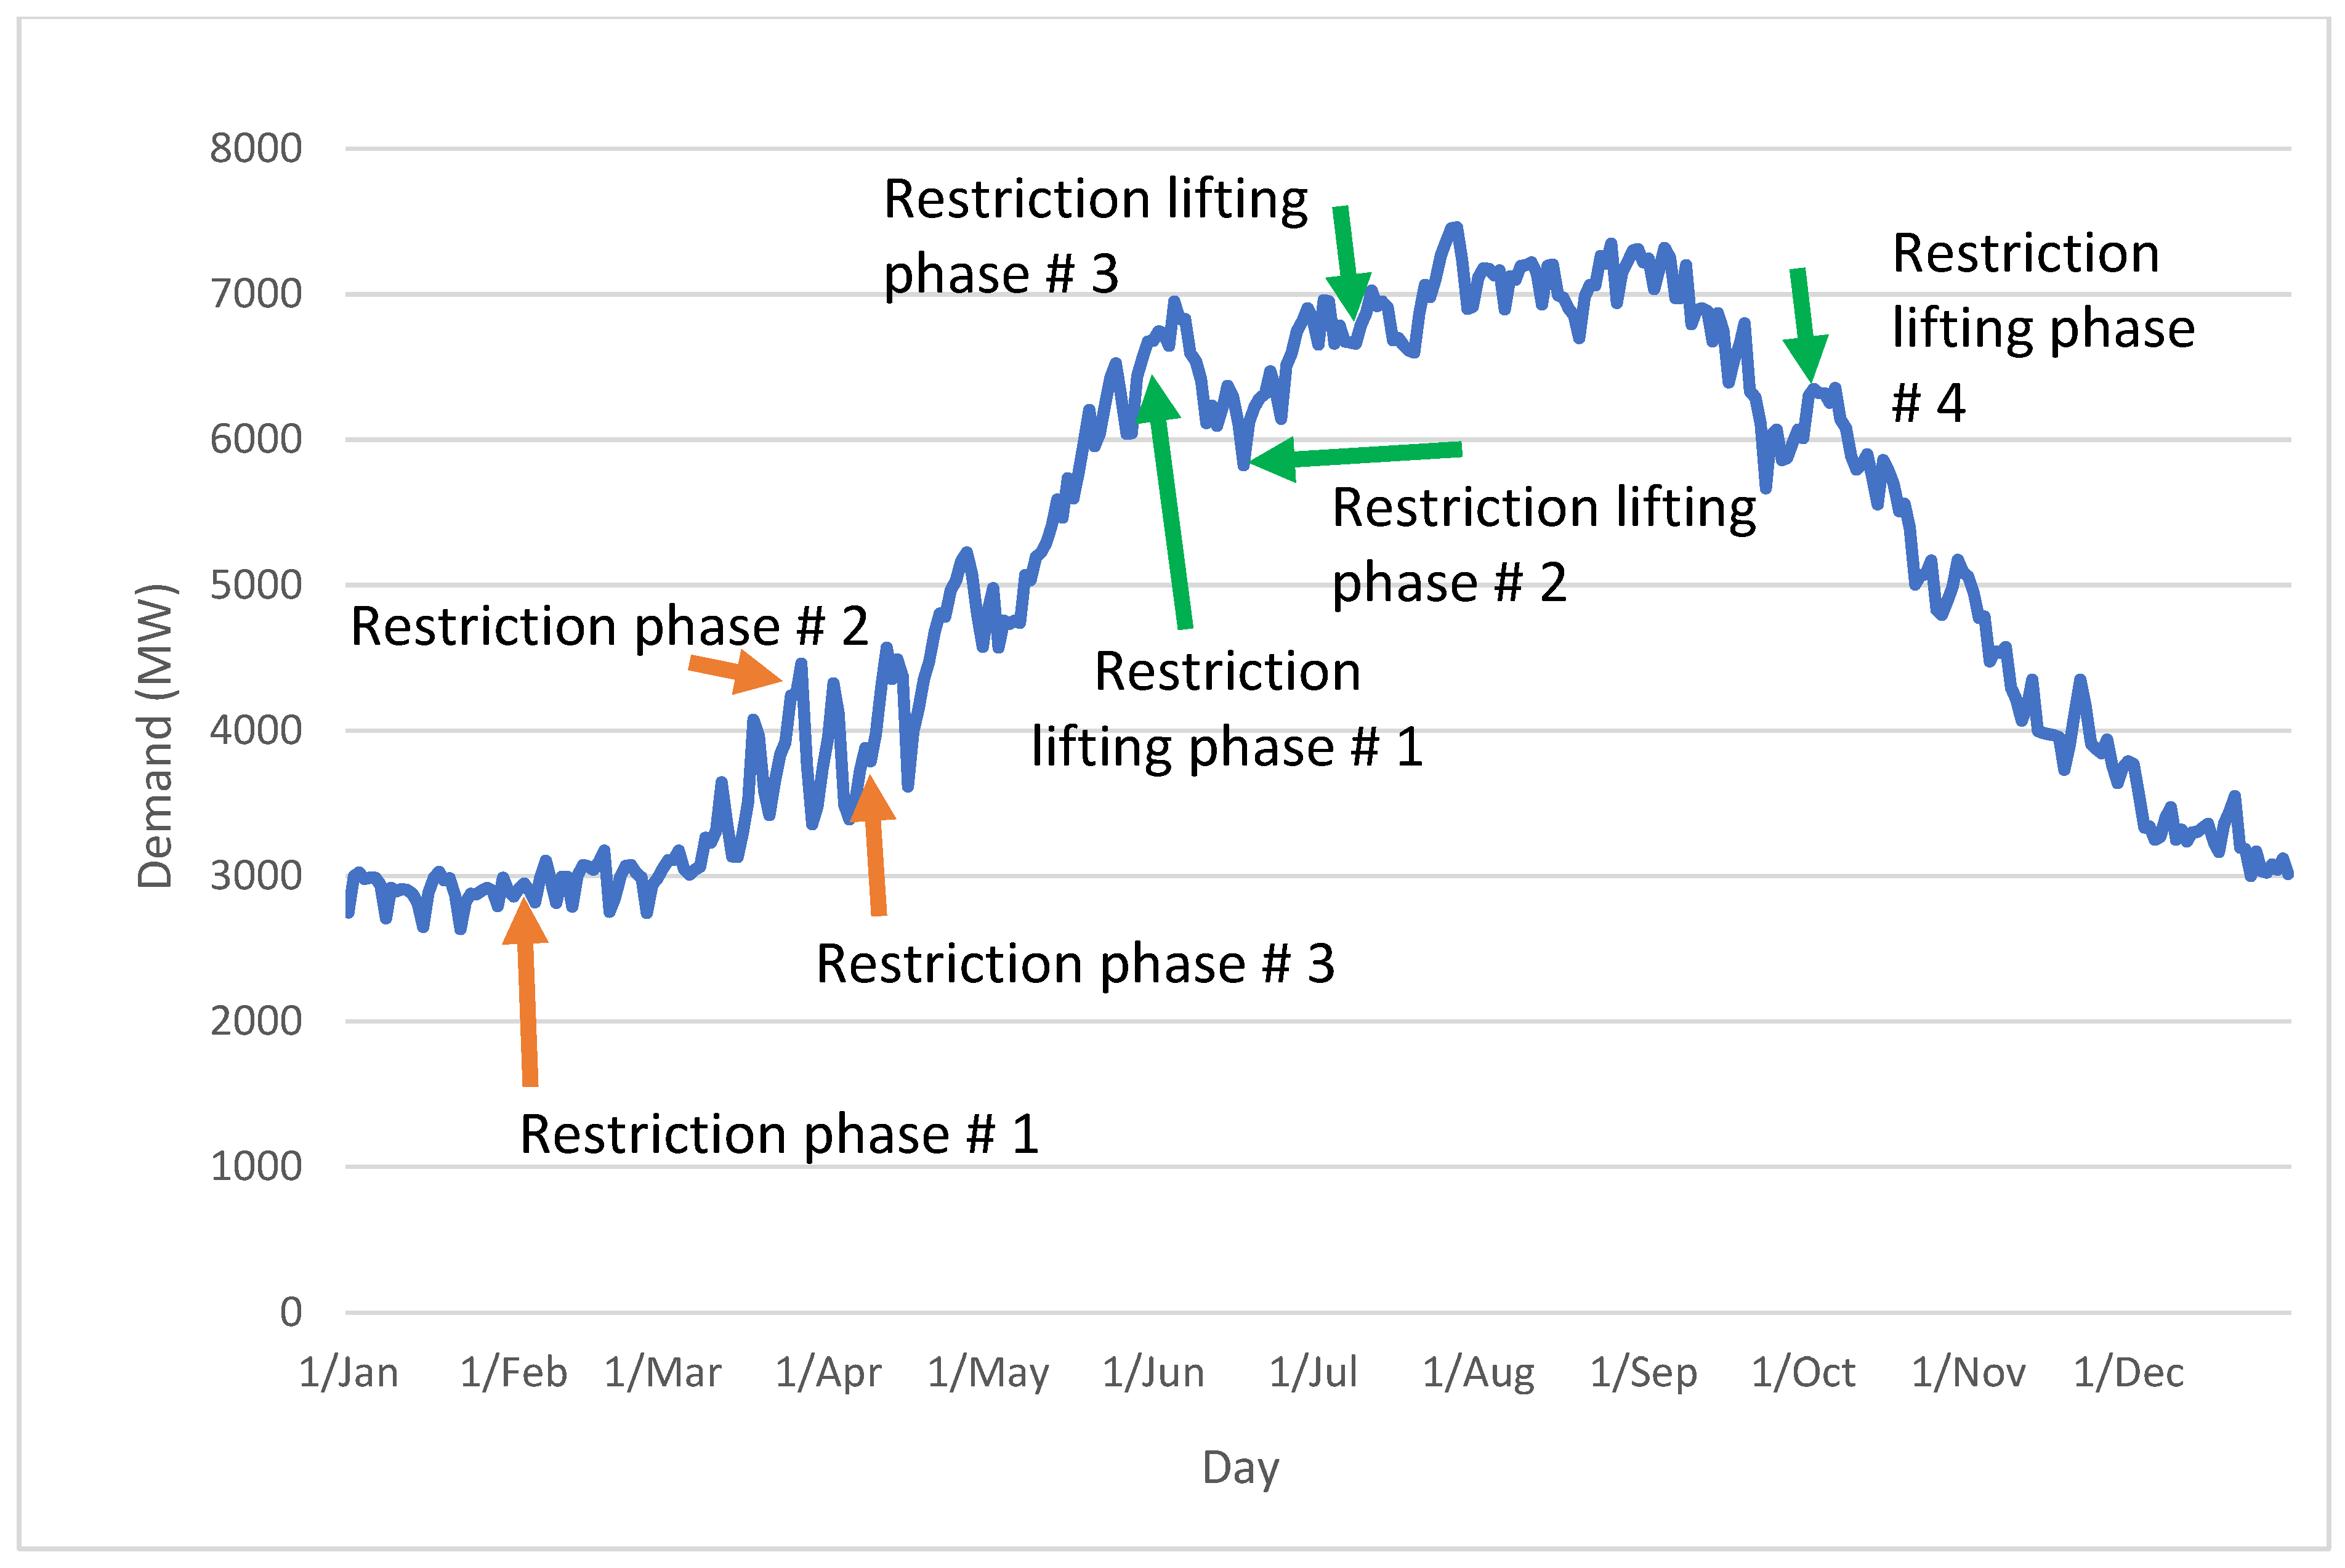
Figure 4 and
Figure 5 show the daily domestic peak for 2020 and 2021, along with the restrictions and lifting phases. The phase effect depends on its measures and actions. Furthermore, seasonality plays a vital role in the phases’ impact. In Qatar, as with the whole world, the severity of restrictions was less for the third (Omicron) wave.
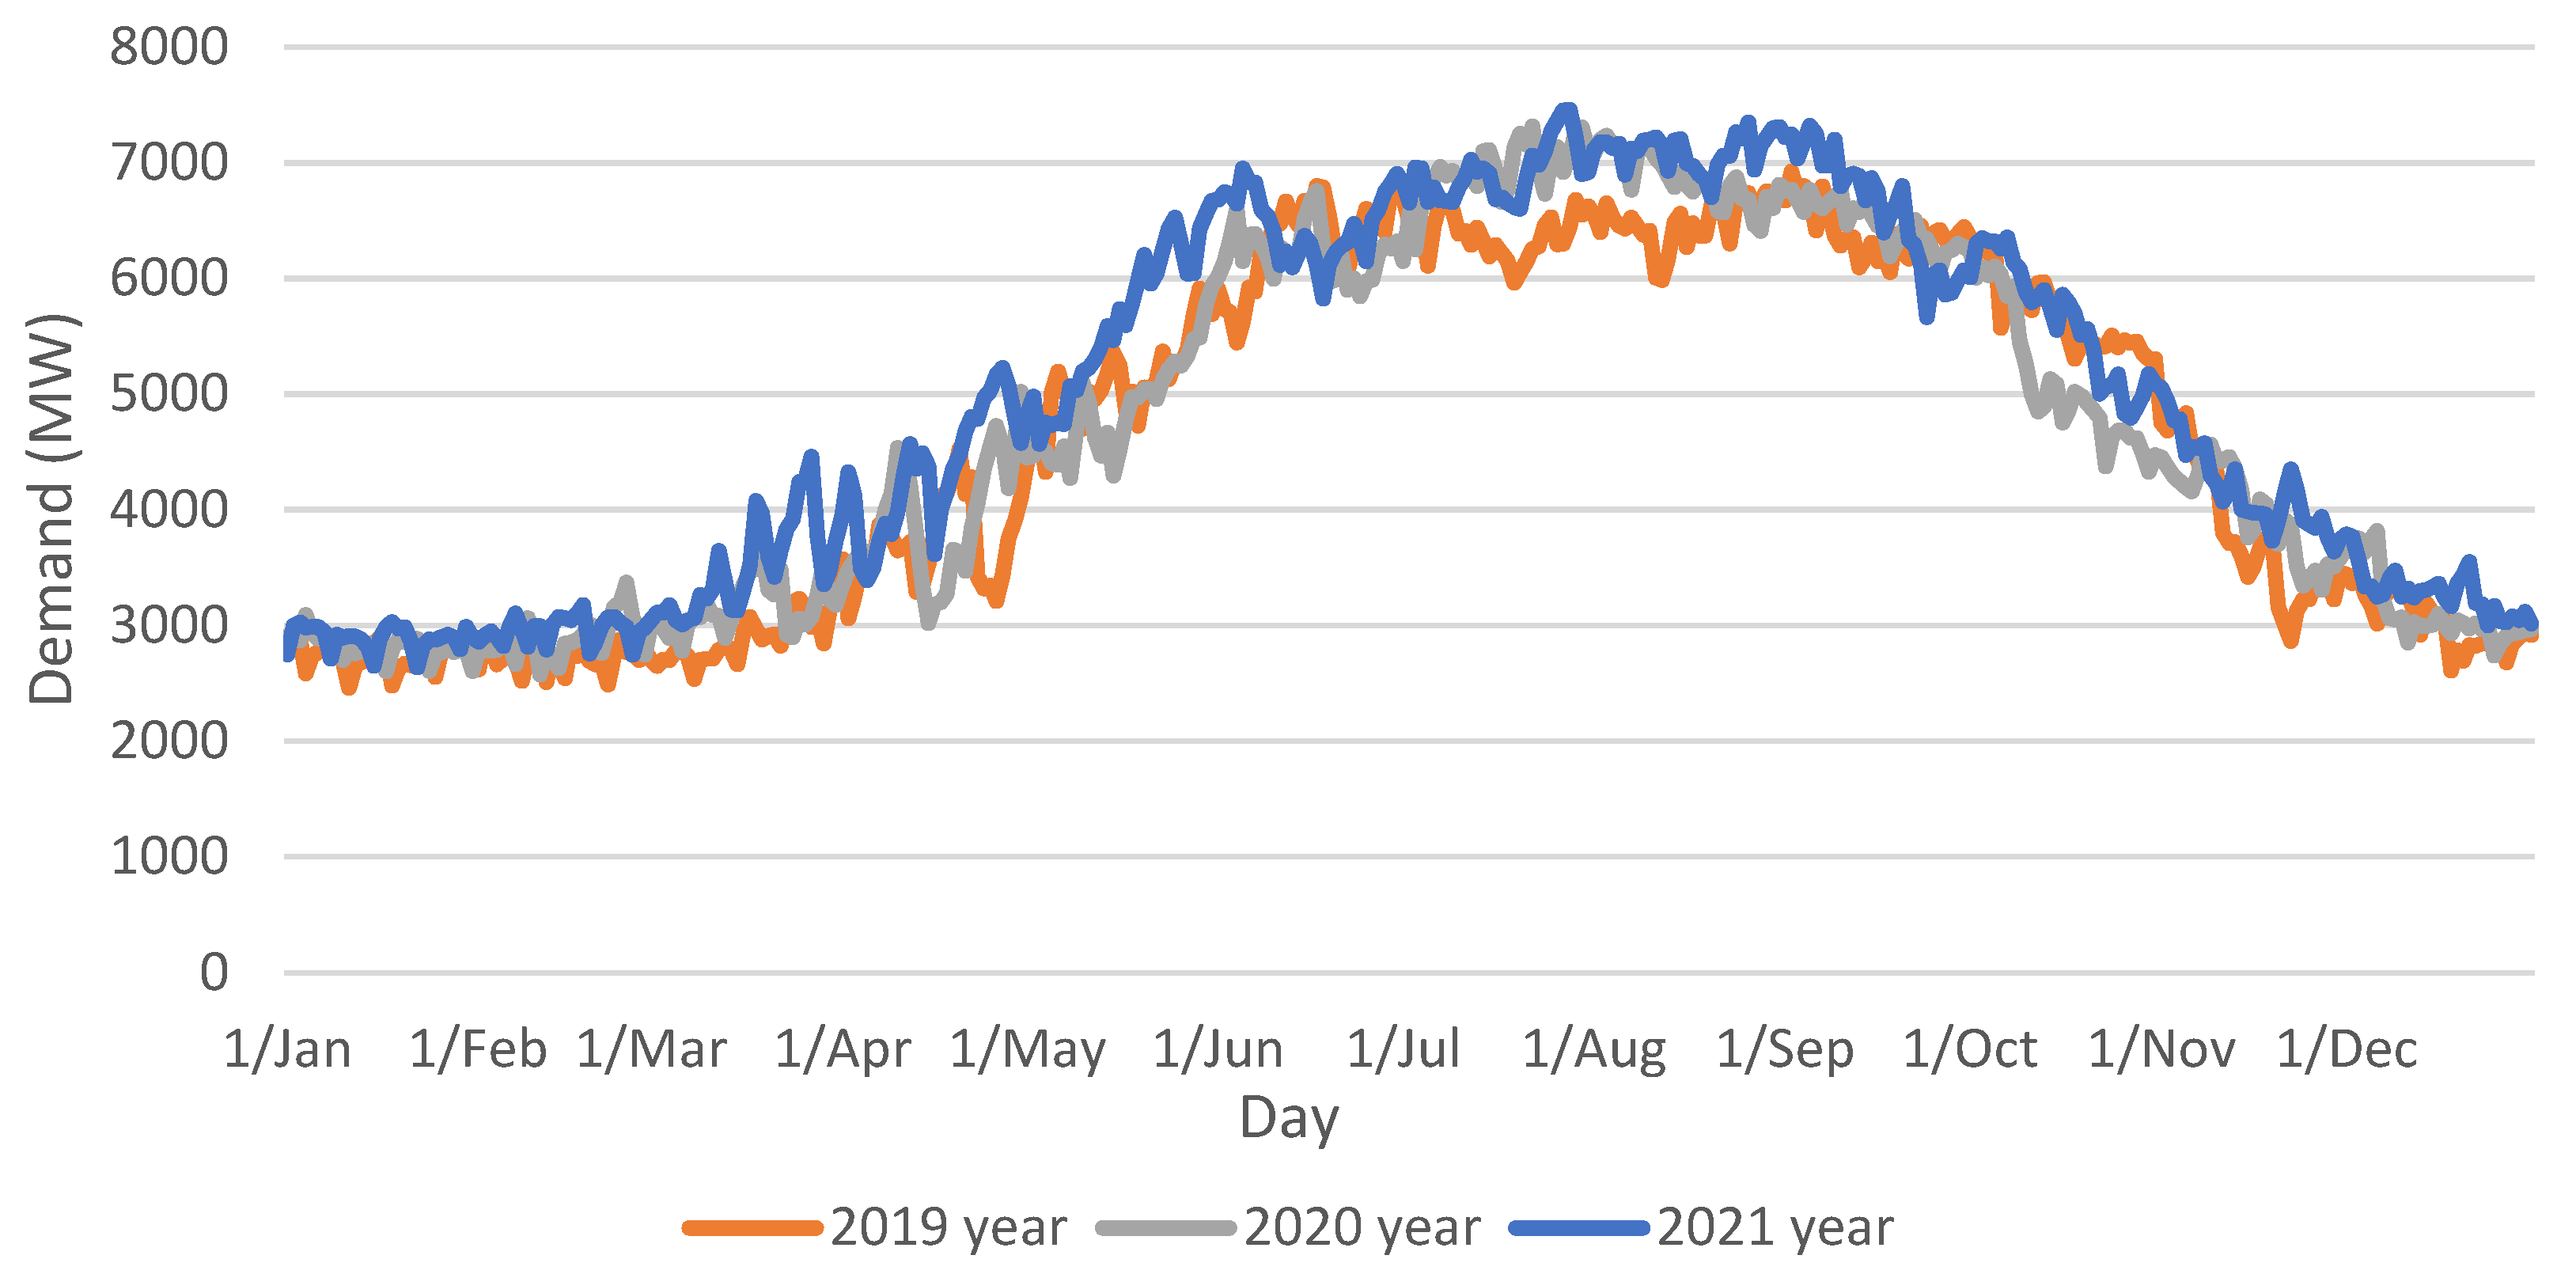
Figure 6, below, shows the daily domestic peak for 2019, 2020, and 2021. A Kruskal–Wallis H test showed a statistically significant difference in domestic electricity peak demand between the three years, with a mean rank score of 499.29 for Year 1, 541.88 for Year 2, and 602.83 for Year 3. This confirms that 2019 had a lower domestic electricity peak than 2020 and 2021, indicating that the domestic electricity peak increased during COVID-19. Two-sample Kolmogorov–Smirnov tests, between each pair of years, were performed to see whether there was a statistical difference between the distributions for each year. The results show that the distribution of domestic electricity peaks for the years (2019 and 2020) and (2019 and 2021) are unequal. However, the distribution functions for the years (2020 and 2021) are equal. This shows a clear impact of the Covid pandemic on the domestic electricity peak.
Table 2 summarizes the impact of COVID-19′s response measures on the domestic electricity peak demand. This is done by comparing the demand during the COVID-19 period with the previous period’s demand, using SPSS software. Once the attendance of 30% of school students’ measure was implemented, the domestic peak demand increased by 28.3%. Furthermore, implementing the 20% and 80% employee attendance measure caused increases in the domestic electricity peak of 29.8% and 10.5%, respectively.
The impact of the month of Ramadan (Hijri year), and the closing of shops, museums, parks, mosques, and restaurants, were statistically examined and were found to be insignificant, as compared with the response measures outlined in
Table 2.
3. Domestic Electricity Peak Demand Forecasting
In this paper, data on electrical energy demand and the number of electricity meters were obtained from KAHRAMAA. The population and GDP data were obtained from the Qatar Planning and Statistics Authority [
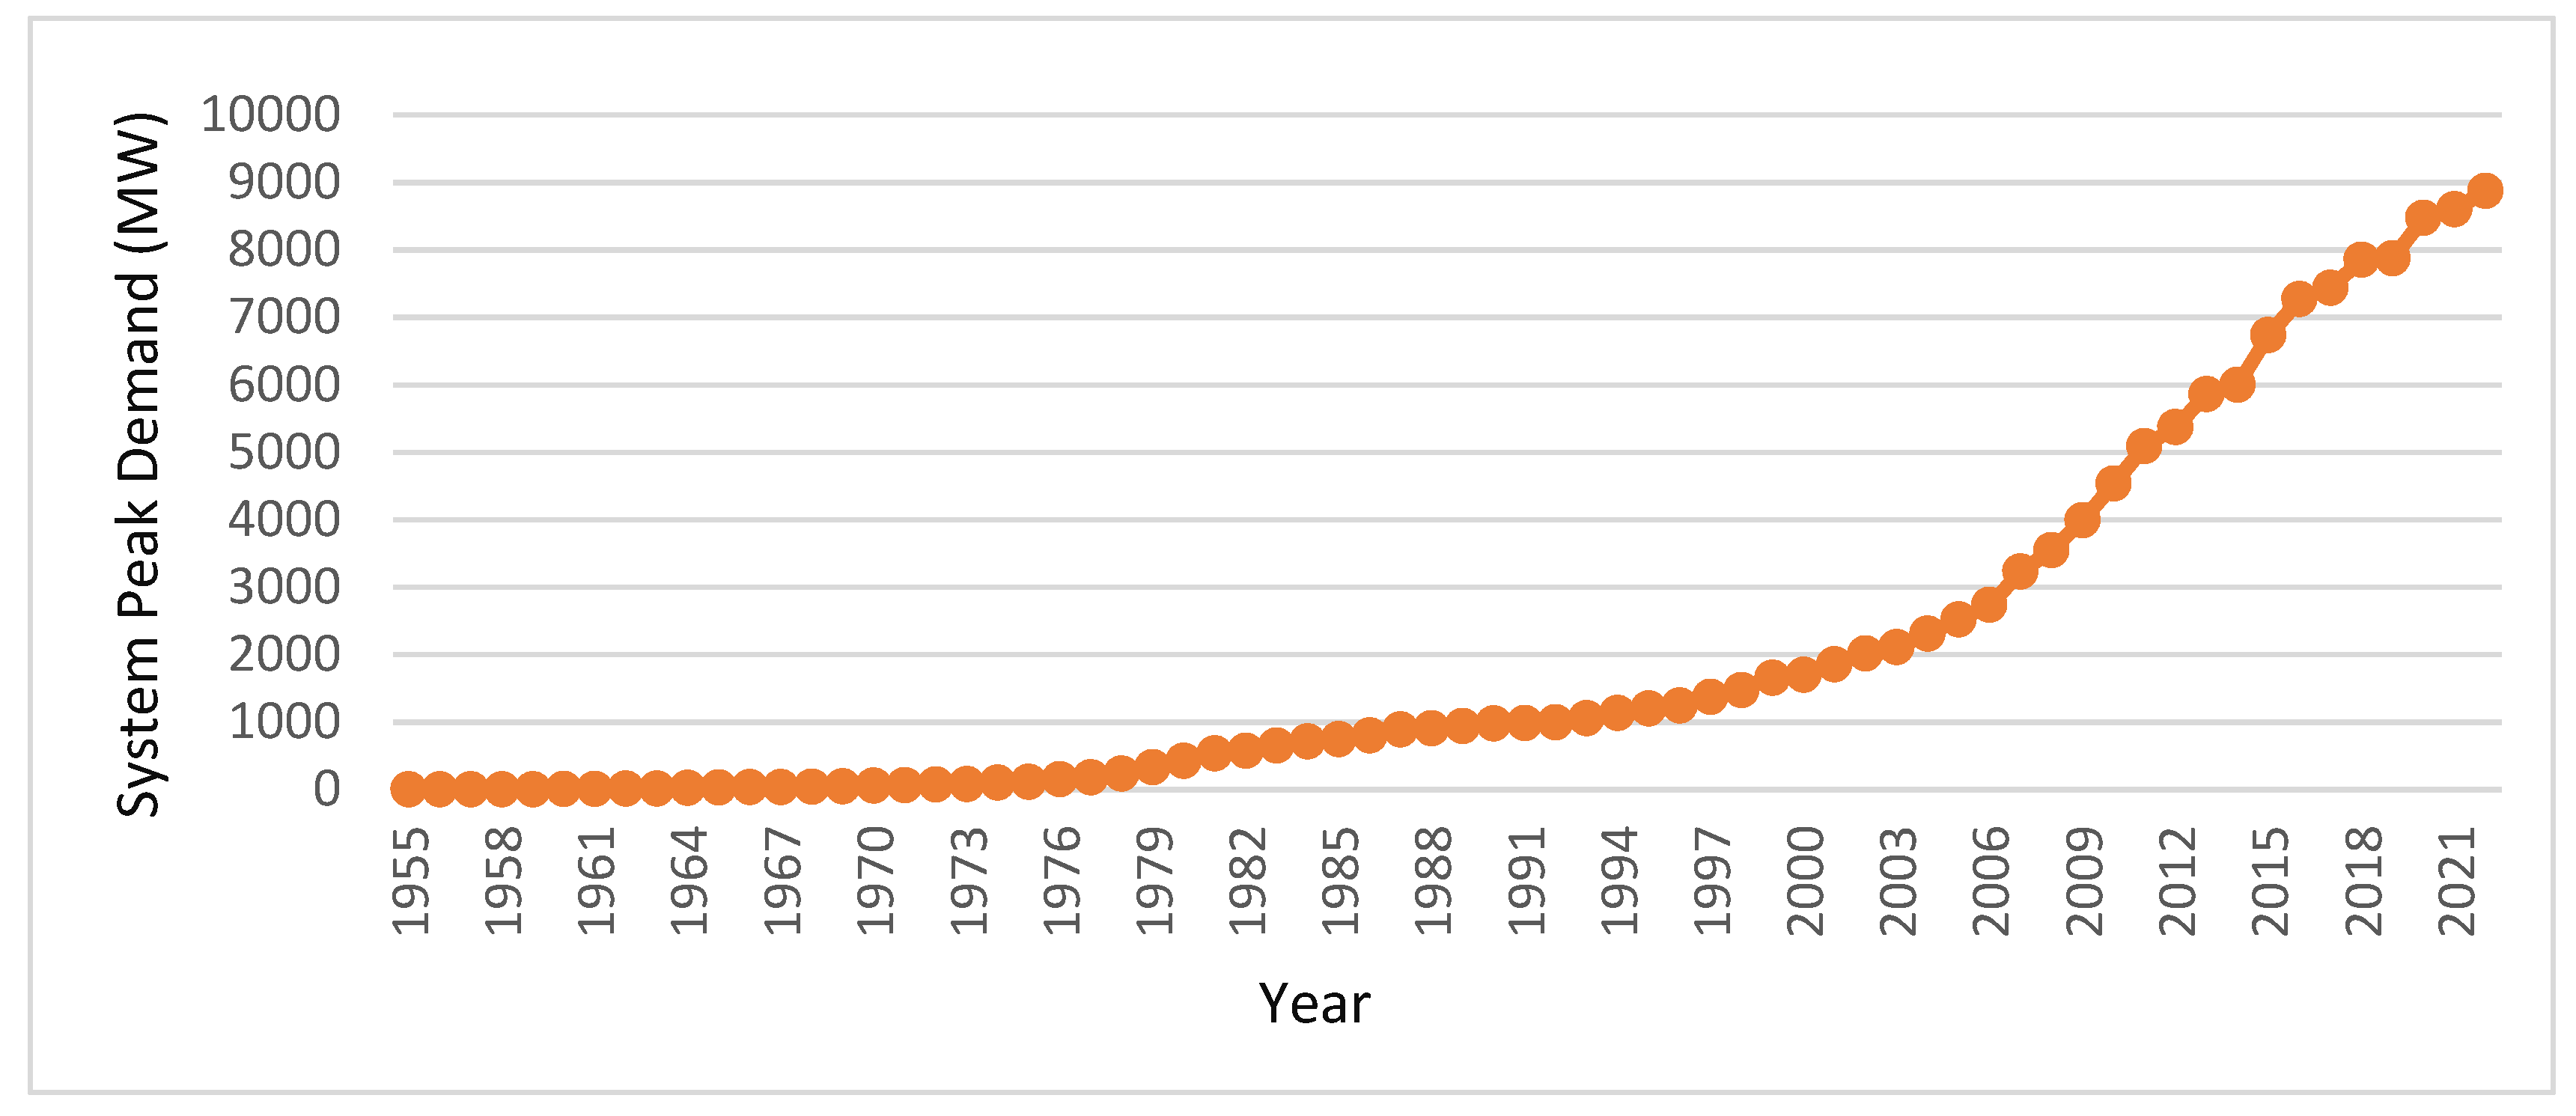
25]. As the focus here is to forecast energy demand for the domestic sector, the discussion on peak demand relates only to the domestic sector.
Figure 7 shows a sharp rise in system peak electricity demand from the year 2000. This could be mainly due to the development path that Qatar has adopted over the past two decades, to increase its GDP from both oil and non-oil sectors.
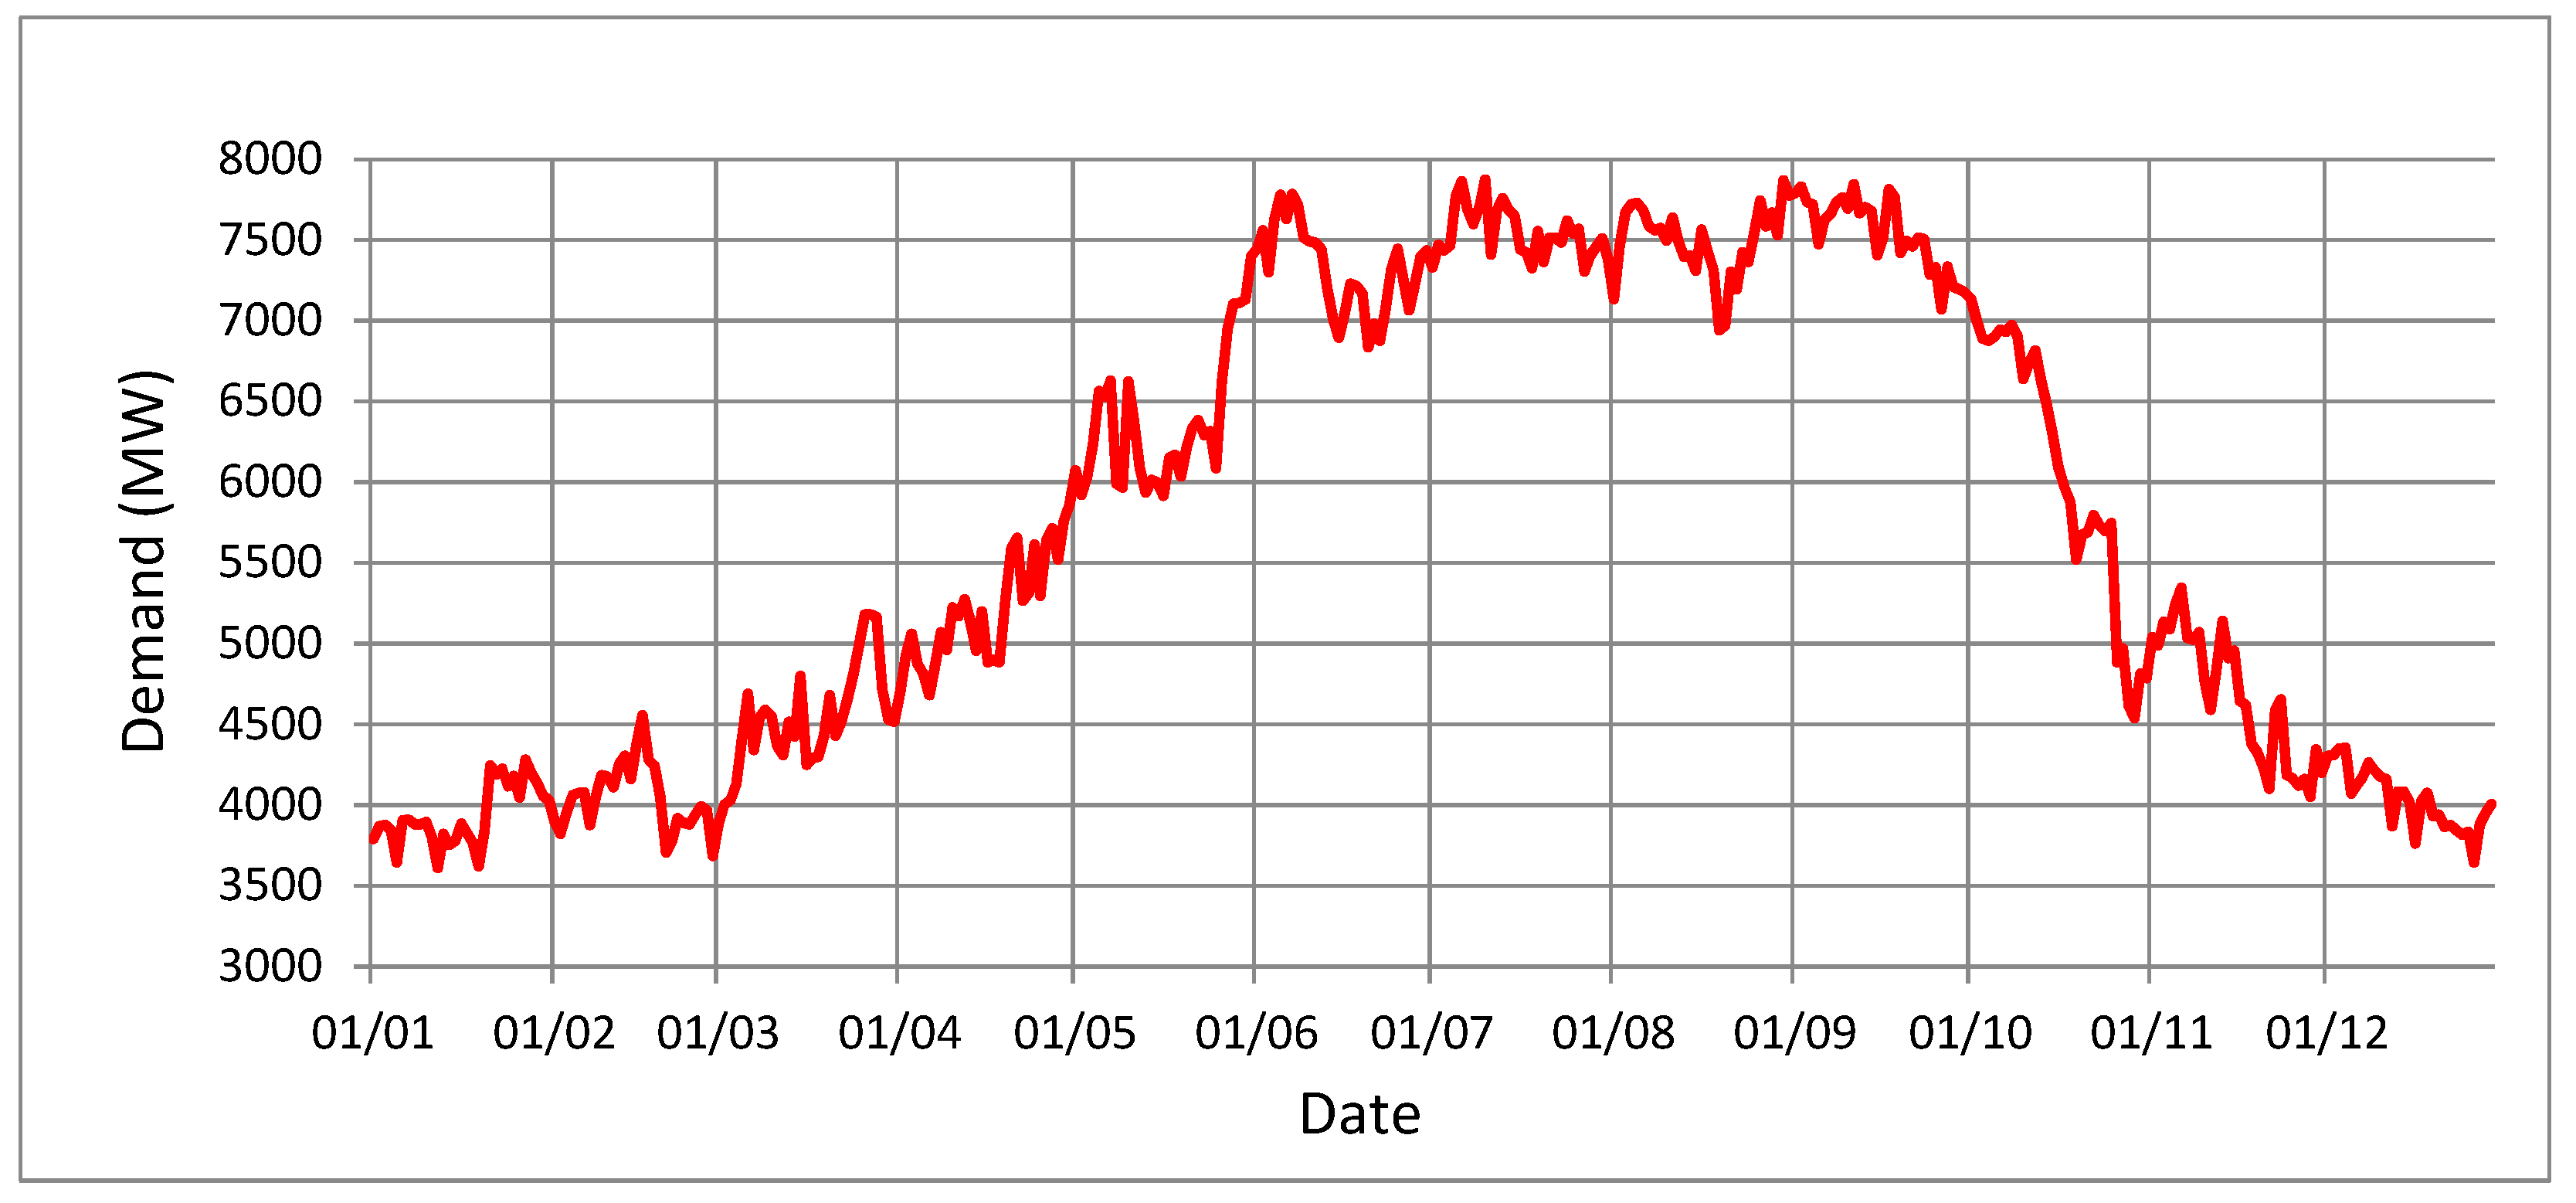
Figure 8 shows the changes in electricity demand throughout 2018. There is a considerable difference in system peak demand between the winter and the summer months, which is expected, given Qatar’s hot summers, when a massive air-conditioning load is required. This also shows that the baseload during the summer months is almost double that during the winter, indicating that space conditioning is the most crucial electricity-consuming end-use in Qatar.
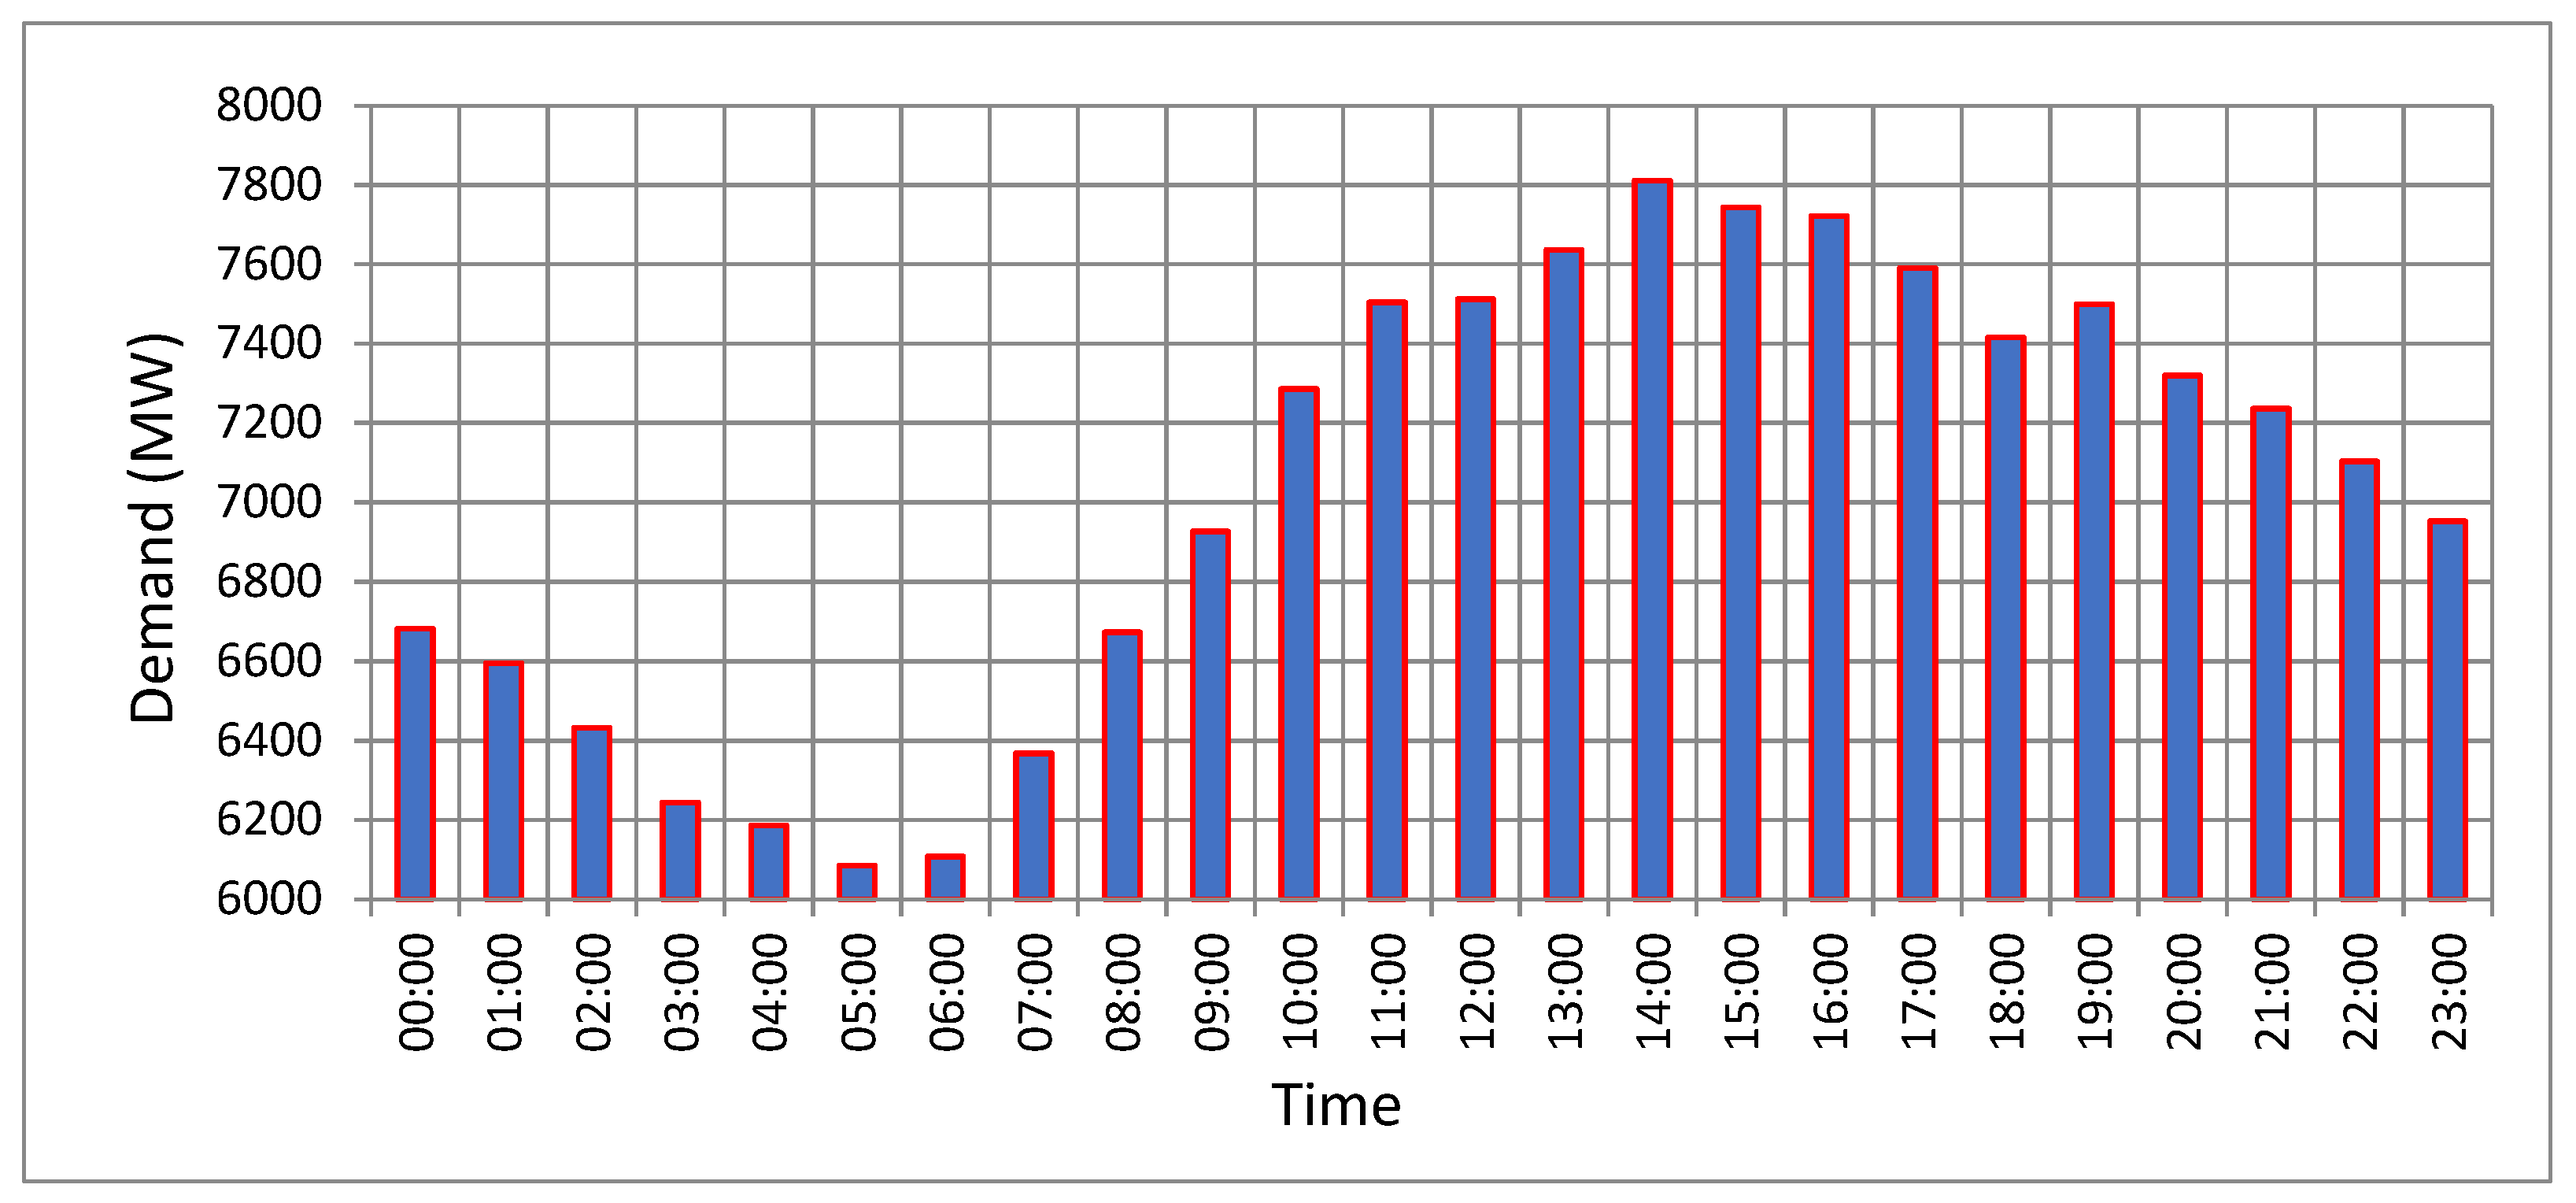
Figure 9 shows how the electricity demand changes throughout the day in a typical summer month (July in this case). The graph shows that the load demand rises quickly as the day progresses and peaks during the day’s hottest hours. The daily baseload is almost 4 GW, rising to higher levels during the day because of office and commercial sector electricity use and industrial electricity use.
From the above, it is notable that electricity demand changes through years, months, days, and hours. Regarding the domestic demand, peak demand grew from 1.8 GW in 2001 to 7.3 GW in 2020. Data show that in the past 20 years, the domestic peak electricity demand has grown by more than 350% in Qatar, attributed to Qatar’s rise in population. The massive influx of residents working in other economic sectors could be one of the main reasons for this demand. Therefore, in the following demand assessment, population size is considered one of the independent variables for the rise in domestic peak demand.
Table 3 shows Qatar’s historical electricity domestic peak demand, population, GDP, and the number of electricity meters between 2006 and 2020. Qatar’s population and GDP are growing at significant rates, due firstly to the influx of non-Qatari employees in the country, and secondly, to the government’s increasing effort to invest in the oil and gas sector, and other infrastructural and service projects. The expectation is that electricity demand will grow in the future.
GDP is an indirect measure of the population’s average affluence and activity, supported by other sectors such as commerce, agriculture, government, transport, and industry. As activity grows, GDP also starts to increase. Aware that it has an industrial impact, it is also assumed that the overall GDP will impact overall and sectoral electricity demand [
26]. A constant GDP, with an increase in population, will generally mean decreasing the overall income of the population. Therefore, in this analysis, GDP is used as a proxy for economic growth that requires electricity as one of the main ingredients. Based on the above discussion, GDP is another independent variable for assessing peak electricity demand. The domestic peak electricity demand models for load forecasting are developed based on historical data of: domestic peak demand, population, GDP, and the number of electricity meters over 15 years (2006–2020). The population and GDP data forecasts were obtained from the International Monetary Fund (IMF) Country Report No. 18/135 [
27].
The regression analysis determines the relationship between dependent and independent variables [
28,
29]. The dependent variable is the single variable being explained by the regression. The independent variables are used to explain the dependent variable [
30]. This paper outlines developing a combined forecasting regression model using Minitab software. The developed model is a multiple linear regression model, based on population, GDP, and the number of electricity meters.
The developed model is given by Equation (1):
The coefficients of correlation between the domestic electricity peak demand and the independent variables are shown in
Table 4.
To measure the forecast error for the developed model, the domestic electricity peak demand will be calculated for the year 2021 and compared with the actual value.
By having the values for the year 2021 and using (1):
The actual value of the domestic electricity peak demand for the year 2021 is 7460 MW.
Mean Absolute Percentage Error (MAPE) is used when errors need to be put into perspective. For example, an absolute error of 1 in a forecast of 10 is substantial, relative to an absolute error of 1 in a forecast of 2000, which is insignificant [
11]. The MAPE is calculated as given in Equation (2):
Therefore, MAPE = ((7460 − 7334)/(7460)) × 100 = 1.68%
It is notable from the previous section that there is a direct and strong relationship between domestic electricity peak demand and population, GDP, and the number of electricity meters.
It is necessary to mention that the forecast error was calculated based on one year’s forecast only, which is 2021. Therefore, in future work, the forecast error should be calculated for five years, from 2021 to 2025, to better evaluate the developed model.
4. Conclusions
COVID-19 has affected all life sectors worldwide, electricity demand being just one of these sectors. This paper discusses the impact of the COVID-19 pandemic on Qatar’s electricity demand and forecasting. This study collected historical data of Qatar’s electricity demand, population, and GDP, along with information on COVID-19 restrictions. Statistical analysis was used to unfold the impact of the COVID-19 pandemic. Notably, the restrictions and actions taken had an impact on electricity demand. Students’ and employees’ attendance are the restrictions that most impact electricity demand. Attendance of 30% of school students caused an increase of approximately 28% of the domestic peak. This increase was due to the high use of electrical appliances at home. As a result, the performed analysis will help assess and evaluate the impact of future measures, due to new diseases, such as monkeypox, and mega-events, such as the FIFA World Cup 2022.
For the developed forecasting model, the absolute forecast error percentage equals 1.68% for the year 2021. This accuracy is consistent with the calculated coefficient of correlation, R, representing the strength of the linear relationship between the variables. However, due to the COVID-19 pandemic, the impact on electricity demand and its forecasting will be noted after the end of the crisis and its immediate consequences. Therefore, in other waves of coronavirus, or new pandemics, medium-term and long-term electricity forecasts will have to be revised, to take into consideration the updated situations and plan for the demand increase.
The pandemic has different waves. Currently, we are in a new wave, and some restrictions have, again, been implemented. Future work will analyze and study the impact of the new waves’ restrictions.


