
Development of the Circular Product Readiness Method in Circular Design


Abstract
:1. Introduction
2. Background
- -
- The first concerns the method’s output, which is intended to help differentiate between readiness levels. Readiness can be defined as an “individual’s attitude toward a particular change”, which is influenced by dimensions—e.g., concerning the content, process, context, and people—relevant to the topic at hand [18]. For the method to reflect readiness, it needs to indicate the level of implementation of a circularity aspect, grading this at one of a set of appropriate predefined levels [18].
- -
- -
- The third is to attune the method to designers. This can be addressed by using product design semantics to evaluate circular design, i.e., to evaluate design’s qualities expressed in product functions and the way it interacts with its (social) environment [20].
- -
- The fourth seeks method completeness; it has to cover a complete range of design factors, from strategy to recovery, in detail. The design process is sequential in nature and each phase carries important decisions that influence adjacent phases. This underpins the importance of front to end alignment and having clearly defined, distinctive phases, such as strategic design, embodiment design, service design, and recovery [16,21,22].
- -
- The fifth requires a method that can easily be applied to any industry, including in-company ease-of-communication, as well as communication with supply chain partners [23]. This requires a format which fits with the content and facilitates time-efficient use.
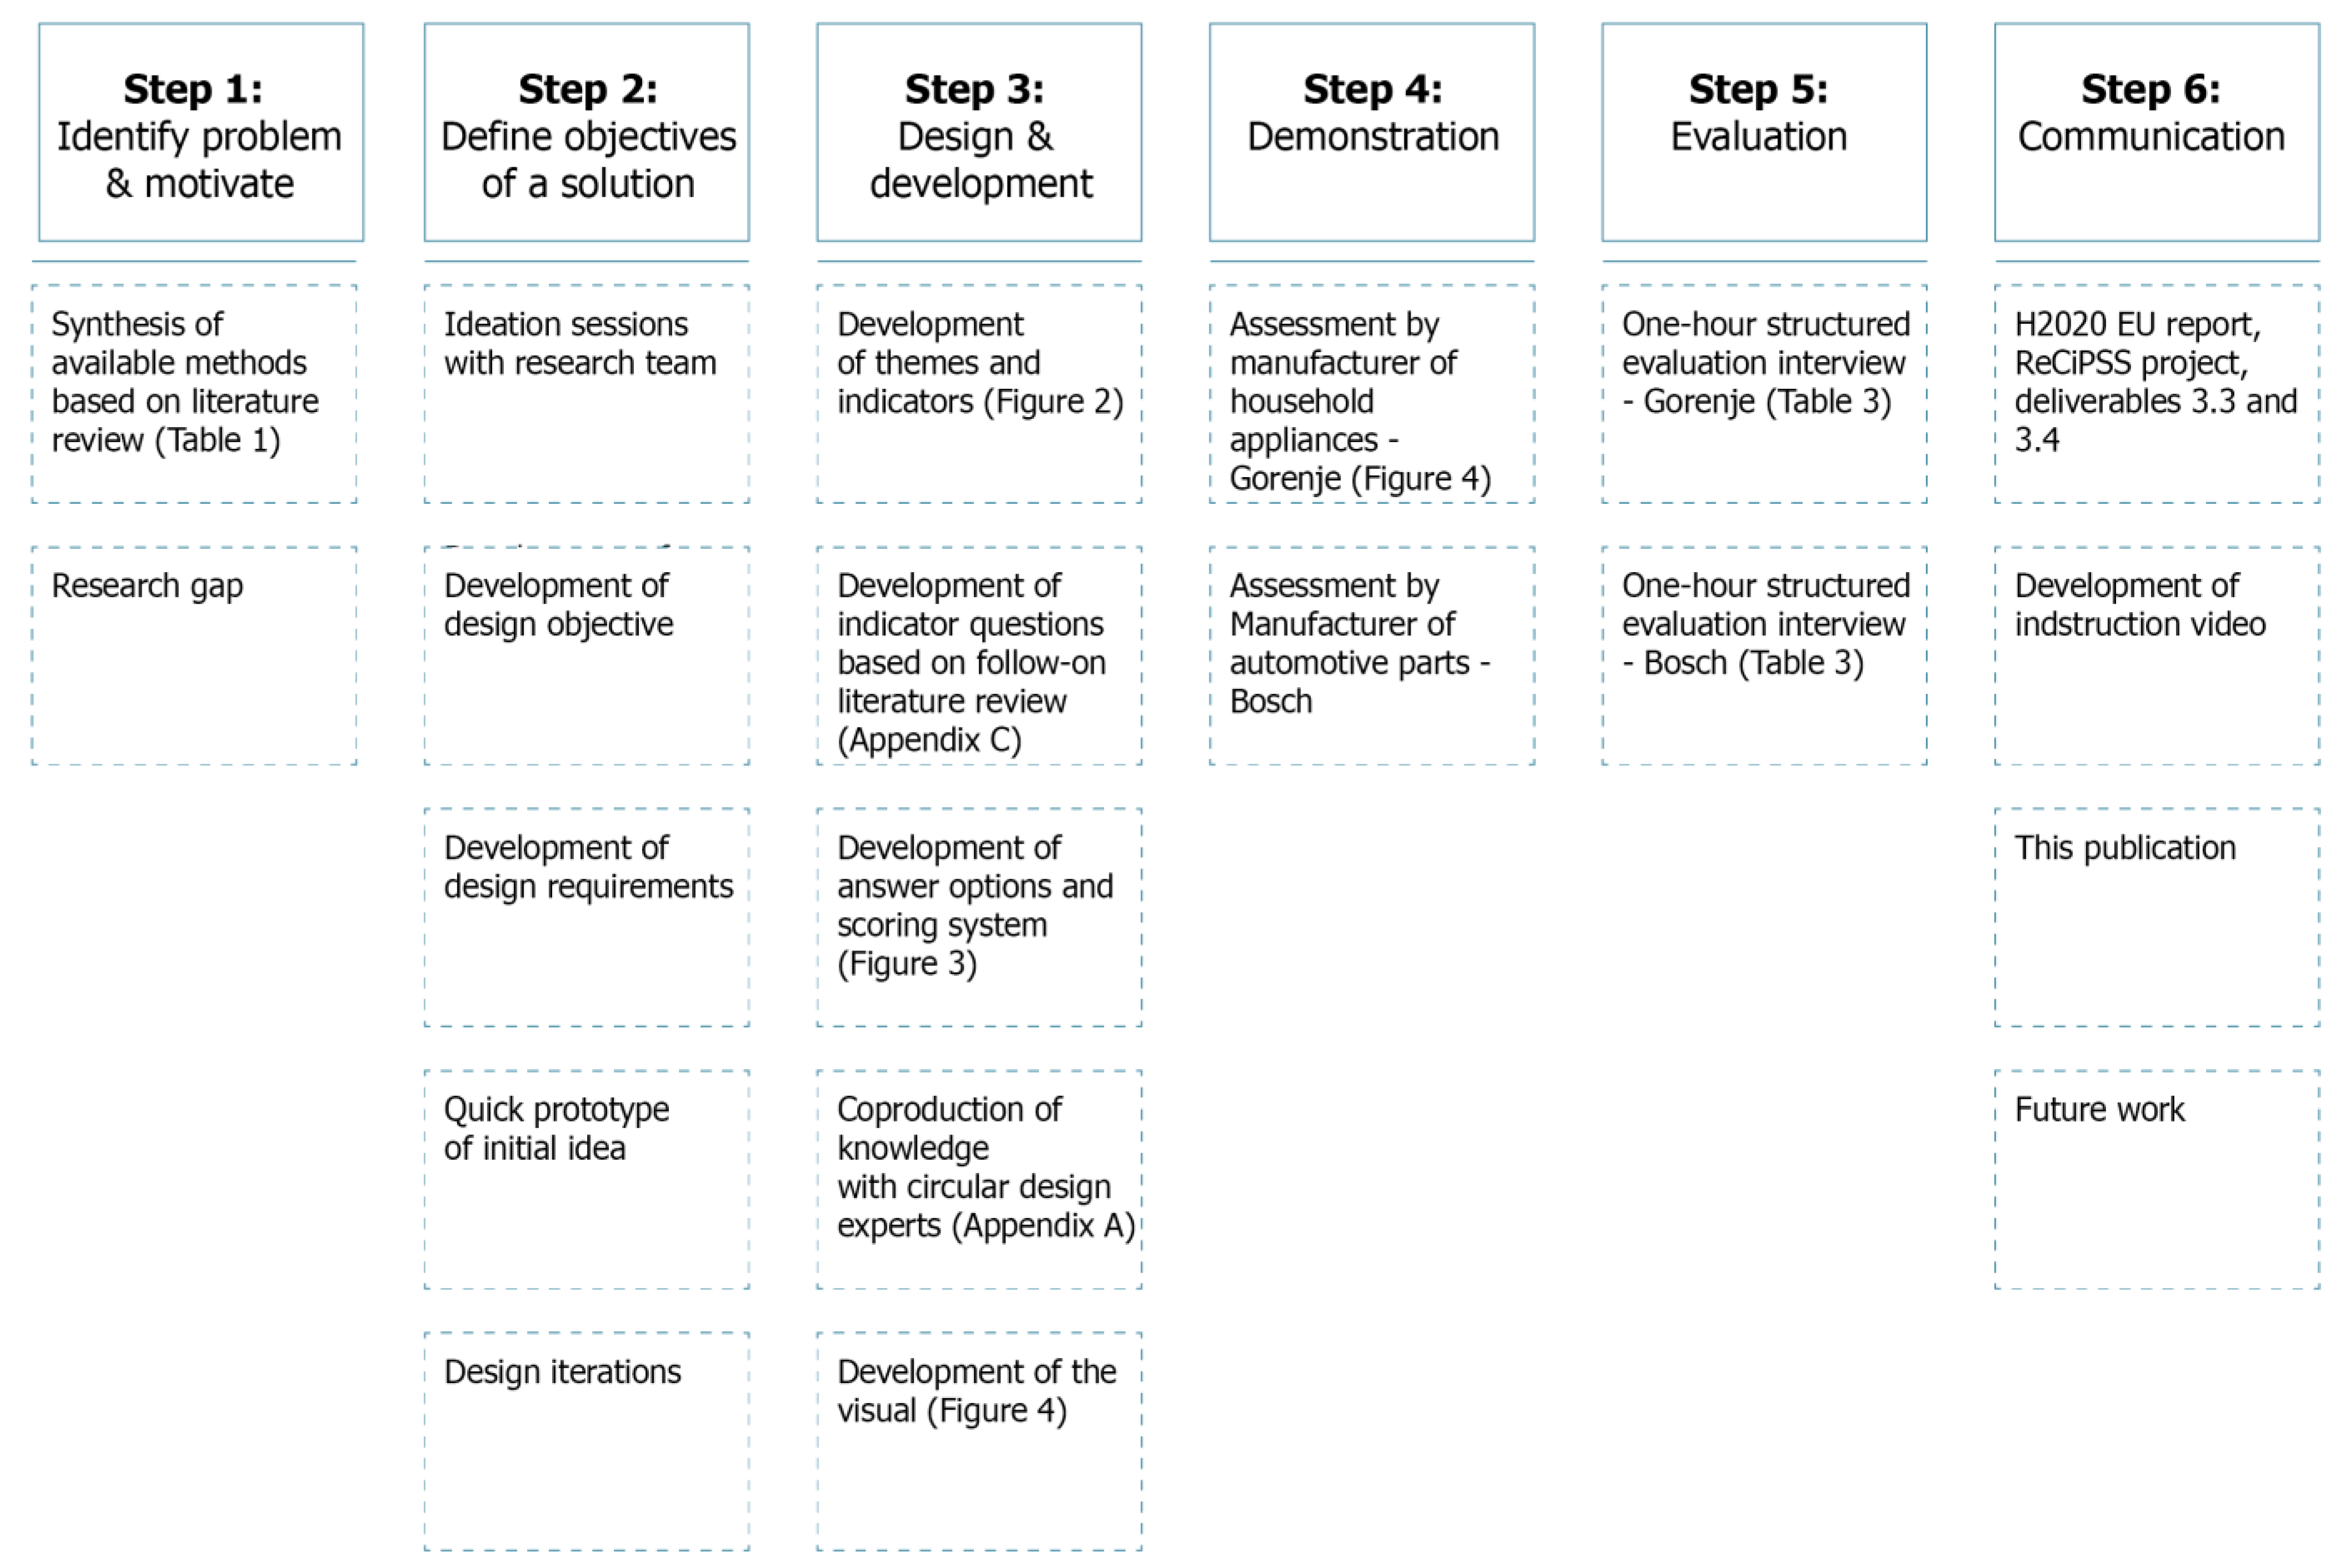
3. Research Design

| Content Requirements | Explanation | References |
|---|---|---|
| Reliability | The method outcomes remain consistent for entries by different user within the same company. | [6,29] |
| Construct validity | The extent to which the indicator method actually measures circular design maturity as opposed to generic design management capabilities or circularity of material flows. | [19,29,30] |
| Content validity | The indicators fully cover all aspects that influence the maturity of circular design. | [29] |
| Comprehensibility | The indicators are understandable, meaningful, simple, and are easy to interpret for the representatives of designers and their wider team. | [19,30,31] |
| Operationability | The extent to which the indicator method is actionable and the outcomes controllable, by the way the format aligns with ongoing design activities and how the outcomes fit the decision structure. | [19] |
| Transversality | Applicability across different industries. | [3] |
4. Development of the Circular Product Readiness Method
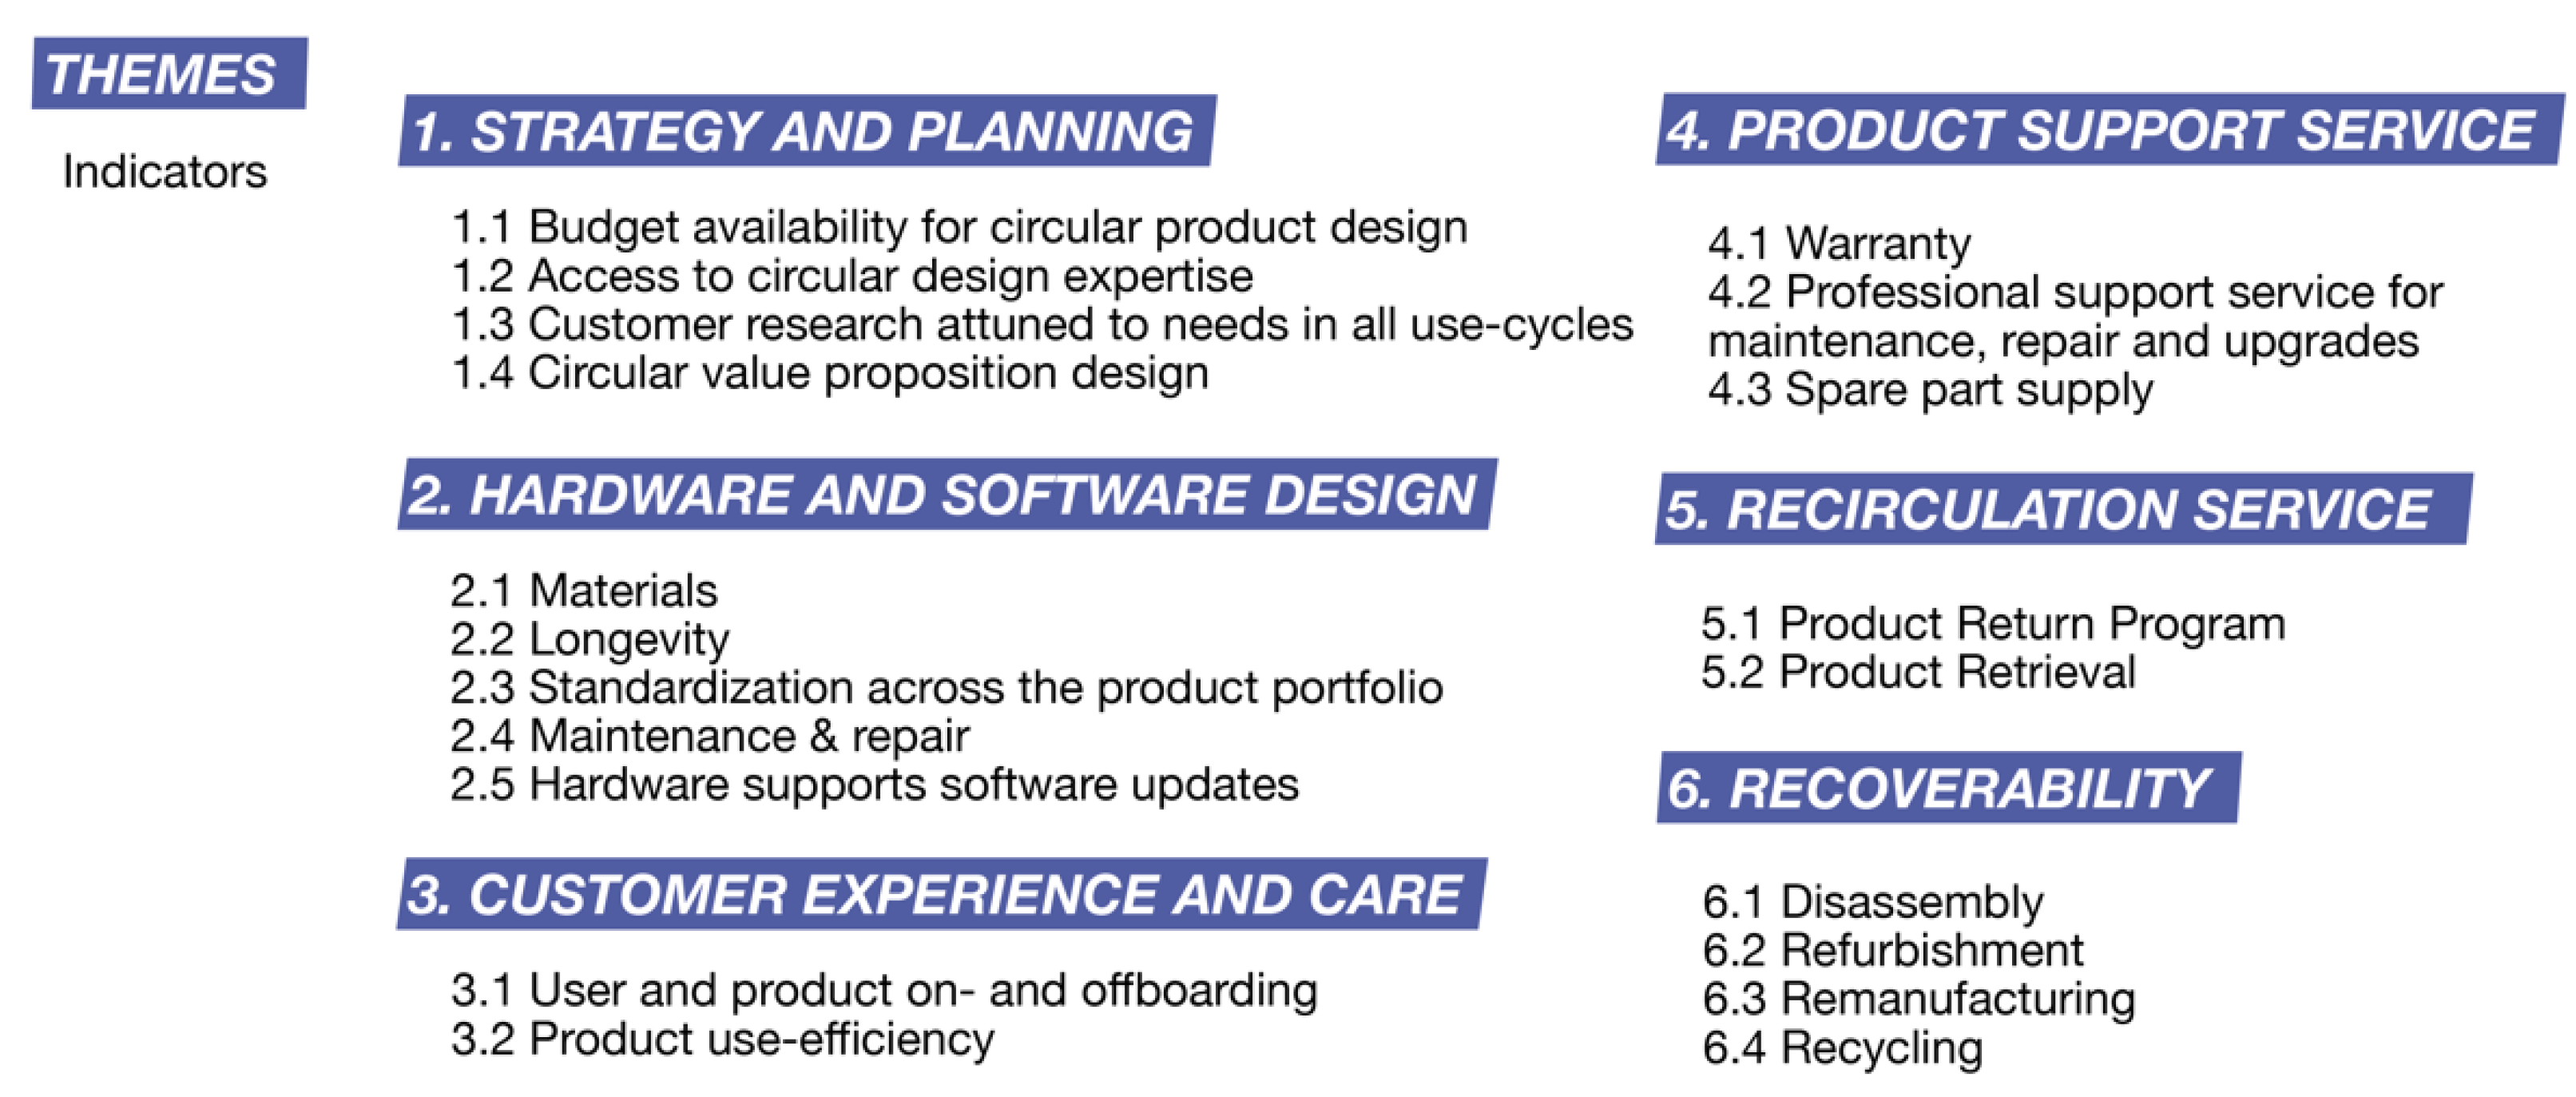
4.1. Development of Themes and Indicators
4.2. Development of the Assessment Questions
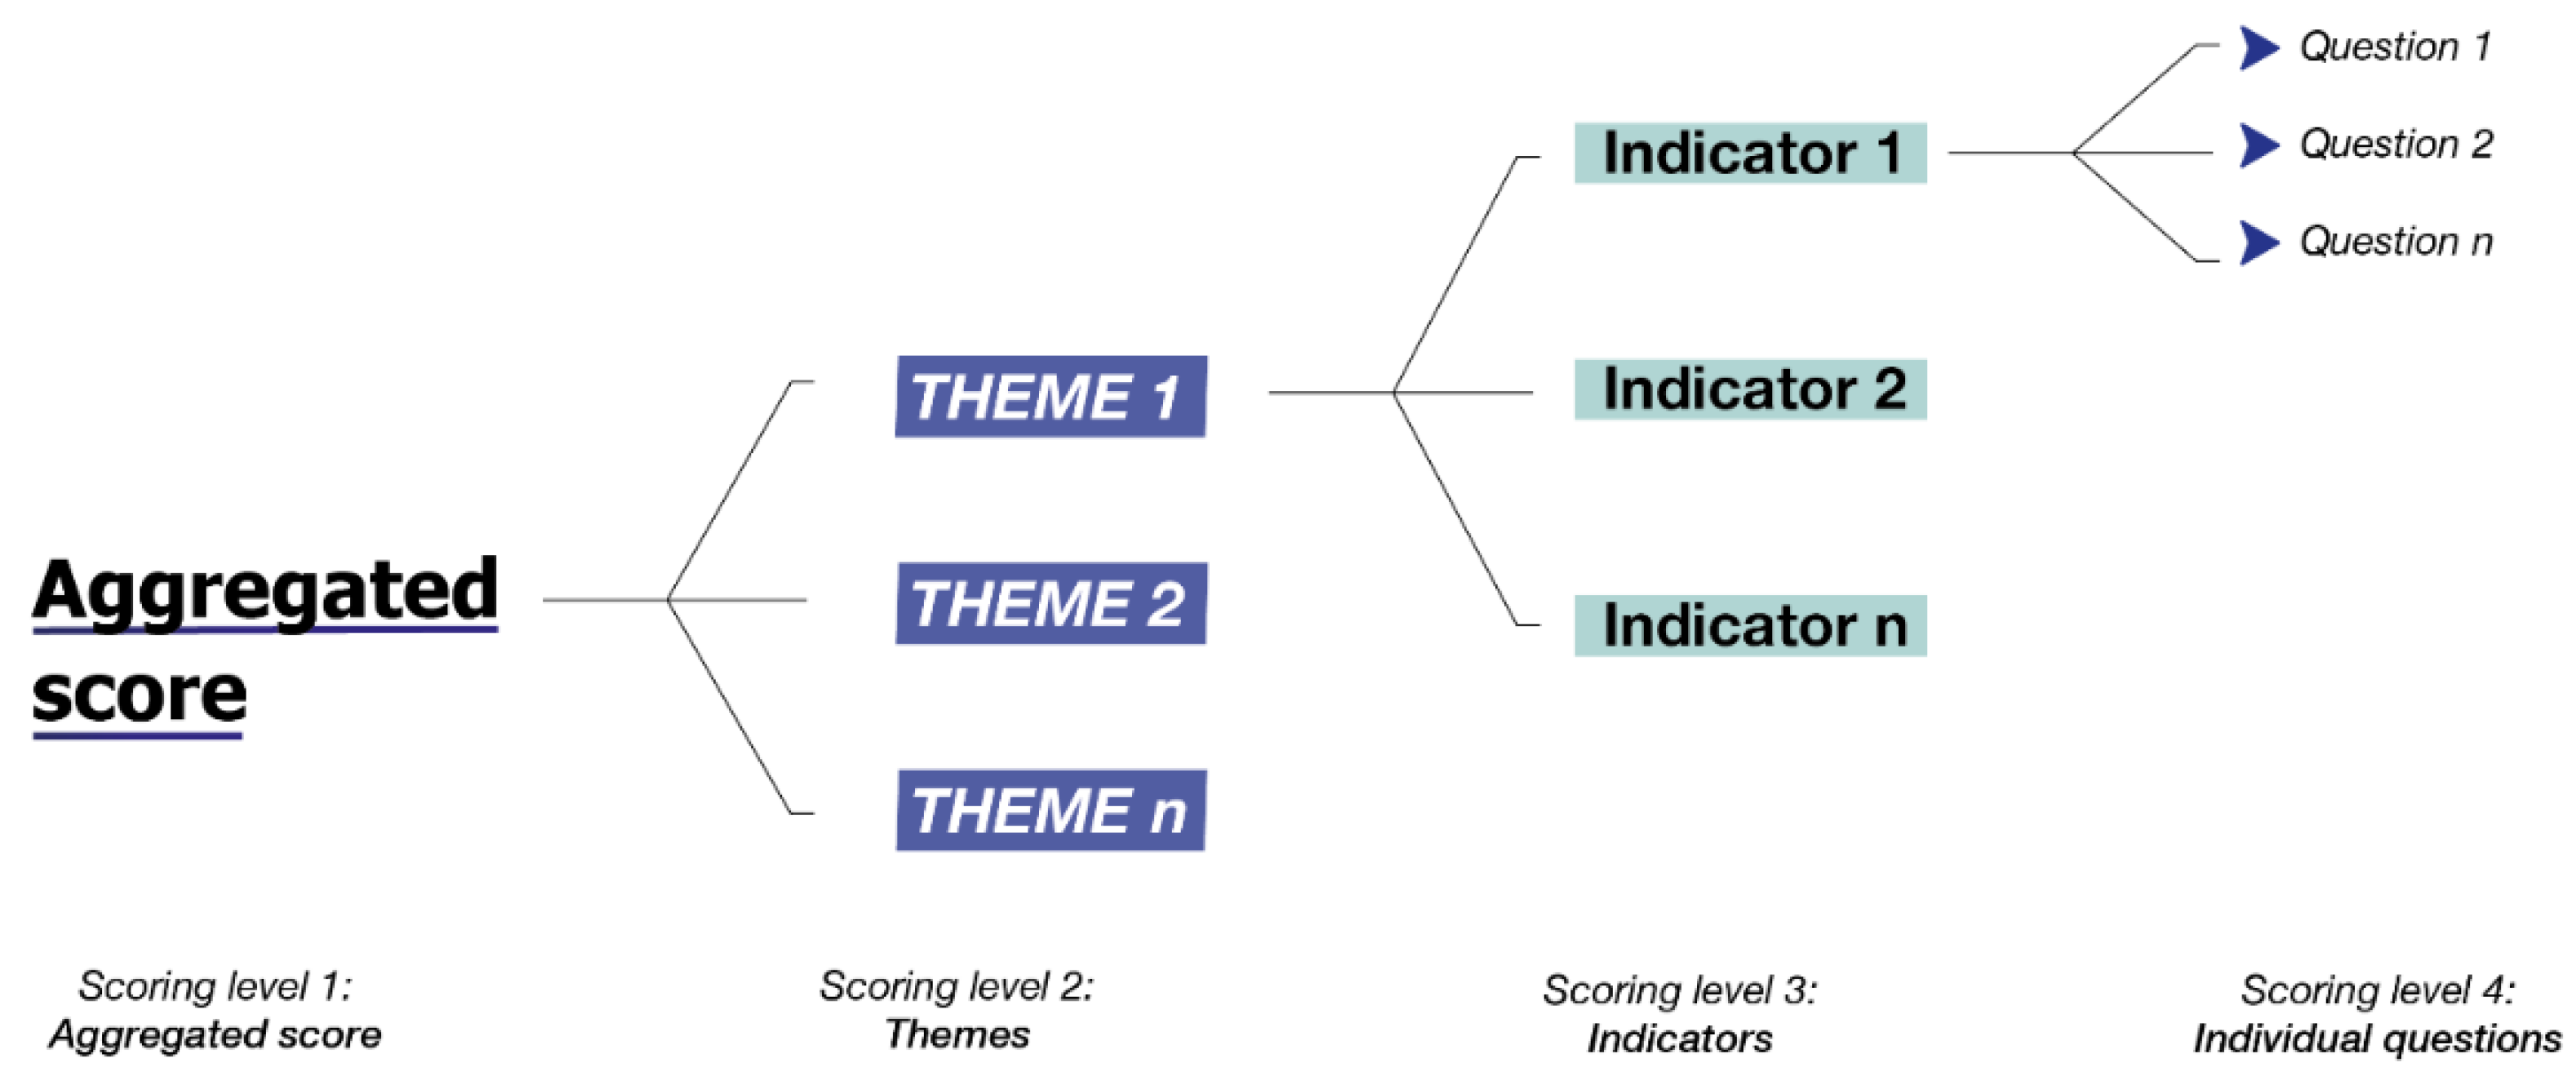
4.3. Development of the Scoring System
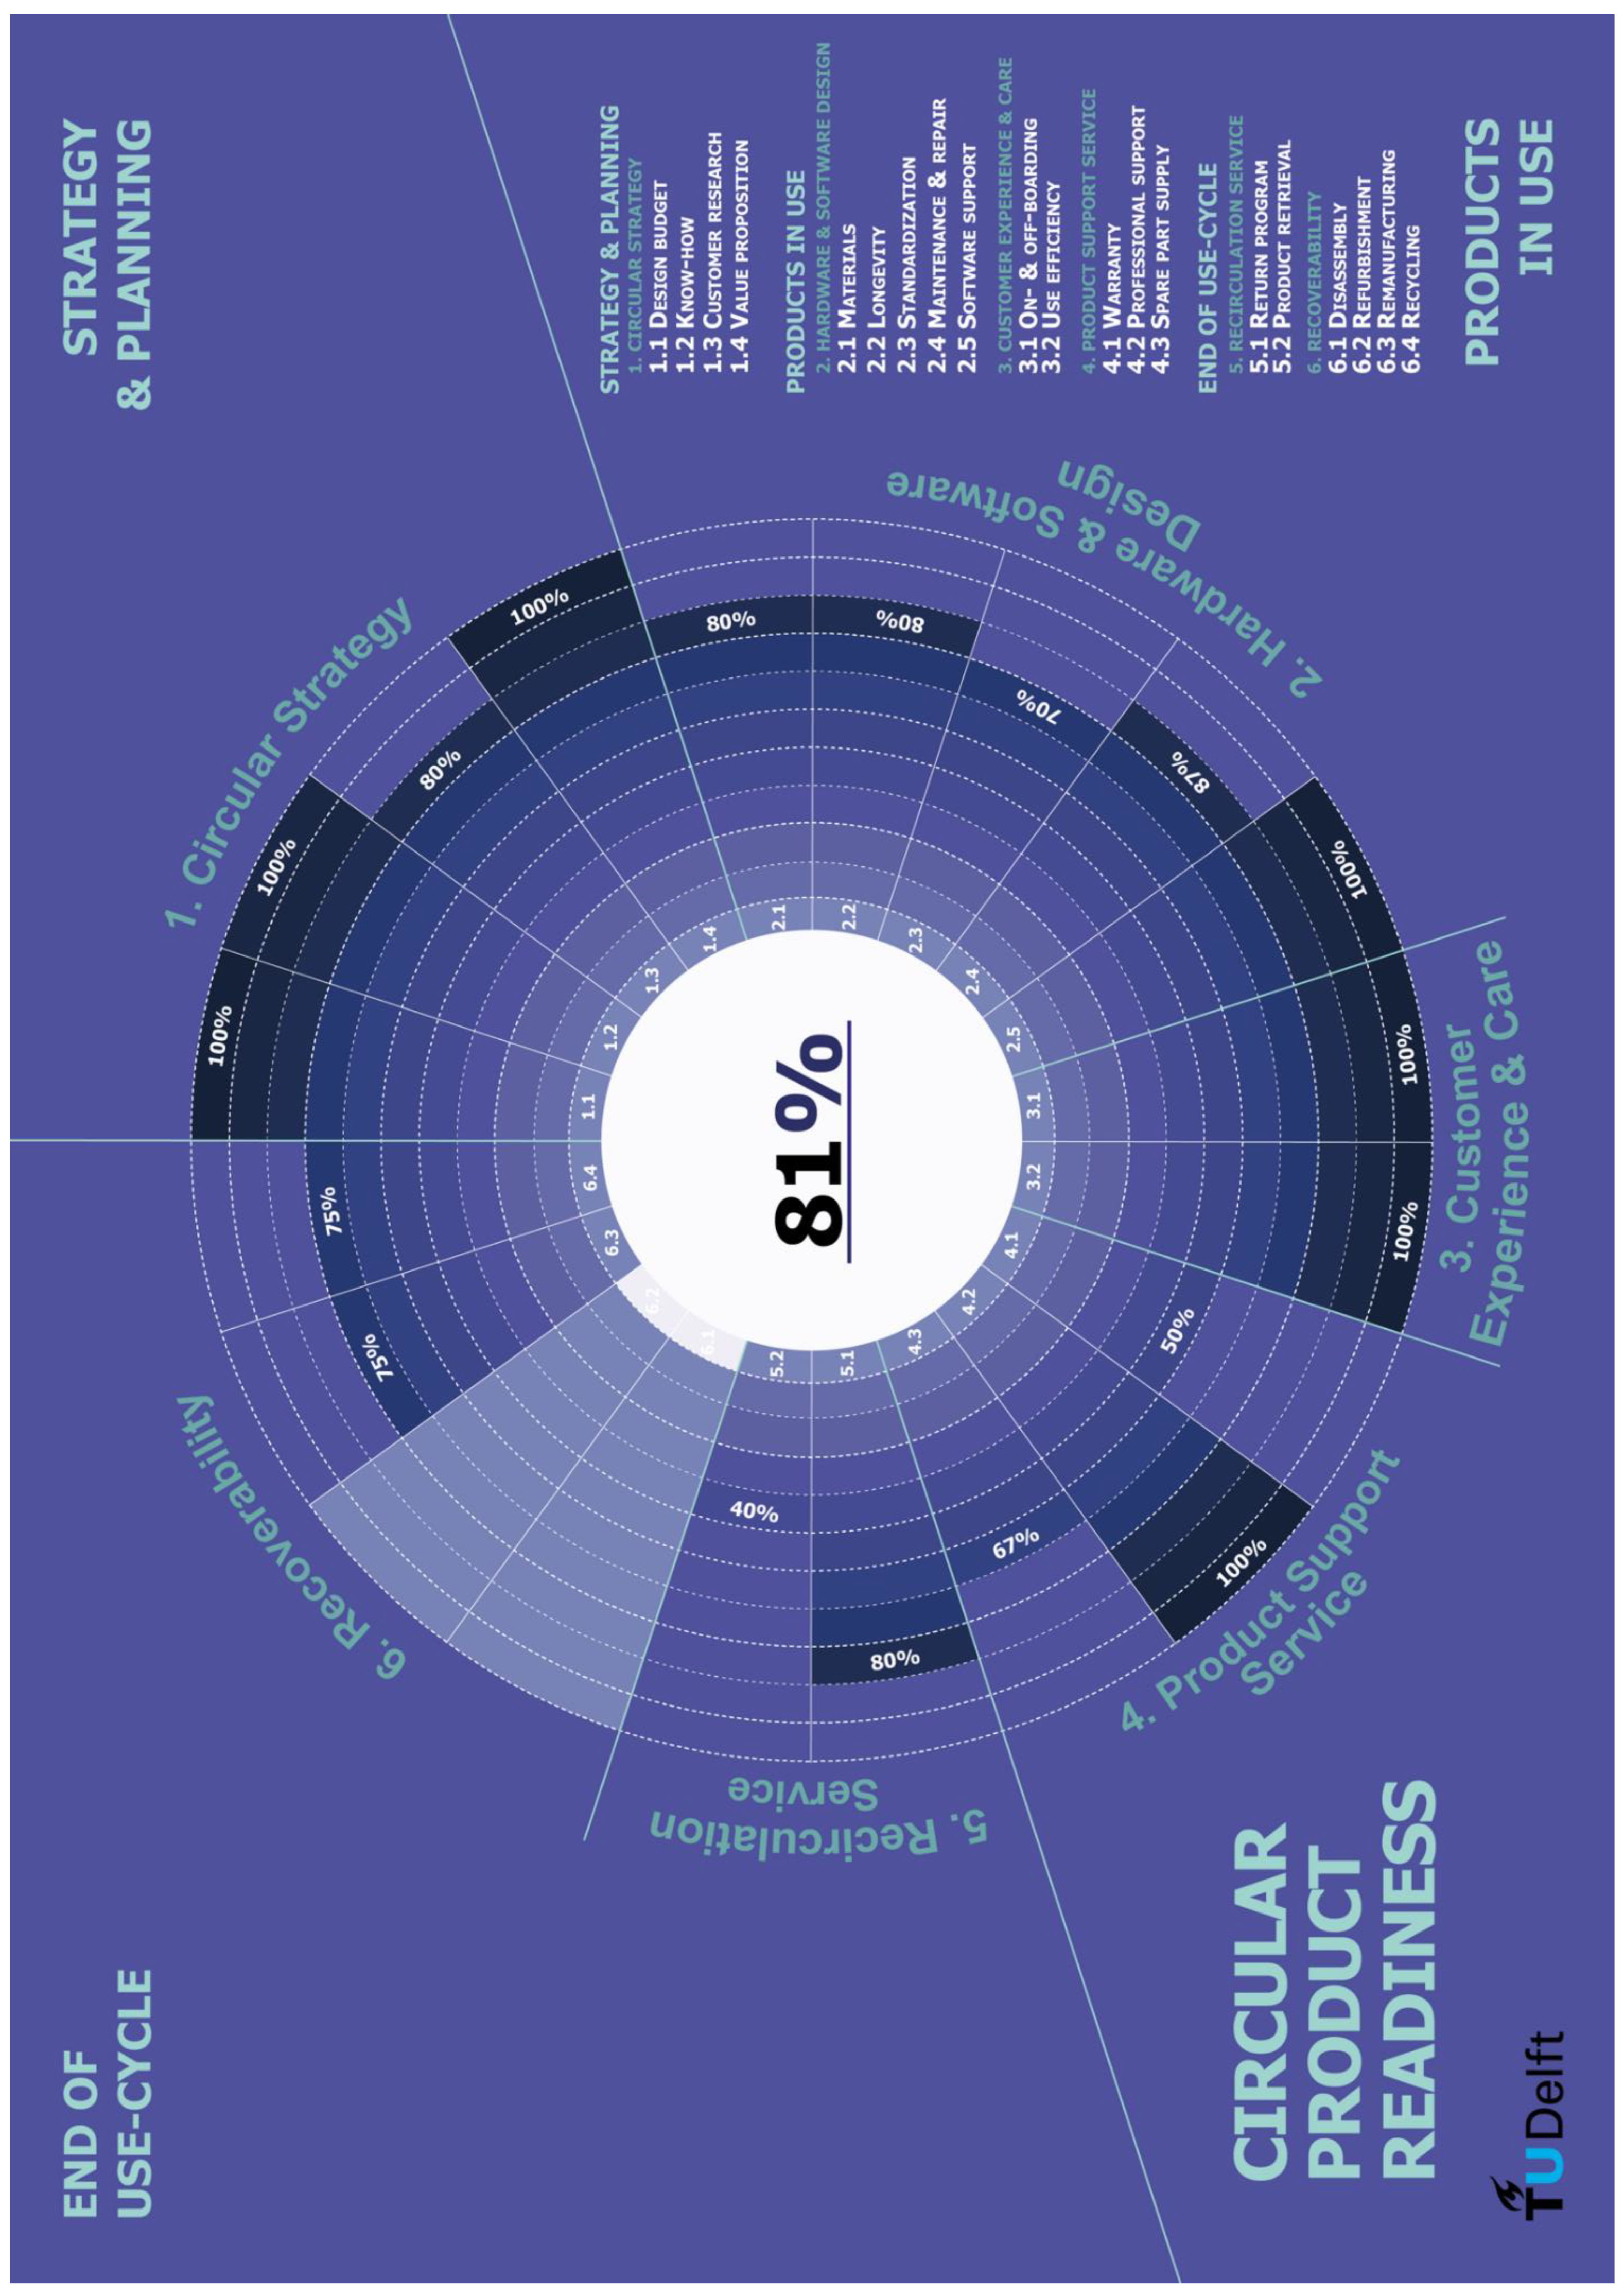
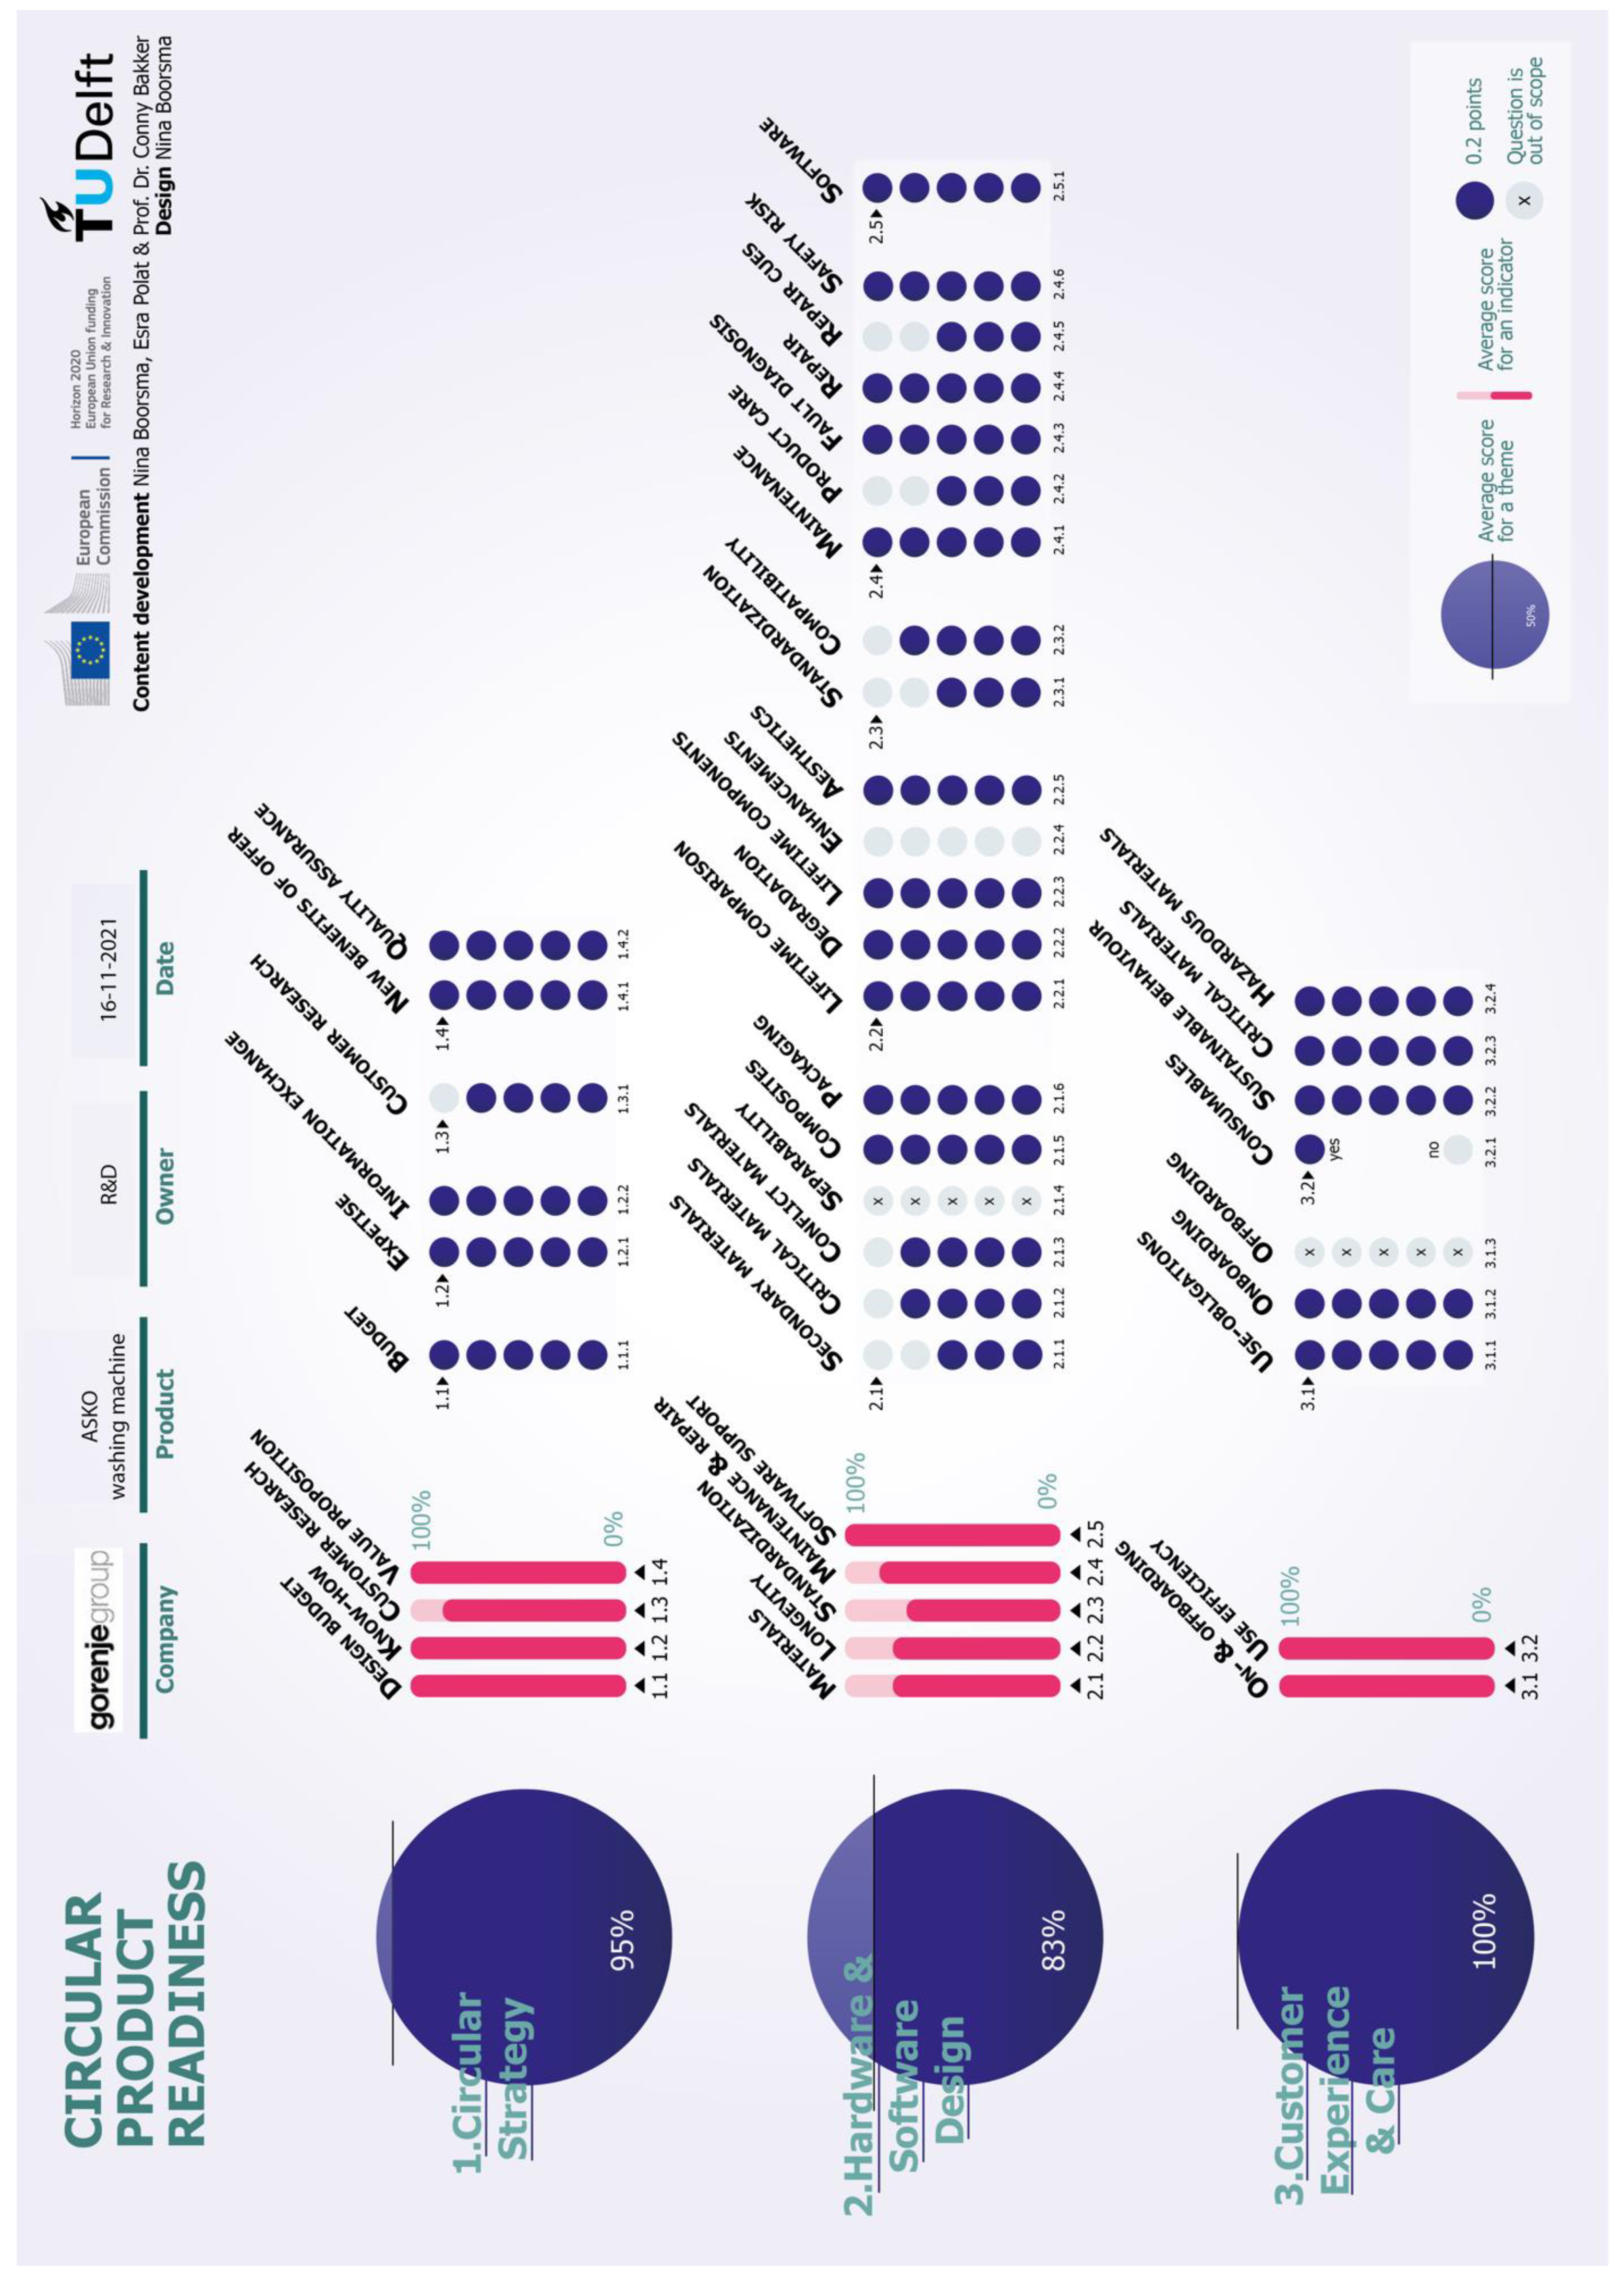
4.4. Developing the Visual
4.5. Application of the Method
5. Evaluation
| Method Criteria | Evaluation |
|---|---|
| Indicates levels of readiness | The readiness levels of the circular design aspects are reflected in the answer options. Higher levels of readiness receive more points than lower levels. The companies are also assigned points if the implementation is planned or initiated, if not yet fully implemented. Gorenje: For a number of questions, the company needed answer options that allowed for greater differentiation to more accurately reflect their progress. Having the visual use distinct colors to represent “planned implementation” and “readily implemented” would add to its usability. Overall, the results of the assessment helped Gorenje gain insights in their readiness level for circular design. Bosch: This method is expected to be useful as a quick scan for companies at the starting stages of implementing circular design. |
| Indicates company strengths and areas for improvement | The method’s visual makes it easy to interpret areas for improvement by showing scores on multiple levels. Four levels of dimensionality were distinguished: an aggregated score, scores for the design themes, scores for the indicators, and scores for the assessment questions. Having access to these scores helps pinpoint strengths and opportunities. Gorenje: From the visual, the company was able to spot opportunities to evolve further. The company sees the potential of the method to progress over time. The assessment helped evaluate the company’s goals and is expected to be of support when developing design road mapping activities. Bosch: The challenge for Bosch is to dive deeper into circular design and evaluate design decisions on sub-assembly, part and connector level. To monitor progress, the company goes into more detail with respect to experiences and costs. |
| Uses product design semantics | The accessibility of the method to designers was evaluated in the company tests. All questions that the companies considered in scope were answered. The link with design was clear. The wording was optimized in a final iteration to further improve accessibility. Gorenje: The choice of words of some questions needed to be adjusted to improve readability and make them easier to understand. The company representatives indicated that it took 30 to 45 min to complete the assessment. The ideal user is considered to be an employer working with marketing and branding, together with a project lead. Bosch: The user needs to be an expert in circular economy to complete the questionnaire successfully. The parts raising most discussion were those referring to the customer as what is meant by “customer” may differ per market (e.g., B2C or B2B). It took 60 min to complete the assessment. |
| Takes full lifecycle focus | The assessment method takes into consideration themes from the strategic design phase to the recoverability phase. Co-creation sessions and evaluation with companies helped assess the completeness of themes and indicators to cover the full lifecycle. Both companies felt that the method was complete regarding its topics. However, on some topics such as materials and reverse logistics, the method could go into more depth regarding the expectations of favorable conditions. Bosch: One example would be to add a question regarding material use about the level of fatigue strength, as this strongly impacts the reusability of parts. Another example would be to indicate the viability of setting up reverse logistics. Does the product form and size allow for transport through existing logistics channels? Does it require special packaging that protects the product from damage, such as scratches? How does the cost-size ratio of a product influence transportability? In the company’s experience, smaller sized, high-value products allow for most viable transport options. |
| Easy to apply in industry | The visual method was designed to allow ease of communication of the results on the level of an individual answer, as well as for aggregated scores such as that of an indicator, theme or the overall score. The method format was designed for ease-of-use, and for the ease-of-communication of the results. Gorenje: The method format was considered helpful in communicating the results visually to colleagues. Bosch: For the method to guide the company’s design process, it would have to become industry specific. |
| Reliability | The method was evaluated with two companies, each of which had two company representatives to apply the method, which resulted in a basic level of reliability. To further assess reliability, the outcomes of several representatives who independently apply the method on the same product should be compared for consistency. |
| Construct validity | The construct of the study is circular product design. Throughout the design process of the method, all questions were continuously evaluated for their relation to circular product design. This was carried out to make sure the questions referred to actions that can actually be influenced by design, and it helped steer away from questions about organization management, the business model, testing generic circular economy skills, or compliance. |
| Content validity | The construct validity was tested by asking the companies whether they missed relevant questions or found that certain questions were irrelevant. As a result, one new question was added (regarding the selection of packaging material) and none of the questions were removed. Gorenje: “The themes and indicators are highly relevant.” |
| Comprehensibility | During the evaluation interviews with the companies, all questions were evaluated one-by-one for their comprehensibility. This resulted in several small adjustments to the questions’ phrasing, as well as some adjustments to fit both professional contexts (i.e., business to consumer and business to business contexts). |
| Operationability | The operationability was assessed by looking at the time spent on completing the assessment and, again, the clarity of questions and answers. |
| Transversality | The method was applied by two companies operating in completely different industries: the white goods industry and the automotive industry. Both companies were able to fully complete the method successfully. In both instances, some of the questions turned out to be not relevant to their product. Including the option to answer questions with “Not Applicable” helped make the method more widely applicable. |
6. Discussion
6.1. Method Contents
6.2. Value of the Method
7. Conclusions
Author Contributions
Funding
Institutional Review Board Statement
Informed Consent Statement
Data Availability Statement
Conflicts of Interest
Appendix A
| Indicator Number and Topic | Participant(s) |
|---|---|
| Session 1 1. Design budget (Strategy and Planning) 2. Know-how (Strategy and Planning) 3. Customer research (Strategy and Planning) 4. Value proposition (Strategy and Planning) | Assistant Professor—Scaling up the Circular Economy |
| Session 2 1. Design budget (Strategy and Planning) 2. Know-how (Strategy and Planning) 3. Customer research (Strategy and Planning) 4. Value proposition (Strategy and Planning) | PhD—Sustainable and Circular Product Development |
| Session 3 8. Maintenance and repair (Hardware and Software design) 13. Professional support (Product support Service) 17. Disassembly (Recoverability) | PhD Researcher—Design for Reparability and Longevity PhD—Fault Diagnosis for Repair |
| Session 4 10. On- and Off-boarding (Customer Experience and Care) | PhD—Design for Divestment Professor—Design Methodology for Sustainability and Circular Economy |
| Session 5 10. On- and Off-boarding (Customer Experience and Care) 11. Use efficiency (Customer Experience and Care) | PhD Researcher—Consumer Perception of Circular Products |
| Session 6 5. Materials (Hardware and Software Design) 20. Recycling (Recoverability) | PhD Researcher—Composites in a Circular Economy Professor—Circular Product Design |
| Session 7 14. Spare part supply (Product Support Service) 18. Refurbishment (Recoverability) 19. Remanufacturing (Recoverability) | Associate Professor—Critical Materials in a Circular Economy |
| Session 8 General: Social aspects of circular product design | PhD Researcher—Circular Medical Devices in Low Resource Settings |
Appendix B


Appendix C
| Assessment Questions | Justification Based on the Literature Review and Co-Creation |
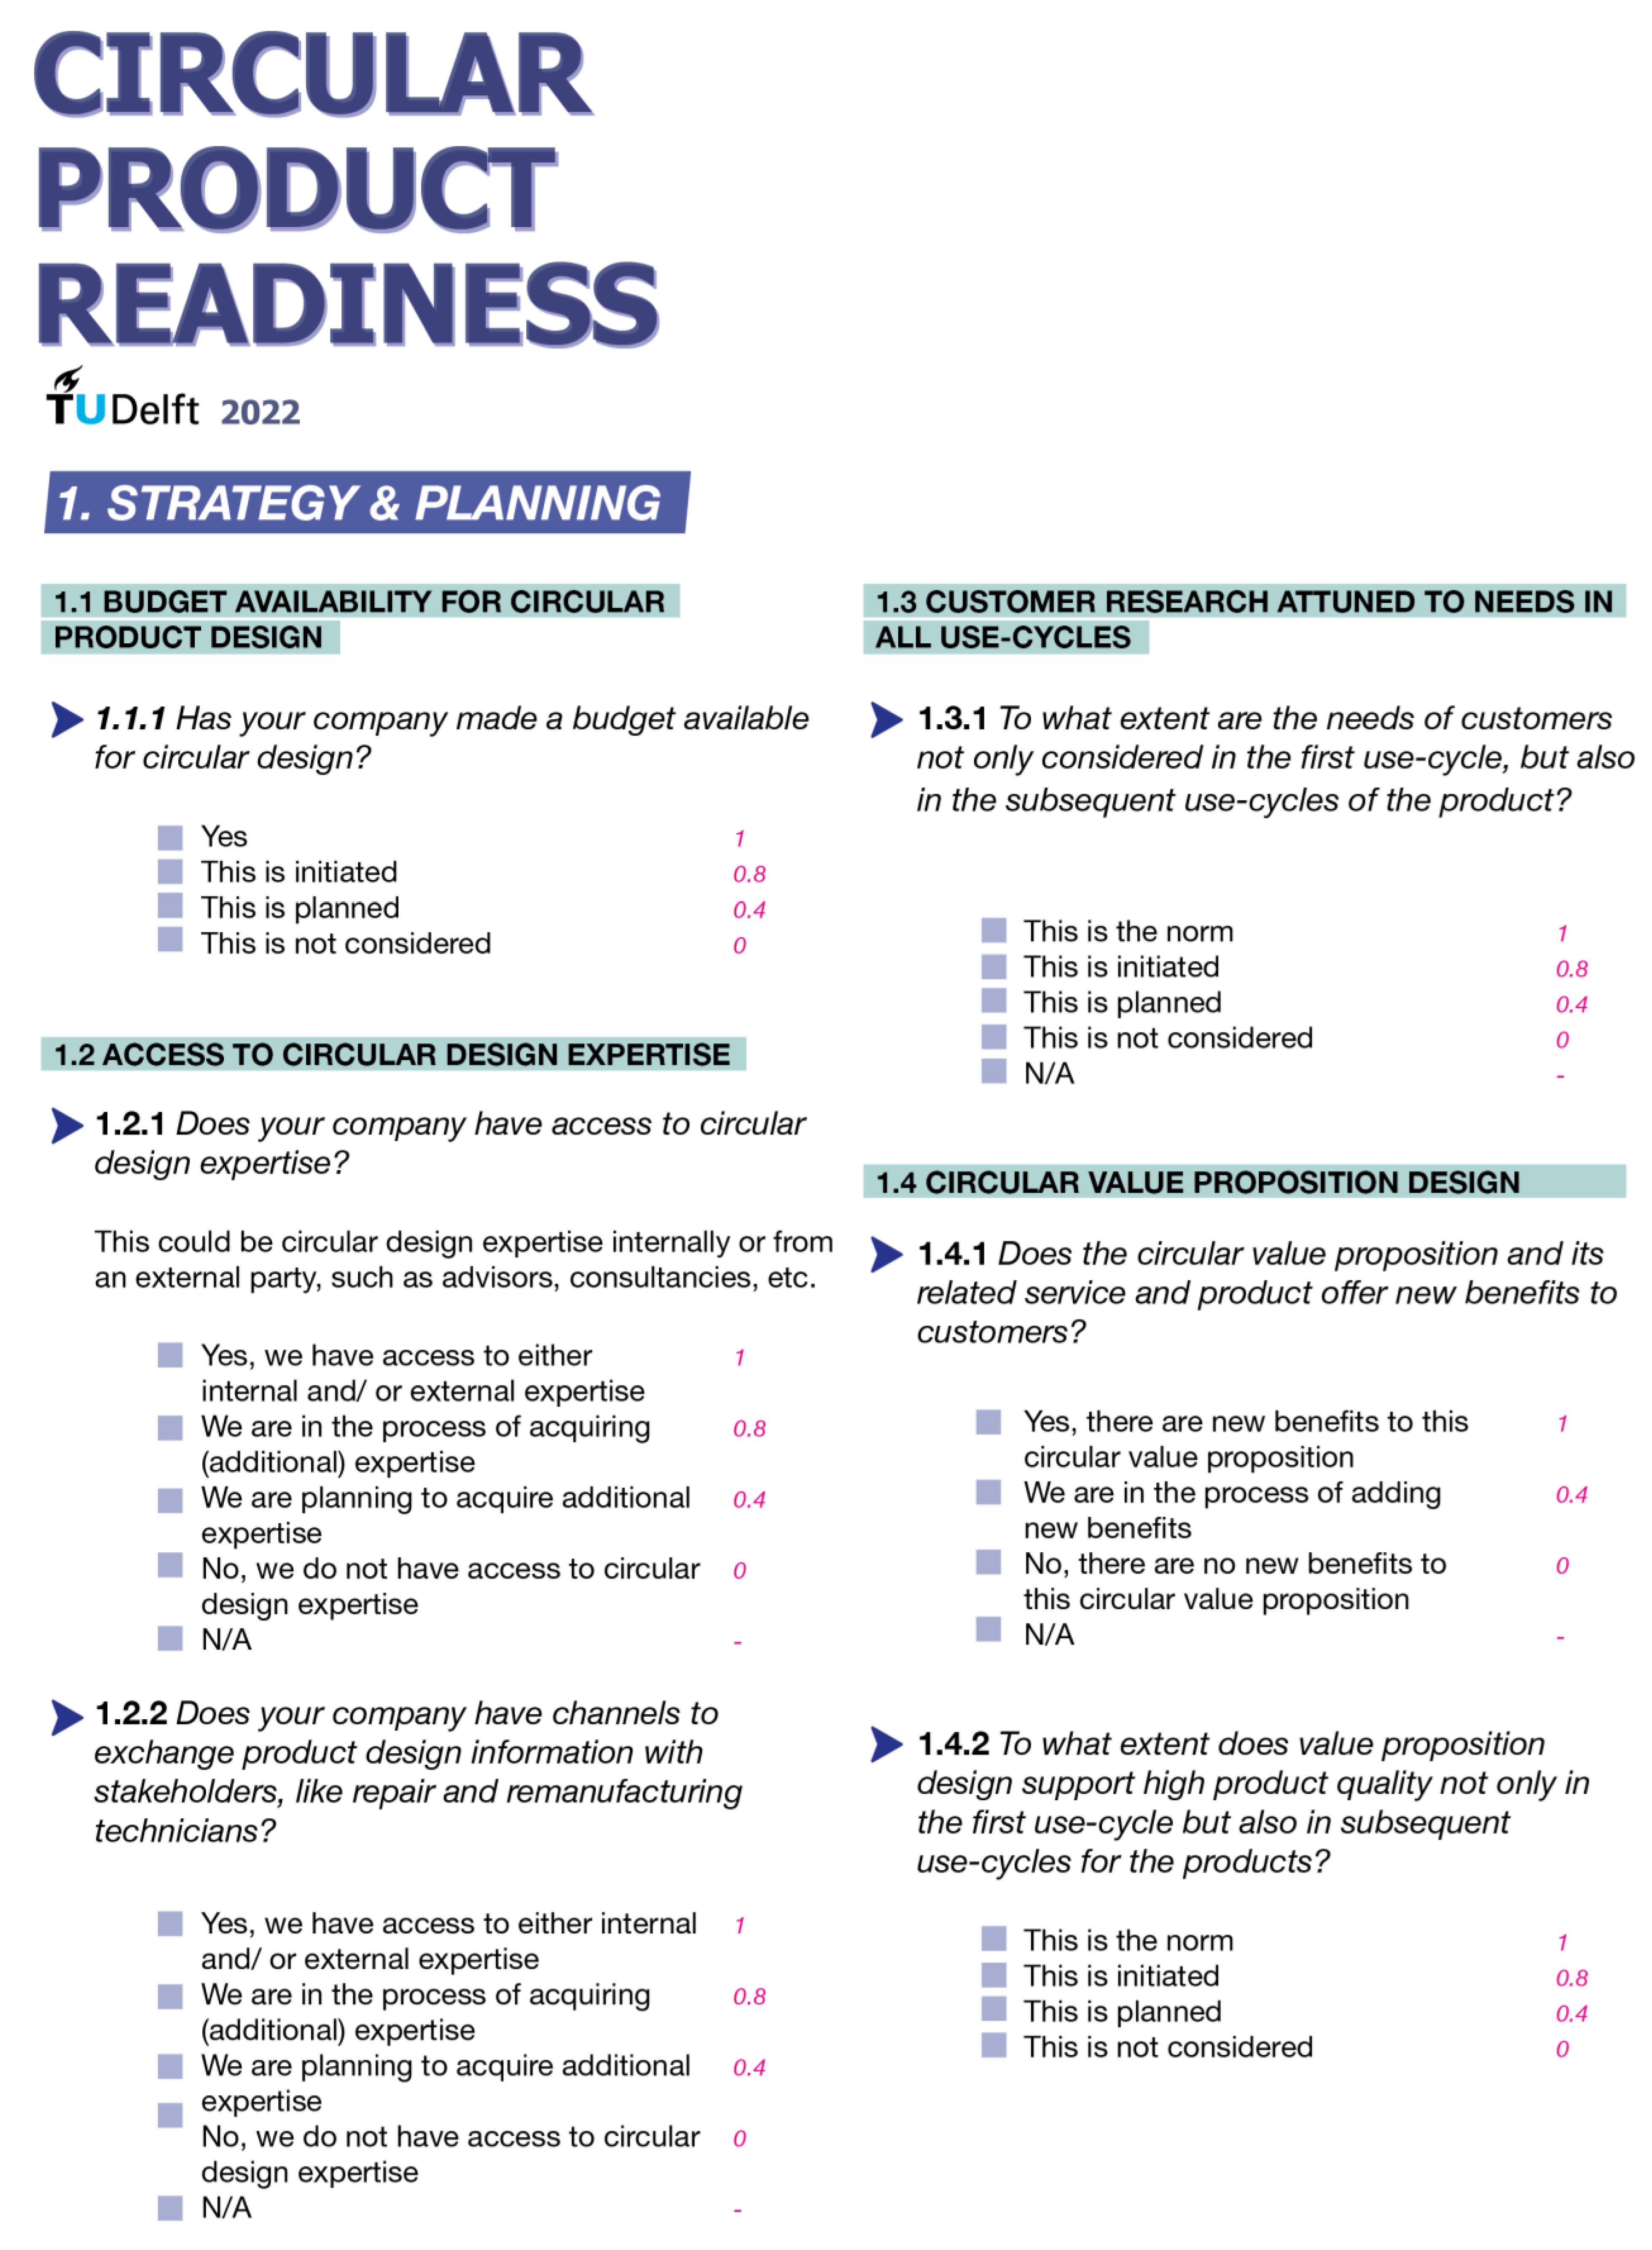
| 1. CIRCULAR STRATEGY | |
| 1.1 Design budget | |
| 1.1.1 Has your company made a budget available for circular design? | Allocating budget to circular design underpins the strategic value of circular design and their level of commitment to prioritizing the associated design requirements [16]. |
| 1.2 Know-how | |
| 1.2.1 Does your company have access to circular design expertise? | The development of or having access to circular design competencies is seen as a success factor to implement circular design, looking at the financial, operational and structural challenges [32]. The question was added as a result of Co-creation sessions 2, 7 and 8. |
| 1.2.2 Does your company have channels to exchange product design information with stakeholders, like repair and remanufacturing technicians? | The integration of circular design is strongly linked with the frequency and quality of data exchange between technicians who perform recovery operations and design engineers [33]. |
| 1.3 Customer research | |
| 1.3.1 To what extent are the needs of customers not only considered in the first use-cycle, but also in the subsequent use-cycles of the product? | Market demand is seen as the strongest incentive for companies to adjust design requirements, collecting data about customer needs with regard to circular design helps in building arguments to implement circular design [16]. The question was rephrased as a result of Co-creation session 1. |
| 1.4 Value proposition | |
| 1.4.1 Does the circular value proposition and its related service and product offer new benefits to customers? | Circular product offers are established in value networks and are effective when all partners gain value from the offer [34]. The fact that circular products are taken back and recovered can offer additional unique value and can be offered to customers, such as access to information and access to exclusive features (van Dam et al. 2021) [35]. The question was added as a result of Co-creation session 8. |
| 1.4.2 To what extent does value proposition design support high product quality not only in the first use-cycle but also in subsequent use-cycles for the products? | The brand and product identity help customers build trust in, and accept, products that serve multiple use-cycles [16]. Building this quality perception also helps in obtaining buy-in from employees [16]. The question was rephrased as a result of Co-creation session 1. |
| 2. HARDWARE AND SOFTWARE DESIGN | |
| 2.1 Materials | |
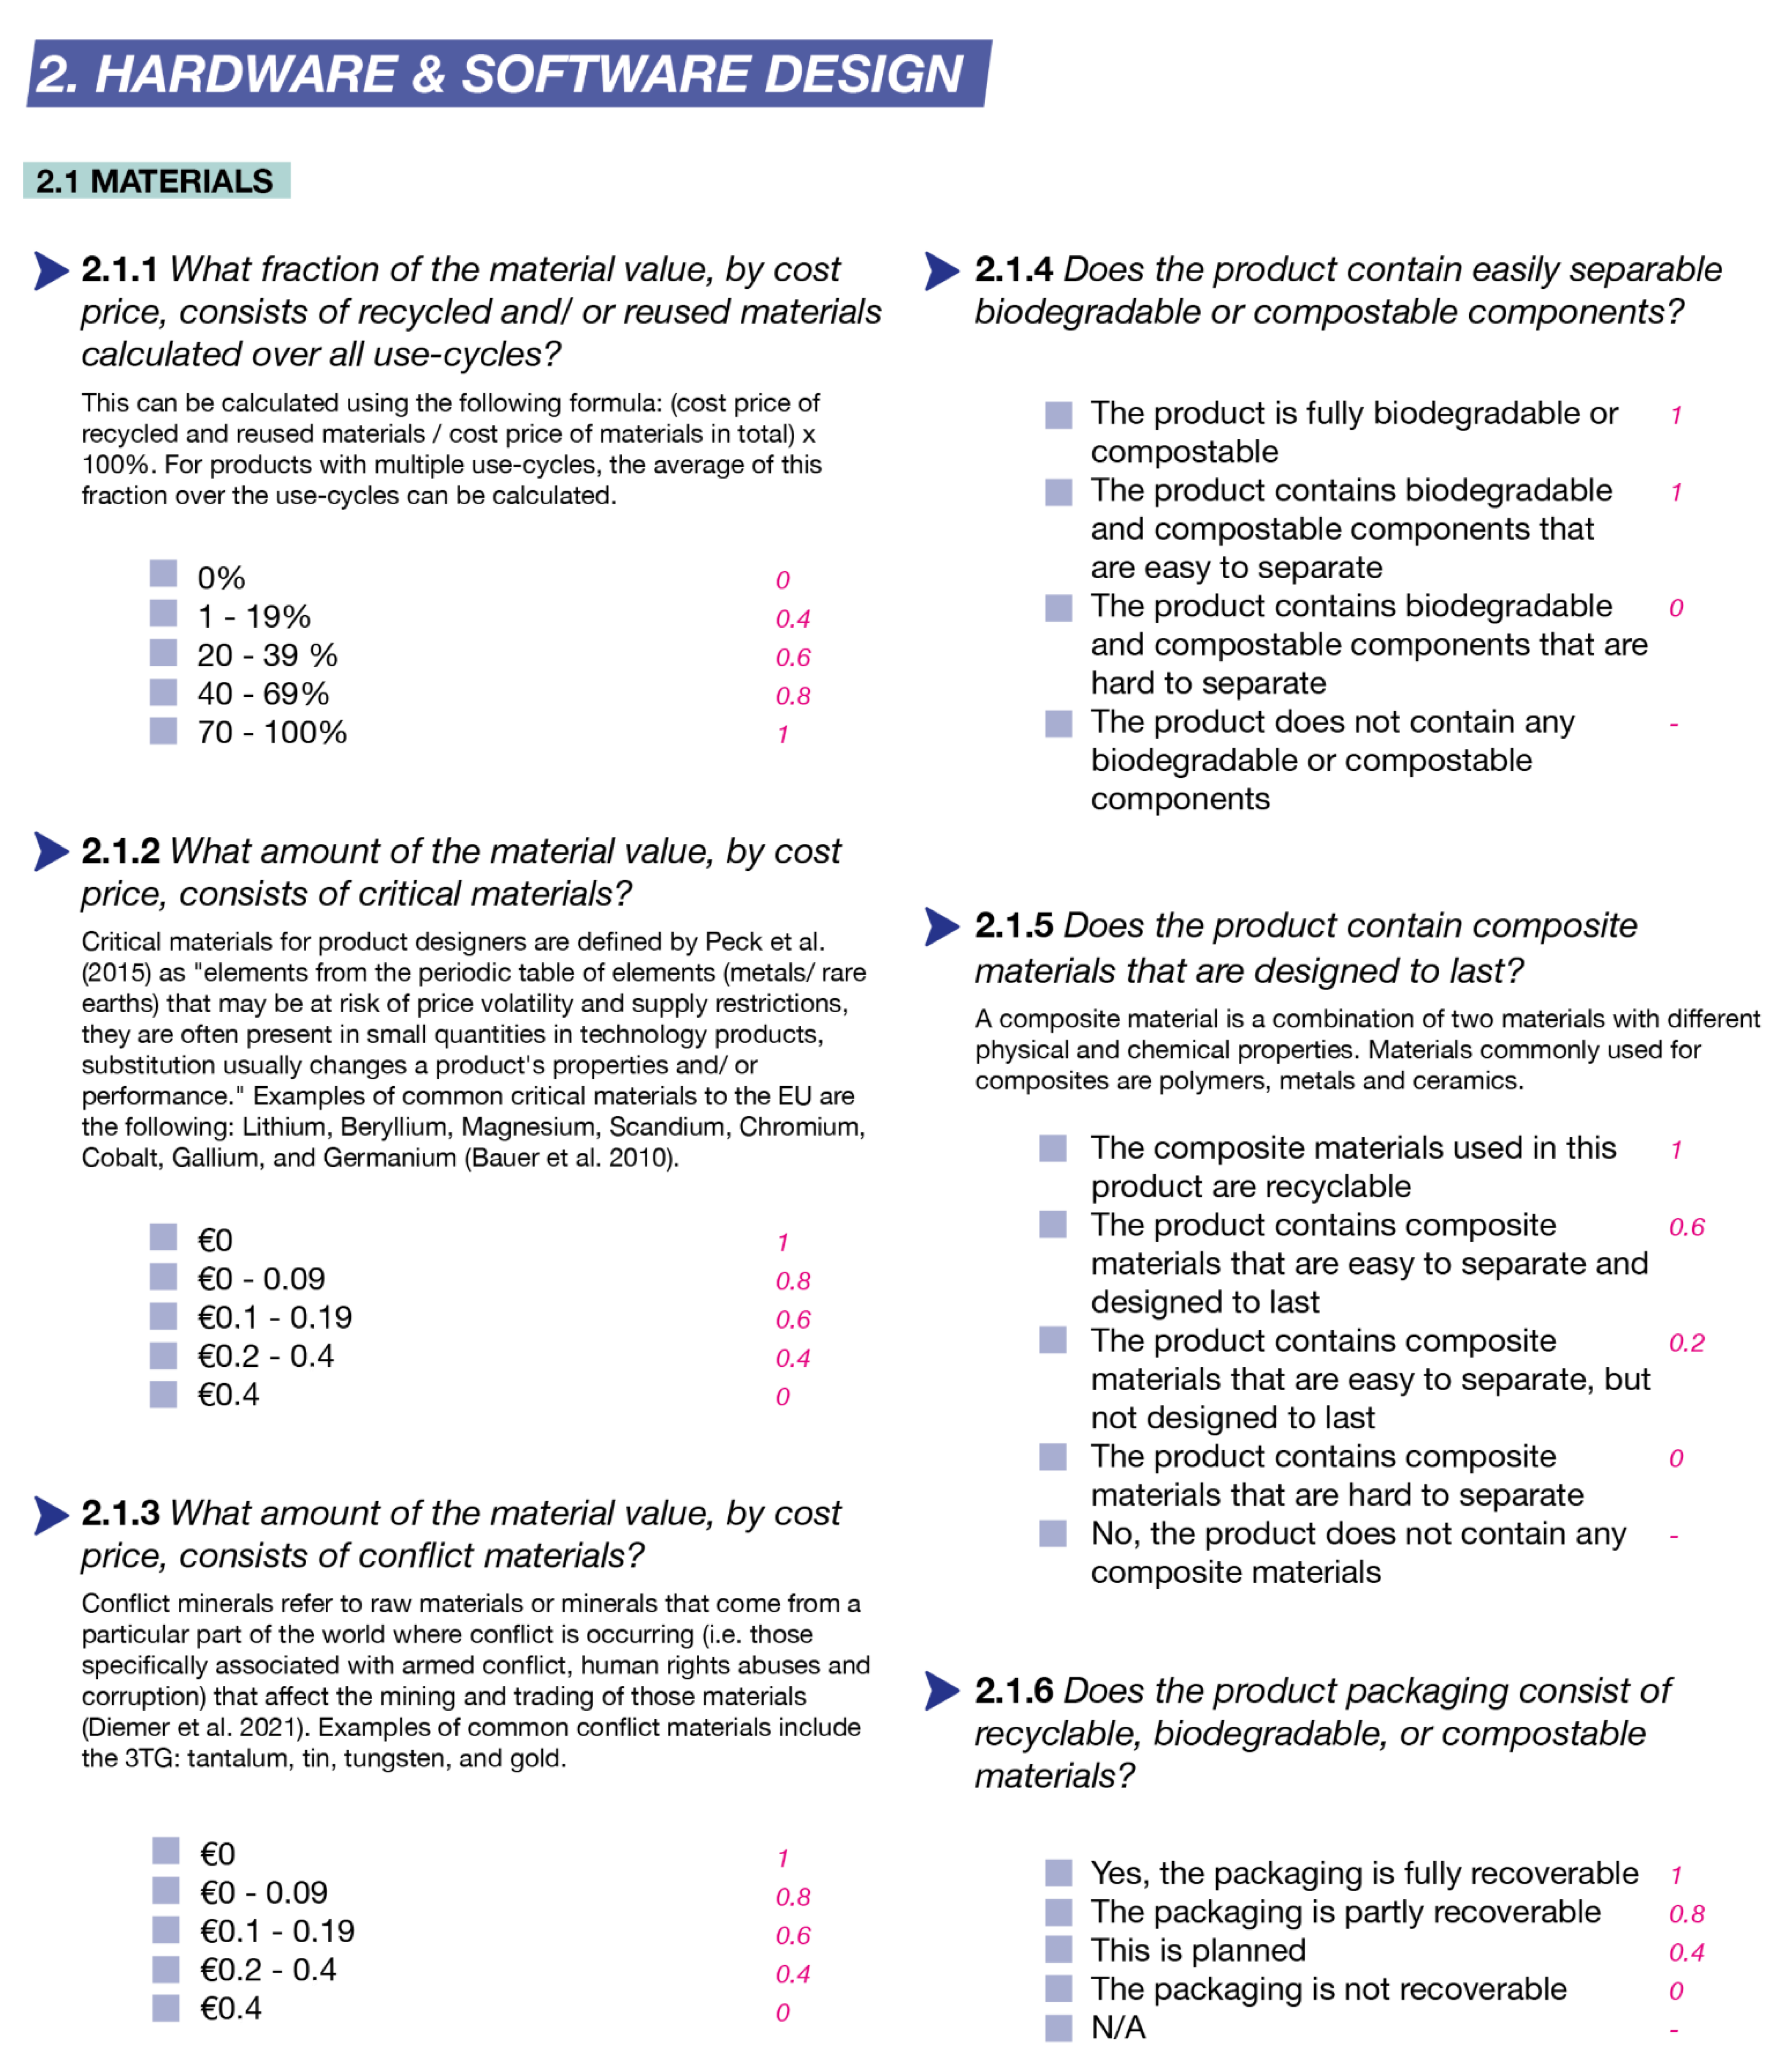
| 2.1.1 What fraction of the material value, by cost price, consists of recycled and/or reused materials calculated over all use-cycles? | Calculating the ratio of the recoverable share of a product denotes the progress towards the circularity potential of a product [5]. The question was rephrased as a result of Co-creation session 6. |
| 2.1.2 What amount of the material value, by cost price, consists of critical materials? | Critical materials, commonly used by design engineers, tend to have rare material characteristics, yet they are labelled critical, for instance, due to constraints in supply chains, volatile prices, or implications to the environment [36]. Circular design is seen as a promising solution to diminish risks and offer a more sustainable alternative to using these valuable resources [36]. |
| 2.1.3 What amount of the material value, by cost price, consists of conflict materials? | Mineral trade can be involved with inhumane activities such as forced labor, labor under harsh working conditions, or criminal activities [37]. The OECD recommends traceability systems to map upstream supply chain stakeholders in collaboration with industry bodies [38]. |
| 2.1.4 Does the product contain easily separable biodegradable or compostable components? | Following the “power of pure circles” principle of the Ellen MacArthur Foundation, product circularity increases through separating material streams to their purest possible form at the core, separating the bio- and the techno-cycles [39]. |
| 2.1.5 Does the product contain composite materials that are designed to last? | Closing the material loop for composites through recycling remains suboptimal because of the material use and structure [40]. Therefore, choosing long lasting application through careful designs consideration should be favored [40]. |
| 2.1.6 Does the product packaging consist of recyclable, biodegradable, or compostable materials? | Calculating the ratio of the recoverable share of a product denotes the progress towards the circularity potential of a product [5]. The question was added as a result of the company evaluation (Section 5). |
| 2.2 Longevity | |
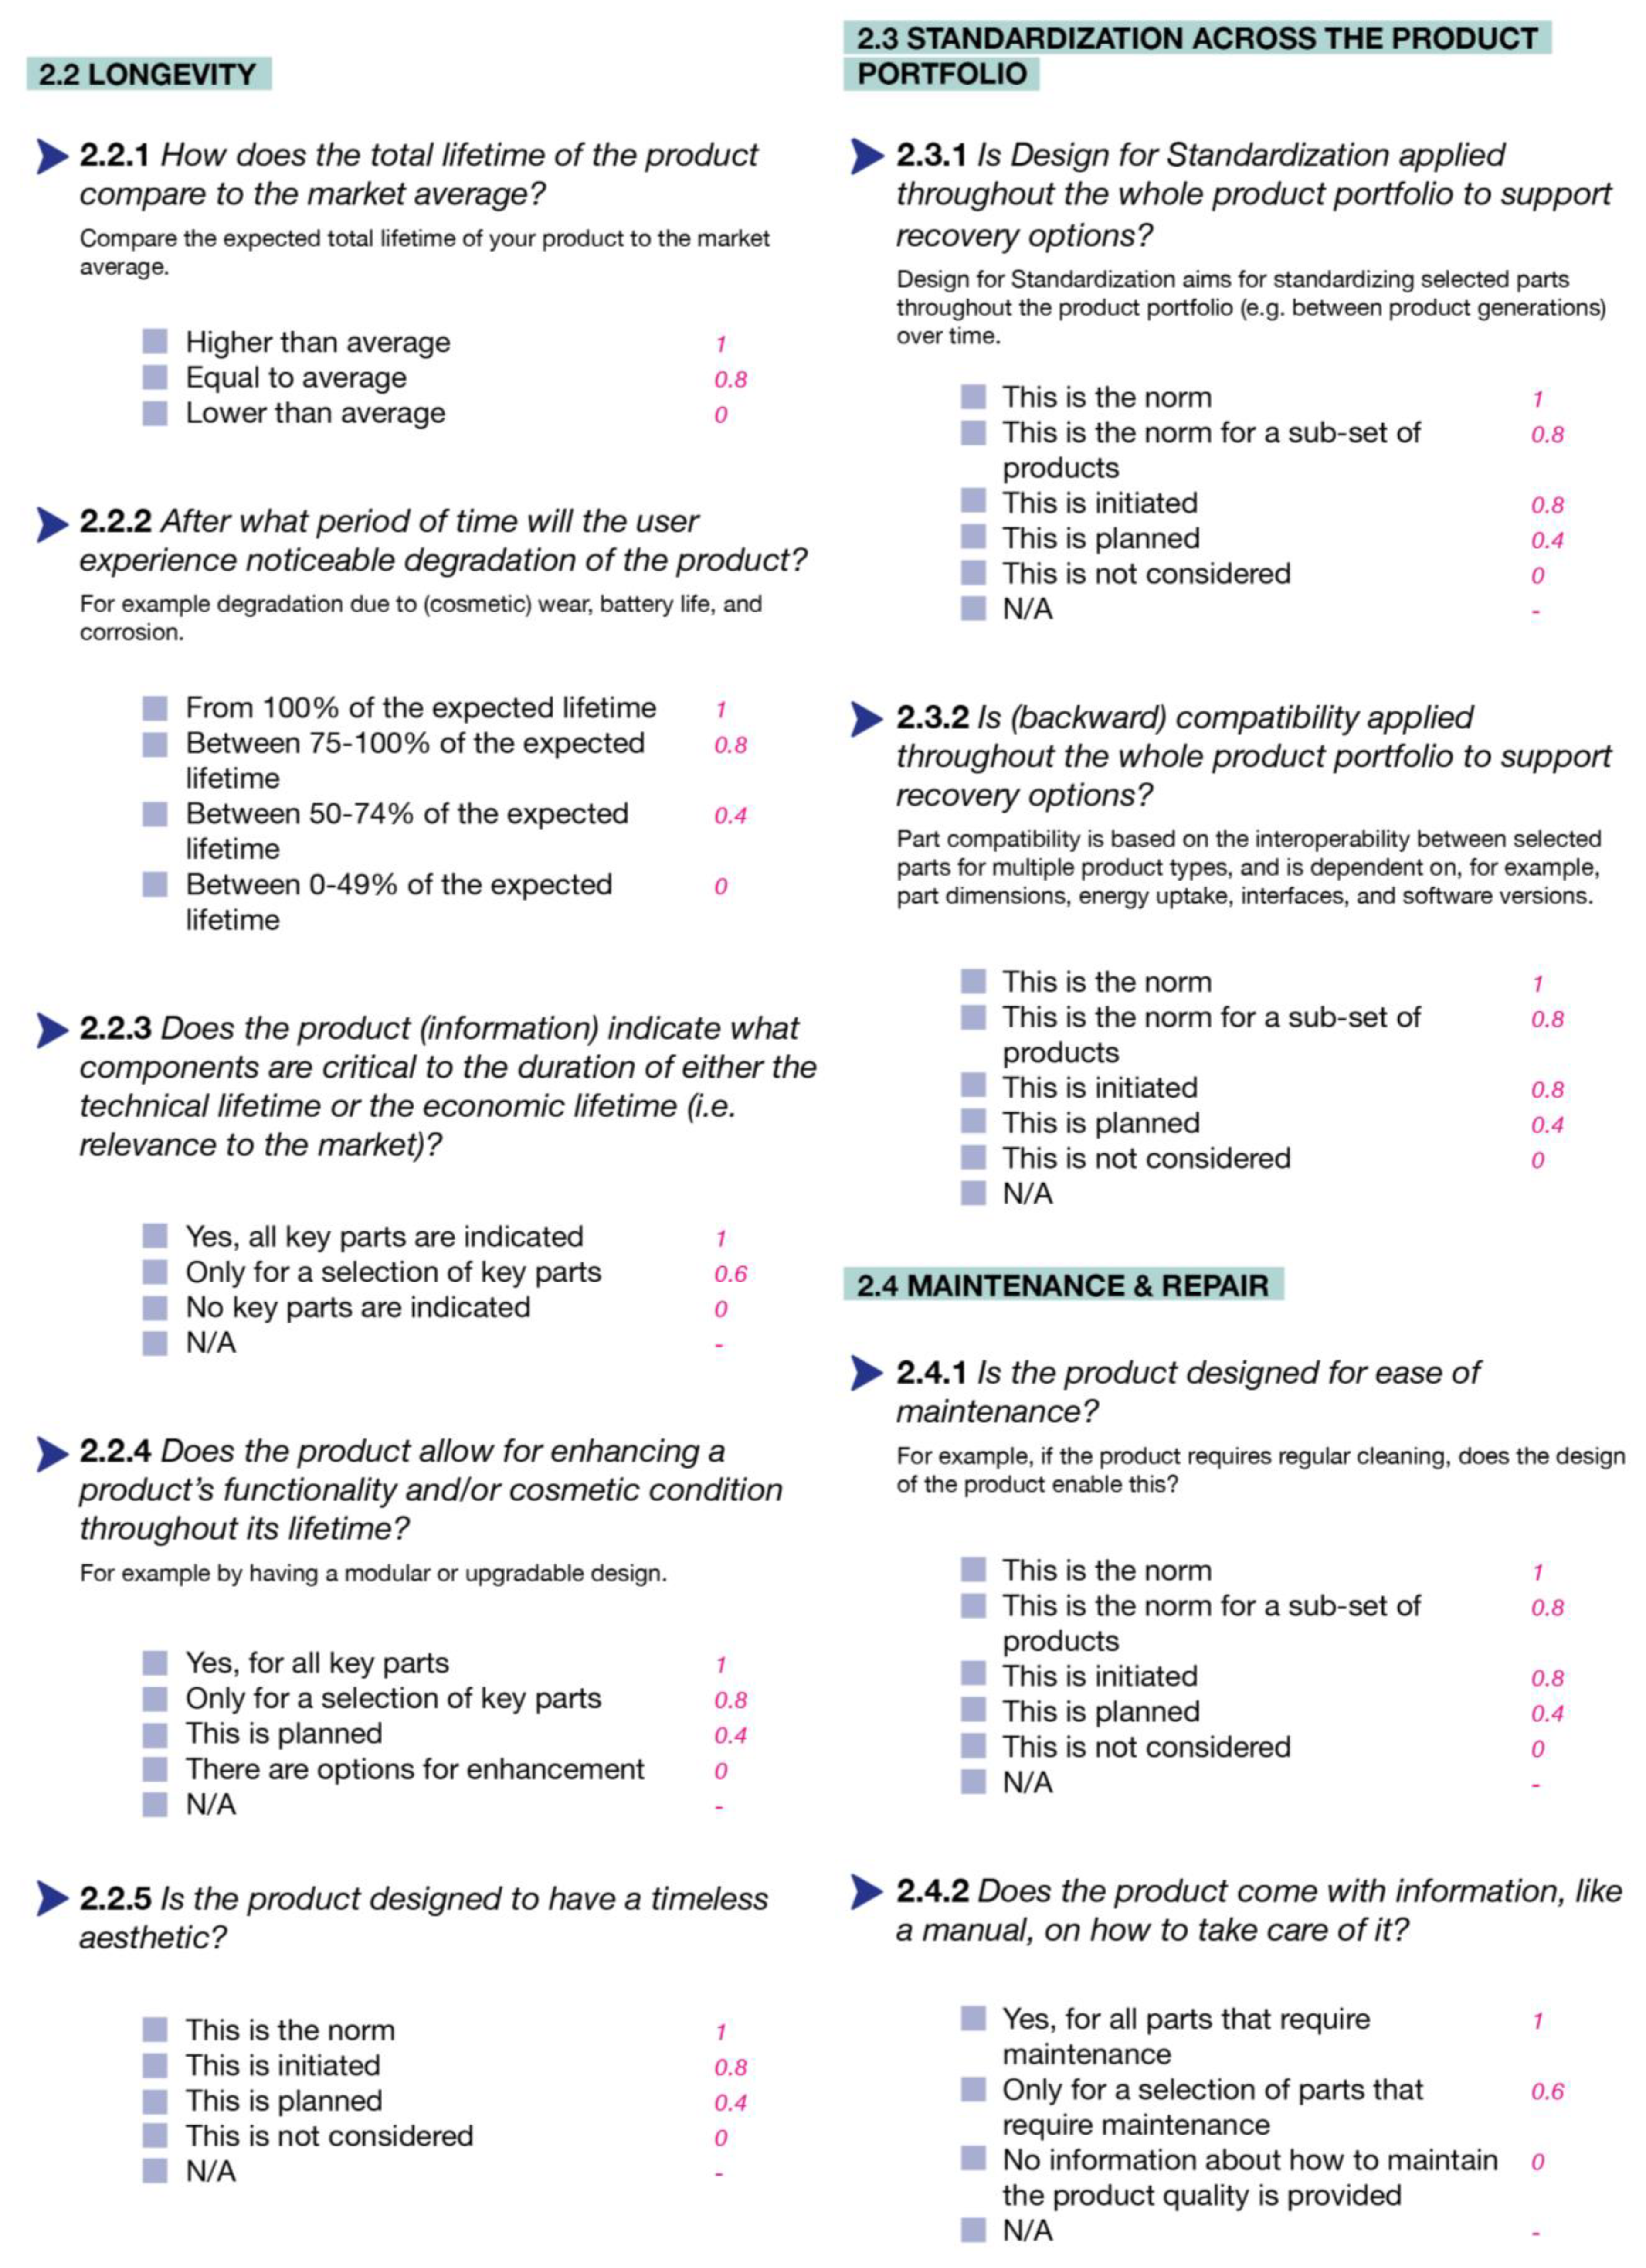
| 2.2.1 How does the total lifetime of the product compare to the market average? | Comparing a product’s lifetime against the market average is considered a valuable indicator to measure utility [10]. |
| 2.2.2 After what period of time will the user experience noticeable degradation of the product? | Functional, emotional, and social values play a role in the attachment users experience towards their products [41]. |
| 2.2.3 Does the product (information) indicate what key components are critical to the duration of either the technical lifetime or the economic lifetime (i.e., relevance to the market)? | An aspect from circular design is to determine what components are expected to degrade first and, if these components are critical, look for design solutions to prevent this [42]. The question was rephrased as a result of the company evaluation (Section 5). |
| 2.2.4 Does the product allow for enhancing a product’s functionality and/or cosmetic condition throughout its lifetime? | Design strategies such as modularity can allow a product’s functionality or appearance to be enhanced during its lifetime [43]. |
| 2.2.5 Is the product designed to have a timeless aesthetic? | The selection of design style links with timelessness and can influence market acceptance of circular products significantly, which can increase longevity [44]. The question was rephrased as a result of Co-creation session 7. |
| 2.3 Standardization | |
| 2.3.1 Is Design for Standardization applied throughout the whole product portfolio to support recovery options? Design for Standardization aims for standardizing selected parts throughout the product portfolio (e.g., between product generations) over time. | Standardization of sub-assemblies and components across product platforms allow products to be used over multiple use-cycles as it prevents them from becoming obsolete by replacement [43]. The question was rephrased as a result of the company evaluation (Section 5). |
| 2.3.2 Is (backward) compatibility applied throughout the whole product portfolio to support recovery options? Part compatibility is based on the interoperability between selected parts for multiple product types, and is dependent on, for example, part dimensions, energy uptake, interfaces, and software versions. | (Backward) compatibility of sub-assemblies and components across product platforms allow parts to be exchanged between products generations, lines, and platforms, which increases reusability potential [43]. The question was rephrased as a result of the company evaluation (Section 5). |
| 2.4 Maintenance and repair | |
| 2.4.1 Is the product designed for ease of maintenance? | If the product requires maintenance to preserve its performance, then it should allow for ease-of-maintenance (Co-creations session 3). In case maintenance cannot be “designed-out”, minimizing the time and effort to maintain a product is recommended to enhance simplicity, reliability, and supportability [45]. The implementation of Design for Maintenance has a positive effect on other recovery activities [46]. |
| 2.4.2 Does the product come with information, like a manual, on how to take care of it? | Informing a user about the possibilities for product care, makes the user aware of his or her influence on a product’s lifetime [47]. |
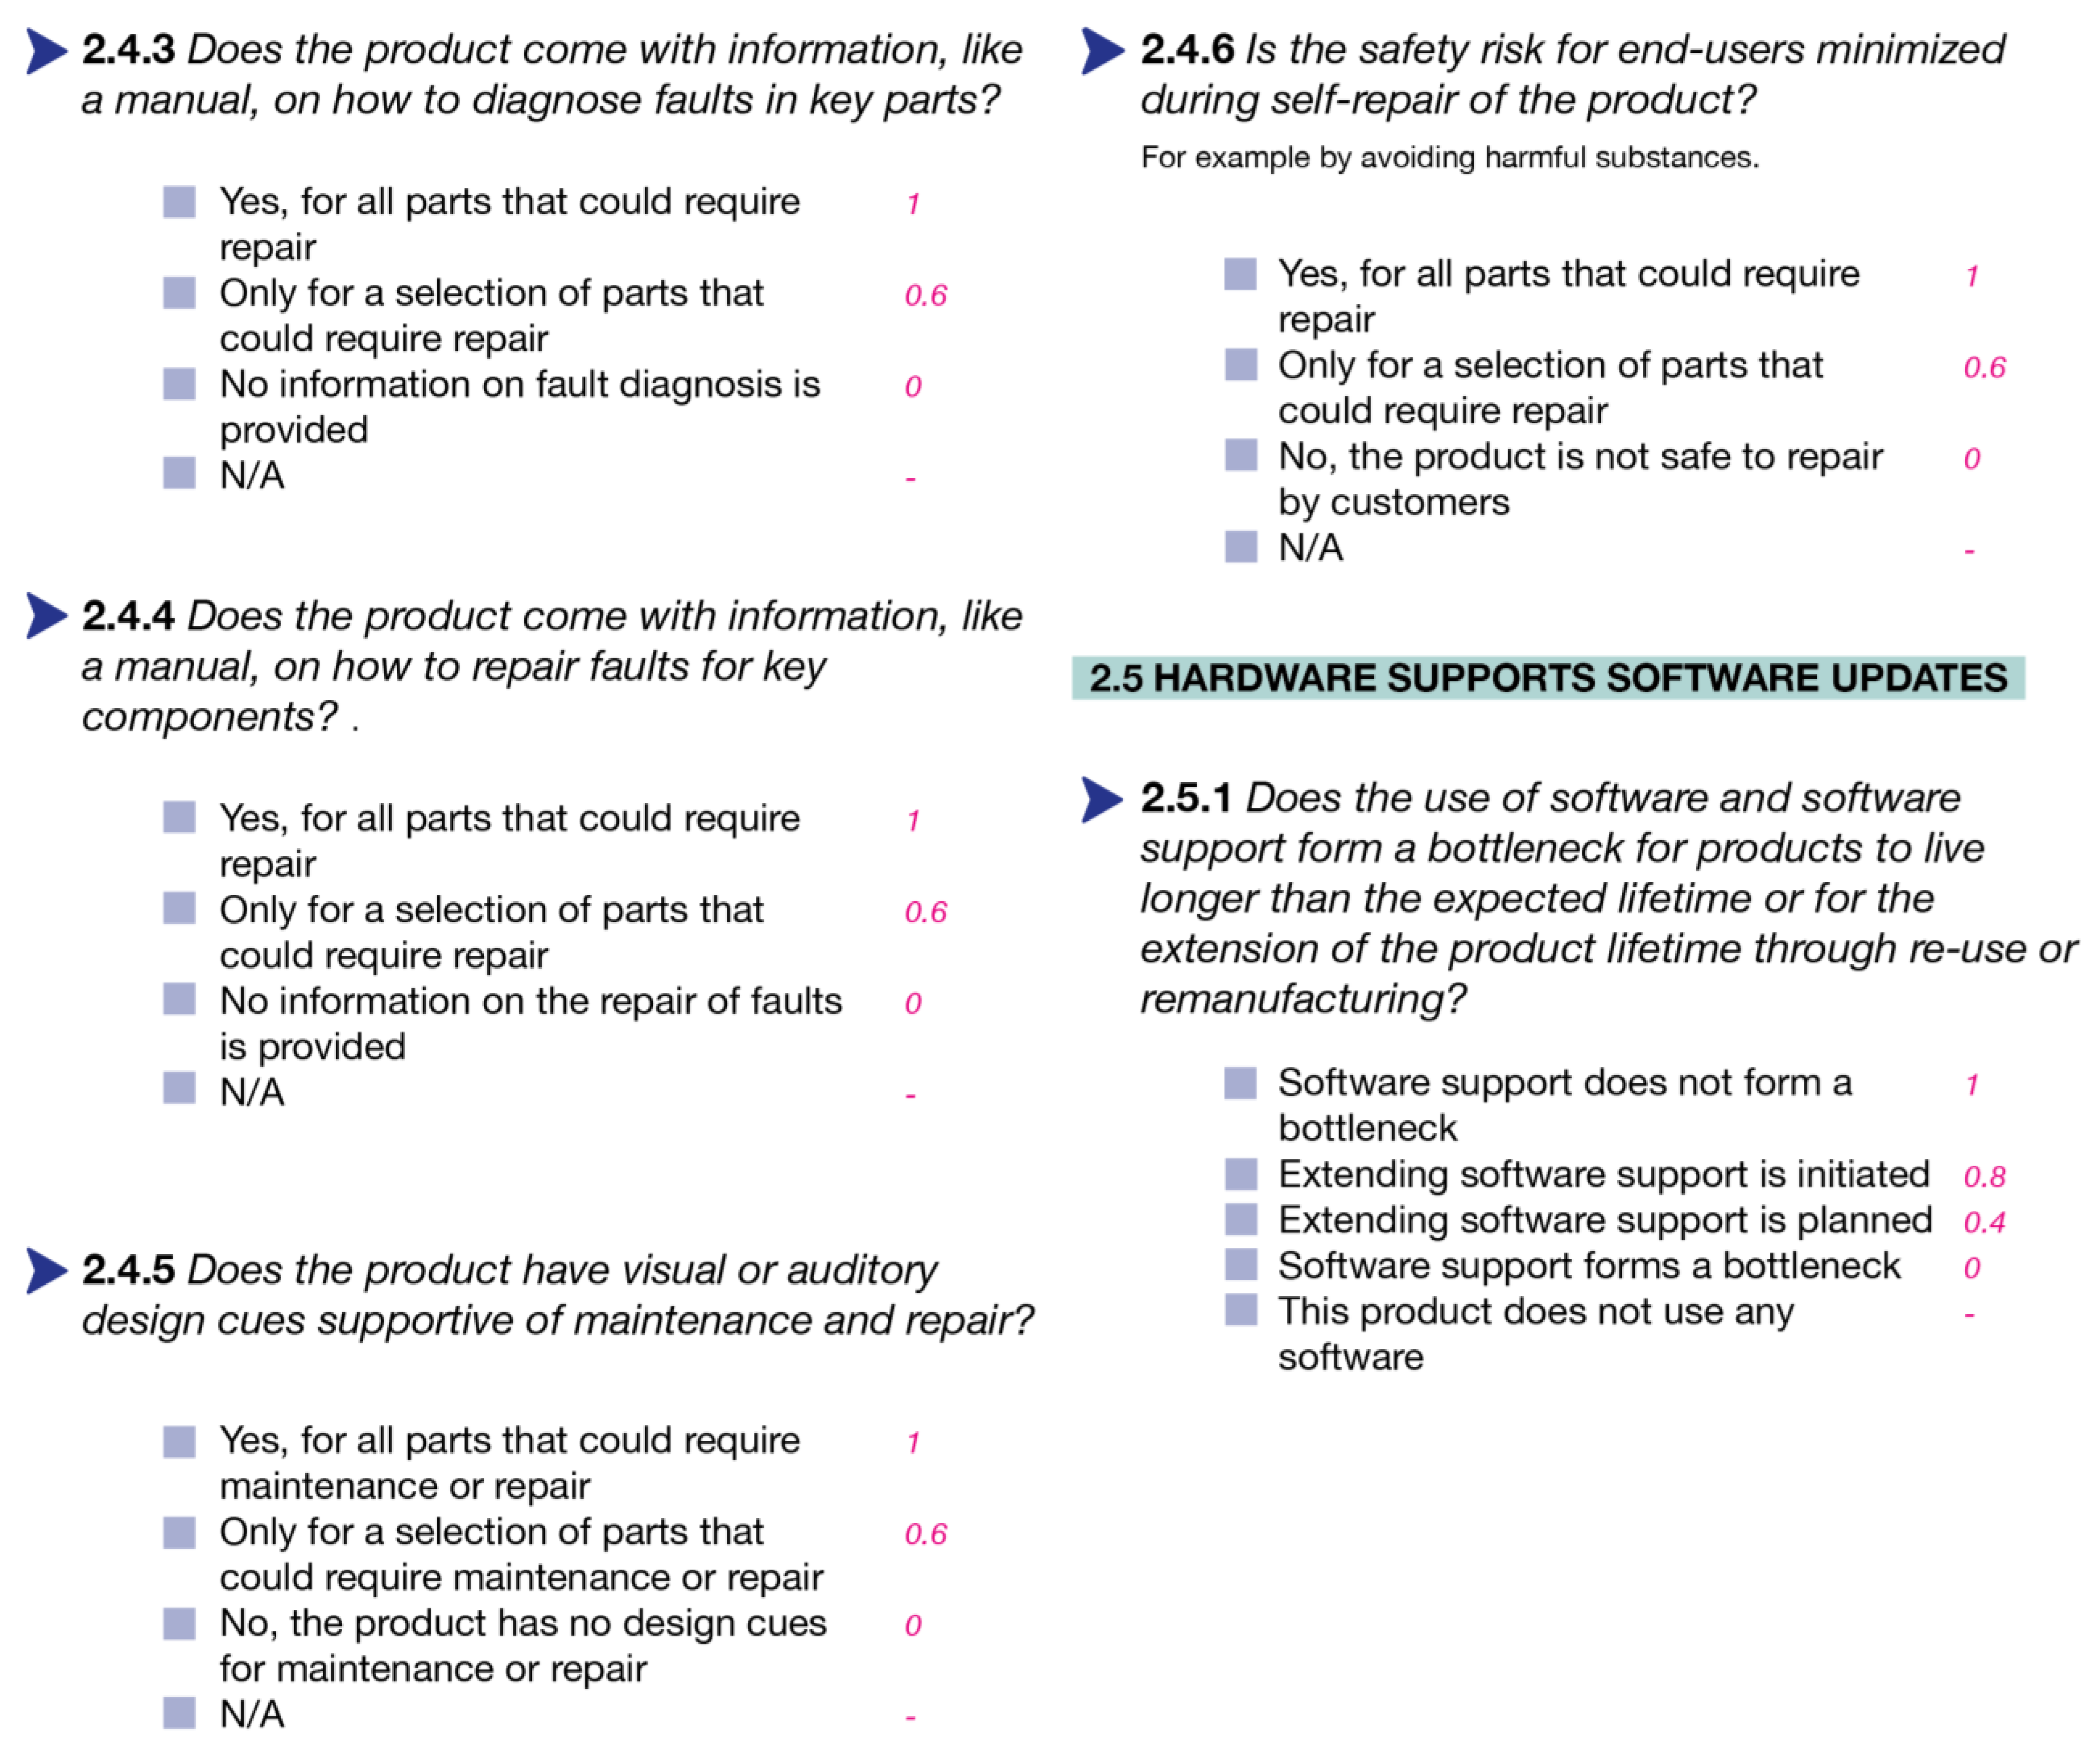
| 2.4.3 Does the product come with information, like a manual, on how to diagnose faults in key parts? | Providing information about fault diagnosis can help in restoring a product’s function in a time-efficient, safe, and cheap way [48]. |
| 2.4.4 Does the product come with information, like a manual, on how to repair faults for key components? | Providing information about repairing faults can help in restoring a product’s function in a time-efficient, safe, and cheap way [49]. |
| 2.4.5 Does the product have visual or auditory design cues supportive of maintenance and repair? | A product’s design can help navigate the user in following the simplest and time-efficient route for disassembly in order to maintain or repair a product [48]. |
| 2.4.6 Is the safety risk for end-users minimized during self-repair of the product? | A product’s design can be built facilitate safe maintenance, disassembly, and repair, not only by providing manuals, such as mandated by EU legislation, but also through the physical design features [48]. The question was rephrased as a result of the company evaluation (Section 5). |
| 2.5 Software support | |
| 2.5.1 Does the product make use of any software? | A product that uses software to operate (a part of) its functionality. |
| 2.5.2 Does software support form a bottleneck for products to live longer than the expected lifetime or for the extension of the product lifetime through re-use or remanufacturing? | Products that run software and serve for multiple use-cycles should have hardware to support continuous software updates and upgrades, as well as availability of new versions of this software [43]. |
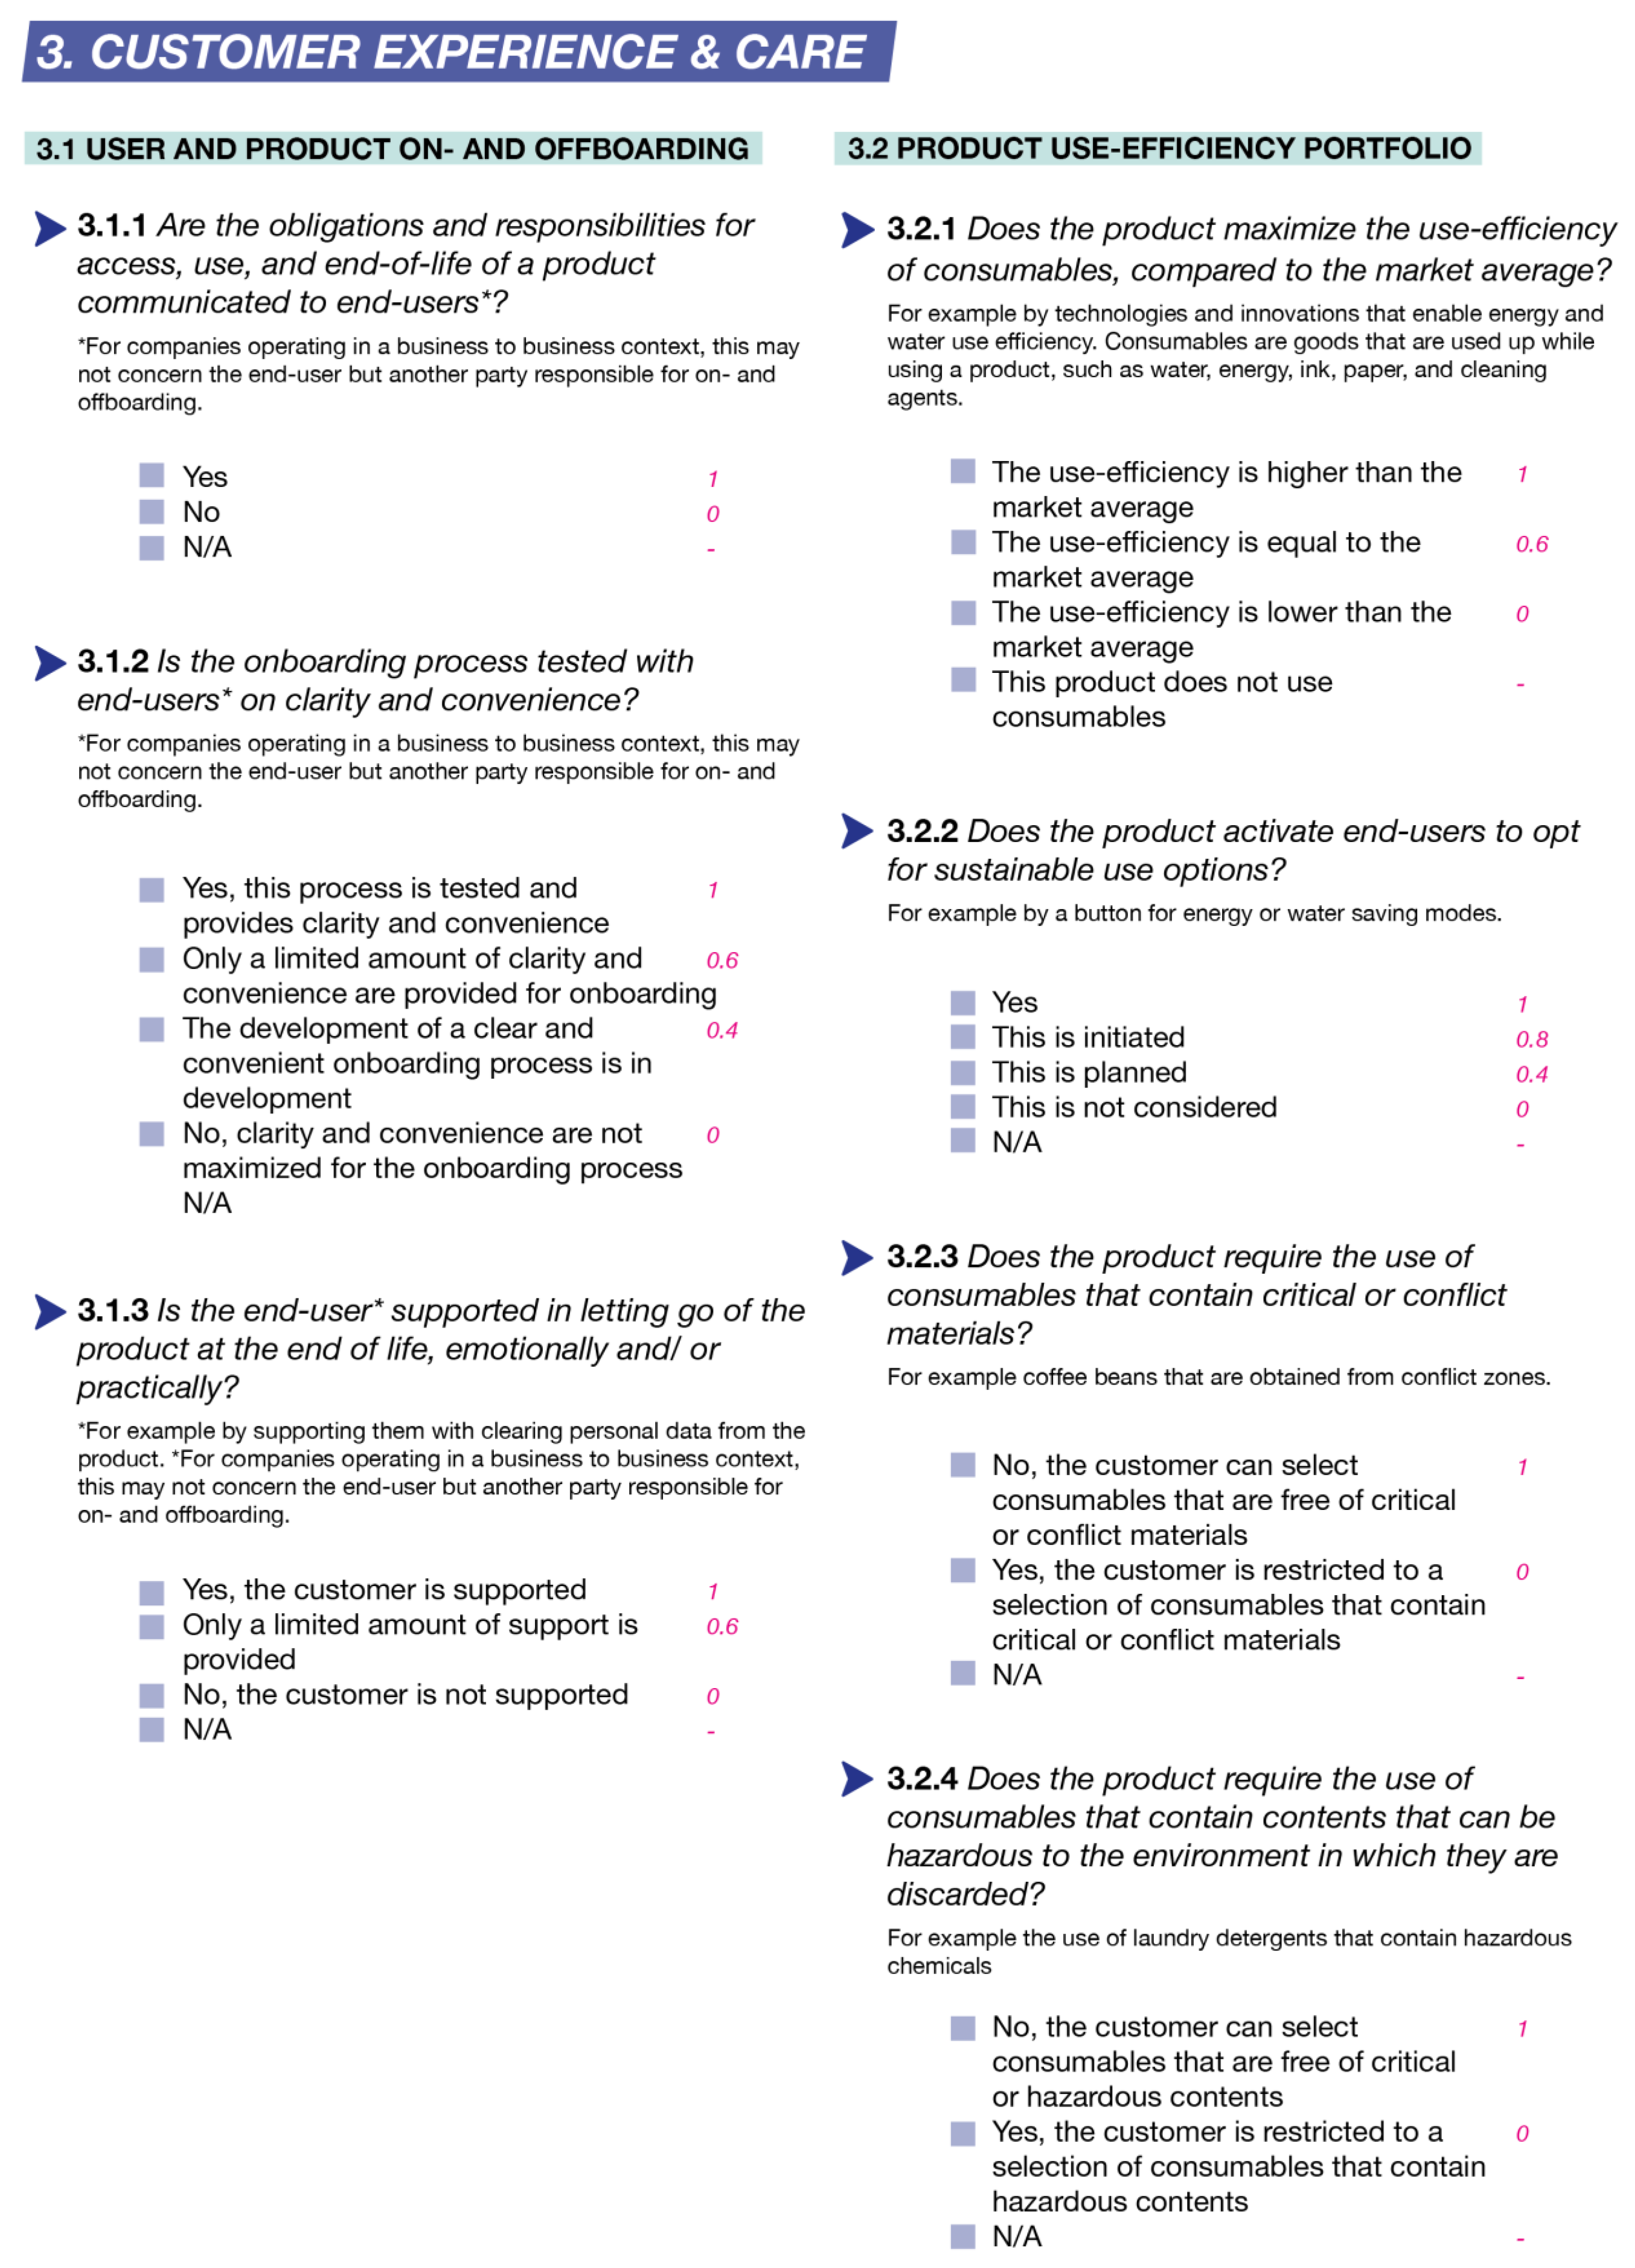
| 3. CUSTOMER EXPERIENCE AND CARE | |
| 3.1 On- and off-boarding | |
| 3.1.1 Are the obligations and responsibilities for access, use, and end-of-life of a product communicated to end-users *? * For companies operating in a business to business context, this may not concern the end-user but another party responsible for on- and offboarding. | A central design intervention in gaining acceptance of users in product-service-systems has to do with communicating a clear and consistent message [50]. The question was rephrased as a result of Co-creation session 4 and the company evaluation (Section 5). |
| 3.1.2 Is the onboarding process tested with end-users * on clarity and convenience? * For companies operating in a business to business context, this may not concern the end-user but another party responsible for on- and offboarding. | Major contributors to rejection of a product-service-system relate to a lack of understanding and lacking service quality, test and design iterations help prevent design flaws [50]. The question was rephrased as a result of Co-creation session 4 and the company evaluation (Section 5). |
| 3.1.3 Is the end-user * supported in letting go of the product at the end of life, either emotionally or practically? * For companies operating in a business to business context, this may not concern the end-user but another party responsible for on- and offboarding. | Design interventions focused on emotional support help increase the readiness level and willingness of end-users to return their product, through reducing uncertainty and confusion [51]. The question was rephrased as a result of Co-creation session 4 and the company evaluation (Section 5). |
| 3.2 Use efficiency | |
| 3.2.1 Does the product make use of consumables? This includes energy and water use. Consumables are goods that are used up while using a product, such as water, energy, ink, paper, and cleaning agents. | For certain products to fulfil a function, they require consumables which can be either dissipative (e.g., washing detergent) or disposable (e.g., razorblades) [52]. The question was rephrased as a result of Co-creation session 5. |
| 3.2.2 Does the product maximize the use-efficiency of consumables, compared to the market average? | Use efficiency that can be influenced by design relates to facilitating correct use, adjusted to the use context, as well as using appropriate products in the right quantities [52]. The question was rephrased as a result of Co-creation session 5. |
| 3.2.3 Does the product activate end-users to opt for sustainable use options? | Sustainable use can be promoted by complicating the more unsustainable options or simplifying the most sustainable option(s) [53]. The question was rephrased as a result of Co-creation session 5 and the company evaluation (Section 5). |
| 3.2.4 Does the product require the use of consumables that contain critical or conflict materials? | Critical or conflict materials can be avoided or minimized through careful material selection [52]. The question was rephrased as a result of Co-creation session 5. |
| 3.2.5 Does the product require the use of consumables that contain contents that can be hazardous to the environment in which they are discarded? | Hazardous materials can be avoided or minimized through careful material selection [52]. The question was rephrased as a result of Co-creation session 5. |
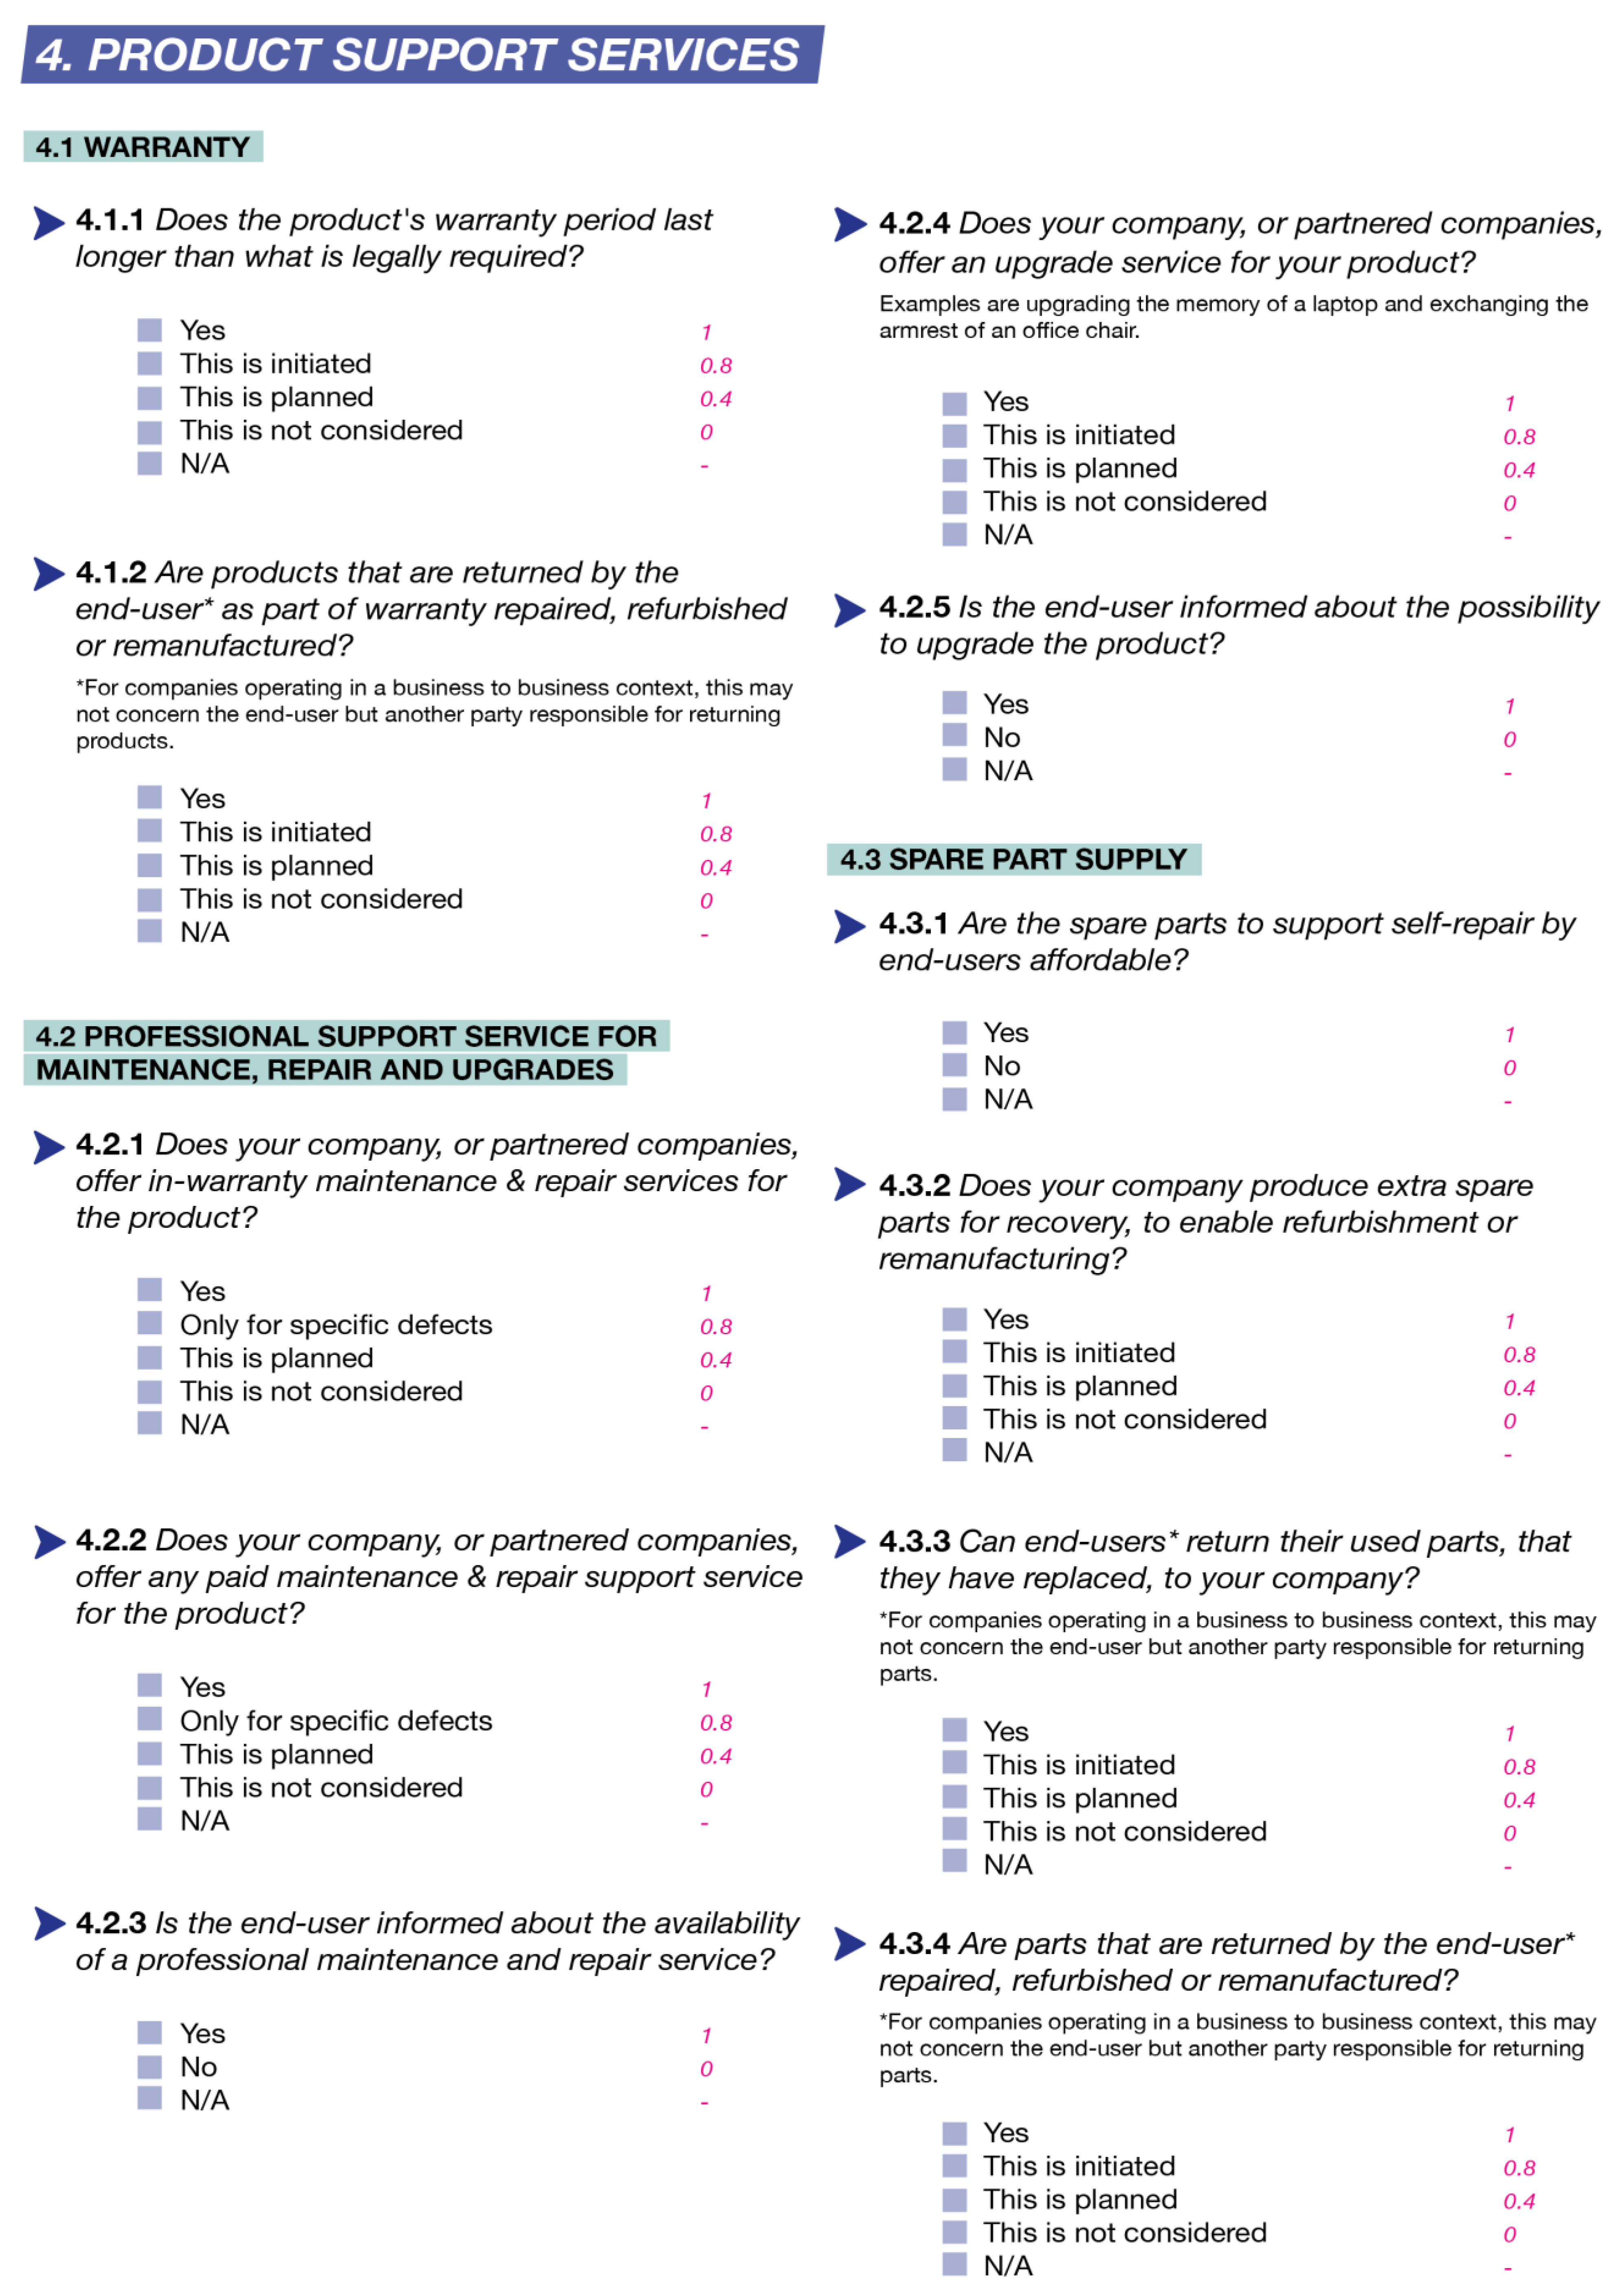
| 4. PRODUCT SUPPORT SERVICES | |
| 4.1 Warranty | |
| 4.1.1 Does the product’s warranty period last longer than what is legally required? | Warranty is provided for longer than the 2- or 5 years than mandatory from a legal perspective to guarantee a product’s durability [54]. |
| 4.1.2 Are products that are returned by the end-user * as part of warranty repaired, refurbished or remanufactured? * For companies that operate in a business to business context or offer products as a service, this may not concern the end-user but another party responsible for returning products. | Closing the loop for all of a product’s material streams adds to the circularity of a product and is a proven concept for companies to pursue remanufacturing operations [16,55]. The question was rephrased as a result of the company evaluation (Section 5). |
| 4.2 Professional support | |
| 4.2.1 Does your company, or partnered companies, offer in-warranty maintenance and repair services for the product? | In cases where a product stops functioning within the warranty period, the product should be replaced. Turing to repair to restate the function of the product is the preferred action from a circular economy point of view [54]. |
| 4.2.2 Does your company, or partnered companies, offer any paid maintenance and repair support service for the product? | The availability of professional repair services as a route to lifetime extension to meet the need for repair in cases where self-repair is impossible or not desired [56]. |
| 4.2.3 Is the end-user informed about the availability of a professional maintenance and repair service? | Awareness of the professional support services offered are necessary to close make such services truly operational [56]. The question was rephrased as a result of the company evaluation (Section 5). |
| 4.2.4 Does your company, or partnered companies, offer an upgrade service for your product? | Upgrade services allow customers to update and personalize product performance during a use-cycle [57]. |
| 4.2.5 Is the end-user informed about the possibility to upgrade the product? | The possibility for a customer to upgrade their product should be communicated through the accompanied service [57]. The question was rephrased as a result of the company evaluation (Section 5). |
| 4.3 Spare part supply | |
| 4.3.1 Are the spare parts to support self-repair by end-users affordable? | The availability of spare parts is essential to benefit from a product’s reparability [58]. Affordability of such spare parts is a key factor in motivating customers to invest in repair [59]. The question was rephrased as a result of the company evaluation (Section 5). |
| 4.3.2 Does your company produce extra spare parts for recovery, to enable refurbishment or remanufacturing? | The availability of spare parts is essential in performing recovery activities, including the required number of spare parts in the calculations for production is one of the ways to secure availability [16]. The question was rephrased as a result of Co-creation session 7. |
| 4.3.3 Can end-users * return their used parts, that they have replaced, to your company? * For companies that operate in a business to business context or offer products as a service, this may not concern the end-user but another party responsible for returning parts. | Taking back used parts that are released from product through, for example, repair, can be valuable for several reasons: they can help increase circularity though (1) recovery for spare part supply (2) dedicated material recovery [55,60]. The question was rephrased as a result of Co-creation session 7 and the company evaluation (Section 5). |
| 4.3.4 Are parts that are returned by the end-user * repaired, refurbished or remanufactured? * For companies that operate in a business to business context or offer products as a service, this may not concern the end-user but another party responsible for returning parts. | Closing the loop for all of a product’s material streams adds to the circularity of a product and is a proven concept for companies to pursue remanufacturing operations [16,55]. The question was rephrased as a result of Co-creation session 7 and the company evaluation (Section 5). |
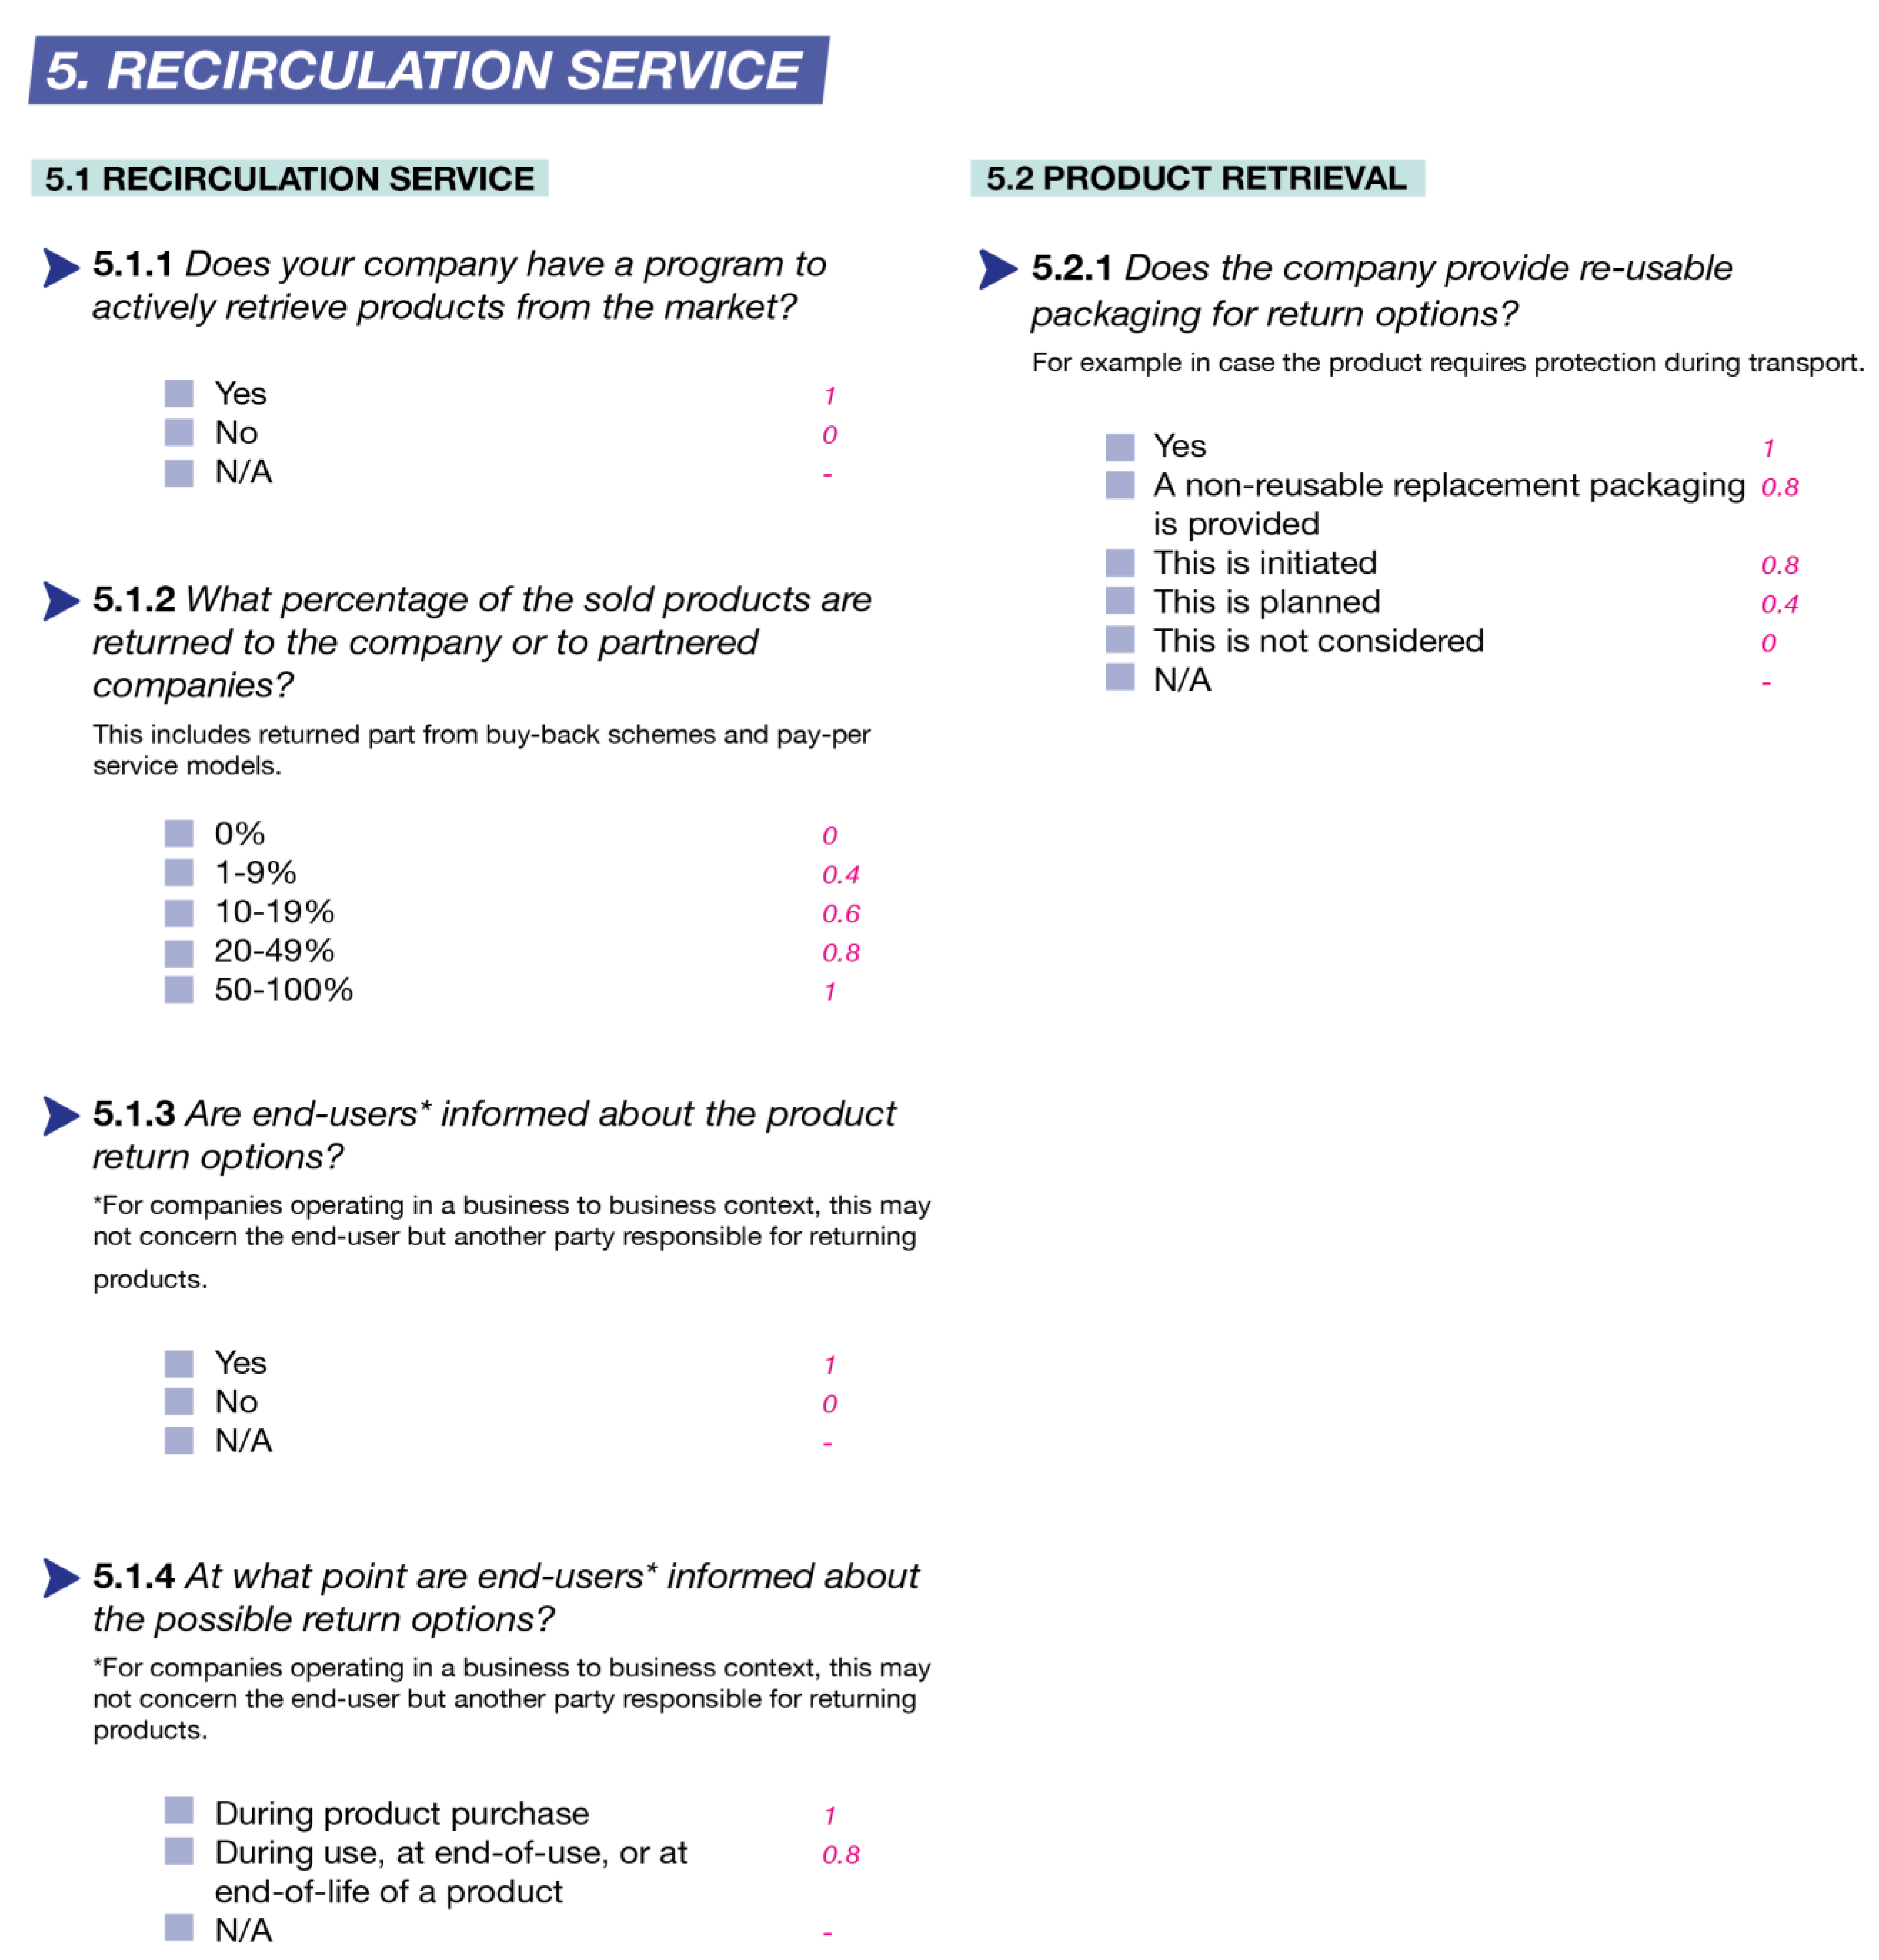
| 5. RECIRCULATION SERVICE | |
| 5.1 Return program | |
| 5.1.1 Does your company have a program to actively retrieve products from the market? | Products can be sold in combination with services, or as services, with the benefit of securing the return flow at end-of-use [61]. Having a return program prevents products to turn into waste or move into recycling before the product has reached its technical End-of-Life [62]. |
| 5.1.2 What percentage of the sold products are returned to the company or to partnered companies? | The number of products returning from the market has a significant influence on the effectiveness of a closed loop system [63]. |
| 5.1.3 Are end-users * informed about the product return options? *For companies operating in a business to business context, this may not concern the end-user but another party responsible for returning products. | Proactively marketing the options for customers to return products helps increase the awareness of the options and the likelihood of customers to engage with the options [64]. The question was rephrased as a result of the company evaluation (Section 5). |
| 5.1.4 At what point are end-users * informed about the possible return options? *For companies operating in a business to business context, this may not concern the end-user but another party responsible for returning products. | Circular design can be used to (emotionally) support customers in returning their products through design interventions at different moments in time to increase product returns [64]. The question was rephrased as a result of the company evaluation (Section 5). |
| 5.2 Product retrieval | |
| 5.2.1 Is the product designed for ease and efficiency of reverse logistics? The product can be designed to minimize the use of transportation volume, flatbed packaging, or to meet transportation conditions of existing logistical services | The question was rephrased as a result of the company evaluation (Section 5). |
| 5.2.2 Does the company provide re-usable packaging for return options? | Packaging materials typically have a short lifetime and generate a lot of waste, which can be reduced radically by replacing single use with reusable packaging [65]. |
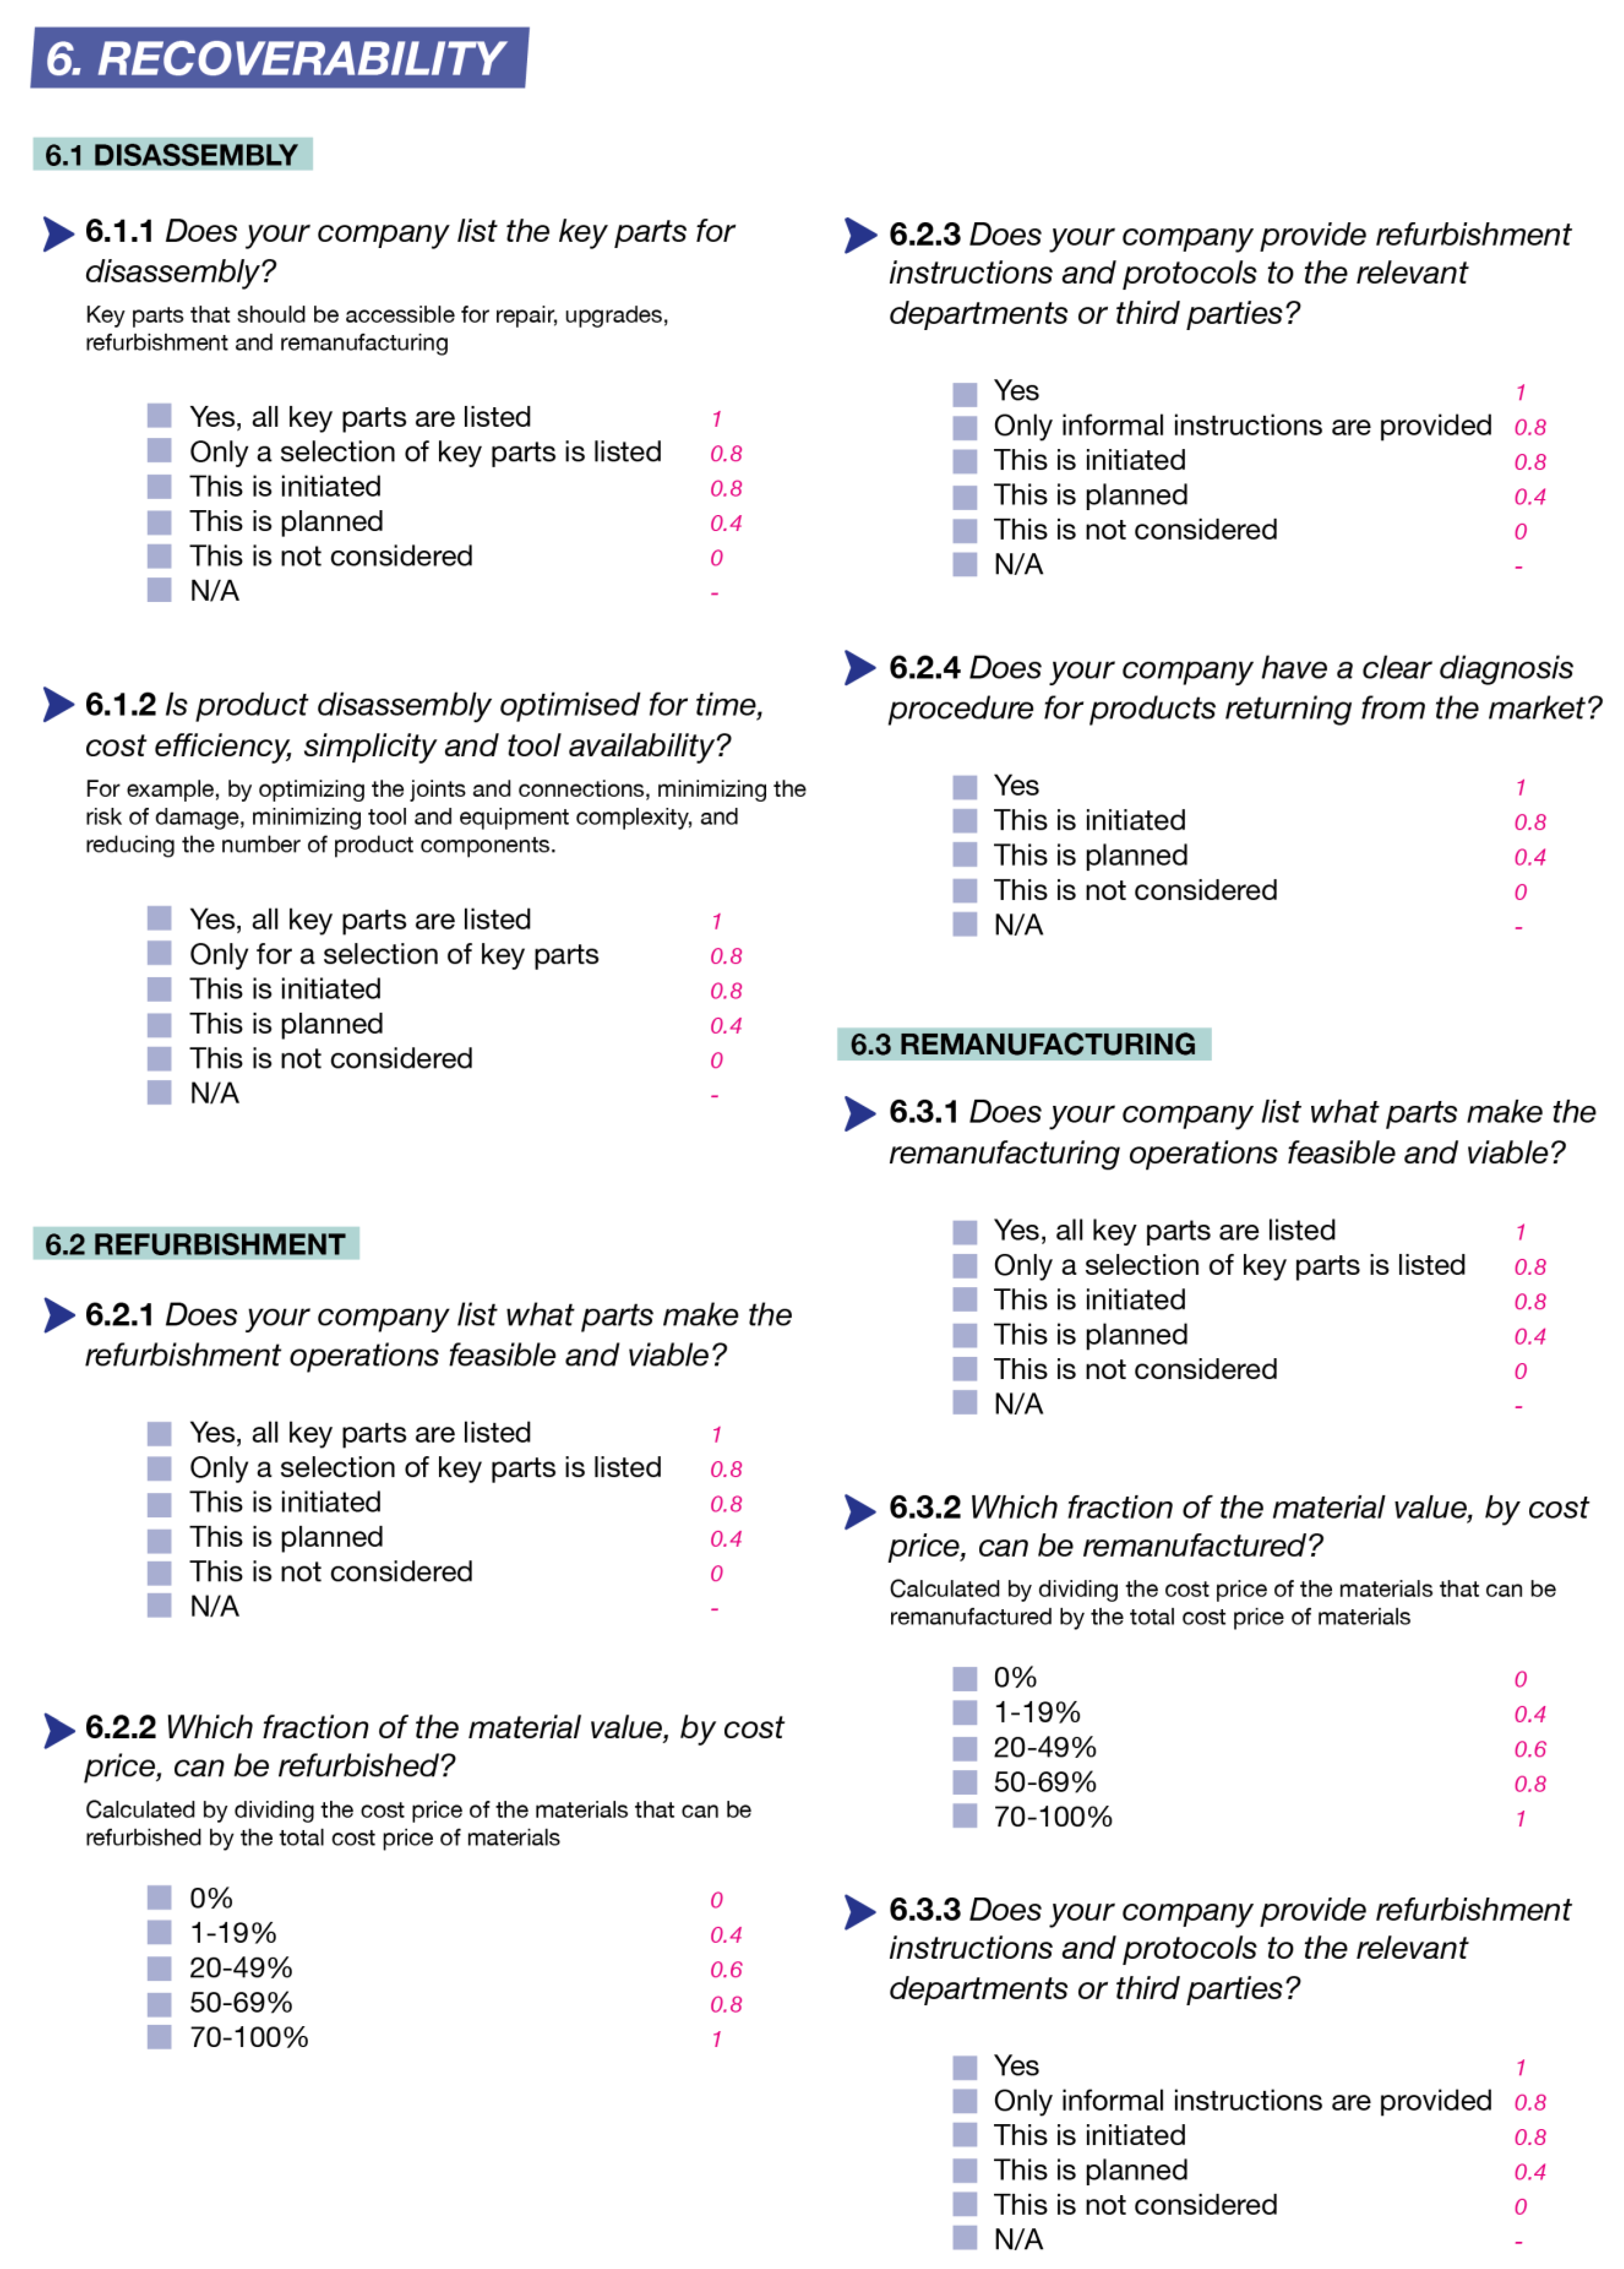
| 6. RECOVERABILITY | |
| 6.1 Disassembly | |
| 6.1.1 Does your company list the key parts for disassembly? | Key components refer to those components in a product that are technically, economically, or environmentally valuable to the recovery activities to reach to enable maintenance, repair, replacement or parts harvesting [42,66]. The question was rephrased as a result of Co-creation session 3. |
| 6.1.2 Is product disassembly and reassembly optimized for time, cost efficiency, simplicity and tool availability? | Design for disassembly helps make the disassembly process of a product feasible, while minimizing damage caused to parts, optimizing part re-use, optimizing the disassembly route to access a key part, and reducing the disassembly complexity in terms of tools, knowledge and skill needed [66]. The question was rephrased as a result of Co-creation session 3. |
| 6.2 Refurbishment | |
| 6.2.1 Does your company list what parts make the refurbishment operations feasible and viable? | The parts or sub-assemblies of a product can contribute to recoverability in different ways, like through increasing viability or feasibility. Understanding their role can help in optimizing their added value through design [16]. The question was rephrased as a result of Co-creation session 7. |
| 6.2.2 Which fraction of the material value, by cost price, can be refurbished? | Calculating the ratio of the recoverable share of a product denotes the progress towards the circularity potential of a product [5]. |
| 6.2.3 Does your company provide refurbishment instructions and protocols to the relevant departments or third parties? | Having standardized instructions for recovery operations is the first recommendation towards lean production [67]. The question was rephrased as a result of Co-creation session 7. |
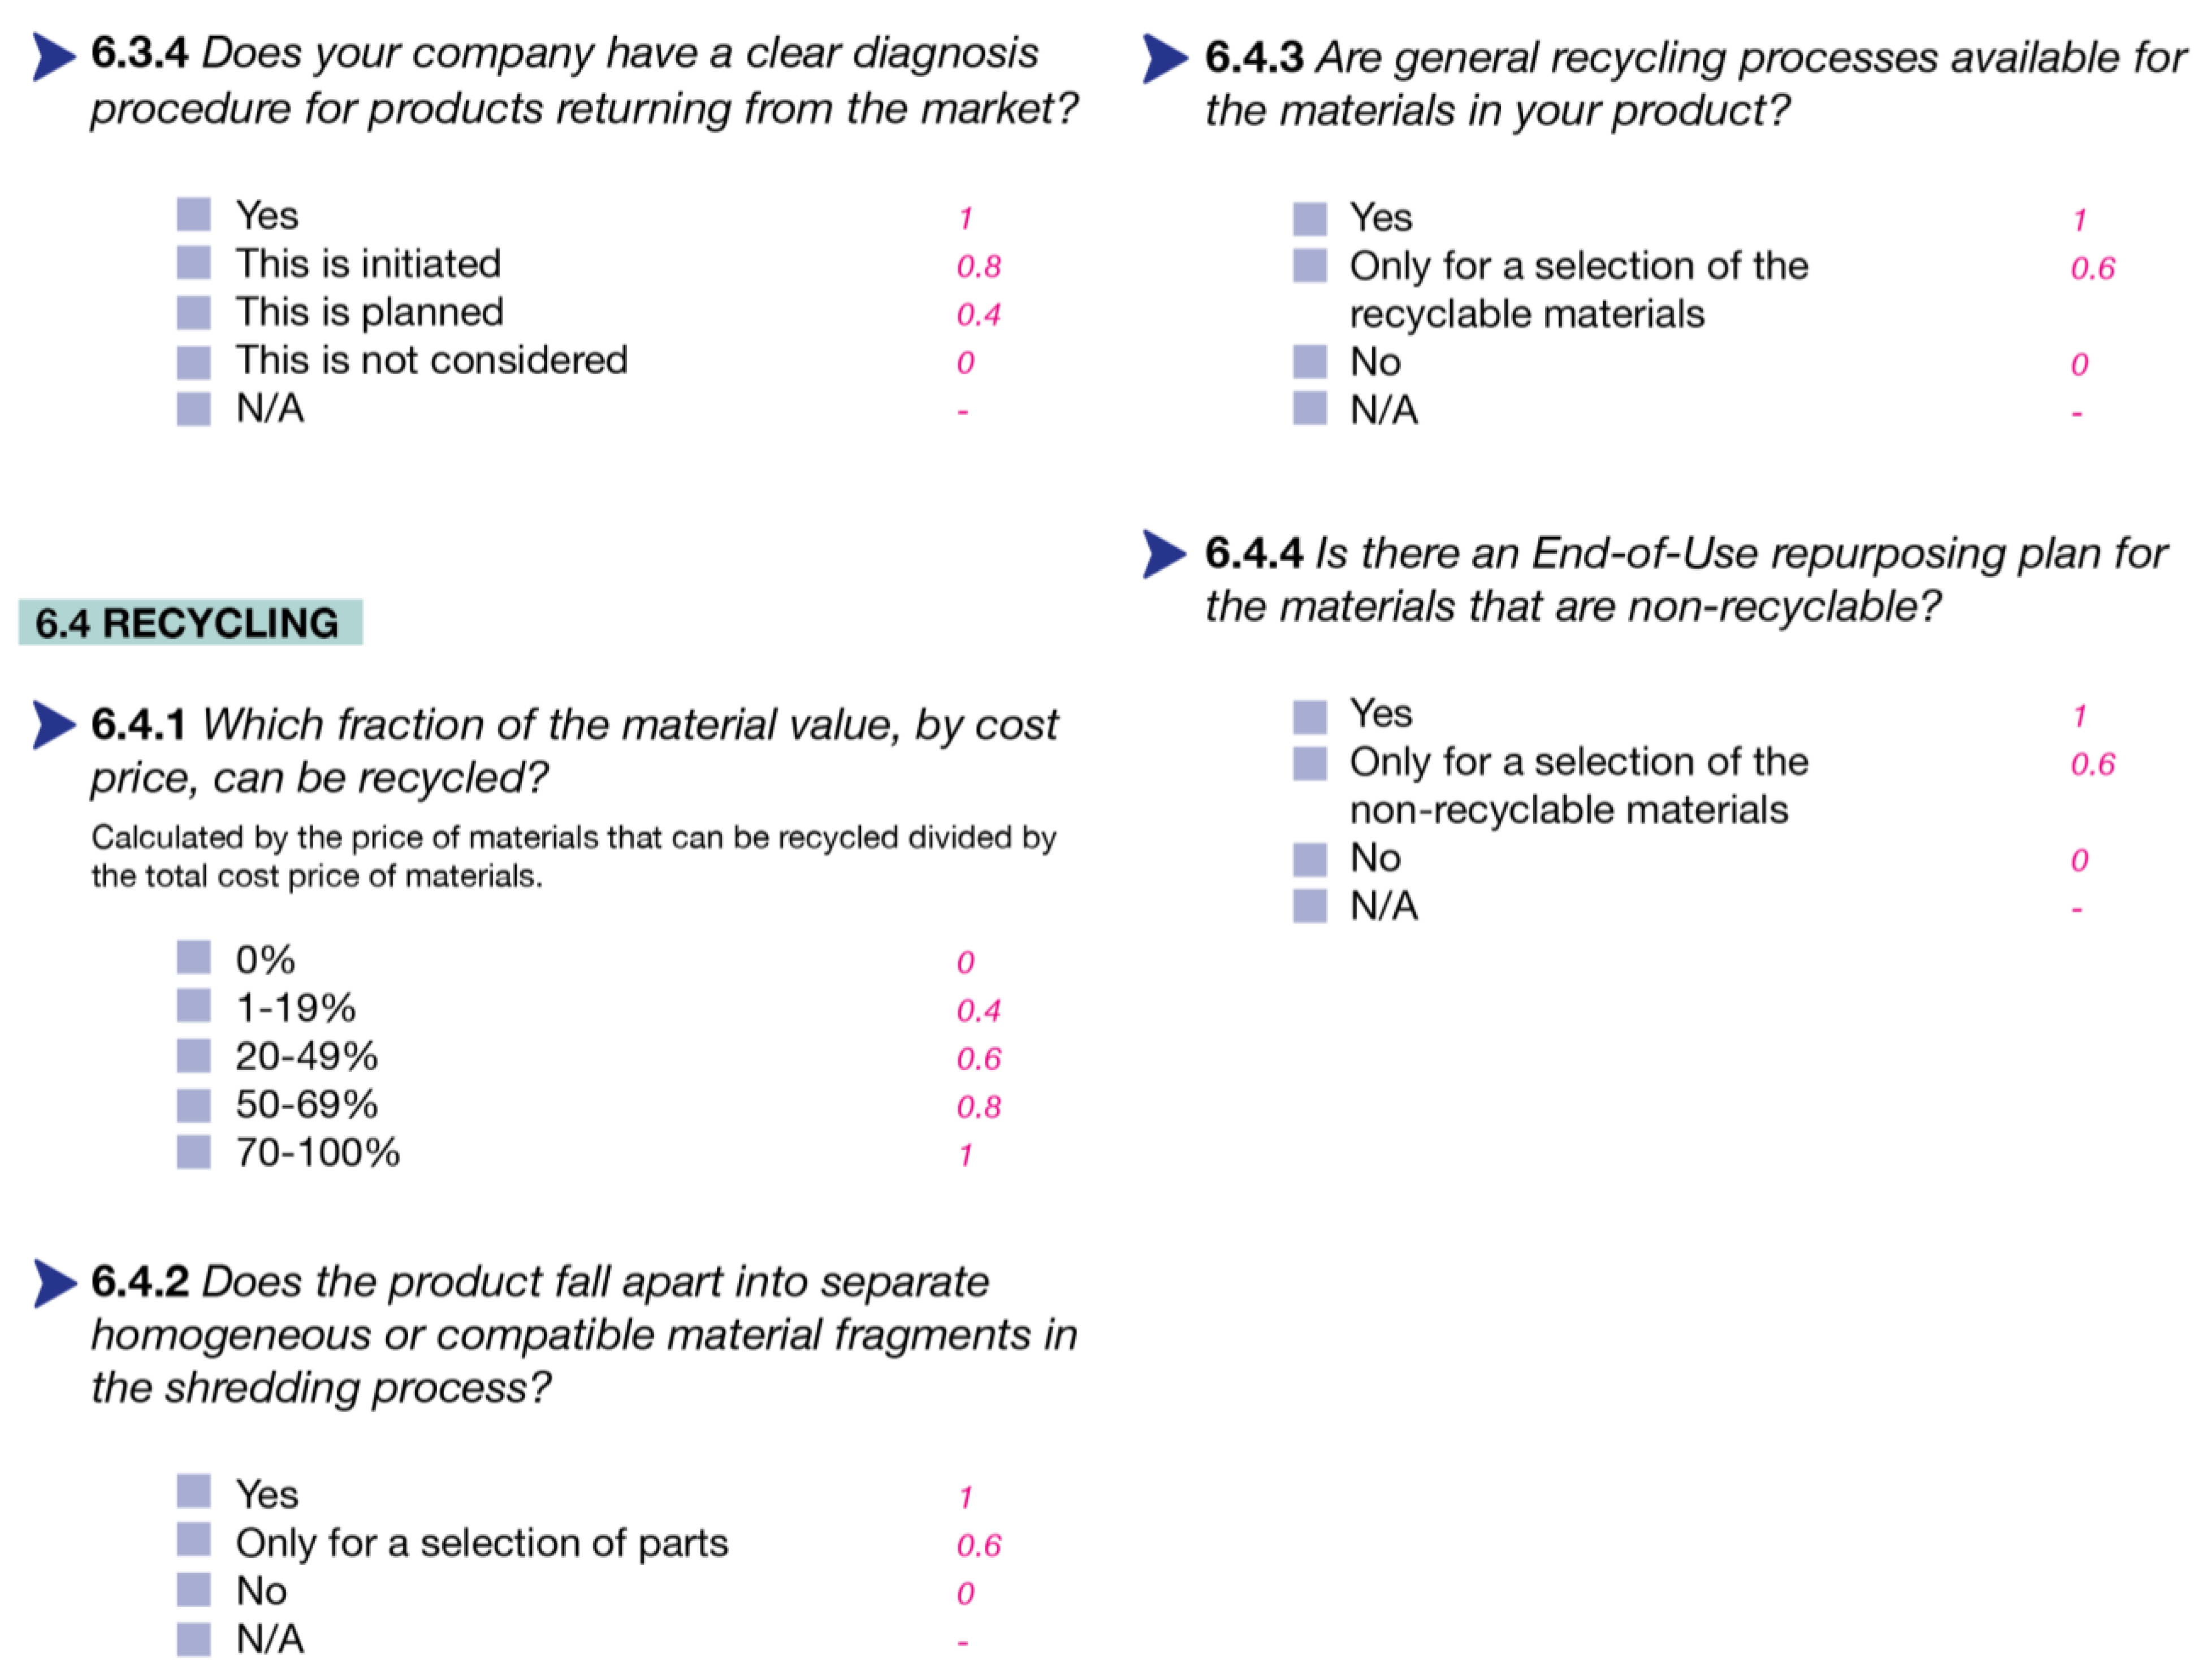
| 6.2.4 Does your company have a clear diagnosis procedure for products returning from the market? | Diagnostics is seen as the critical first, and potentially time-consuming step, of the recovery process [68,69]. Standardization of this process helps avoid deviations and avoid unnecessary time loss [67]. The question was rephrased as a result of Co-creation session 7. |
| 6.3 Remanufacturing | |
| 6.3.1 Does your company list what parts make the remanufacturing operations feasible and viable? | The parts or sub-assemblies of a product can contribute to recoverability in different ways, like through increasing viability or feasibility. Understanding their role can help in optimizing their added value through design [16]. The question was rephrased as a result of Co-creation session 7. |
| 6.3.2 Which fraction of the material value, by cost price, can be remanufactured? | Calculating the ratio of the recoverable share of a product denotes the progress towards the circularity potential of a product [5]. |
| 6.3.3 Does your company provide remanufacturing instructions and protocols to the relevant departments or third parties? | Having standardized instructions for recovery operations is the first recommendation towards lean production [67]. The question was rephrased as a result of Co-creation session 7. |
| 6.3.4 Does your company have a clear diagnosis procedure for products returning from the market? | Diagnostics is seen as the critical first, and potentially time-consuming step, of the recovery process [68,69]. Standardization of this process helps avoid deviations and avoid unnecessary time loss [67]. The question was rephrased as a result of Co-creation session 7. |
| 6.4 Recycling | |
| 6.4.1 Which fraction of the material value, by cost price, can be recycled? | Calculating the ratio of the recoverable share of a product denotes the progress towards the circularity potential of a product [5]. Expressing this ratio in value provides an inclusive image with respect to, for example, minor metals, that are often used in small quantities (Co-creation session 6; [70]). |
| 6.4.2 Does the product fall apart into separate homogeneous or compatible material fragments in the shredding process? | Separating the materials of a product into uncontaminated material streams is a key factor to high-quality recycling [40,70]. |
| 6.4.3 Are general recycling processes available for the materials in your product? | However, recyclable a material is, whether a material gets recycled in reality depends on the availability of formal recycling processes, technology, and infrastructure [71]. The more common a material is, in type and mass, the more likely it is that general recycling processes are available. The question was added as a result of Co-creation session 6. |
| 6.4.4 Is there an End-of-Use repurposing plan for the materials that are non-recyclable? | While their use is not uncommon, closing the loop for non-recyclable materials remains a challenge. Until recycling technology progresses, designers should turn to repurposing scenarios to extend the lifetime of such materials to make continued use of the value of these materials’ existing form and characteristics [9,40]. |
References
- EMF (Ellen MacArthur Foundation). Circulytics—Indicators; EMF: Cowes, UK, 2020. [Google Scholar]
- Kristensen, H.S.; Mosgaard, M.A. A review of micro level indicators for a circular economy–moving away from the three dimensions of sustainability? J. Clean. Prod. 2020, 243, 118531. [Google Scholar] [CrossRef]
- Saidani, M.; Yannou, B.; Leroy, Y.; Cluzel, F.; Kendall, A. A taxonomy of circular economy indicators. J. Clean. Prod. 2019, 207, 542–559. [Google Scholar] [CrossRef] [Green Version]
- Corona, B.; Shen, L.; Reike, D.; Carreón, J.R.; Worrell, E. Towards sustainable development through the circular economy—A review and critical assessment on current circularity metrics. Resour. Conserv. Recycl. 2019, 151, 104498. [Google Scholar] [CrossRef]
- Cayzer, S.; Griffiths, P.; Beghetto, V. Design of indicators for measuring product performance in the circular economy. Int. J. Sustain. Eng. 2017, 10, 289–298. [Google Scholar] [CrossRef] [Green Version]
- Linder, M.; Sarasini, S.; van Loon, P. A metric for quantifying product-level circularity. J. Ind. Ecol. 2017, 21, 545–558. [Google Scholar] [CrossRef] [Green Version]
- Figge, F.; Thorpe, A.S.; Givry, P.; Canning, L.; Franklin-Johnson, E. Longevity and circularity as indicators of eco-efficient resource use in the circular economy. Ecol. Econ. 2018, 150, 297–306. [Google Scholar] [CrossRef]
- Omwando, T.A.; Otieno, W.A.; Farahani, S.; Ross, A.D. A bi-level fuzzy analytical decision support tool for assessing product remanufacturability. J. Clean. Prod. 2018, 174, 1534–1549. [Google Scholar] [CrossRef]
- van Schaik, A.; Reuter, M.A. Recycling indices visualizing the performance of the circular economy. World Metall. Erzmetall 2016, 69, 201–216. [Google Scholar]
- Ellen MacArthur Foundation; Granta Design. Circularity Indicators. An Approach to Measuring Circularity. Methodology; EMF: Cowes, UK, 2015. [Google Scholar]
- Bakker, C.; den Hollander, M.; Van Hinte, E.; Zijlstra, Y. Products That Last: Product Design for Circular Business Models; TU Delft Library: Delft, The Netherlands, 2014. [Google Scholar]
- EMF (Ellen MacArthur Foundation). Towards the Circular Economy 3: Accelerating the Scale-Up across Global Supply Chains. 2014. Available online: https://ellenmacarthurfoundation.org/towards-the-circular-economy-vol-3-accelerating-the-scale-up-across-global (accessed on 12 January 2022).
- Stahel, W.R. The Performance Economy, 2nd ed.; Palgrave Macmillan: London, UK, 2010. [Google Scholar]
- Kirchherr, J.; Piscicelli, L.; Bour, R.; Kostense-Smit, E.; Muller, J.; Huibrechtse-Truijens, A.; Hekkert, M. Barriers to the circular economy: Evidence from the European Union (EU). Ecol. Econ. 2018, 150, 264–272. [Google Scholar] [CrossRef] [Green Version]
- Boorsma, N.; Peck, D.; Bakker, T.; Bakker, C.; Balkenende, R. The Strategic Value of Design for Remanufacturing: A Case Study of Professional Imaging Equipment. J. Remanuf. 2022, 12, 187–212. [Google Scholar] [CrossRef]
- EEA (European Environment Agency). Circular by Design, Products in the Circular Economy; European Environment Agency: Copenhagen, Denmark, 2017. [Google Scholar]
- Boorsma, N.; Balkenende, R.; Bakker, C.; Tsui, T.; Peck, D. Incorporating design for remanufacturing in the early design stage: A design management perspective. J. Remanuf. 2020, 11, 25–48. [Google Scholar] [CrossRef]
- Holt, D.T.; Armenakis, A.A.; Harris, S.G.; Feild, H.S. Toward a comprehensive definition of readiness for change: A review of research and instrumentation. Res. Organ. Chang. Dev. 2007, 16, 289–336. [Google Scholar] [CrossRef]
- Drucker, P.F.; Maciariello, J.A. Management, Revised ed.; Collins: New York, NY, USA, 2008. [Google Scholar]
- Krippendorff, K.; Butter, R. Product semantics-exploring the symbolic qualities of form. Innovation 1984, 3, 4–9. [Google Scholar]
- Den Hollander, M.C.; Bakker, C.A.; Hultink, E.J. Product design in a circular economy: Development of a typology of key concepts and terms. J. Ind. Ecol. 2017, 21, 517–525. [Google Scholar] [CrossRef]
- Sumter, D.; De Koning, J.; Bakker, C.; Balkenende, R. Circular economy competencies for design. Sustainability 2020, 12, 1561. [Google Scholar] [CrossRef] [Green Version]
- Daalhuizen, J.J. Method Usage in Design: How Methods Function as Mental Tools for Designers. Ph.D. Thesis, Delft University of Technology, Delft, The Netherlands, 2014. [Google Scholar]
- Pigosso, D.C.; McAloone, T.C. Making the transition to a circular economy within manufacturing companies: The development and implementation of a self-assessment readiness tool. Sustain. Prod. Consum. 2021, 28, 346–358. [Google Scholar] [CrossRef]
- Potting, J.; Hekkert, M.; Worrell, E.; Hanemaaijer, A. Circular Economy: Measuring Innovation in the Product Chain; PBL Publishers: The Hague, The Netherlands, 2017. [Google Scholar]
- Dresch, A.; Lacerda, D.P.; Antunes, J.A.V. Design science research. In Design Science Research; Springer: Cham, Switzerland, 2015; pp. 67–102. [Google Scholar]
- Peffers, K.; Tuunanen, T.; Rothenberger, M.A.; Chatterjee, S. A design science research methodology for information systems research. J. Manag. Inf. Syst. 2007, 24, 45–77. [Google Scholar] [CrossRef]
- Mielke, J.; Vermaßen, H.; Ellenbeck, S. Ideals, practices, and future prospects of stakeholder involvement in sustainability science. Proc. Natl. Acad. Sci. USA 2017, 114, E10648–E10657. [Google Scholar] [CrossRef] [Green Version]
- Bannigan, K.; Watson, R. Reliability and validity in a nutshell. J. Clin. Nurs. 2009, 18, 3237–3243. [Google Scholar] [CrossRef]
- Ente Nazionale Italiano di Unificazione (UNI). UNI 11097. Quality Management—Quality Indicators and Quality Management Synoptical Tables-General Guidelines; Ente Nazionale Italiano di Unificazione (UNI): Rome, Italy, 2003. [Google Scholar]
- Franceschini, F.; Galetto, M.; Maisano, D. Management by Measurement: Designing Key Indicators and Performance Measurement Systems; Springer Science & Business Media: Berlin/Heidelberg, Germany, 2007. [Google Scholar]
- Sumter, D.; de Koning, J.; Bakker, C.; Balkenende, R. Key Competencies for Design in a Circular Economy: Exploring Gaps in Design Knowledge and Skills for a Circular Economy. Sustainability 2021, 13, 776. [Google Scholar] [CrossRef]
- Hatcher, G.D.; Ijomah, W.L.; Windmill, J.F.C. Integrating design for remanufacture into the design process: The operational factors. J. Clean. Prod. 2013, 39, 200–208. [Google Scholar] [CrossRef]
- Bocken, N.; Short, S.; Rana, P.; Evans, S. A literature and practice review to develop sustainable business model archetypes. J. Clean. Prod. 2014, 65, 42–56. [Google Scholar] [CrossRef] [Green Version]
- van Dam, S.; Sleeswijk Visser, F.; Bakker, C. The impact of co-creation on the design of circular product-service systems: Learnings from a case study with washing machines. Des. J. 2021, 24, 25–45. [Google Scholar] [CrossRef]
- Peck, D.; Kandachar, P.; Tempelman, E. Critical materials from a product design perspective. Mater. Des. 2015, 65, 147–159. [Google Scholar] [CrossRef]
- EC (European Commission). The EU’s New Conflict Minerals Regulation: A Quick Guide if You’re Involved in the Trade in Tin Tungsten Tantalum or Gold. 2017. Available online: https://ec.europa.eu/trade/policy/in-focus/conflict-minerals-regulation/regulation-explained/ (accessed on 23 January 2022).
- OECD. OECD Due Diligence Guidance for Responsible Supply Chains of Minerals from Conflict-Affected and High-Risk Areas, 3rd ed.; OECD Publishing: Paris, France, 2016. [Google Scholar] [CrossRef]
- EMF (Ellen MacArthur Foundation). Towards the Circular Economy: Economic and Business Rationale for an Accelerated Transition. 2013. Available online: https://ellenmacarthurfoundation.org/towards-the-circular-economy-vol-1-an-economic-and-business-rationale-for-an (accessed on 10 January 2022).
- Joustra, J.; Flipsen, B.; Balkenende, R. Circular design of composite products: A framework based on insights from literature and industry. Sustainability 2021, 13, 7223. [Google Scholar] [CrossRef]
- van den Berge, R.; Magnier, L.; Mugge, R. Too good to go? Consumers’ replacement behaviour and potential strategies for stimulating product retention. Curr. Opin. Psychol. 2021, 39, 66–71. [Google Scholar] [CrossRef]
- Nasr, N.; Russell, J.; Bringezu, S.; Hellweg, S.; Hilton, B.; Kreiss, C.; von Gries, N. Re-Defining Value—The Manufacturing Revolution. Remanufacturing, Refurbishment, Repair and Direct Reuse in the Circular Economy; International Resource Panel, United Nations Environment Programme: Nairobi, Kenya, 2018; Available online: https://www.resourcepanel.org/reports/re-defining-value-manufacturing-revolution (accessed on 25 January 2022).
- Schischke, K.; Proske, M.; Nissen, N.F.; Schneider-Ramelow, M. Impact of modularity as a circular design strategy on materials use for smart mobile devices. MRS Energy Sustain. 2019, 6, E16. [Google Scholar] [CrossRef] [Green Version]
- Wallner, T.S.; Magnier, L.; Mugge, R. An exploration of the value of timeless design styles for the consumer acceptance of refurbished products. Sustainability 2020, 12, 1213. [Google Scholar] [CrossRef] [Green Version]
- Mulder, W.; Blok, J.; Hoekstra, S.; Kokkeler, F. Design for Maintenance—Guidelines to Enhance Maintainability, Reliability and Supportability of Industrial Products. 2021. Available online: https://research.utwente.nl/en/publications/design-for-maintenance-guidelines-to-enhance-maintainability-reli (accessed on 25 January 2022).
- Ingemarsdotter, E.; Kambanou, M.L.; Jamsin, E.; Sakao, T.; Balkenende, R. Challenges and solutions in condition-based maintenance implementation—A multiple case study. J. Clean. Prod. 2021, 296, 126420. [Google Scholar] [CrossRef]
- Ackermann, L. Design for Product Care. Ph.D. Thesis, Delft University of Technology, Delft, The Netherlands, 2020. [Google Scholar]
- Arcos, B.P. Fault Diagnosis in Household Appliances: A Design Perspective. Ph.D. Thesis, Delft University of Technology, Delft, The Netherlands, 2021. [Google Scholar]
- Dangal, S.; Faludi, J.; Balkenende, R. Reparability Scoring Systems: Comparing Their Objectivity and Completeness. 2022; manuscript in preparation. [Google Scholar]
- Poppelaars, F.A. Let It Go: Designing the Divestment of Mobile Phones in a Circular Economy from a User Perspective. Ph.D. Thesis, Delft University of Technology, Delft, The Netherlands, 2020. [Google Scholar]
- Poppelaars, F.; Bakker, C.; van Engelen, J. Design for divestment in a circular economy: Stimulating voluntary return of smartphones through design. Sustainability 2020, 12, 1488. [Google Scholar] [CrossRef] [Green Version]
- Willskytt, S. Resource efficient products in a circular economy—The case of consumables. Ph.D. Thesis, Chalmers University of Technology, Gothenburg, Sweden, 2020. [Google Scholar]
- Wever, R.; Van Kuijk, J.; Boks, C. User-centred design for sustainable behaviour. Int. J. Sustain. Eng. 2008, 1, 9–20. [Google Scholar] [CrossRef]
- Maitre-Ekern, E.; Dalhammar, C. Regulating planned obsolescence: A review of legal approaches to increase product durability and reparability in Europe. Rev. Eur. Comp. Int. Environ. Law 2016, 25, 378–394. [Google Scholar] [CrossRef]
- Inderfurth, K.; Mukherjee, K. Decision support for spare parts acquisition in post product life cycle. Cent. Eur. J. Oper. Res. 2008, 16, 17–42. [Google Scholar] [CrossRef]
- Niskanen, J.; McLaren, D. The Political Economy of Circular Economies: Lessons from Future Repair Scenario Deliberations in Sweden. Circ. Econ. Sustain. 2021, 1–25. [Google Scholar] [CrossRef] [PubMed]
- Poppelaars, F.A. Developing a Mobile Device for a Circular Economy. Master’s Thesis, Delft University of Technology, Delft, The Netherlands, 2014. [Google Scholar]
- Repair Café IF (International Foundation). Repair Monitor—Analysis Results 2019. 2020. Available online: https://repaircafe.org/wp-content/uploads/2020/05/RepairMonitor_analysis_2019_05052020_ENGLISH-1.pdf (accessed on 25 January 2022).
- Sabbaghi, M.; Esmaeilian, B.; Cade, W.; Wiens, K.; Behdad, S. Business outcomes of product repairability: A survey-based study of consumer repair experiences. Resour. Conserv. Recycl. 2016, 109, 114–122. [Google Scholar] [CrossRef] [Green Version]
- De Giovanni, P.; Reddy, P.V.; Zaccour, G. Incentive strategies for an optimal recovery program in a closed-loop supply chain. Eur. J. Oper. Res. 2016, 249, 605–617. [Google Scholar] [CrossRef]
- Tukker, A. Eight types of product–service system: Eight ways to sustainability? Experiences from SusProNet. Bus. Strategy Environ. 2004, 13, 246–260. [Google Scholar] [CrossRef]
- Guide, V.D.R.; Souza, G.C.; Van Wassenhove, L.N.; Blackburn, J.D. Time value of commercial product returns. Manag. Sci. 2006, 52, 1200–1214. [Google Scholar] [CrossRef] [Green Version]
- Shaharudin, M.R.; Govindan, K.; Zailani, S.; Tan, K.C.; Iranmanesh, M. Product return management: Linking product returns, closed-loop supply chain activities and the effectiveness of the reverse supply chains. J. Clean. Prod. 2017, 149, 1144–1156. [Google Scholar] [CrossRef]
- Ren, J. A Meaningful Goodbye: Design a Closure Experience for iPhone Users. Master’s Thesis, Delft University of Technology, Delft, The Netherlands, 2018. [Google Scholar]
- Sarkar, B.; Ullah, M.; Kim, N. Environmental and economic assessment of closed-loop supply chain with remanufacturing and returnable transport items. Comput. Ind. Eng. 2017, 111, 148–163. [Google Scholar] [CrossRef]
- De Fazio, F.; Bakker, C.; Flipsen, B.; Balkenende, R. The Disassembly Map: A new method to enhance design for product repairability. J. Clean. Prod. 2021, 320, 128552. [Google Scholar] [CrossRef]
- Kurilova-Palisaitiene, J.; Sundin, E.; Poksinska, B. Remanufacturing challenges and possible lean improvements. J. Clean. Prod. 2018, 172, 3225–3236. [Google Scholar] [CrossRef]
- Du, Y.; Cao, H.; Liu, F.; Li, C.; Chen, X. An integrated method for evaluating the remanufacturability of used machine tool. J. Clean. Prod. 2012, 20, 82–91. [Google Scholar] [CrossRef]
- Zhang, X.; Tang, Y.; Zhang, H.; Jiang, Z.; Cai, W. Remanufacturability evaluation of end-of-life products considering technology, economy and environment: A review. Sci. Total Environ. 2021, 764, 142922. [Google Scholar] [CrossRef] [PubMed]
- van Nielen, S.S.; Kleijn, R.; Sprecher, B.; Xicotencatl, B.M.; Tukker, A. Early-stage assessment of minor metal recyclability. Resour. Conserv. Recycl. 2022, 176, 105881. [Google Scholar] [CrossRef]
- Li, F.Q.; Wang, P.; Chen, W.; Chen, W.Q.; Wen, B.J.; Dai, T. Exploring Recycling Potential of Rare, Scarce, and Scattered Metals: Present Status and Future Directions. Sustain. Prod. Consum. 2022, 30, 988–1000. [Google Scholar] [CrossRef]

| Method | Purpose | Criteria | ||||
|---|---|---|---|---|---|---|
| 1. Indicates Levels of Readiness | 2. Indicates Company Strengths and Areas for Improvement | 3. Uses Product Design Semantics | 4. Takes a Full Lifecycle Focus | 5. Easy to Apply in Industry | ||
| C-Indicators Advisor—Saidani et al. [3] | Offers guidance to practitioners in selecting and applying existing circularity indicator sets | X | X | |||
| Circulytics—EMF [1] | Measures the potential of a company to adopt circularity, using a broad set of metrics about the organization as well products and material flows | X | X | |||
| MATChE—Pigosso and McAloone [24] | Helps manufacturing companies assess their readiness for circular economy implementation to enhance the potential of success | X | X | |||
| CE Indicator Prototype (CEIP)—Cayzer et al. [5] | Evaluates product performance of producing companies within the circular economy model as defined by the EMF | X | X | |||
| CE transition in product chains (CE-TPC)—Potting et al. [25] | Measures circular policy achievements and their effects on resource flows | X | ||||
Publisher’s Note: MDPI stays neutral with regard to jurisdictional claims in published maps and institutional affiliations. |
© 2022 by the authors. Licensee MDPI, Basel, Switzerland. This article is an open access article distributed under the terms and conditions of the Creative Commons Attribution (CC BY) license (https://creativecommons.org/licenses/by/4.0/).
Share and Cite
Boorsma, N.; Polat, E.; Bakker, C.; Peck, D.; Balkenende, R. Development of the Circular Product Readiness Method in Circular Design. Sustainability 2022, 14, 9288. https://doi.org/10.3390/su14159288
Boorsma N, Polat E, Bakker C, Peck D, Balkenende R. Development of the Circular Product Readiness Method in Circular Design. Sustainability. 2022; 14(15):9288. https://doi.org/10.3390/su14159288
Chicago/Turabian StyleBoorsma, Nina, Esra Polat, Conny Bakker, David Peck, and Ruud Balkenende. 2022. "Development of the Circular Product Readiness Method in Circular Design" Sustainability 14, no. 15: 9288. https://doi.org/10.3390/su14159288
APA StyleBoorsma, N., Polat, E., Bakker, C., Peck, D., & Balkenende, R. (2022). Development of the Circular Product Readiness Method in Circular Design. Sustainability, 14(15), 9288. https://doi.org/10.3390/su14159288