Article

Conditions Affecting Wind-Induced PM10 Resuspension as a Persistent Source of Pollution for the Future City Environment

1
Faculty of Mechanical Engineering, Brno University of Technology, 61669 Brno, Czech Republic
2
Transport and Environment Department, Division of Sustainable Transport and Road Structures Diagnostics, Transport Research Centre, 63600 Brno, Czech Republic
3
ATEM—Ateliér Ekologických Modelů s.r.o. Roztylská 1860/1, 14800 Praha, Czech Republic
*
Author to whom correspondence should be addressed.
Sustainability 2022, 14(15), 9186; https://doi.org/10.3390/su14159186
Submission received: 27 June 2022 / Revised: 22 July 2022 / Accepted: 25 July 2022 / Published: 27 July 2022
(This article belongs to the Section Air, Climate Change and Sustainability)

Abstract

:
Air pollution by particulate matter (PM) in cities is an ongoing problem with increasing severity. The biggest PM contributors are traffic and domestic fire burning. With the shift towards electromobility and the use of low-emission fuels, attention should be shifted to less mentioned sources of pollution. Such sources of pollution include wind-induced resuspension. This study focuses on determining the threshold wind speed causing the resuspension of particulate matter (TWSR) with aerodynamic diameter smaller than 10 µm. A methodology is introduced that examines how data could be treated to identify its characteristics (for locations where only PM10 data are available). The most significant monitored parameters are air humidity, wind direction, time of the day, and surface type. The characteristic wind speeds causing resuspension are identified in four locations for different times of day. It was proven that at times of intense human activity, particles are lifted by wind more easily. The mean threshold wind speed causing resuspension in the studied urban environment was identified as 1.58 m/s at a height of 2 m above the surface. The wind speeds were also compared with experimental studies of resuspension. The results proved correspondence between the identified wind speeds and the experimental results.

1. Introduction

Pollution of the low atmosphere by particulate matter is a current problem in many populated areas, where traffic as well as other human activities are very intense [1]. Particulate matter with aerodynamic diameter smaller than 10 micro-meters (PM10) can enter the human respiratory tract, where it can pose a serious health risk [2]. The World Health Organization (WHO) has classified air pollution as the biggest health risk of the 21st century [3]. It caused 4.5 million deaths in 2017 [4].
In a city environment, particles are produced by a variety of sources (traffic, industry, burning of solid fuels, etc.), as shown in Figure 1. The dominant contribution originates in traffic-related emissions and domestic fire burning [5]. These sources are typically responsible for almost 50% of particulate emissions in cities. With the gradual shift to electromobility, the focus is shifting to non-exhaust emissions [6]. In contrast to exhaust emissions, non-exhaust emissions produce larger particles [7]. In the future, a gradual move away from the combustion of solid fuels in households and industry is expected. However, some sources cannot be affected by mitigation measures. Thus, the production of particles in urban environments cannot be completely ruled out. Wind-induced resuspension is one of the most significant non-combustion PM10 sources. The resuspension is the process in which the particles deposited on a surface reenter the atmosphere due to influence of wind. It is difficult to determine the contribution of this source to the total air pollution [5]. Primary produced particles are deposited on urban surfaces such as roads, roofs, pavements with concrete tiles, other paved surfaces, vegetation, bare soil, etc. [8]. The combination of particles deposited on the surfaces with strong flows above them create conditions for subsequent resuspension. Wind-induced resuspension is thus a secondary source of particles. Particles can be resuspended and cause pollution many times [9]. In the study [5], resuspension is considered as a natural source of particles, even if these particles come from urban surfaces. Wind-induced resuspension can also be a source of particles from open areas outside the city. In this case, the process is referred to as wind erosion. This process is summarized in the publications [10,11]. Wind-induced soil erosion is therefore a significant source of background particle concentrations in cities.
Many studies have addressed the process of wind-induced resuspension in cities, for example, [8,9,12,13,14,15]. These studies focus on the evaluation of long-term data of PM10 and PM2.5 concentrations. It is assumed that only the PM10-2.5 fraction is capable of resuspension. The result of the data analysis is the threshold wind speed causing resuspension of particulate matter (TWSR). A mathematical relationship describing the increase in concentration due to resuspension can be derived as well. The assumption of the studies is that there are two components of particle concentration as a function of wind speed. The first decreases with increasing wind speed. The second increases, with its source being the resuspension of the particles. Previous studies have not assessed conditions influencing resuspension in data processing. Resuspension can happen under very different parameters [16]:
Time—In general, the initial number of resuspended particles is significantly greater than the number of particles after a period of higher wind speeds [17,18]. This is caused by the weakly attached particles being lifted at the beginning of the process [19]. A dominant amount of particulate matter is released from urban surfaces due to wind in the morning and evening rush hours. At these times, human activities are the highest and the number of particles deposited on surfaces is significant;
Humidity—The influence in this situation is the capillary effect acting on the liquid–surface interface of the particle, which creates additional adhesive force [20,21,22]. Adhesive force can significantly reduce the number of particles that are capable of resuspension;
Direction of wind—When measuring air pollution caused by resuspension, it is necessary that the wind be directed from the open spaces towards the measuring station. Otherwise, the data could be distorted by air circulating in the lee of buildings. Using directional analysis, it is then possible to show from which surface the particles originate [15,18,23];
Background concentration—A certain level of particulate matter concentration is almost always present in the air in each location. Based on long-term measurements, the background concentration in Brno was set at 20 μg/m3 [8]. This concentration value can be subtracted from the unmeasured concentrations, as indicated by [9].
The conditions described above have a major impact on the behavior of resuspension. Only a limited number of studies have addressed the identification of wind-induced resuspension in urban environments. However, conditions affecting resuspension are often not considered. The key question this study answers is: “What will be the result of the data processing if these conditions are included?” When they are considered, the behavior of resuspension should be shown to realistically reflect the conditions that affect it. The results may show under which conditions resuspension is a significant source of particles. Consequently, mitigation measures may be considered. In this study, the authors present a procedure to identify the characteristics of wind-induced resuspension with the inclusion of conditions that significantly influence the source. The study was carried out in the region of Brno, Czech Republic.

2. Materials and Methods

2.1. Methodology Background

Wind in cities can cause a higher concentration of particulate matter in the air, as suggested by study [8,9]. With regard to the microworld of particles and the following knowledge, there is an exact threshold speed of flow around the particle that can lift it for each specific combination of particle size and surface (characterized by its roughness) [21,24]. The concept of threshold velocity or threshold friction velocity is reviewed in study [25], where micro-modeling of particle resuspension is discussed. This concept was experimentally tested in wind tunnel experiments [18,26,27,28]. The problem is simplified in this study to a single group of particles of one size, specifically PM10. The different surfaces in urban environment are simplified and replaced with a reference surface with a single characteristic based on the percentage occurrence of the real surfaces in the specific locations. The flows in the city are replaced with a speed profile in the monitored area. Given the above, the wind speed at which resuspension will start and the wind speed at which the contribution of resuspension to the pollution load will be the greatest can be determined.

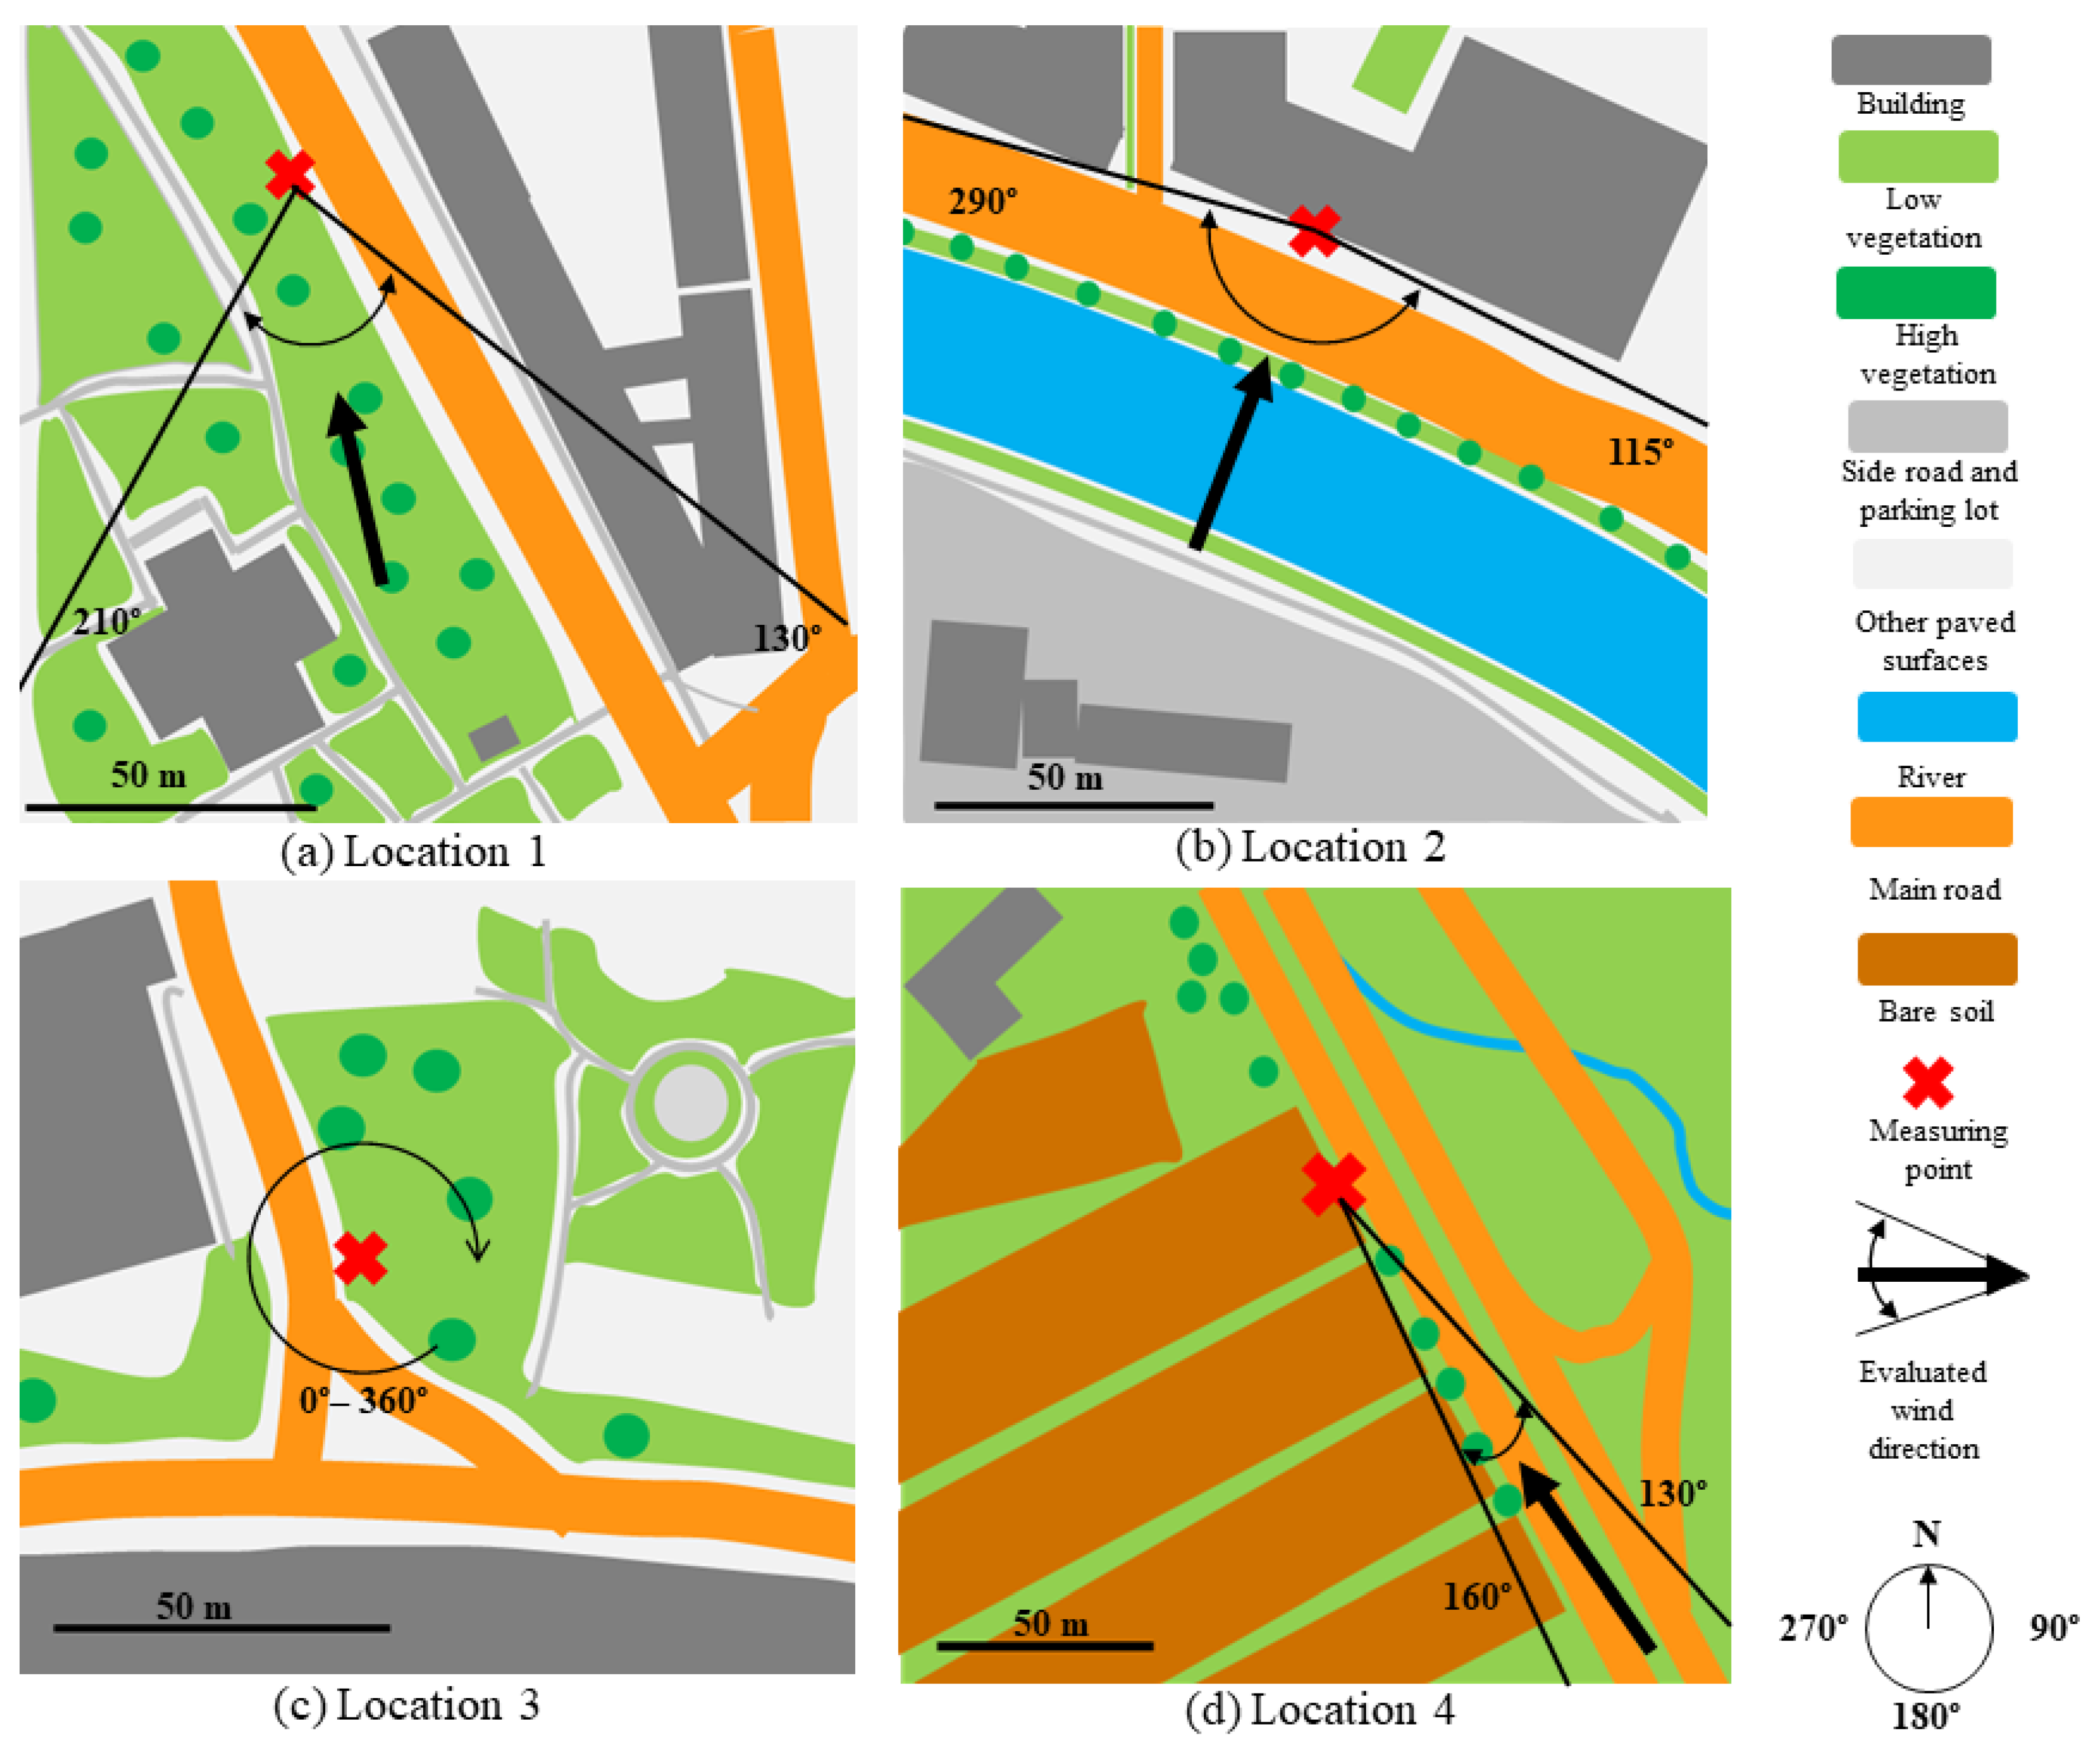
2.2. Description of the Locations

In the next section, the sites where measurements were carried out are listed. Only relevant information in relation to particle resuspension is given, such as surrounding buildings, types of surfaces, traffic intensity, and location of the measuring instrument.
Location 1Figure 2a represents a partly opened area in the center of the city of Brno, Czech Republic (pop. 400,000). On one side, there are five-floor multipurpose buildings, and on the other side, there is a park with higher vegetation and grass. The devices were placed at a grassy spot 4 m away from a four-lane road with heavy traffic, reaching a maximum of 56,000 vehicles every day.
Location 2Figure 2b also shows a partly open space on the edge of the Brno city center with a four-lane road with a traffic intensity of approximately 20,000 vehicles every day. The devices were placed 3 m away from the road on a concrete pavement. On one side of the area, there is a six-floor building, and on the other side, along the road, there is a river with some vegetation on its banks.
Location 3Figure 2c represents an open space with two to four-floor apartment buildings in the surroundings in the town of Kuřim (pop. 11,000), close to the city of Brno. The devices were placed on grass approximately 3 m away from a road near a traffic light intersection, with the traffic intensity being 18,000 vehicles every day.
Location 4Figure 2d represents a widely open location with a very high traffic intensity (approx. 40,000 vehicles every day) and a four-lane road, which is the main transit route from Brno to the north. The devices were placed 6 m away from the road on a grass-paved surface.
For a view of the wider surroundings of the sites where the measurements took place, see Supplementary Materials Figure S1 [29].

2.3. The Measurements

To identify the TWSR of the PM10 in a real environment, four sets of data were tested. Locations described above represents built-up and non-built-up areas in the city of Brno. Concentrations of gaseous pollutant (NOX), PM10, and the meteorological parameters of the environment (the wind speed and direction at the height of 2 m above the surface, humidity, atmospheric pressure) were recorded every minute. The Airpointer device (Recordum Messtechnik GmbH, Wiener Neustadt, Austria) with the WS500-UMB (G. Lufft Mess- und Regeltechnik GmbH, Fellbach, Germany) integrated meteorological station was used. Additionally, the characteristics of the traffic flow on the adjacent roads were also closely monitored using the Smart Sensor HD—Model 125 (Wavetronix, Springville, UT, USA) device to determine the times when rush hours occur in the locations.

2.4. Processing the Records of PM10 Concentrations

The dispersion of particles in the environment is affected by many parameters. Among the most important one are current meteorological conditions [30]. Therefore, the data were gathered according to the following parameters:
Humidity—In this study, data were removed when the air humidity exceeded 80%, which represents days with the rain or inversion occurrence. During these periods, resuspension is considerably limited;
Time—The data were evaluated in each location for these periods: at night from 22:00 to 6:00, in the morning rush hour from 6:00 to 9:00, between the rush hours from 9:00 to 14:00, in the evening rush hour from 14:00 to 18:00, and after the evening rush hour from 18:00 to 22:00. Dividing the evaluated data into time periods will help to evaluate the time dependence of resuspension;
Direction of wind—The wind directions used for the investigation in each location are marked in Figure 2 with a solid border line. The area is called the “evaluated area“. Considering the percentage rate of the surfaces present, characterized by the surface feature height parameter z0 [18], a reference surface was characterized by a single z0 value, respecting the relative occurrence of the real surfaces through the weighted average. The evaluated variables can then be validated with experiments performed on a specific surface in the wind tunnel;
Background—The background concentration in Brno was set at 20 μg/m3 [8], which is consistent with the results from the measured data. Background concentrations may vary throughout the time. A significant change in the concentration value is not expected, as the data were only measured during a two-month period. The constant value of the background concentration is taken as a simplifying assumption in the study. Background concentration can be subtracted from the measured concertation following [9,15].
NOX—The dependence of the NOX concentration on the wind speed was evaluated. This dependence can confirm or disprove the origin of the particulate matter in the air related to the traffic [8]. The presence of the particles in the air originating from resuspension caused by wind should not be accompanied by the presence of NOX in the air. Therefore, the concentrations of NOX and PM10 in relation to the wind speed were monitored. In the case of particles originating in traffic, the functions should be similar. However, if we account for wind-induced resuspension, these functions will not follow the same trend. This is because the source of particulates originating in wind-induced resuspension is not also the source of NOX. This is with agreement with study [9].
Based on the above-mentioned factors, the data measured were filtered and used to map the relation between the PM10 and NOX concentrations, the wind speed for each location, and the above-mentioned time periods, in order to identify the characteristic wind speed at which the resuspension process is significant in each location.

2.5. Data Statistics

Data were measured at four locations as previously described. In locations 1 and 2, they were obtained during October and November in 2019. In locations 3 and 4, they were obtained during October and November in 2018. Sample frequency was one minute. Each data point contained information on particle concentration, NOx concentration, wind speed and direction, temperature, and humidity. Some data were unusable due to errors in the measuring equipment. The datasets are thus not the same size. The original data sets have the following size: Location 1: 41,072 datapoints; Location 2: 35,773 datapoints; Location 3: 25,853 datapoints; Location 4: 25,882 datapoints. These datapoints were processed as previously described.
The following table (Table 1) contains information about how much data is left after data processing. These data were used for further evaluation.
The reason for the significant reduction of the dataset is the high occurrence of data points with a high humidity. More than 66% of all data were measured at humidity levels exceeding 80%. Data containing a suitable wind direction were then selected from the dataset. The result is a dataset that shows more clearly the behavior of resuspension, even if it is just a fraction of the original data.

2.6. Evaluation of the Records of PM10 Concentration

When assuming a source with constant production of particles, the particle concentration in the air decreases with the increasing wind speed [30]. More frequent occurrence of turbulences at higher wind speed should distribute the concentration evenly over the entire air volume above the surface. However, with respect to the occurrence of resuspension, this is only true up to a certain wind speed; see TWSR in Figure 3. As wind speed increases above this threshold, the decrease in particle concentration begins to slow down, before eventually increasing or stagnating due to the resuspension process. No other source of particles is assumed to be dependent on wind speed. The TWSR is determined graphically at the intersection point of the linear extension of the decline sections and the subsequent increase in the particle concentration; see Figure 3. The concentration then continues to increase up to the wind speed when the contribution of resuspension to the overall concentration is the greatest. The wind speed at which this peak resuspension occurs is called the maximum wind speed causing a progressive contribution of resuspension to the air pollution concentration of particles in the air—MWPC. It is determined at the moment when the increase in particle concentration reaches its maximum. With a further increase in wind speed, the particle concentration decreases again due to dilution.
The relationships were formed by fitting the fifth degree of the polynomial to the filtered-out data with Microsoft Excel. The fifth-degree polynomial was determined as the best candidate based on the k-fold cross-validation method. In this method, the use of second to tenth degree polynomials was tested. The root mean square error (RMSE) was evaluated. Although eight-, ninth-, and tenth-degree polynomials had slightly higher RMSE, they were not suitable for evaluation by the described method. Within the lower degree polynomials, second to seventh, the fifth-degree polynomial had the highest RMSE. All polynomials are presented on the selected data sample in Figure S2 in Supplementary Materials. The subsequent data evaluation was made in MATLAB. Tangents were then constructed for the dependencies at certain points. These points were determined at the locations of the greatest decrease in concentration prior to the TWSR and at the location of the maximum increase in concentration after the TWSR. Their intersection points determined the TWSR. The point of the maximum contribution of particle resuspension to the air was found where the derivative of this dependence was equal to zero.
To generalize the TWSR, the friction velocity of flow is used. The friction velocity includes both the character of the flow in the near-ground layer and the surface roughness. Similarity of the friction velocities reflects the similarity of the velocity profiles above the surface [31]. It can be calculated using the following Equation [32]:
U z = u * κ · l n ( z d z 0 )
where κ [-] is the Von Karmán constant equal to 0.41, z0 [m] is the aerodynamic roughness height, d [m] is the zero-plane displacement of the velocity profile, z [m] is the height above the surface with the velocity UZ [m/s], and u * [m/s] is the friction velocity.
The friction velocity can be used to compare the results published in studies by different authors for both model and real areas. The majority of data comes from measurements carried out in aerodynamic tunnels [17,27,33]. These studies monitored the flow velocity causing particle resuspension from different surfaces, which are also present in the urban environment. These surfaces, given their roughness complexity, were characterized by a certain variation of the surface feature height z0 [m]. It is then clear that the resulting TWSR values also vary in these studies.

3. Results and Discussion

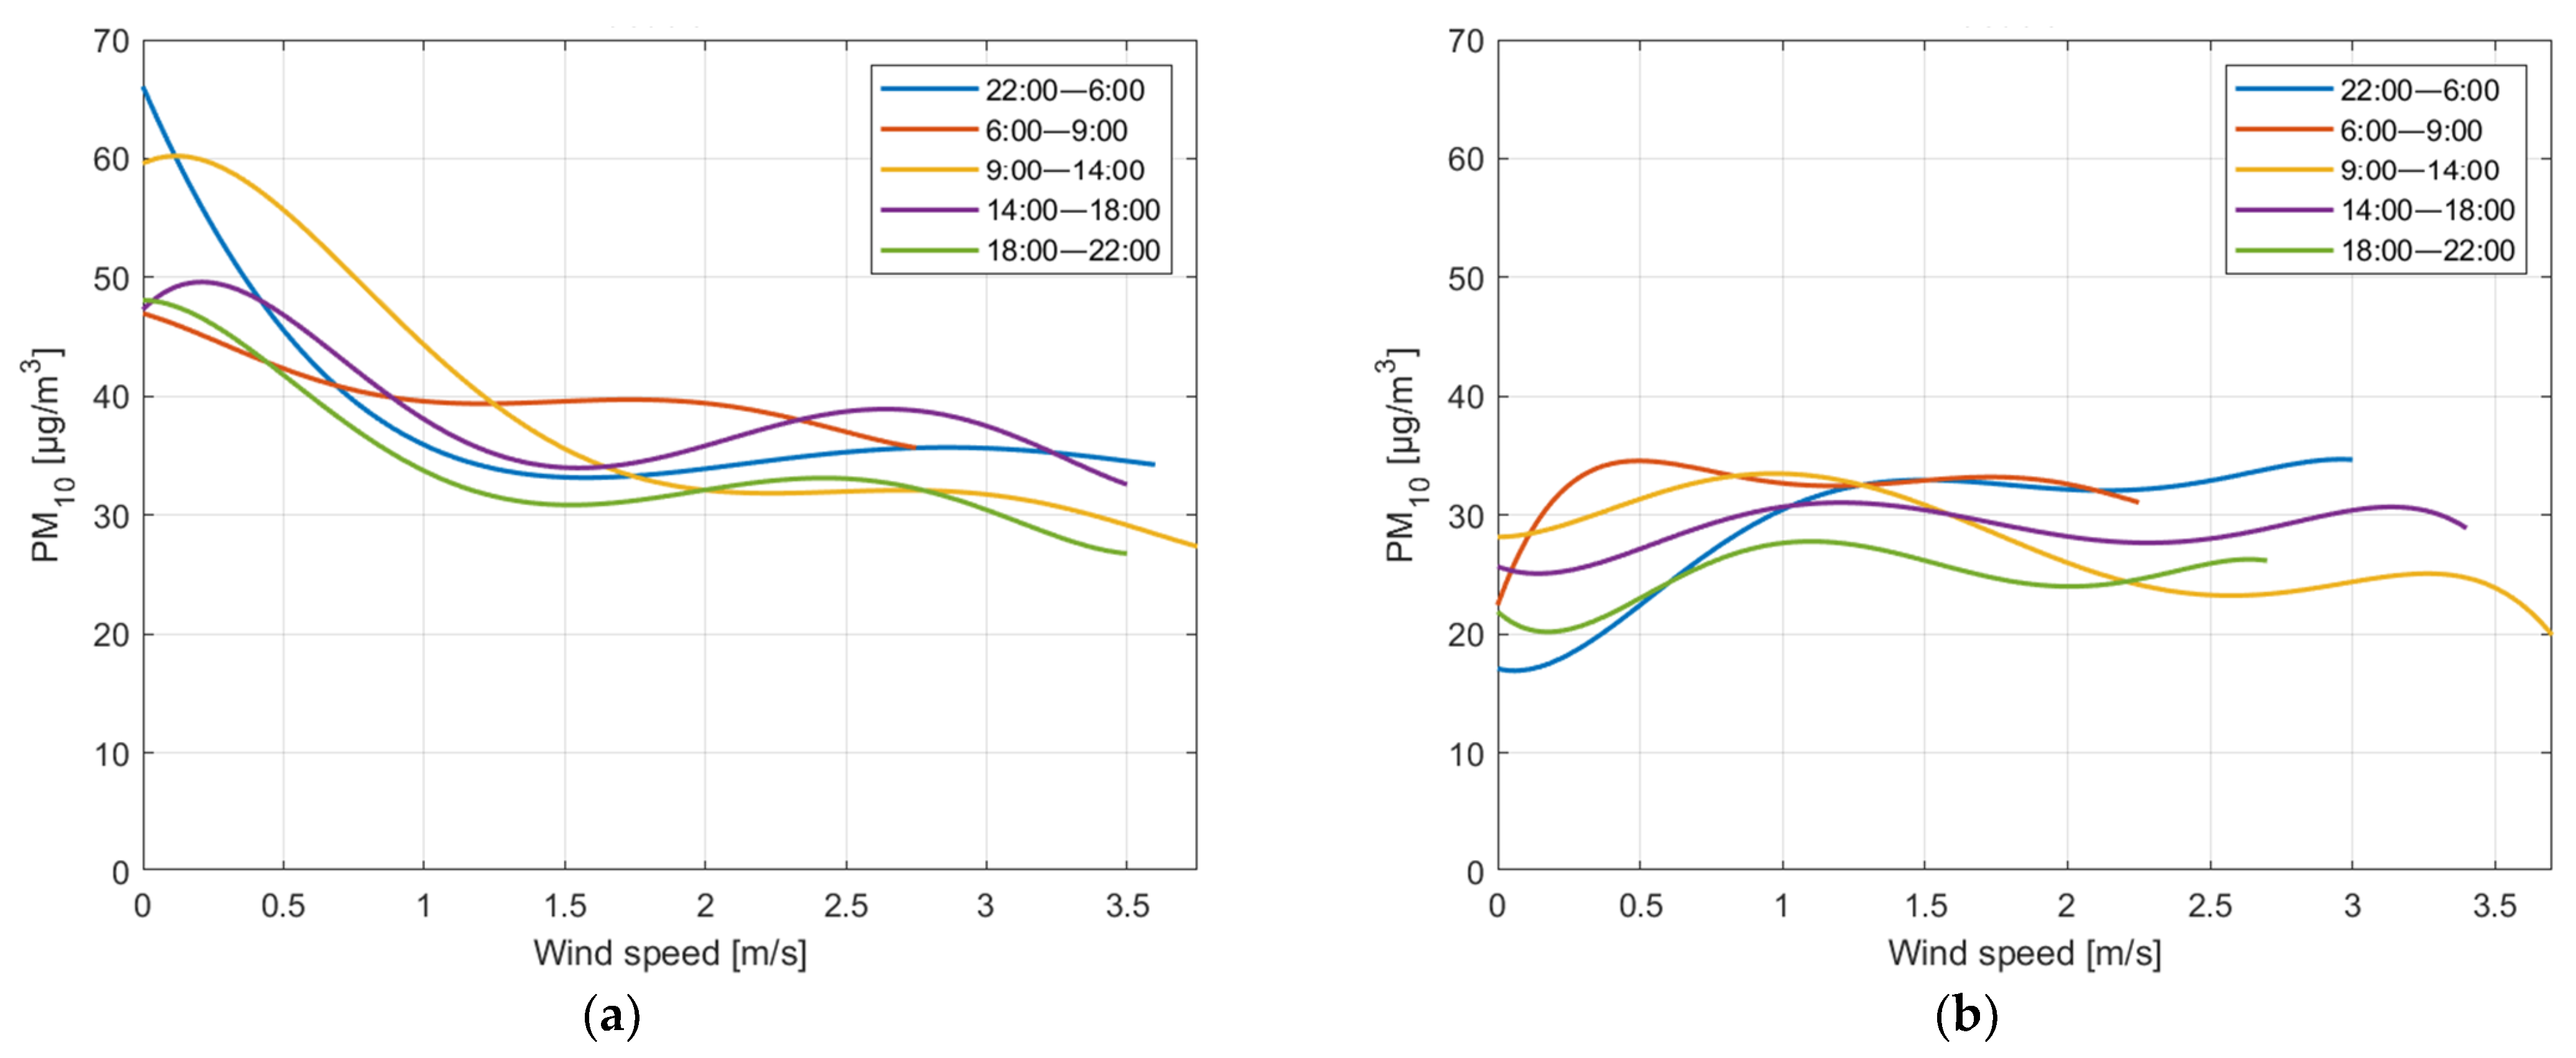
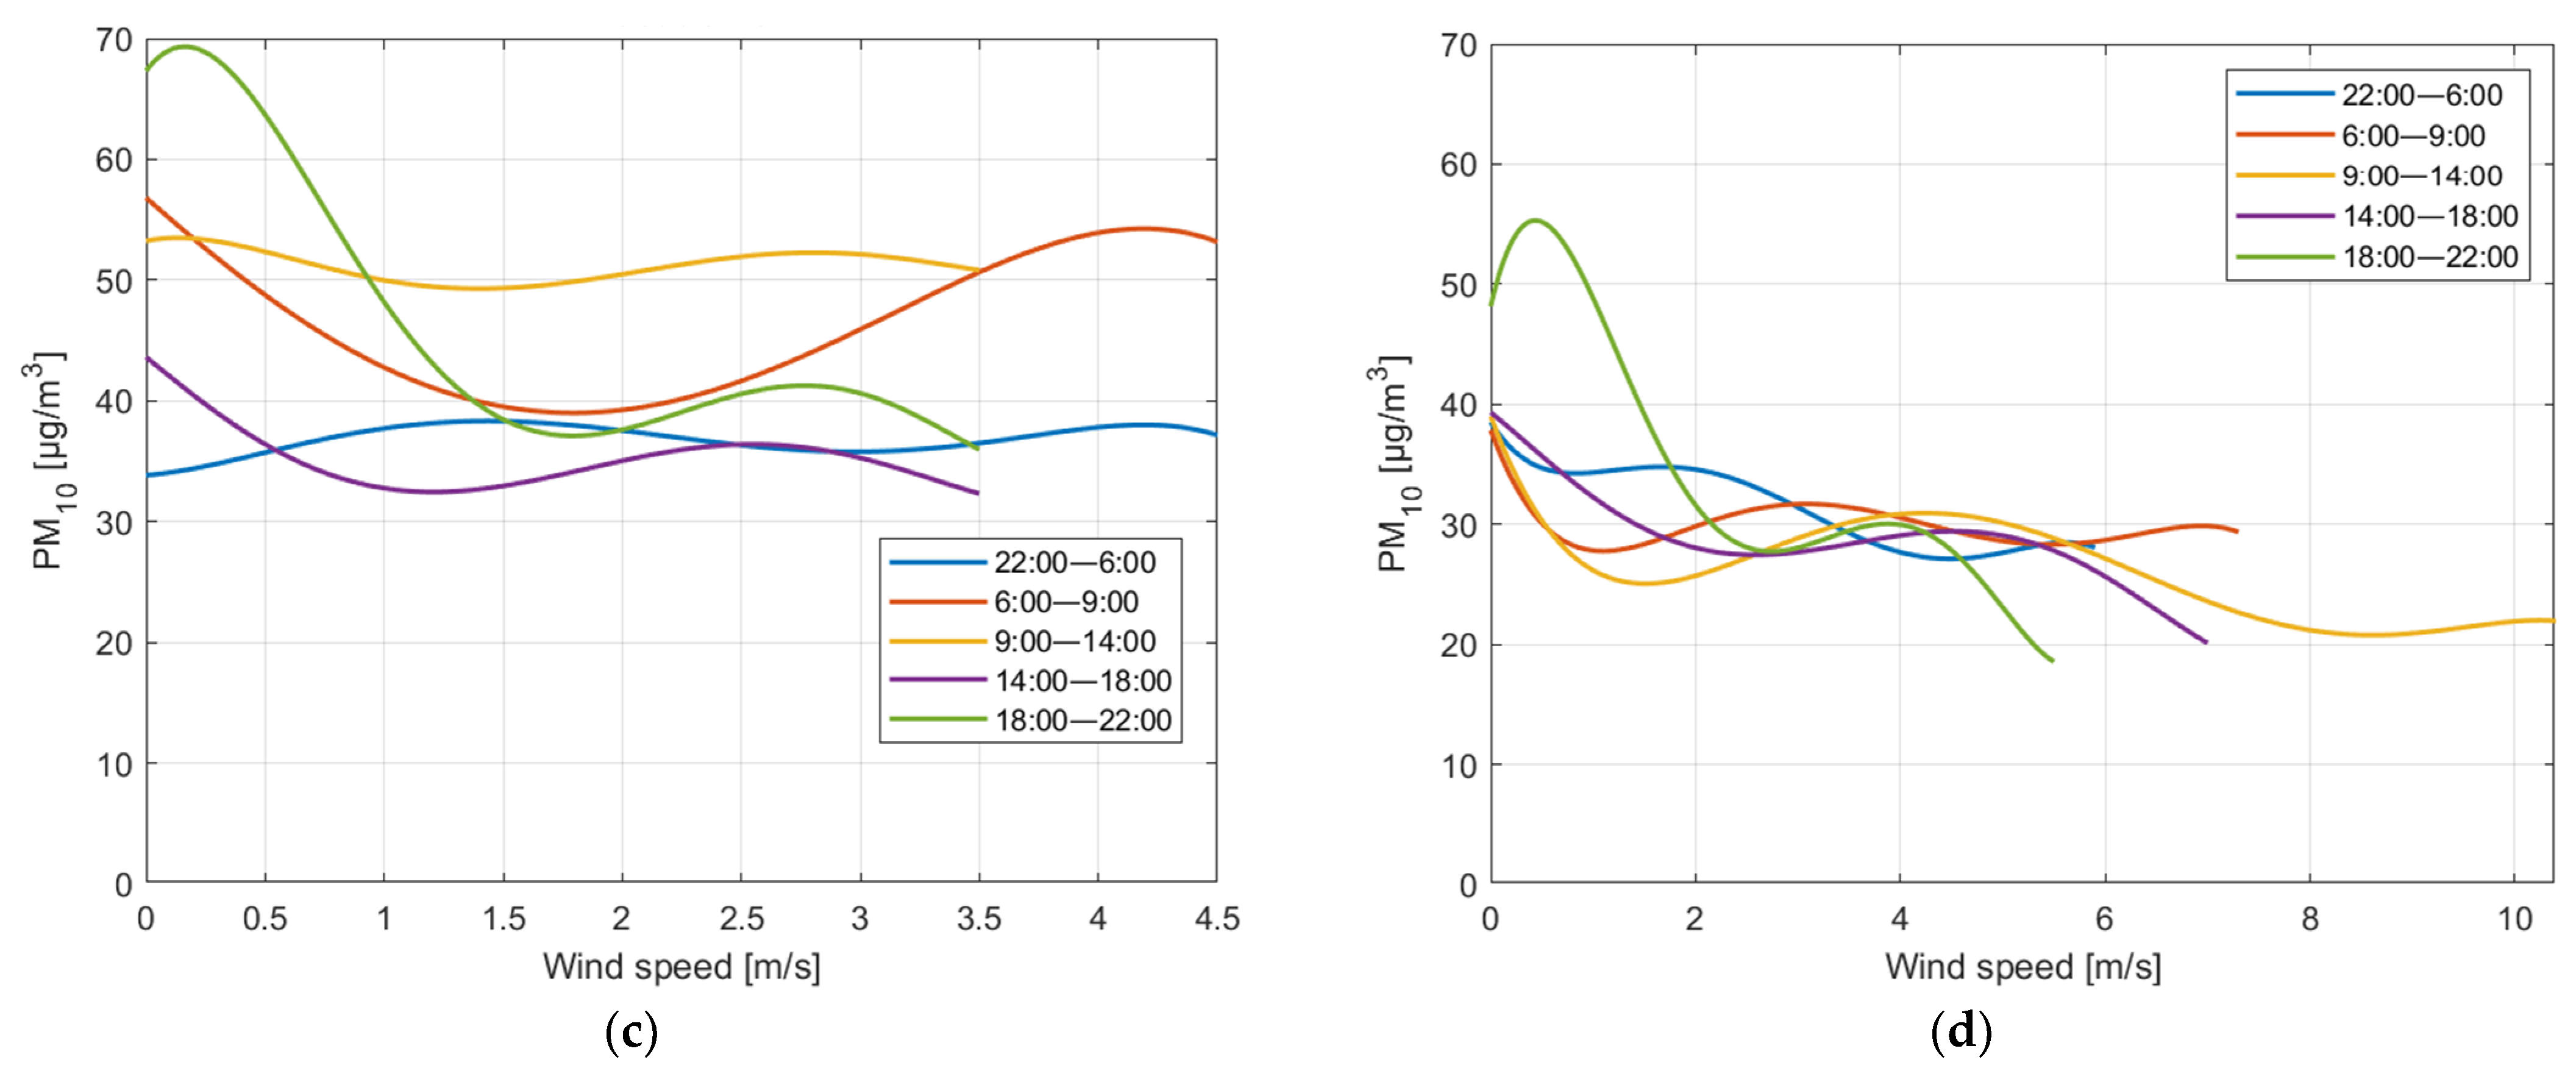
3.1. Results Obtained from Work with the Records

The data were filtered and divided into the time groups; then, they were evaluated as mentioned in the methodology. The results for each location and for the specified time periods are shown in Figure 4.
Figure 4 shows that the relationship curves in each location have distinctive characters but, in general, it can be said that the shape of the characteristic curve is consistent across all time periods. A greater difference in the shape of the curves is present at Location 3, where the curves from the rush hours were different from the other ones from the day. This is most likely caused by the absence of a dominant source of particles at Location 3.
The TWSR of around 2 m/s was evident at each location. Location 4 is an exception, as it shows two distinct TWSRs. This is because Location 4 has two types of surfaces—grass and bare soil. Particles are separated from grassy surfaces at a lower wind speed than surfaces with bare soil [17], leading to two different TWSRs: 1.28 m/s on average from grassy surfaces and 3.52 m/s on average from bare soil.
The measured particle concentrations at most of the locations range from 25 to 70 µg/m3, except for Location 2, which is unique because of the presence of the river separating the measuring device from a major source of pollutant (the car park and other paved surfaces on the other bank). Therefore, there is a low particle concentration initially measured, but as the wind speed increases, the particle concentration increases as the particles can cross the river.

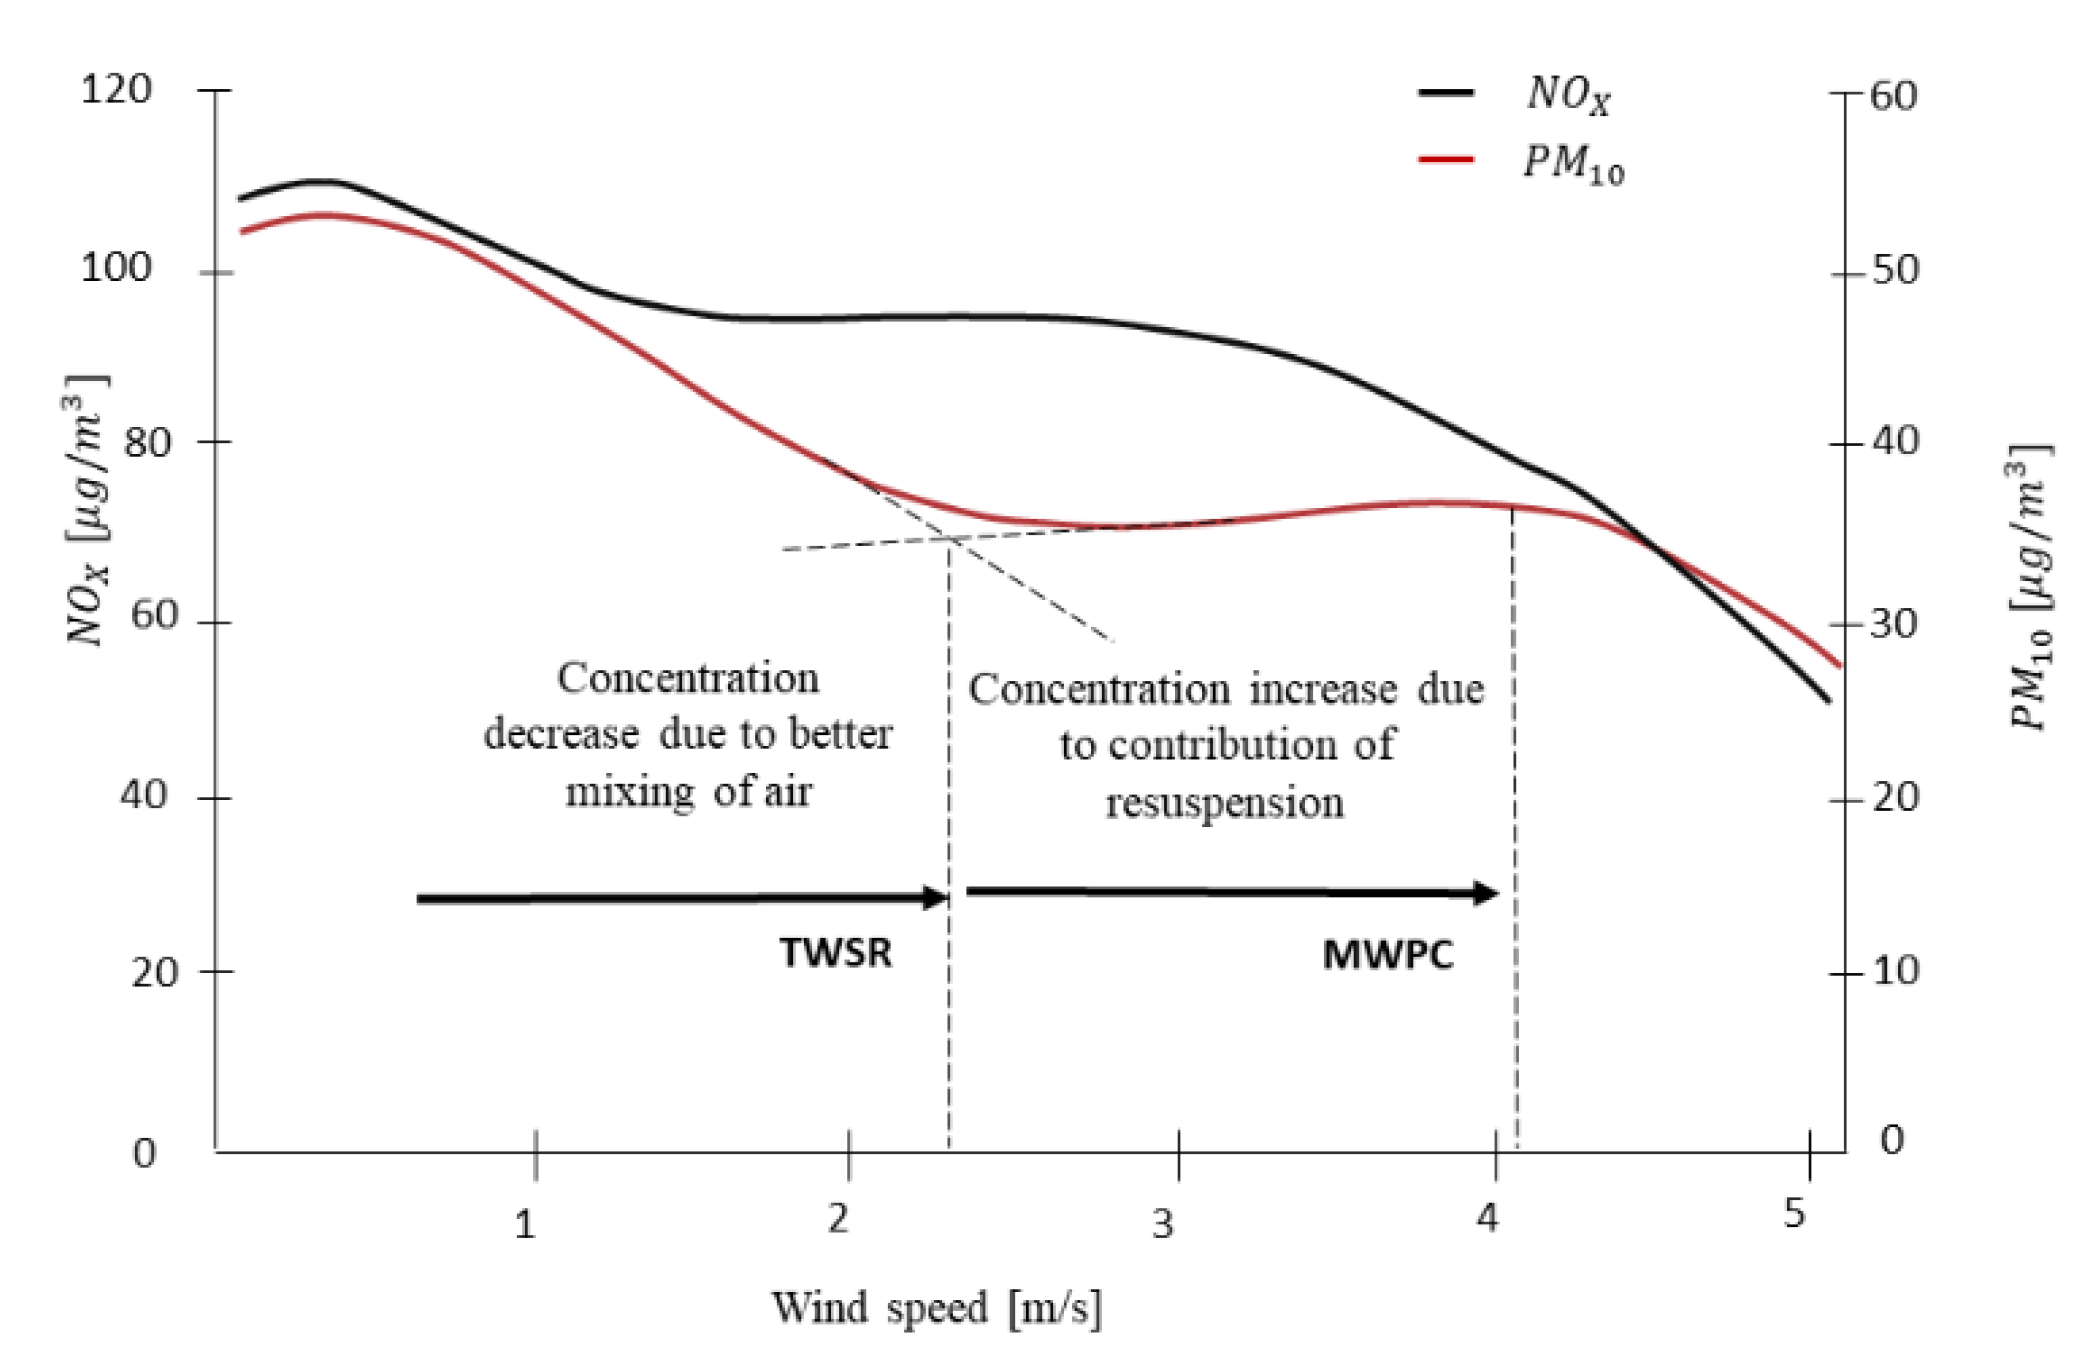
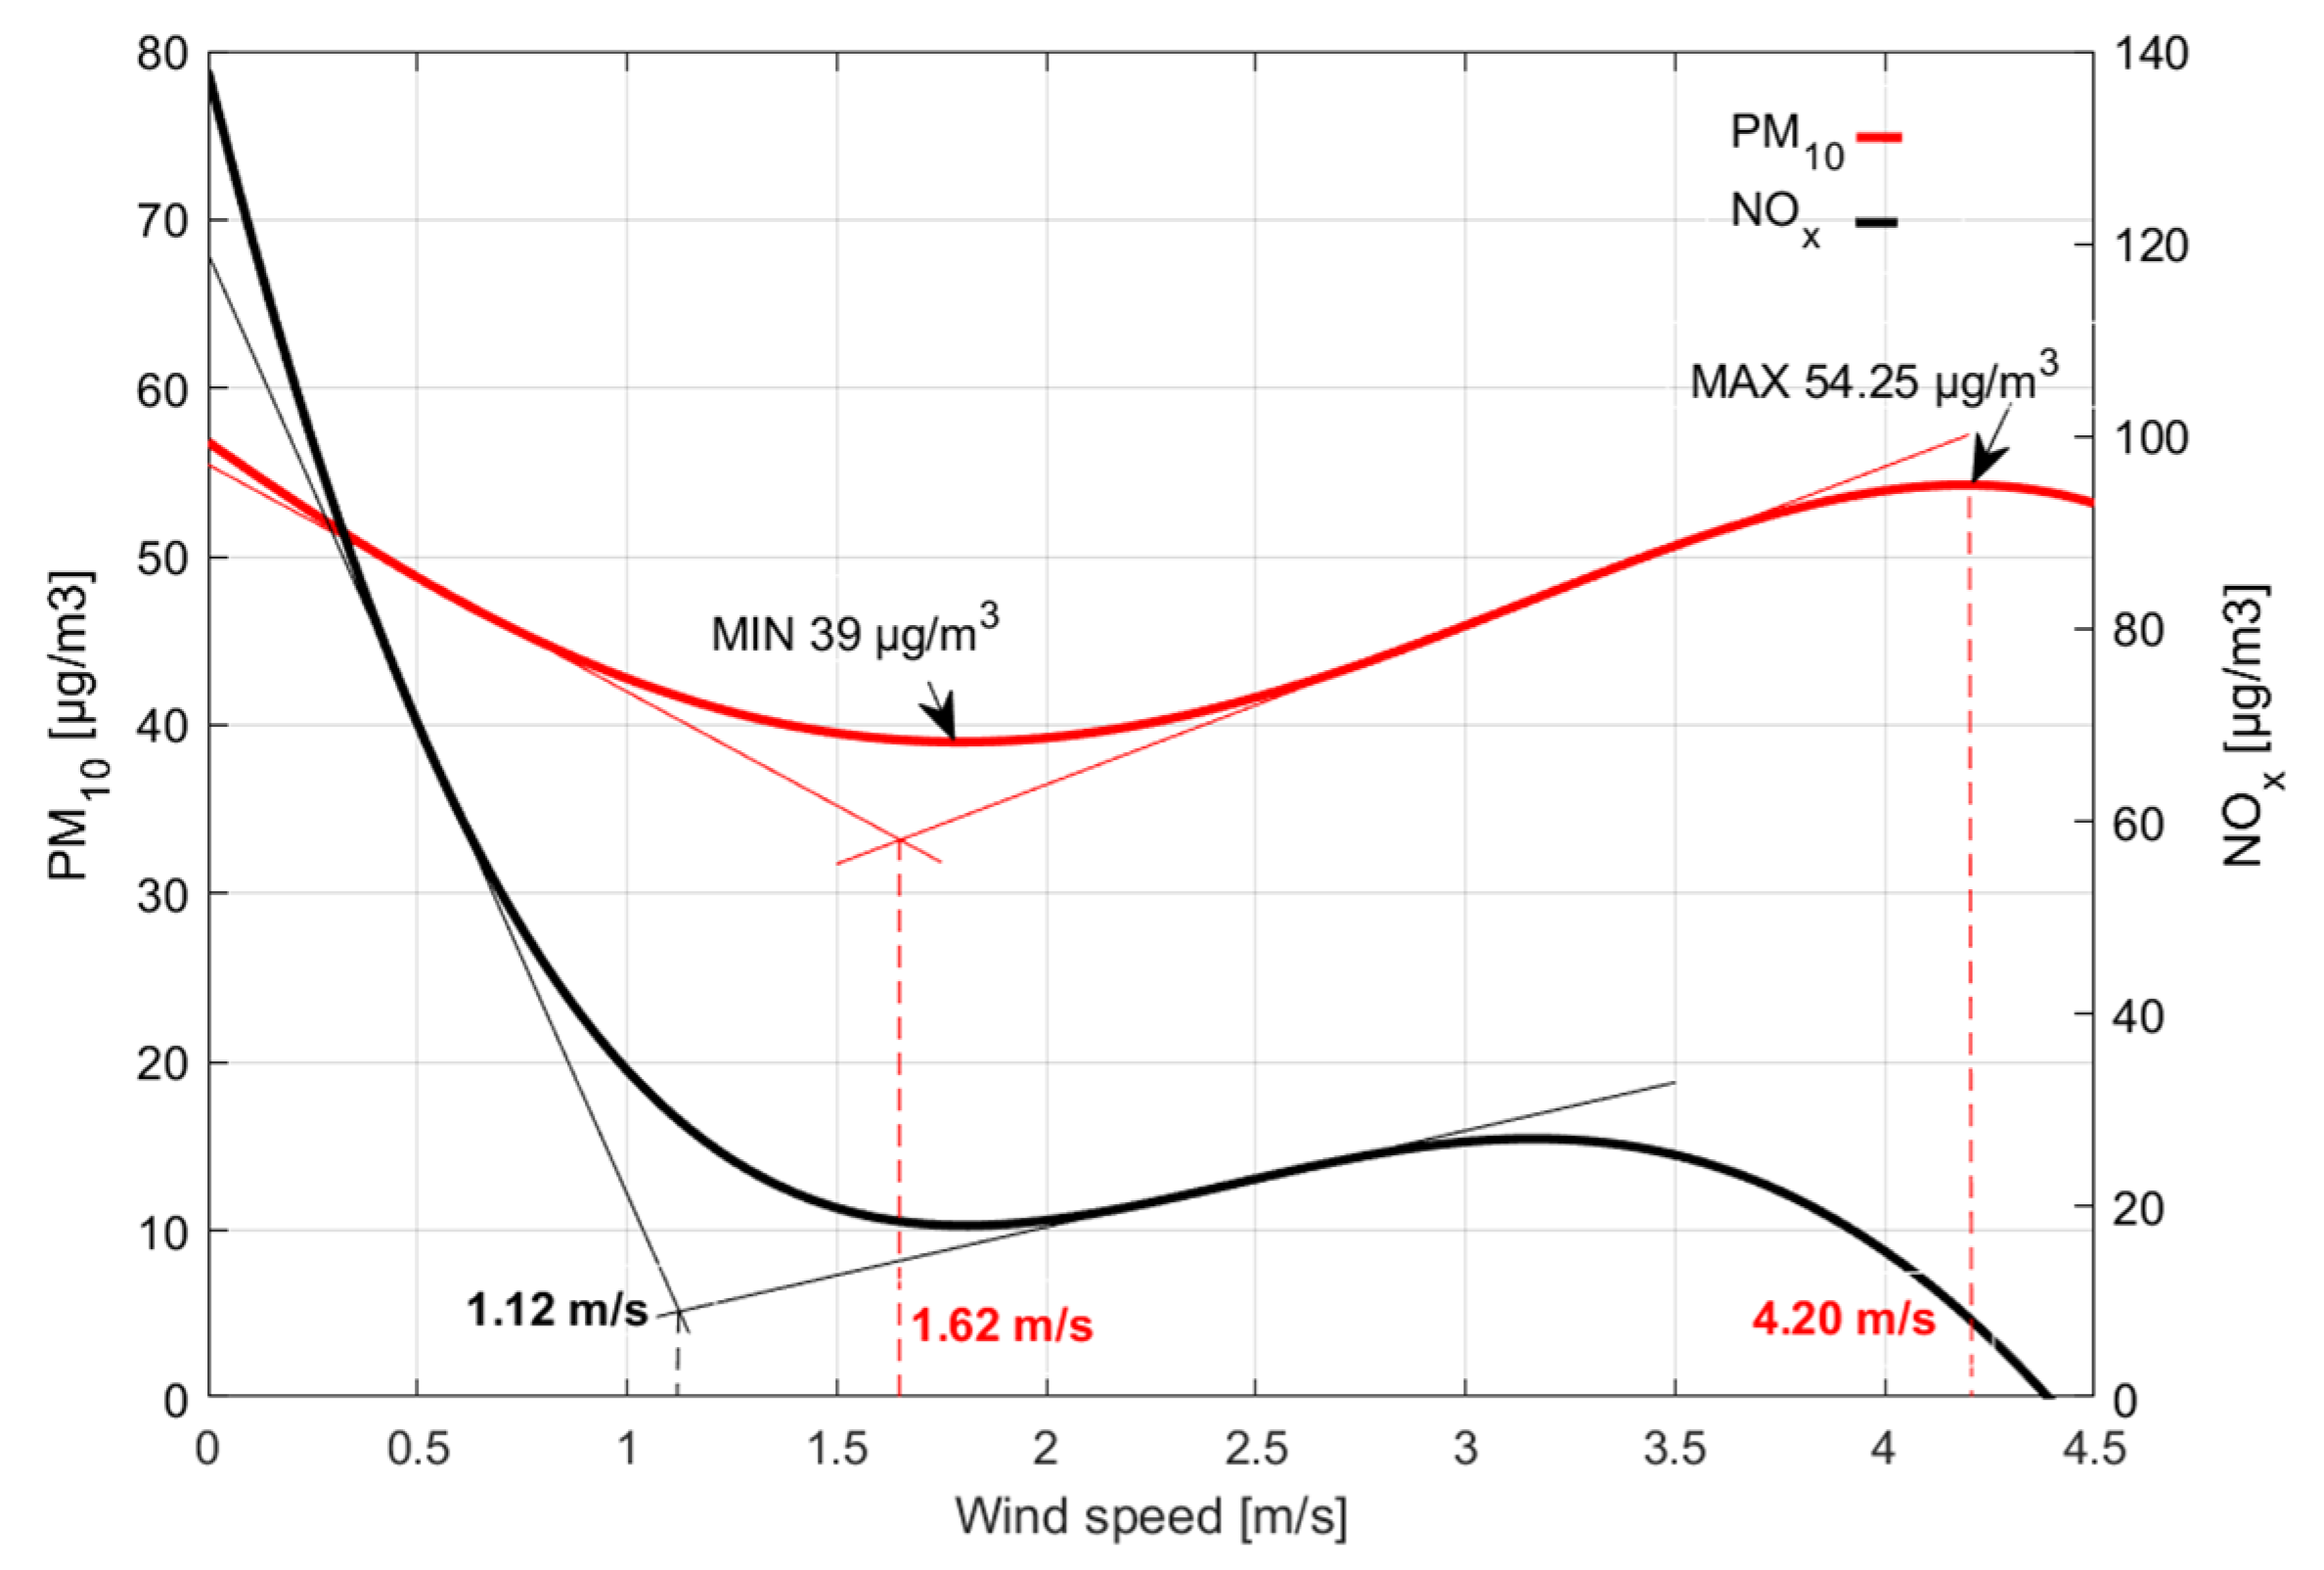
3.2. Results of the Evaluation of the Threshold Speeds Causing Resuspension (TWRS, MWPC)

Figure 5 shows the relationship between the particle concentration and the wind speed for selected locations at times where the resuspension was most evident. On the curve, there are marks showing the speeds at which the TWSR and MWPC were identified. The fact that the changes in the character of the curve of the particle concentrations occur out of sync with the NOX concentration changes indicates that there must be another source of particles not directly related to the production of NOX. The shape of each curve identified at the sites is consistent with the claims made in the Section 2.6.

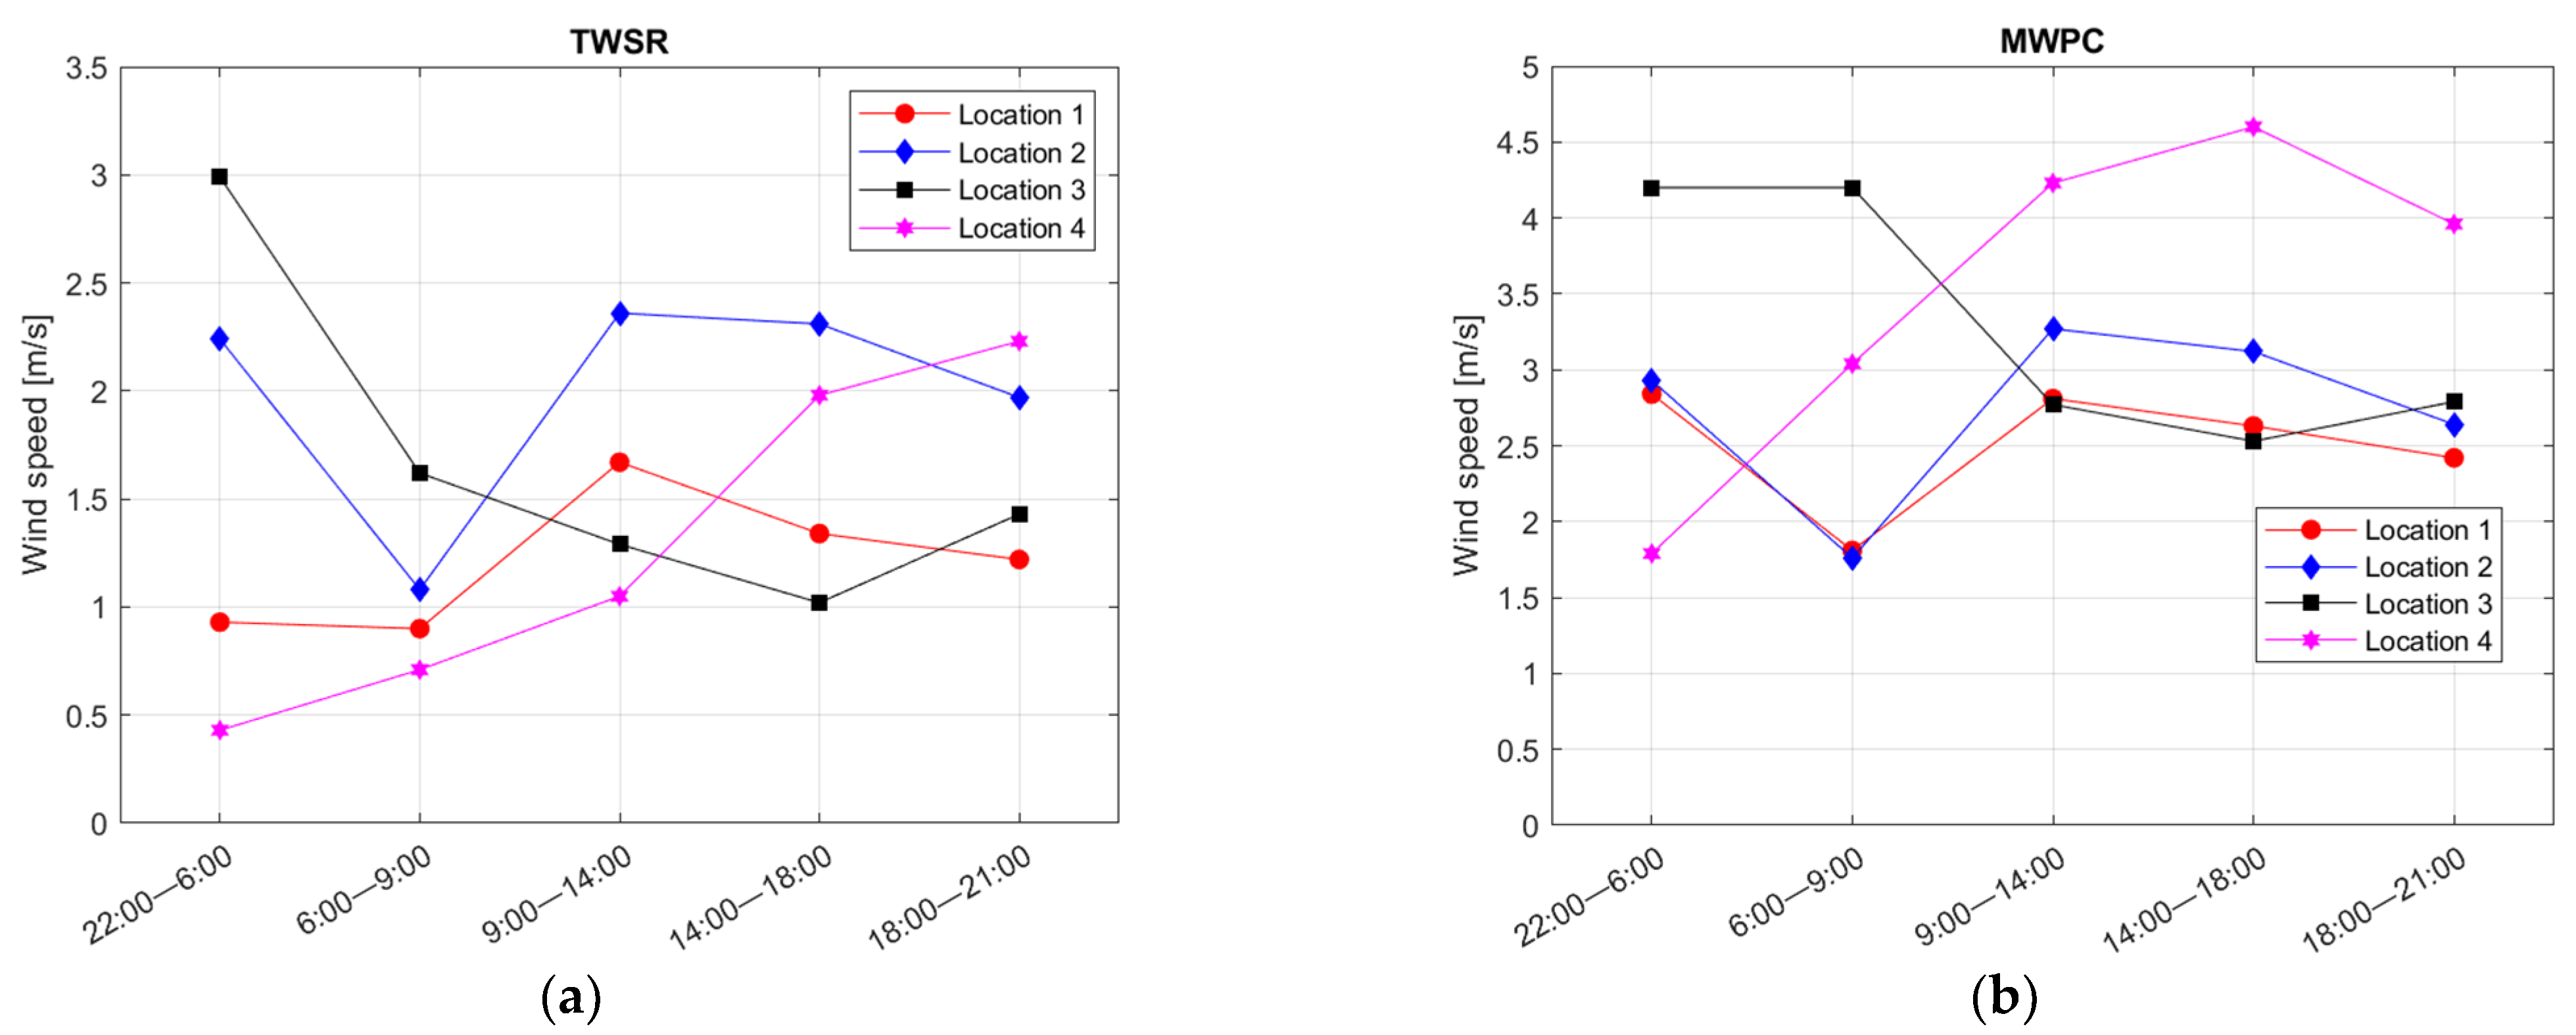
3.3. Comparison of the Results Obtained in the Locations

Figure 6 shows a comparison of the characteristic speeds, TWSR and MWPC, identified in each location. The curves in Figure 6 for each location differ; however, there is a similarity between the TWSR and the MWPC behavior for the same location. A similarity can also be seen between Locations 1 and 2. Since these locations represent the city center, the similarity is appropriate.
The TWSRs are different at night. This is due to the unique character of each location, where the particle concentration declines occur with different intensities. Resuspension during the morning rush hour occurs at lower wind speeds than at night. The reason is that there is a considerable amount of short-term deposited particles during the rush hour that can be separated more easily [18]. This trend can be observed at Locations 1, 2, and 3. Another decline in the TWSR occurs for the same reason during the evening rush hour at Locations 1, 2, and 3. Between the rush hours, the TWSR increases as the number of weakly attached particles capable of resuspension decreases [19,21].
After the evening rush hour, the TWSR decreases again at Locations 1 and 2. This trend can be explained by a higher heating rate in the city and the resulting combustion particles [22], which can be then resuspended. At Location 3, the TWSR falls during the day, which could be caused by an increasing number of particles produced by the increasing intensity of traffic and human activity in the location during the day. Location 4 shows a different behavior than the other locations monitored. The TWSR, in this case, grows during the day, which can be explained by a decreasing number of particles available for resuspension in the open countryside during the day since the surfaces (road and its edges) are, with increasing traffic intensity, washed out better and thus cleaned [34].

3.4. Comparison of the Results with Published Studies

Regarding the values identified in this study, it must be noted that although the measuring devices were placed on the road edges, resuspension caused by wind separates particles not only from the road but also from all the nearby surfaces where conditions suitable for resuspension occur. For the purposes of the comparison, the surfaces in the locations in Table 2 were characterized by a reference surface with properties based on the percentage coverage of different surfaces in the location. The road surface (asphalt) and the other firm surfaces (concrete tiles on pavements, buildings) are replaced in the calculation by a surface roughness close to a concrete surface [18]. The wind speeds measured were related to friction velocity according to Equation (1).
Table 2 shows that the obtained values of the TWSR and MWPC, when resuspension was detectable in the locations, correspond to the results of the studies conducted by other authors. Slight differences were observed at Location 3 and 4, where the difference can be explained by the particle separation from surfaces that are not the most represented in the area (vegetation, bare soil). If we assume that these particles at Locations 3 and 4 do not come only from the green and bare soil surfaces, but from the mixed concrete-grass surface, the results are in correspondence with the experiments.

4. Conclusions

In the present paper, the process of wind-induced resuspension was characterized. The characteristic variables were determined with respect to the conditions influencing the process. These included time of day, humidity, wind direction, and background concentration. The effect of surface type on the threshold wind speed causing resuspension was also presented. The results were validated against measurements taken in the wind tunnel [17,27,33]. Despite different data evaluation methodologies against the studies [13,14,15], similar wind speeds causing resuspension were observed.
The results showed that each location is unique in terms of its behavior in relation to resuspension. This is related to the different types of surfaces, particles, and the nature of flow in the locations. The mean TWSR was 1.53 m/s and the mean MWPC was 2.8 m/s at a height of 2 meters above the surface, which corresponds with the published studies. A common feature of Locations 1 and 2, representing locations in a city center, was a decrease in the TWSR during the rush hours and a subsequent increase in periods outside the rush hours. This confirms the original assumption about the dependence of the time on particle resuspension. It was proven that short-term deposited particles are resuspended more easily. Locations 3 and 4, representing a town and the out-of-town areas, did not show this behavior.
Uncertainties may arise in the chosen locations and the time period of measurement. In addition, uncertainty can arise in the fitting of data by a polynomial, since it is a process that creates a mathematical substitute out of a mass of data; furthermore, the method of evaluation can create some uncertainties. These uncertainties should be reflected in the TWSR and MWPC values that result from a given method. The level of uncertainty itself is very difficult to determine. It should be highlighted, however, that the results of the present paper agree with published scientific studies. This is sufficient evidence that the mentioned uncertainties do not have a large impact on the results.
The results of the study suggest what parameters influence wind-induced resuspension. It is thus clear under which conditions resuspension is a significant source of particles. In the future, wind-induced resuspension will be a non-negligible source of pollution. Further research will be directed towards the processing of data from automated emission monitoring stations, present in every major city. It will be possible to observe how the traffic itself will affect the resulting data processing, as these stations are not always located near the roads. The aim will also be to see how wind-induced resuspension changes over the years when remedial measures to improve air cleanliness occur in cities.

Supplementary Materials

The following supporting information can be downloaded at: https://www.mdpi.com/article/10.3390/su14159186/s1, Figure S1 Location overview, reposted from [29], Figure S2 Polynomial degrees tested, fitted to the processed data from selected location.

Author Contributions

Conceptualization, J.L. and J.P.; methodology, J.L., J.K. and J.P.; formal analysis, K.K., J.L., J.P. and R.L.; investigation, J.L., R.L. and J.H.; resources, J.L.; data curation, R.L. and J.H.; writing—original draft preparation, J.L. and J.P.; writing—review and editing, K.K. and R.L.; visualization, K.K.; supervision, J.P. and R.L.; project administration, J.L. and K.K; funding acquisition, J.P. All authors have read and agreed to the published version of the manuscript.

Funding

This paper has been supported by the EU project Computer Simulations for Effective Low-Emission Energy Engineering funded as project No. CZ.02.1.01/0.0/0.0/16_026/0008392 by Czech Republic Operational Programme Research, Development and Education, Priority 1: Strengthening capacity for high-quality research and the collaboration. This was further funded by the Ministry of Transport within the programme of long-term conceptual development of research institutions as project No. 55/2020-710-VV/1.

Data Availability Statement

Not applicable.

Conflicts of Interest

The authors declare no conflict of interest.

References

  1. Amato, F.; Schaap, M.; Reche, C.; Querol, X. Road Traffic: A Major Source of Particulate Matter in Europe. In Urban Air Quality in Europe; Viana, M., Ed.; Springer: Berlin/Heidelberg, Germany, 2013. [Google Scholar]
  2. Schraufnagel, D.E. The Health Effects of Ultrafine Particles. Exp. Mol. Med. 2020, 52, 311–317. [Google Scholar] [CrossRef]
  3. World Health Organization. Ambient Air Pollution: A Global Assessment of Exposure and Burden of Disease. Clean Air J. 2016, 26, 6. [Google Scholar] [CrossRef]
  4. Stanaway, J.D.; Afshin, A.; Gakidou, E. Erratum: Global, Regional, and National Comparative Risk Assessment of 84 Behavioral, Environmental and Occupational, and Metabolic Risks or Clusters of Risks for 195 Countries and Territories, 1990–2017: A Systematic Analysis for the Global Burden of Disease Study 2017. Lancet 2019, 393, 1923–1994. [Google Scholar] [CrossRef] [Green Version]
  5. Karagulian, F.; Belis, C.A.; Dora, C.F.C.; Prüss-Ustün, A.M.; Bonjour, S.; Adair-Rohani, H.; Amann, M. Contributions to Cities’ Ambient Particulate Matter (PM): A Systematic Review of Local Source Contributions at Global Level. Atmos. Environ. 2015, 120, 475–483. [Google Scholar] [CrossRef]
  6. Harrison, R.M.; Allan, J.; Carruthers, D.; Heal, M.R.; Lewis, A.C.; Marner, B.; Murrells, T.; Williams, A. Non-Exhaust Vehicle Emissions of Particulate Matter and VOC from Road Traffic: A Review. Atmos. Environ. 2021, 262, 118592. [Google Scholar] [CrossRef]
  7. Alves, C.A.; Vicente, A.M.P.; Calvo, A.I.; Baumgardner, D.; Amato, F.; Querol, X.; Pio, C.; Gustafsson, M. Physical and Chemical Properties of Non-Exhaust Particles Generated from Wear Between Pavements and Tyres. Atmos. Environ. 2020, 224, 117252. [Google Scholar] [CrossRef]
  8. Pospíšil, J.; Jícha, M. Mezní Rychlost Resuspenze Částic PM10 v Prostředí Městské Zástavby; Česká Aerosolová Společnost: Prague, Czech Republic, 2007; pp. 33–34. [Google Scholar]
  9. Harrison, R.M.; Yin, J.; Mark, D.; Stedman, J.; Appleby, R.S.; Booker, J.; Moorcroft, S. Studies of the Coarse Particle (2.5–10 μm) Component in UK Urban Atmospheres. Atmos. Environ. 2001, 35, 3667–3679. [Google Scholar] [CrossRef]
  10. Jarrah, M.; Mayel, S.; Tatarko, J.; Funk, R.; Kuka, K. A Review of Wind Erosion Models: Data Requirements, Processes, and Validity. Catena 2020, 187, 104388. [Google Scholar] [CrossRef]
  11. Panagos, P.; Katsoyiannis, A. Soil Erosion Modelling: The New Challenges as the Result of Policy Developments in Europe. Environ. Res. 2019, 172, 470–474. [Google Scholar] [CrossRef]
  12. Jones, A.M.; Harrison, R.M.; Baker, J.B.H. The Wind Speed Dependence of the Concentrations of Airborne Particulate Matter and NOx. Atmos. Environ. 2010, 44, 1682–1690. [Google Scholar] [CrossRef]
  13. Grundström, M.; Hak, C.; Chen, D.; Hallquist, M.; Pleijel, H. Variation and Co-Variation of PM10, Particle Number Concentration, NOx and NO2 in the Urban Air—Relationships with Wind Speed, Vertical Temperature Gradient and Weather Type. Atmos. Environ. 2015, 120, 317–327. [Google Scholar] [CrossRef]
  14. Kassomenos, P.; Vardoulakis, S.; Chaloulakou, A.; Grivas, G.; Borge, R.; Lumbreras, J. Levels, Sources and Seasonality of Coarse Particles (PM10–PM2.5) in Three European Capitals—Implications for Particulate Pollution Control. Atmos. Environ. 2012, 54, 337–347. [Google Scholar] [CrossRef] [Green Version]
  15. Thorpe, A.J.; Harrison, R.M.; Boulter, P.G.; McCrae, I.S. Estimation of Particle Resuspension Source Strength on a Major London Road. Atmos. Environ. 2007, 41, 8007–8020. [Google Scholar] [CrossRef]
  16. Henry, C. Particle Resuspension from Complex Surfaces: Current Knowledge and Limitations. arXiv 2018, arXiv:1802.06448. Available online: https://arxiv.org/abs/1802.06448 (accessed on 8 March 2021).
  17. Nicholson, K.W.; Branson, J.R.; Giess, P.; Cannell, R.J. The Effects of Vehicle Activity on Particle Resuspension. J. Aerosol Sci. 1989, 20, 1425–1428. [Google Scholar] [CrossRef]
  18. Loosmore, G.A. Evaluation and Development of Models for Resuspension of Aerosols at Short Times after Deposition. Atmos. Environ. 2003, 37, 639–647. [Google Scholar] [CrossRef]
  19. Wang, Y.; Zhao, Y.; Yao, J. Large Eddy Simulation of Particle Deposition and Resuspension in Turbulent Duct Flows. Adv. Powder Technol. 2019, 30, 656–671. [Google Scholar] [CrossRef]
  20. Gotoh, K.; Takebe, S.; Masuda, H.; Banba, Y. The Effect of Humidity on the Removal of Fine Particles on a Solid Surface using High-speed Air Jet. KONA Powder Part. J. 1995, 13, 191–203. [Google Scholar] [CrossRef] [Green Version]
  21. Ibrahim, A.H.; Dunn, P.F.; Brach, R.M. Microparticle Detachment from Surfaces Exposed to Turbulent Air Flow: Effects of Flow and Particle Deposition Characteristics. J. Aerosol Sci. 2004, 35, 805–821. [Google Scholar] [CrossRef]
  22. Amato, F.; Schaap, M.; van der Gon, H.A.D.; Pandolfi, M.; Alastuey, A.; Keuken, M.; Querol, X. Effect of rain events on the mobility of road dust load in two Dutch and Spanish roads. Atmos. Environ. 2012, 62, 352–358. [Google Scholar] [CrossRef]
  23. Young, T.M.; Heeraman, D.A.; Sirin, G.; Ashbaugh, L.L. Resuspension of Soil as a Source of Airborne Lead near Industrial Facilities and Highways. Environ. Sci. Technol. 2002, 36, 2484–2490. [Google Scholar] [CrossRef] [PubMed]
  24. Nasr, B.; Ahmadi, G.; Ferro, A.R.; Dhaniyala, S. A model for Particle Removal from Surfaces with Large-Scale Roughness in Turbulent Flows. Aerosol Sci. Technol. 2019, 54, 291–303. [Google Scholar] [CrossRef]
  25. Ziskind, G. Particle Resuspension from Surfaces: Revisited and Re-Evaluated. Rev. Chem. Eng. 2006, 22. [Google Scholar] [CrossRef]
  26. Etyemezian, V.; Gillies, J.A.; Mastin, L.G.; Crawford, A.; Hasson, R.; Van Eaton, A.R.; Nikolich, G. Laboratory Experiments of Volcanic Ash Resuspension by Wind. J. Geophys. Res. Atmos. 2019, 124, 9534–9560. [Google Scholar] [CrossRef]
  27. Giess, P.; Goddard, A.; Shaw, G. Factors Affecting Particle Resuspension from Grass Swards. J. Aerosol Sci. 1997, 28, 1331–1349. [Google Scholar] [CrossRef]
  28. Nicholson, K.W. Wind Tunnel Experiments on the Resuspension of Particulate Material. Atmos. Environ. Part A Gen. Top. 1993, 27, 181–188. [Google Scholar] [CrossRef]
  29. Google (n.d.). Google Maps City of Brno and Surroundings, Czech Republic. Available online: https://goo.gl/maps/qvjH8qHwgtmkexgn6 (accessed on 20 July 2022).
  30. Jin, X.; Yang, L.; Du, X.; Yang, Y. Transport Characteristics of PM2.5 Inside Urban Street Canyons: The Effects of Trees and Vehicles. Build. Simul. 2017, 10, 337–350. [Google Scholar] [CrossRef]
  31. Styles, J. A Wind Tunnel Study of the Velocity Field Above a Model Plant Canopy; CSIRO: Canberra, Australia, 1997. [Google Scholar]
  32. Stull, R.B. An Introduction to Boundary Layer Meteorology; Springer Science & Business Media: Berlin/Heidelberg, Germany, 1988. [Google Scholar] [CrossRef]
  33. Garland, J.A. Some Recent Studies of the Resuspension of Deposited Material from Soil and Grass; Elsevier Science Publishing Co., Inc.: New York, NY, USA, 1983. [Google Scholar]
  34. Amato, F.; Pandolfi, M.; Alastuey, A.; Lozano, A.; González, J.C.; Querol, X. Impact of Traffic Intensity and Pavement Aggregate Size on Road Dust Particles Loading. Atmos. Environ. 2013, 77, 711–717. [Google Scholar] [CrossRef]
Figure 1. Sources of particulate matter in the urban environment and their contribution to total air pollution, according to [5].
Sustainability 14 09186 g001
Figure 2. Position of the measuring devices near roads in the studied locations (ad) with indications of the evaluated wind directions on the measuring device.
Sustainability 14 09186 g002
Figure 3. Assumed dependence of particle concentration on the wind speed. According to [8].
Sustainability 14 09186 g003
Figure 4. The relationship between particle concentration and the wind speed for the different locations in the specified time periods: (a) Location 1; (b) Location 2; (c) Location 3; (d) Location 4.
Sustainability 14 09186 g004aSustainability 14 09186 g004b
Figure 5. Selected curve characterizing the behavior of the dependences at Location 1 14:00–18:00.
Sustainability 14 09186 g005
Figure 6. Comparison of the TWSR (a) and MWPC (b) in the locations at specific times of the day.
Sustainability 14 09186 g006
Table 1. Amount of data remaining for evaluation after data processing.
Time PeriodLocation 1Location 2Location 3Location 4
22:00–6:001462268013842
6:00–9:00487894975835
9:00–14:00131515888221423
14:00–18:00789188416581073
18:00–21:0016711691499774
Table 2. Comparison of the calculated friction velocities with available experimental data.
ParameterLocation 1Location 2Location 3Location 4
Surface typesVegetation 38%, paved surfaces 18%, roads 19%, buildings 25%Vegetation 19%, paved surfaces 42%, roads 26%, buildings 13%Vegetation 36%, paved surfaces 18%, roads 25%, buildings 21%Vegetation 28%, roads 57%, bare soil 15%
Average surface feature height [m]0.0320.0420.0330.044
Mean TWSR [m/s]1.21 ± 0.311.99 ± 0.531.67 ± 0.761.28 ± 0.78 and 3.52 ± 1.41
Mean MWPC [m/s]2.5 ± 0.582.74 ± 0.793.29 ± 0.822.69 ± 1.22 and 5.87 ± 2.54
Calculated friction velocity interval (TWSR to MWPC) [m/s]0.11 to 0.240.21 to 0.290.16 to 0.320.13 to 0.28/0.37 to 0.63
Corresponding experiment[28][28][27][27,33]
Surface type in experiment and its feature heightVegetation and concrete (0.003 and 0.05)Vegetation and concrete (0.003 and 0.05)Vegetation (0.1 and 0.3)Vegetation and bare soil (0.1 and 0.01)
Friction velocity interval from the corresponding experiment [m/s]0.1 to 0.40.1 to 0.40.3 to 1.40.2 to 0.8
Publisher’s Note: MDPI stays neutral with regard to jurisdictional claims in published maps and institutional affiliations.

