
A Methodology for Machine-Learning Content Analysis to Define the Key Labels in the Titles of Online Customer Reviews with the Rating Evaluation


Abstract
:1. Introduction
2. Literature Review

| Study | Variables | Research Context | Key Findings |
|---|---|---|---|
| Chang et al. (2022) [91] | Online reviews & Overall ratings of airlines | TripAdvisor 191,123 reviews |
|
| Dhar & Bose (2022) [92] | Online reviews & Star rating | Mobile app 146,914 |
|
| Stamolampros et al. (2020) [93] | Online reviews of Airlines& average airline ratings | TriAdvisor 380,000 reviews |
|
| Park et al. (2020) [56] | Online reviews of Airlines & overall satisfaction ratings | TripAdvisor 157,035 reviews 20 U.S airlines |
|
| Lucini et al. (2020) [34] | Online reviews of Airlines & overall satisfaction ratings | Air travel review ATR |
|
| Song et al. (2020) [94] | Online sentiment reviews & the ratings of airlines | SKYTRAX 24,165 online reviews |
|
| Sharma et al. (2020) [95] | User sentiment review &overall review of flight | TripAdvisor 157,036 reviews 20 US airlines |
|
| Tsai et al. (2020) [96] | Online hotel review & The overall ratings | TripAdvisor 1009 US hotels 23,430 reviews |
|
| Korfiatis et al. (2019) [97] | Online reviews of Airlines & overall satisfaction ratings | TripAdvisor 557,208 reviews |
|
| Sezgen et al. (2019) [53] | Online reviews of airlines | TripAdvisor 5120 reviews 50 airlines |
|
| Punel et al. (2019) [98] | Online reviews Airlines ratings | Skytrax 40,510 reviews |
|
| Siering et al. (2018) [99] | Online reviews & Overall airline rating | Airlinequality.com 1000 airlines reviews 195 airlines |
|
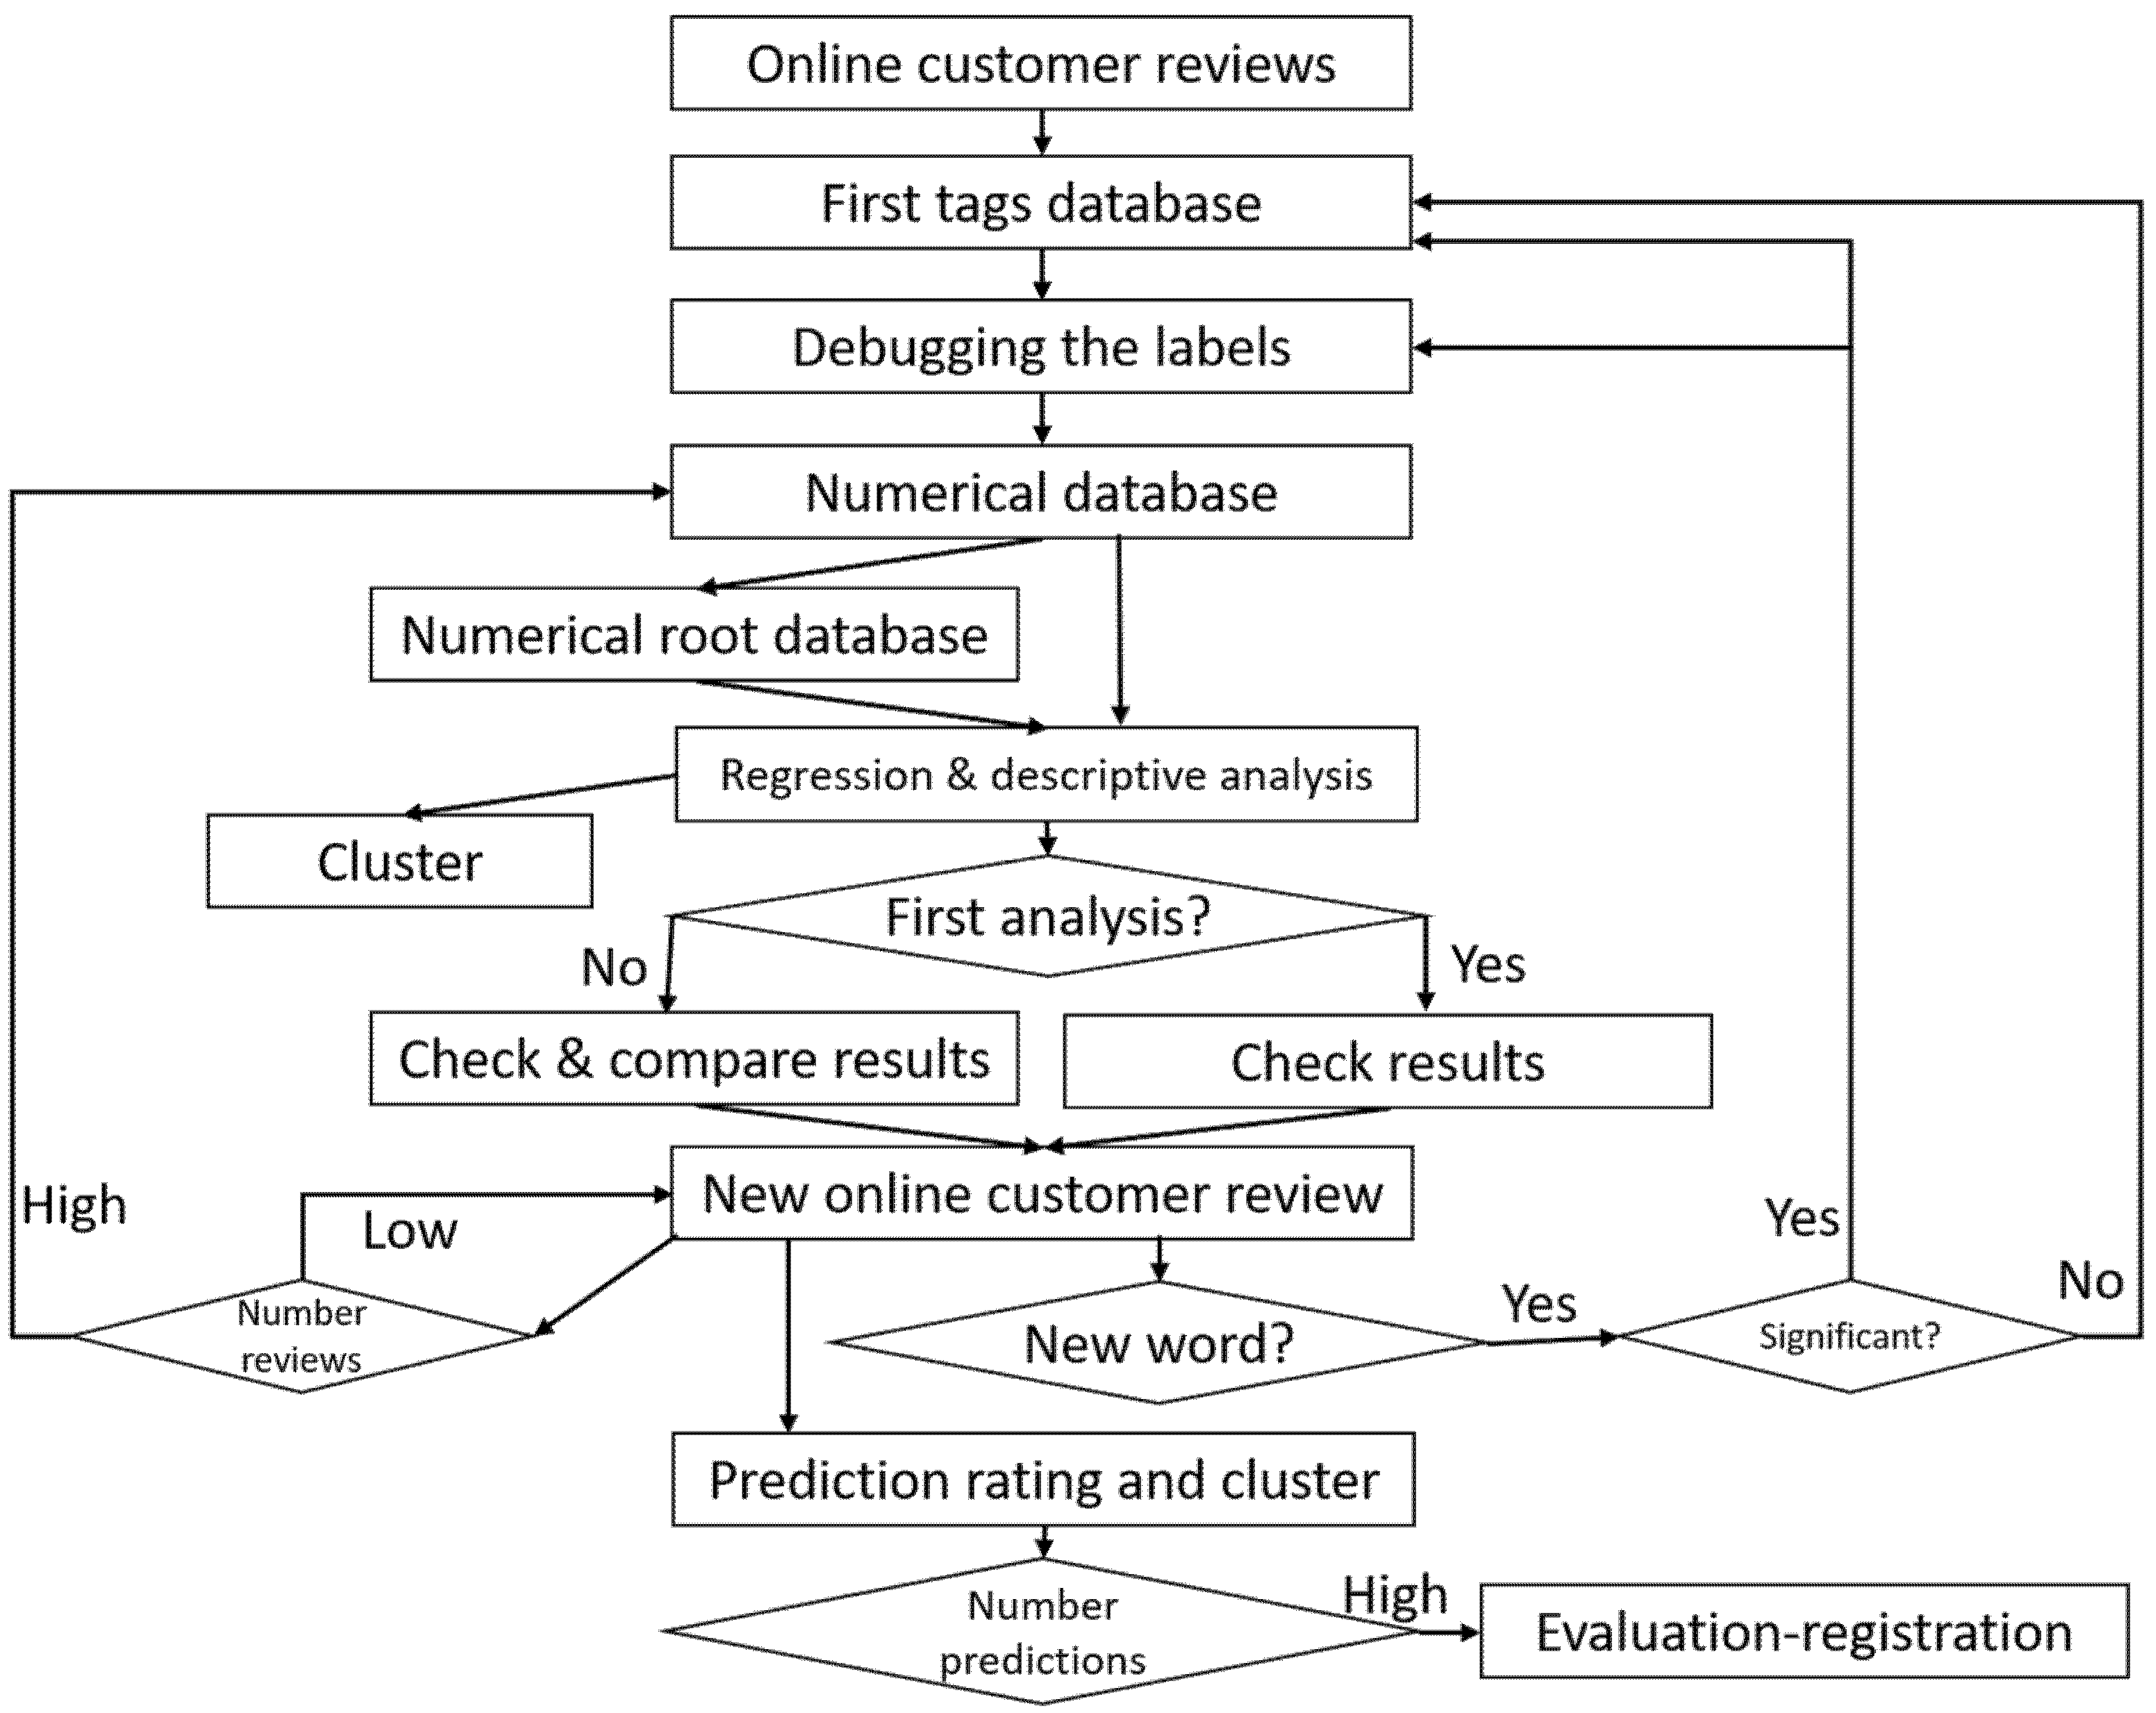
3. Research Methodology
- (1)
- Obtaining customers’ online reviews containing their general rating, title, and comment shared on a social network.
- (2)
- The tag database with the words contained in the titles of the comments could also be created with the comments themselves, but the number of tags would increase enormously, which would make the statistical study difficult. Furthermore, it can be assumed that the most relevant words to define the customer experience are found in the titles.
- (3)
- Debugging the labels to deactivate those that do not directly impact the sense of the customers’ online ratings. This task must be carried out by a specialized team or person who will transfer their knowledge to the machine learning system as the number of labels increases. From here, the final database of the labels to be used in the statistical analysis will be obtained.
- (4)
- Create a numerical database where each row corresponds to an online comment from the customers and the columns correspond to the variables that, first, consist of the general rating given by the customers (variables between 1 and 5). In contrast, the rest of the variables are the active labels, which will be given a value of 1 if they are found in the title of the comment, and 0 otherwise.
- (5)
- If necessary, create a new numerical database of labels based on the root of the words to reduce the number of variables without losing the meaning of the words.
- (6)
- Conduct a linear or other type of regression if considered necessary, where the dependent variable is the general rating and the independent variables are the activated labels. A descriptive analysis is also carried out of the averages of the general rating obtained in titles with the same label, which helps to relate the meaning and intensity of the tags to the general rating.
- (7)
- Check whether the regression model is consistent through the adjusted R square obtained. Likewise, the labels with a significant relationship, positive or negative, with the general rating will be determined. Furthermore, the minimum number of times a label appears can be established for use in subsequent analyses. By establishing the significant labels and the minimum number of times they have to appear in the titles or comments, a final database of significant labels can be created.
- (8)
- Once the meaningful labels have been determined, cluster analysis can be conducted to check whether a classification is adequate. The variables would be the labels, initial, root, or significant, as decided in the research, resulting in a classification of customers according to the types of words they use in their titles or online comments.
- (9)
- Continue to obtain information from new online customer reviews.
- (10)
- Verify whether the words in the new titles are already in the original label database. If so, the next step is to be taken. If not, a new label will be created and evaluated to determine whether it should be deactivated, depending on its impact on the customers’ general assessment. Once these decisions have been made, the next step is carried out.
- (11)
- Assess whether the words in the title of the new review correspond to any significant label. If so, an overall rating can be predicted. In this case, the difference between the predicted rating and the actual rating is evaluated to establish how accurate the prediction is. Another statistical analysis that can be performed in this step is to assign the new customer who makes the online comment to one of the predefined clusters to classify the user and start to define a profile based on the words s/he uses.
- (12)
- When a relevant number of predictions have been made, a joint analysis is carried out to validate the regression model applied and the assignment of users to predefined clusters.
- (13)
- When a significant number of new online reviews have been added, we move to Step 4 to perform a new regression analysis to confirm whether the labels are still significant, whether they maintain the coefficients, and whether there are new labels that are significant. A new cluster analysis can also be carried out to check whether the defined clusters are still maintained or, conversely, have to be reidentified because substantial changes have occurred. A comparative analysis is performed to determine whether there are changes in the vocabulary used by customers to assess the service received.
4. Analysis of Results
4.1. Descriptive Analysis of the Labels
4.2. Regression Analysis
4.3. Cluster Analysis
5. Discussion of Results
6. Conclusions
Author Contributions
Funding
Conflicts of Interest
Appendix A
| Label | Number | Mean | Label | Number | Mean | Label | Number | Mean |
|---|---|---|---|---|---|---|---|---|
| ideal | 3 | 5 | bus | 94 | 3.61 | assistance | 3 | 3 |
| pleasure | 12 | 4.75 | turbulence | 5 | 3.6 | height | 3 | 3 |
| notable | 4 | 4.75 | lots | 20 | 3.6 | seat | 137 | 2.99 |
| printing | 4 | 4.75 | according | 5 | 3.6 | time | 48 | 2.98 |
| magnificent | 14 | 4.71 | resolved | 5 | 3.6 | regular | 39 | 2.97 |
| fantastic | 10 | 4.7 | queue | 5 | 3.6 | nothing | 50 | 2.96 |
| marvelous | 10 | 4.7 | assistant | 5 | 3.6 | individual | 20 | 2.95 |
| practical | 3 | 4.67 | acceptable | 25 | 3.6 | port | 21 | 2.95 |
| defraud | 3 | 4.67 | on board | 19 | 3.58 | plaza | 133 | 2.95 |
| focus | 3 | 4.67 | whole | 7 | 3.57 | pain | 20 | 2.9 |
| excellent | 327 | 4.64 | rest | 7 | 3.57 | average | 9 | 2.89 |
| latest | 5 | 4.6 | vacation | 16 | 3.56 | checking | 8 | 2.88 |
| impeccable | 59 | 4.58 | crew | 86 | 3.56 | educate | 7 | 2.86 |
| flawless | 15 | 4.53 | quite | 32 | 3.56 | where | 7 | 2.86 |
| exceptional | 18 | 4.5 | age | 11 | 3.55 | bathroom | 7 | 2.86 |
| phenomenal | 6 | 4.5 | air | 19 | 3.53 | down | 7 | 2.86 |
| chair | 4 | 4.5 | service | 458 | 3.52 | total | 13 | 2.85 |
| fan | 14 | 4.43 | touch | 4 | 3.5 | then | 13 | 2.85 |
| unbeatable | 5 | 4.4 | topic | 8 | 3.5 | case | 13 | 2.85 |
| agreed | 5 | 4.4 | seriousness | 4 | 3.5 | airport | 20 | 2.85 |
| have | 3 | 4.33 | feel | 4 | 3.5 | web | 6 | 2.83 |
| pass | 3 | 4.33 | route | 4 | 3.5 | repeat | 6 | 2.83 |
| modern | 12 | 4.33 | point | 12 | 3.5 | half | 6 | 2.83 |
| entertaining | 3 | 4.33 | lend | 8 | 3.5 | less | 12 | 2.83 |
| effective | 3 | 4.33 | order | 6 | 3.5 | cheap | 6 | 2.83 |
| appreciate | 3 | 4.33 | menu | 6 | 3.5 | attention | 11 | 2.82 |
| chord | 3 | 4.33 | frequent | 10 | 3.5 | straits | 11 | 2.82 |
| pleasurable | 23 | 4.3 | replicate | 4 | 3.5 | narrow | 17 | 2.82 |
| TRUE | 4 | 4.25 | although | 18 | 3.5 | go | 5 | 2.8 |
| serviceable | 4 | 4.25 | aspect | 4 | 3.5 | arrive | 5 | 2.8 |
| sensation | 4 | 4.25 | current | 8 | 3.5 | uncomfortable | 54 | 2.76 |
| even | 4 | 4.25 | cabin | 21 | 3.48 | value | 4 | 2.75 |
| like | 8 | 4.25 | deal | 86 | 3.47 | sun | 44 | 2.75 |
| favor | 4 | 4.25 | food | 72 | 3.47 | follow | 4 | 2.75 |
| astonishing | 4 | 4.25 | something | 13 | 3.46 | manner | 4 | 2.75 |
| cross | 4 | 4.25 | airline | 138 | 3.46 | mother | 4 | 2.75 |
| home | 18 | 4.22 | minute | 9 | 3.44 | low-cost | 4 | 2.75 |
| cute | 5 | 4.2 | without | 250 | 3.43 | justify | 4 | 2.75 |
| cordial | 11 | 4.18 | entre | 56 | 3.43 | thanks | 4 | 2.75 |
| leap | 6 | 4.17 | swindle | 12 | 3.42 | works | 8 | 2.75 |
| drinks | 6 | 4.17 | price | 91 | 3.42 | tough | 4 | 2.75 |
| fast | 32 | 4.16 | lines | 12 | 3.42 | passenger | 23 | 2.74 |
| punctual | 468 | 4.15 | connection | 19 | 3.42 | reenter | 11 | 2.73 |
| professional | 22 | 4.14 | job | 5 | 3.4 | old | 22 | 2.73 |
| efficiency | 7 | 4.14 | also | 5 | 3.4 | after | 140 | 2.73 |
| tourist | 18 | 4.11 | gate | 5 | 3.4 | date | 7 | 2.71 |
| trading | 9 | 4.11 | routine | 5 | 3.4 | enough | 3 | 2.67 |
| careful | 19 | 4.11 | legs | 15 | 3.4 | appear | 9 | 2.67 |
| nice | 100 | 4.11 | request | 5 | 3.4 | palm | 3 | 2.67 |
| relation | 22 | 4.09 | need | 5 | 3.4 | or | 3 | 2.67 |
| great | 52 | 4.08 | row | 5 | 3.4 | check in | 3 | 2.67 |
| quiet | 59 | 4.07 | escape | 5 | 3.4 | control | 3 | 2.67 |
| class | 34 | 4.06 | subsequent to | 5 | 3.4 | tariff | 3 | 2.67 |
| always | 114 | 4.05 | inside | 15 | 3.4 | fault | 3 | 2.67 |
| quality | 80 | 4.04 | return | 51 | 3.39 | high | 38 | 2.66 |
| summer | 3 | 4 | mess | 16 | 3.38 | already | 33 | 2.64 |
| last | 7 | 4 | amazing | 8 | 3.38 | bad | 381 | 2.64 |
| journey | 14 | 4 | during | 8 | 3.38 | desire | 8 | 2.63 |
| usually | 8 | 4 | detail | 8 | 3.38 | delay | 103 | 2.61 |
| startles | 4 | 4 | but | 170 | 3.37 | between | 5 | 2.6 |
| simply | 5 | 4 | period | 11 | 3.36 | dice | 20 | 2.6 |
| sure | 16 | 4 | all | 11 | 3.36 | ok | 19 | 2.58 |
| relaxed | 5 | 4 | bread | 22 | 3.36 | side | 19 | 2.53 |
| regional | 6 | 4 | on | 20 | 3.35 | hours | 56 | 2.52 |
| reasonable | 6 | 4 | much | 52 | 3.35 | respect | 6 | 2.5 |
| promotion | 3 | 4 | highlight | 3 | 3.33 | slow | 4 | 2.5 |
| predicted | 4 | 4 | put | 3 | 3.33 | can | 6 | 2.5 |
| prefer | 3 | 4 | power | 6 | 3.33 | equal | 4 | 2.5 |
| Fare-quality | 3 | 4 | couple | 3 | 3.33 | constant | 4 | 2.5 |
| pilot | 8 | 4 | inconvenient | 6 | 3.33 | behavior | 4 | 2.5 |
| film | 4 | 4 | provision | 6 | 3.33 | see | 63 | 2.41 |
| displays | 4 | 4 | different | 3 | 3.33 | lack | 29 | 2.41 |
| opinion | 6 | 4 | portion | 6 | 3.33 | responsibility | 5 | 2.4 |
| require | 3 | 4 | whatever | 3 | 3.33 | operated | 5 | 2.4 |
| Christmas | 3 | 4 | which | 6 | 3.33 | operate | 10 | 2.4 |
| deserves | 5 | 4 | short | 9 | 3.33 | crummy | 5 | 2.4 |
| pet | 3 | 4 | face | 24 | 3.33 | loose | 5 | 2.4 |
| praise | 3 | 4 | mouth | 3 | 3.33 | close | 5 | 2.4 |
| language | 3 | 4 | alike | 117 | 3.32 | change | 5 | 2.4 |
| big | 4 | 4 | yet | 28 | 3.32 | why | 8 | 2.38 |
| fleet | 5 | 4 | some | 19 | 3.32 | baggage | 52 | 2.38 |
| easy | 5 | 4 | small | 10 | 3.3 | badly | 82 | 2.38 |
| excellence | 4 | 4 | bridge | 14 | 3.29 | common | 8 | 2.38 |
| spectacular | 5 | 4 | delicious | 18 | 3.28 | zero | 8 | 2.38 |
| charm | 3 | 4 | neither | 248 | 3.28 | world | 14 | 2.36 |
| in time | 10 | 4 | never | 22 | 3.27 | scammed | 3 | 2.33 |
| say | 4 | 4 | offer | 65 | 3.26 | sir | 3 | 2.33 |
| price-quality | 5 | 4 | flag | 19 | 3.26 | remains | 9 | 2.33 |
| cabotage | 3 | 4 | only | 8 | 3.25 | priority | 3 | 2.33 |
| help | 3 | 4 | transport | 4 | 3.25 | predisposition | 3 | 2.33 |
| friendly | 27 | 4 | system | 4 | 3.25 | minimum | 3 | 2.33 |
| bueno | 108 | 3.96 | availability | 4 | 3.25 | mini | 6 | 2.33 |
| very | 605 | 3.95 | cutout | 4 | 3.25 | Information | 15 | 2.33 |
| comfort | 39 | 3.95 | post | 4 | 3.25 | difficulty | 3 | 2.33 |
| incidence | 16 | 3.94 | possibility | 4 | 3.25 | pause | 9 | 2.33 |
| general | 30 | 3.93 | position | 4 | 3.25 | deficient | 6 | 2.33 |
| fly | 39 | 3.92 | conventional | 8 | 3.25 | review | 3 | 2.33 |
| food | 183 | 3.92 | latinoamerica | 4 | 3.25 | obtain | 3 | 2.33 |
| ate | 11 | 3.91 | delete | 4 | 3.25 | fare | 4 | 2.25 |
| business | 55 | 3.91 | depends | 8 | 3.25 | let | 4 | 2.25 |
| duration | 41 | 3.9 | basic | 4 | 3.25 | care | 16 | 2.25 |
| international | 10 | 3.9 | acompaña | 4 | 3.25 | check-in | 4 | 2.25 |
| end | 19 | 3.89 | give | 25 | 3.24 | luggage | 51 | 2.24 |
| proposal | 8 | 3.88 | if | 791 | 3.22 | util | 5 | 2.2 |
| reach | 8 | 3.88 | land | 14 | 3.21 | dirty | 10 | 2.2 |
| concerning | 7 | 3.86 | none | 24 | 3.21 | inexpensive | 5 | 2.2 |
| Mexico | 14 | 3.86 | difference | 14 | 3.21 | fatal | 5 | 2.2 |
| setback | 7 | 3.86 | withdraw | 5 | 3.2 | guilt | 5 | 2.2 |
| right | 75 | 3.85 | revisit | 5 | 3.2 | ancient | 10 | 2.2 |
| luck | 6 | 3.83 | recommend | 5 | 3.2 | reservation | 17 | 2.18 |
| preferential | 6 | 3.83 | normal | 138 | 3.2 | contribute | 17 | 2.18 |
| moment | 6 | 3.83 | final | 5 | 3.2 | cancelation | 6 | 2.17 |
| intercontinental | 6 | 3.83 | additional | 5 | 3.2 | attitude | 6 | 2.17 |
| factor | 6 | 3.83 | rule | 140 | 3.19 | leave | 19 | 2.16 |
| traverse | 6 | 3.83 | more | 192 | 3.19 | employee | 7 | 2.14 |
| thing | 6 | 3.83 | space | 78 | 3.18 | suitcase | 8 | 2.13 |
| premium | 11 | 3.82 | responsible | 6 | 3.17 | organization | 10 | 2.1 |
| expectations | 11 | 3.82 | to get better | 48 | 3.17 | possible | 15 | 2.07 |
| surprise | 26 | 3.81 | special | 12 | 3.17 | attention | 14 | 2.07 |
| direct | 27 | 3.81 | choice | 6 | 3.17 | client | 51 | 2.06 |
| degrade | 5 | 3.8 | foot | 32 | 3.16 | reply | 3 | 2 |
| incidents | 5 | 3.8 | stewardess | 20 | 3.15 | page | 3 | 2 |
| reliable | 10 | 3.8 | life | 21 | 3.14 | online | 8 | 2 |
| executive | 5 | 3.8 | medium | 22 | 3.14 | kids | 4 | 2 |
| effectiveness | 5 | 3.8 | unexceptional | 7 | 3.14 | hands | 5 | 2 |
| classic | 5 | 3.8 | low | 28 | 3.14 | subsequently | 4 | 2 |
| when | 9 | 3.78 | go after | 16 | 3.13 | unpunctual | 4 | 2 |
| since | 26 | 3.77 | corporation | 8 | 3.13 | impossible | 14 | 2 |
| flight | 817 | 3.75 | scarce | 9 | 3.11 | grade | 3 | 2 |
| pears | 4 | 3.75 | standard | 10 | 3.1 | exists | 8 | 2 |
| place | 4 | 3.75 | no | 711 | 3.1 | gave | 11 | 2 |
| plenty | 4 | 3.75 | economic | 10 | 3.1 | charge | 8 | 2 |
| such | 333 | 3.75 | from | 103 | 3.1 | ticket | 11 | 2 |
| long | 46 | 3.74 | before | 39 | 3.1 | water | 7 | 2 |
| holiday | 45 | 3.73 | expensive | 22 | 3.09 | exhaust | 3 | 2 |
| weight | 11 | 3.73 | same | 12 | 3.08 | disappointment | 22 | 1.91 |
| new | 22 | 3.73 | airplane | 133 | 3.08 | sardines | 7 | 1.86 |
| a lot | 26 | 3.73 | by | 163 | 3.06 | poor | 7 | 1.86 |
| warranty | 11 | 3.73 | towering | 17 | 3.06 | plus | 5 | 1.8 |
| comfortable | 160 | 3.73 | pay | 21 | 3.05 | left | 5 | 1.8 |
| option | 39 | 3.72 | express | 26 | 3.04 | advertising | 4 | 1.75 |
| and | 1414 | 3.71 | boarding | 26 | 3.04 | higher | 4 | 1.75 |
| transatlantic | 7 | 3.71 | form | 30 | 3.03 | cheated | 4 | 1.75 |
| clothes | 42 | 3.71 | wifi | 4 | 3 | buy | 4 | 1.75 |
| interests | 7 | 3.71 | tv | 4 | 3 | infant | 4 | 1.75 |
| going | 654 | 3.71 | crossing | 3 | 3 | regrettable | 15 | 1.73 |
| better | 273 | 3.7 | transoceanic | 6 | 3 | glass | 3 | 1.67 |
| attention | 318 | 3.69 | contact | 3 | 3 | still | 3 | 1.67 |
| vip | 3 | 3.67 | pulling | 3 | 3 | probable | 3 | 1.67 |
| satisfied | 3 | 3.67 | type | 4 | 3 | hair | 6 | 1.67 |
| except | 6 | 3.67 | persons | 5 | 3 | overbooking | 9 | 1.67 |
| peace | 6 | 3.67 | think | 3 | 3 | horror | 6 | 1.67 |
| reduced | 3 | 3.67 | part | 8 | 3 | explanation | 6 | 1.67 |
| money | 3 | 3.67 | pay | 10 | 3 | disaster | 21 | 1.62 |
| background | 3 | 3.67 | gold | 13 | 3 | nightmare | 5 | 1.6 |
| number | 3 | 3.67 | leisure | 7 | 3 | painful | 5 | 1.6 |
| frequency | 3 | 3.67 | level | 8 | 3 | warn | 5 | 1.6 |
| defect | 3 | 3.67 | local | 3 | 3 | month | 7 | 1.57 |
| status | 3 | 3.67 | bring | 6 | 3 | worse | 4 | 1.5 |
| entertainment | 24 | 3.67 | together | 4 | 3 | pessimistic | 45 | 1.47 |
| select | 6 | 3.67 | irregular | 3 | 3 | error | 9 | 1.44 |
| cash | 3 | 3.67 | internal | 4 | 3 | human | 5 | 1.4 |
| destination | 9 | 3.67 | try | 3 | 3 | shame | 8 | 1.38 |
| must | 3 | 3.67 | until | 9 | 3 | terrible | 6 | 1.33 |
| costa | 3 | 3.67 | gentle | 9 | 3 | prepotent | 3 | 1.33 |
| puddle | 3 | 3.67 | cold | 4 | 3 | inexistent | 3 | 1.33 |
| charco | 3 | 3.67 | stay | 3 | 3 | non-compliance | 3 | 1.33 |
| coast | 15 | 3.67 | scale | 17 | 3 | void | 3 | 1.33 |
| thank | 3 | 3.67 | link | 3 | 3 | abuse | 3 | 1.33 |
| problem | 64 | 3.66 | efficient | 9 | 3 | mistreatment | 4 | 1.25 |
| motto | 65 | 3.66 | lag | 3 | 3 | fraud | 24 | 1.08 |
| experience | 182 | 3.66 | mean | 3 | 3 | thrown away | 3 | 1 |
| departure | 23 | 3.65 | cost | 6 | 3 | fright | 4 | 1 |
| company | 146 | 3.65 | catering | 6 | 3 | motive | 3 | 1 |
| extra | 11 | 3.64 | pricey | 3 | 3 | unpresentable | 5 | 1 |
| able to | 8 | 3.63 | fits | 4 | 3 | avoidance | 3 | 1 |
| organized | 8 | 3.63 | transportation | 3 | 3 | chaos | 4 | 1 |
| habitual | 8 | 3.63 | respite | 3 | 3 | app | 3 | 1 |
Appendix B
| Variables | Beta | T | Sig. | Variables | Beta | T | Sig. |
|---|---|---|---|---|---|---|---|
| (constant) | 3.739 | 131.628 | 0.000 *** | space | −0.535 | −3.909 | 0.000 *** |
| seat | 3.864 | 2.236 | 0.025 * | reservation | −0.562 | −1.971 | 0.049 * |
| keep | 3.770 | 2.203 | 0.028 * | never | −0.576 | −2.670 | 0.008 ** |
| additional | 3.539 | 4.028 | 0.000 *** | client | −0.607 | −4.016 | 0.000 *** |
| tower | 3.289 | 2.441 | 0.015 * | if | −0.617 | −3.144 | 0.002 ** |
| deliver | 3.276 | 3.383 | 0.001 ** | nothing | −0.628 | −3.114 | 0.002 ** |
| husband | 3.113 | 2.954 | 0.003 ** | charge | −0.637 | −1.942 | 0.052 |
| add up | 3.101 | 3.124 | 0.002 ** | lost | −0.672 | −3.295 | 0.001 ** |
| then | 3.015 | 2.209 | 0.027 * | improved | −0.698 | −3.258 | 0.001 ** |
| distribution | 2.925 | 3.409 | 0.001 ** | pain | −0.721 | −2.992 | 0.003 ** |
| slow | 2.893 | 2.164 | 0.031 * | baggage | −0.769 | −4.237 | 0.000 *** |
| forecast | 2.883 | 4.608 | 0.000 *** | all | −0.772 | −2.229 | 0.026 * |
| restrict | 2.860 | 2.199 | 0.028 * | regular | −0.779 | −5.014 | 0.000 *** |
| agency | 2.836 | 2.792 | 0.005 ** | disgust | −0.786 | −2.134 | 0.033 * |
| gender | 2.597 | 2.151 | 0.032 * | stewardess | −0.788 | −2.854 | 0.004 ** |
| congratulations | 2.537 | 2.646 | 0.008 ** | level | −0.813 | −2.312 | 0.021 * |
| whole | 2.524 | 2.313 | 0.021 * | impossible | −0.818 | −2.896 | 0.004 ** |
| find | 2.490 | 2.830 | 0.005 ** | until | −0.821 | −2.332 | 0.020 * |
| natural | 2.355 | 2.439 | 0.015 * | no | −0.840 | −10.688 | 0.000 *** |
| alien | 2.305 | 2.353 | 0.019 * | absolute | −0.840 | −2.254 | 0.024 * |
| centimeter | 2.220 | 2.184 | 0.029 * | high | −0.854 | −2.307 | 0.021 * |
| affair | 2.169 | 1.714 | 0.087 | horror | −0.900 | −3.355 | 0.001 ** |
| evident | 2.153 | 1.733 | 0.083 | give | −0.902 | −1.834 | 0.067 |
| barbarian | 2.116 | 3.508 | 0.000 *** | vary | −0.904 | −2.377 | 0.017 * |
| fan | 2.101 | 2.336 | 0.020 * | delay | −0.907 | −8.222 | 0.000 *** |
| tracks | 2.088 | 2.334 | 0.020 * | lack | −0.930 | −4.430 | 0.000 *** |
| price | 2.058 | 2.797 | 0.005 ** | uncomfortable | −0.965 | −8.257 | 0.000 *** |
| number | 2.015 | 1.835 | 0.067 | drinks | −0.969 | −1.792 | 0.073 |
| beverage | 1.943 | 1.644 | 0.100 | organization | −1.017 | −2.909 | 0.004 ** |
| mistake | 1.929 | 2.557 | 0.011 * | buy | −1.023 | −3.820 | 0.000 *** |
| light | 1.915 | 1.800 | 0.072 | quality | −1.054 | −1.868 | 0.062 |
| indecent | 1.890 | 2.025 | 0.043 * | think | −1.064 | −2.778 | 0.005 ** |
| documentation | 1.871 | 1.978 | 0.048 * | solve | −1.137 | −2.168 | 0.030 * |
| curious | 1.854 | 1.647 | 0.100 | communicate | −1.150 | −2.322 | 0.020 * |
| defraud | 1.837 | 2.169 | 0.030 * | lowcost | −1.171 | −2.709 | 0.007 ** |
| electronic | 1.801 | 1.823 | 0.068 | old | −1.175 | −3.894 | 0.000 *** |
| royal | 1.728 | 1.721 | 0.085 | warn | −1.196 | −2.797 | 0.005 ** |
| little bit | 1.709 | 1.901 | 0.057 | complicate | −1.197 | −1.892 | 0.059 |
| place | 1.696 | 2.515 | 0.012 * | delay | −1.221 | −3.458 | 0.001 ** |
| instructions | 1.686 | 1.857 | 0.063 | appear | −1.224 | −3.328 | 0.001 ** |
| mini | 1.682 | 1.804 | 0.071 | badly | −1.230 | −10.679 | 0.000 *** |
| talk | 1.572 | 1.699 | 0.089 | telephone | −1.260 | −1.909 | 0.056 |
| relax | 1.543 | 1.765 | 0.078 | plus | −1.274 | −3.039 | 0.002 ** |
| personalized | 1.512 | 1.819 | 0.069 | pause | −1.279 | −2.886 | 0.004 ** |
| remedy | 1.472 | 1.797 | 0.072 | chaotic | −1.289 | −2.462 | 0.014 * |
| round | 1.454 | 1.709 | 0.087 | terrible | −1.328 | −3.483 | 0.001 ** |
| road | 1.426 | 1.723 | 0.085 | arrival | −1.356 | −2.069 | 0.039 * |
| agile | 1.411 | 1.689 | 0.091 | want | −1.375 | −2.049 | 0.041 * |
| warm | 1.382 | 2.501 | 0.012 * | bad | −1.416 | −12.093 | 0.000 *** |
| have | 1.340 | 2.554 | 0.011 * | unpunctual | −1.419 | −2.685 | 0.007 ** |
| touch | 1.329 | 2.053 | 0.040 * | error | −1.441 | −2.594 | 0.010 * |
| after | 1.316 | 2.102 | 0.036 * | discriminate | −1.453 | −2.354 | 0.019 * |
| easy | 1.300 | 1.651 | 0.099 | thrown away | −1.489 | −2.316 | 0.021 * |
| agree | 1.270 | 1.979 | 0.048 * | mistreatment | −1.507 | −3.214 | 0.001 ** |
| opera | 1.243 | 2.014 | 0.044 * | possibility | −1.523 | −2.293 | 0.022 * |
| system | 1.239 | 1.947 | 0.052 | water | −1.539 | −2.468 | 0.014 * |
| luxury | 1.184 | 2.006 | 0.045 * | ticket | −1.540 | −2.787 | 0.005 ** |
| magical | 1.180 | 1.995 | 0.046* | forget | −1.556 | −3.268 | 0.001 ** |
| web | 1.179 | 1.938 | 0.053 | negligent | −1.577 | −1.708 | 0.088 |
| meeting | 1.167 | 1.974 | 0.048 * | wide | −1.582 | −1.831 | 0.067 |
| maximum | 1.151 | 1.986 | 0.047 * | avoidance | −1.583 | −3.286 | 0.001 ** |
| moment | 1.137 | 2.607 | 0.009 ** | any | −1.590 | −2.322 | 0.020 * |
| unforgettable | 1.128 | 1.943 | 0.052 | sell | −1.600 | −3.438 | 0.001 ** |
| behavior | 1.112 | 1.956 | 0.051 | sardines | −1.620 | −2.960 | 0.003 ** |
| predisposition | 1.040 | 2.064 | 0.039 * | down | −1.623 | −2.590 | 0.010 * |
| remove | 1.024 | 1.730 | 0.084 | non-existent | −1.630 | −2.659 | 0.008 ** |
| remarkable | 1.017 | 2.247 | 0.025 * | particular | −1.648 | −2.804 | 0.005 ** |
| magnificent | 0.966 | 4.403 | 0.000 *** | painful | −1.659 | −5.014 | 0.000 *** |
| fantastic | 0.915 | 3.562 | 0.000 *** | frightening | −1.671 | −3.387 | 0.001 ** |
| great | 0.886 | 3.607 | 0.000 *** | cheated | −1.678 | −4.830 | 0.000 *** |
| brilliant | 0.863 | 4.098 | 0.000 *** | poor | −1.699 | −4.834 | 0.000 *** |
| extraordinary | 0.856 | 1.688 | 0.092 | lousy | −1.707 | −5.211 | 0.000 *** |
| excellent | 0.852 | 16.056 | 0.000 *** | load | −1.712 | −1.929 | 0.054 |
| end | 0.825 | 1.967 | 0.049 * | deficient | −1.715 | −4.378 | 0.000 *** |
| perfect | 0.792 | 7.319 | 0.000 *** | breach | −1.739 | −2.123 | 0.034 * |
| charm | 0.786 | 3.130 | 0.002 ** | decline | −1.739 | −3.000 | 0.003 ** |
| phenomenal | 0.755 | 2.216 | 0.027 * | money | −1.739 | −2.123 | 0.034 * |
| enjoyment | 0.749 | 3.340 | 0.001 ** | vulgar | −1.739 | −2.123 | 0.034 * |
| compete | 0.734 | 1.732 | 0.083 | terror | −1.747 | −4.856 | 0.000 *** |
| wonderful | 0.715 | 2.732 | 0.006 ** | worse | −1.755 | −16.331 | 0.000 *** |
| house | 0.699 | 2.914 | 0.004 ** | exhausting | −1.761 | −2.999 | 0.003 ** |
| according | 0.687 | 1.857 | 0.063 | scammed | −1.772 | −2.803 | 0.005 ** |
| like | 0.666 | 1.805 | 0.071 | rate | −1.782 | −3.391 | 0.001 ** |
| faultless | 0.642 | 2.905 | 0.004 ** | win | −1.787 | −2.156 | 0.031 * |
| unbeatable | 0.637 | 1.679 | 0.093 | sad | −1.804 | −2.316 | 0.021 * |
| neither | 0.622 | 2.259 | 0.024 * | countryside | −1.812 | −2.167 | 0.030 * |
| first | 0.586 | 2.916 | 0.004 ** | half | −1.817 | −3.345 | 0.001 ** |
| big | 0.585 | 4.086 | 0.000 *** | shame | −1.839 | −5.330 | 0.000 *** |
| better | 0.576 | 4.807 | 0.000 *** | fatal | −1.866 | −4.491 | 0.000 *** |
| overcome | 0.518 | 2.125 | 0.034 * | disaster | −1.867 | −11.170 | 0.000 *** |
| almost | 0.517 | 1.836 | 0.066 | obsolete | −1.889 | −3.019 | 0.003 ** |
| time | 0.466 | 2.207 | 0.027 * | disappointment | −1.900 | −10.292 | 0.000 *** |
| passenger | 0.465 | 1.852 | 0.064 | reason | −1.902 | −2.573 | 0.010 * |
| trust | 0.325 | 1.639 | 0.101 | hair | −1.925 | −4.507 | 0.000 *** |
| fast | 0.312 | 2.154 | 0.031 * | precarious | −1.926 | −2.339 | 0.019 * |
| fly | 0.279 | 1.798 | 0.072 | value | −1.948 | −3.679 | 0.000 *** |
| always | 0.275 | 2.897 | 0.004 ** | guilt | −1.965 | −2.908 | 0.004 ** |
| very | 0.257 | 6.169 | 0.000 *** | shatter | −1.970 | −2.349 | 0.019 * |
| good | 0.233 | 3.068 | 0.002 ** | awful | −1.996 | −2.434 | 0.015 * |
| comfortable | 0.232 | 3.131 | 0.002 ** | regrettable | −2.010 | −8.323 | 0.000 *** |
| punctual | 0.219 | 4.381 | 0.000 *** | recognize | −2.028 | −2.454 | 0.014 * |
| pleasant | 0.217 | 2.254 | 0.024 * | abusive | −2.048 | −3.740 | 0.000 *** |
| calm | 0.201 | 1.945 | 0.052 | pessimistic | −2.054 | −18.103 | 0.000 *** |
| but | 0.197 | 2.179 | 0.029 * | leave | −2.061 | −3.622 | 0.000 *** |
| travel | 0.139 | 2.799 | 0.005 ** | cancel | −2.077 | −5.267 | 0.000 *** |
| experience | 0.128 | 1.832 | 0.067 | impolite | −2.107 | −3.168 | 0.002 ** |
| flight | 0.109 | 2.664 | 0.008 ** | unpresentable | −2.127 | −5.469 | 0.000 *** |
| and | 0.080 | 1.622 | 0.105 | bored | −2.135 | −2.600 | 0.009 ** |
| more | −0.177 | −1.827 | 0.068 | distorted | −2.136 | −3.639 | 0.000 *** |
| wait | −0.262 | −2.073 | 0.038 * | transfer | −2.201 | −2.591 | 0.010 * |
| man | −0.337 | −1.932 | 0.053 | abandonment | −2.221 | −3.796 | 0.000 *** |
| respect | −0.453 | −1.751 | 0.080 | spoil | −2.227 | −1.661 | 0.097 |
| low | −0.489 | −1.617 | 0.106 | filth | −2.265 | −2.136 | 0.033 * |
| clean | −0.518 | −1.699 | 0.089 | inoperative | −2.266 | −1.929 | 0.054 |
| scarce | −0.588 | −2.151 | 0.032 * | zero | −2.266 | −5.012 | 0.000 *** |
| return | −0.594 | −1.908 | 0.056 | abuse | −2.273 | −3.380 | 0.001 ** |
| yet | −0.602 | −1.625 | 0.104 | date | −2.281 | −1.810 | 0.070 |
| cheap | −0.608 | −2.077 | 0.038 * | antihuman | −2.285 | −2.283 | 0.022 * |
| mediocre | −0.673 | −1.892 | 0.059 | reschedule | −2.316 | −3.772 | 0.000 *** |
| consider | −0.713 | −1.927 | 0.054 | anger | −2.324 | −2.795 | 0.005 ** |
| fair | −0.748 | −1.613 | 0.107 | overbooking | −2.335 | −6.042 | 0.000 *** |
| dirty | −0.751 | −1.627 | 0.104 | terminal | −2.344 | −1.931 | 0.054 |
| disorganize | −0.808 | −2.339 | 0.019 * | fraud | −2.346 | −12.124 | 0.000 *** |
| operated | −0.847 | −1.652 | 0.099 | meters | −2.352 | −1.819 | 0.069 |
| explanation | −0.861 | −2.137 | 0.033 * | strict | −2.397 | −2.558 | 0.011 * |
| standard | −0.875 | −1.836 | 0.066 | apparatus | −2.434 | −2.016 | 0.044 * |
| cargo | −0.885 | −2.057 | 0.040 * | uncomfortable | −2.440 | −2.901 | 0.004 ** |
| loose | −0.929 | −1.898 | 0.058 | general | −2.446 | −2.006 | 0.045 * |
| response | −0.939 | −1.654 | 0.098 | doing | −2.461 | −3.936 | 0.000 *** |
| adapt | −1.007 | −1.684 | 0.092 | lies | −2.474 | −4.229 | 0.000 *** |
| fault | −1.082 | −2.224 | 0.026 * | divide | −2.503 | −2.712 | 0.007 ** |
| damage | −1.100 | −1.786 | 0.074 | dire | −2.594 | −7.687 | 0.000 *** |
| ignore | −1.222 | −2.448 | 0.014 * | delete | −2.640 | −2.762 | 0.006 ** |
| app | −1.232 | −1.770 | 0.077 | unhuman | −2.641 | −3.749 | 0.000 *** |
| word | −1.252 | −1.857 | 0.063 | run away | −2.694 | −3.247 | 0.001 ** |
| remember | −1.268 | −2.114 | 0.035 * | oversold | −2.711 | −3.279 | 0.001 ** |
| satellite | −1.273 | −1.856 | 0.063 | expression | −2.712 | −2.655 | 0.008 ** |
| null | −1.451 | −2.378 | 0.017 * | jinx | −2.714 | −3.066 | 0.002 ** |
| baby | −1.521 | −2.493 | 0.013 * | revulsion | −2.739 | −3.343 | 0.001 ** |
| gain | −1.543 | −1.652 | 0.099 | tyranny | −2.739 | −3.343 | 0.001 ** |
| letter | −1.563 | −1.707 | 0.088 | unforgivable | −2.739 | −3.343 | 0.001 ** |
| clouds | −1.571 | −1.829 | 0.067 | fiasco | −2.739 | −3.343 | 0.001 ** |
| exorbitant | −1.588 | −1.776 | 0.076 | failure | −2.739 | −3.343 | 0.001 ** |
| infinite | −1.647 | −1.624 | 0.104 | queue | −2.739 | −3.343 | 0.001 ** |
| infimum | −1.657 | −1.908 | 0.056 | authorize | −2.739 | −3.343 | 0.001 ** |
| negligence | −1.696 | −1.870 | 0.062 | outrageous | −2.739 | −3.343 | 0.001 ** |
| request | −1.725 | −1.827 | 0.068 | authentic | −2.739 | −3.343 | 0.001 ** |
| suffer | −1.739 | −2.123 | 0.034 * | xenophobic | −2.739 | −3.343 | 0.001 ** |
| frozen | −1.739 | −2.123 | 0.034 * | criminals | −2.739 | −3.343 | 0.001 ** |
| pate | −1.739 | −2.123 | 0.034 * | very poor | −2.739 | −3.343 | 0.001 ** |
| hate | −1.739 | −2.123 | 0.034 * | garbage | −2.739 | −3.343 | 0.001 ** |
| riot | −1.739 | −2.123 | 0.034 * | incompetent | −2.739 | −3.343 | 0.001 ** |
| mortal | −1.739 | −2.123 | 0.034 * | misery | −2.739 | −3.343 | 0.001 ** |
| unsatisfied | −1.739 | −2.123 | 0.034 * | navel | −2.749 | −2.921 | 0.004 ** |
| free | −1.739 | −2.123 | 0.034 * | tremendous | −2.819 | −3.434 | 0.001 ** |
| go around | −1.739 | −2.123 | 0.034 * | inefficiency | −2.819 | −3.434 | 0.001 ** |
| perfume | −1.739 | −2.123 | 0.034 * | court | −2.865 | −3.097 | 0.002 ** |
| penalize | −1.739 | −2.123 | 0.034 * | chaos | −2.920 | −5.315 | 0.000 *** |
| owners | −1.739 | −2.123 | 0.034 * | horny | −2.927 | −3.020 | 0.003 ** |
| unconcern | −1.757 | −1.910 | 0.056 | true | −2.935 | −3.561 | 0.000 *** |
| go down | −1.766 | −2.086 | 0.037 * | scam | −2.950 | −5.937 | 0.000 *** |
| truck | −1.787 | −2.156 | 0.031 * | default | −2.950 | −2.156 | 0.031 * |
| ancient | −1.794 | −2.106 | 0.035 * | delight | −2.954 | −2.121 | 0.034 * |
| fed up | −1.795 | −2.022 | 0.043 * | award | −2.992 | −2.821 | 0.005 ** |
| regret | −1.816 | −2.030 | 0.042 * | still | −3.023 | −1.891 | 0.059 |
| waste | −1.832 | −2.217 | 0.027 * | rue | −3.080 | −2.879 | 0.004 ** |
| stumbling | −1.848 | −2.254 | 0.024 * | delicacy | −3.081 | −2.310 | 0.021 * |
| liquor | −1.869 | −1.883 | 0.060 | juice | −3.139 | −2.070 | 0.039 * |
| refrain | −1.878 | −2.289 | 0.022 * | secondary | −3.204 | −3.739 | 0.000 *** |
| divert | −1.891 | −2.208 | 0.027 * | frustration | −3.221 | −3.751 | 0.000 *** |
| canned | −1.891 | −1.632 | 0.103 | car | −3.311 | −4.019 | 0.000 *** |
| admit | −1.899 | −2.309 | 0.021 * | botched | −3.324 | −3.998 | 0.000 *** |
| believe | −1.899 | −2.309 | 0.021 * | rude | −3.409 | −2.890 | 0.004 ** |
| see | −1.907 | −1.840 | 0.066 | converted | −3.437 | −3.138 | 0.002 ** |
| useless | −1.943 | −2.180 | 0.029 * | confusion | −3.636 | −3.052 | 0.002 ** |
| functional | −1.973 | −2.235 | 0.025 * | permitted | −3.693 | −2.905 | 0.004 ** |
| remember | −1.996 | −1.895 | 0.058 | ambient | −3.708 | −2.366 | 0.018 * |
| private | −2.001 | −1.752 | 0.080 | chair | −3.763 | −2.713 | 0.007 ** |
| turbulent | −2.072 | −2.521 | 0.012 * | occupied | −3.826 | −2.367 | 0.018 * |
| sweetie | −2.111 | −2.503 | 0.012 * | find out | −4.170 | −3.048 | 0.002 ** |
| converting | −2.151 | −1.910 | 0.056 | omitted | −4.207 | −2.495 | 0.013 * |
| modification | −2.177 | −2.511 | 0.012 * | nobody | −4.425 | −3.223 | 0.001 ** |
| airplane | −0.285 | −2.175 | 0.030 * | relapsing | −4.531 | −3.545 | 0.000 *** |
| hours | −0.323 | −2.081 | 0.037 * | lay off | −4.681 | −2.930 | 0.003 ** |
| normal | −0.532 | −6.722 | 0.000 *** | indifferent | −5.076 | −3.635 | 0.000 *** |
Appendix C
| Cluster 1 | Cluster 4 | Cluster 5 (Continuation) | |||
|---|---|---|---|---|---|
| Label | Number | Label | Number | Label | Number |
| nice | 12 | pleasant | 25 | absolute | 7 |
| airplane | 8 | water | 2 | abusive | 5 |
| well | 9 | void | 2 | enjoyable | 36 |
| characteristic | 9 | plane | 10 | water | 4 |
| warm | 9 | warn | 2 | tall | 6 |
| load | 2 | stewardess | 2 | old | 8 |
| client | 3 | economic | 3 | backwardness | 6 |
| comfortable | 27 | well | 9 | plane | 49 |
| buy | 3 | ticket | 2 | warn | 5 |
| disaster | 2 | quality | 9 | stewardess | 12 |
| charm | 3 | trait | 8 | cheap | 8 |
| distance | 4 | cancel | 9 | drinks | 3 |
| exceptional | 3 | almost | 2 | good | 90 |
| excellent | 260 | comfortable | 18 | ticket | 6 |
| experience | 10 | buy | 4 | quality | 52 |
| marvelous | 5 | frustration | 2 | cancel | 3 |
| like | 2 | disaster | 2 | chaos | 4 |
| scheduled | 5 | attraction | 2 | chaotic | 3 |
| horror | 2 | scarce | 3 | Position | 5 |
| embarrassing | 8 | gap | 5 | house | 15 |
| horrible | 3 | remain | 3 | almost | 9 |
| wrong | 4 | awesome | 4 | zero | 6 |
| luggage | 2 | excellent | 50 | client | 45 |
| more | 12 | adventure | 9 | charge | 13 |
| best | 6 | explanation | 2 | comfortable | 95 |
| very | 2 | fantastic | 6 | compete | 4 |
| blank | 2 | date | 2 | buy | 20 |
| neither | 2 | unusual | 3 | communicate | 4 |
| Not | 16 | general | 3 | consider | 6 |
| normal | 12 | gender | 3 | any | 3 |
| never | 3 | great | 6 | guilt | 5 |
| accurate | 3 | hours | 8 | damage | 3 |
| but | 11 | pure | 2 | give | 7 |
| pessimistic | 9 | impossible | 2 | disappointment | 20 |
| pleasure | 10 | uncomfortable | 12 | deficient | 3 |
| first | 5 | unbeatable | 3 | defraud | 5 |
| punctual | 31 | regrettable | 2 | leave | 7 |
| fast | 5 | clean | 2 | disgust | 6 |
| standar | 3 | magnificent | 2 | disaster | 28 |
| respect | 3 | atrocious | 7 | disrupt | 5 |
| prorogation | 2 | bags | 7 | money | 3 |
| if | 7 | Wonderful | 3 | discriminate | 3 |
| always | 15 | larger | 14 | charm | 6 |
| beats | 2 | better | 5 | find | 3 |
| calm | 14 | nought | 2 | cheated | 8 |
| crew | 4 | neither | 3 | scarce | 3 |
| travel | 362 | no way | 10 | frightening | 3 |
| return | 4 | normal | 30 | wait | 51 |
| Cluster 2 | operated | 3 | fraud | 8 | |
| Label | Number | worse | 6 | amazing | 5 |
| pleasant | 18 | lost | 6 | experience | 118 |
| old | 2 | perfect | 18 | explanation | 4 |
| airplane | 15 | nevertheless | 5 | extra-ordinary | 3 |
| stewardess | 6 | pessimistic | 4 | lack | 25 |
| drinks | 2 | enjoyment | 7 | wonderful | 5 |
| good | 65 | first | 4 | fatal | 5 |
| feature | 4 | punctual | 49 | phenomenal | 3 |
| warm | 4 | fast | 9 | end | 7 |
| client | 2 | delayed | 23 | loose | 3 |
| comfortable | 27 | if | 2 | cold | 3 |
| according | 3 | continuously | 5 | general | 18 |
| deficient | 3 | overcome | 2 | gender | 19 |
| disrupt | 2 | pause | 2 | great | 15 |
| scarce | 3 | time | 7 | big | 34 |
| space | 17 | calm | 30 | relish | 3 |
| outstanding | 15 | personnel | 5 | until | 6 |
| experience | 38 | journey | 4 | hours | 37 |
| overall | 9 | Cluster 5 | horror | 8 | |
| sex | 10 | Label | Number | irreproachable | 10 |
| hours | 5 | want | 6 | impossible | 9 |
| flawless | 2 | fast | 20 | unpresentable | 5 |
| awkward | 15 | regular | 29 | unpunctual | 3 |
| shitty | 17 | reservation | 16 | mortifying | 29 |
| awful | 10 | respect | 13 | non-existent | 3 |
| rather | 3 | remove | 3 | inhuman | 3 |
| nil | 3 | delay | 83 | regrettable | 12 |
| neither | 4 | sardines | 7 | clean | 9 |
| not | 21 | divide | 3 | low cost | 4 |
| normal | 9 | if | 30 | place | 3 |
| faultless | 5 | always | 80 | pleasant | 12 |
| but | 20 | solve | 8 | abysmal | 42 |
| pessimistic | 2 | standard | 3 | badly | 50 |
| enjoyment | 11 | overcome | 15 | impolite | 4 |
| punctual | 70 | postponement | 7 | baggage | 45 |
| fast | 2 | fare | 3 | lousy | 6 |
| if | 3 | terrible | 5 | mistreatment | 5 |
| habitually | 12 | terror | 6 | wonderful | 8 |
| duration | 2 | weather | 25 | more | 103 |
| wholly | 3 | scam | 3 | maximum | 4 |
| soundless | 11 | thrown away | 3 | mediocre | 8 |
| staff | 5 | all | 6 | better | 89 |
| travel | 54 | quiet | 20 | improvable | 19 |
| fly | 3 | behind | 4 | moment | 5 |
| flight | 88 | crew | 23 | nothing | 34 |
| Cluster 3 | value | 4 | dire | 6 | |
| Label | Number | variar | 7 | ni | 23 |
| airplane | 2 | sell | 4 | level | 7 |
| comfortable | 5 | shame | 7 | no | 199 |
| disaster | 2 | fly | 35 | normal | 86 |
| scarce | 3 | return | 6 | remarkable | 3 |
| space | 53 | web | 4 | number | 3 |
| fraud | 2 | bad | 60 | never | 18 |
| experience | 7 | delight | 13 | obsolete | 3 |
| Lack | 2 | seat | 5 | forget | 4 |
| horror | 3 | poor | 5 | organization | 6 |
| impossible | 3 | possibility | 3 | overbooking | 7 |
| uncomfortable | 2 | first | 12 | appear | 10 |
| crappy | 6 | prompt | 306 | pasajero | 20 |
| mejor | 2 | pensar | 5 | hair | 6 |
| no means | 4 | Lost | 32 | Pain | 16 |
| worse | 77 | impeccable | 39 | painful | 7 |
| pero | 9 | however | 111 | ||
| precise | 4 | ||||
| fast | 2 | ||||
| regularly | 2 | ||||
| trip | 3 | ||||
References
- Rodríguez-Díaz, M.; Espino-Rodríguez, T.F. Determining the reliability and validity of online reputation databases for lodging: Booking.com, TripAdvisror, and HolidayCheck. J. Vacat. Mark. 2018, 24, 261–274. [Google Scholar] [CrossRef]
- Horster, E.; Gottschalk, C. Computer-assisted webnography: A new approach to online reputation management in tourism. J. Vacat. Mark. 2012, 18, 229–238. [Google Scholar] [CrossRef]
- Yacouel, N.; Fleischer, A. The role of cybermediaries in reputation building and price premiums in the online hotel market. J. Travel Res. 2012, 51, 219–226. [Google Scholar] [CrossRef]
- Li, H.; Ye, Q.; Law, R. Determinants of customer satisfaction in the hotel industry: An application of online review analysis. Asia Pac. J. Tour. Res. 2013, 18, 784–802. [Google Scholar] [CrossRef]
- Gössling, S.; Hall, C.M.; Andersson, A.C. The manager’s dilemma: A conceptualization of online review manipulation strategies. Curr. Issues Tour. 2018, 21, 484–503. [Google Scholar] [CrossRef]
- Yusuf, A.S.; Busalim, A.H. Influence of e-WOM engagement on consumer purchase intention in social commerce. J. Serv. Mark. 2018, 32, 493–504. [Google Scholar] [CrossRef]
- Akram, U.; Junaid, M.; Zafar, A.U.; Li, Z.; Fan, M. Online purchase intention in Chinese social commerce platforms: Being emotional or rational? J. Retail. Consum. Serv. 2021, 63, 102669. [Google Scholar] [CrossRef]
- Bahtar, A.Z.; Muda, M. The impact of User–Generated Content (UGC) on product reviews towards online purchasing–A conceptual framework. Procedia Econ. Financ. 2016, 37, 337–342. [Google Scholar] [CrossRef] [Green Version]
- Xu, Z.; Dang, Y.; Wang, Q. Potential buyer identification and purchase likelihood quantification by mining user-generated content on social media. Expert Syst. Appl. 2022, 187, 115899. [Google Scholar] [CrossRef]
- Vermeulen, I.E.; Seegers, D. Tried and tested: The impact of online hotel reviews on consumer consideration. Tour. Manag. 2009, 30, 123–127. [Google Scholar] [CrossRef]
- Ye, Q.; Law, R.; Gu, B.; Chen, W. The influence of user-generated content on traveler behavior: An empirical investigation on the effects of e-word-of-mouth to hotel online bookings. Comput. Hum. Behav. 2011, 27, 634–639. [Google Scholar] [CrossRef]
- Kim, W.G.; Lim, H.; Brymer, R.A. The effectiveness of managing social media on hotel performance. Int. J. Hosp. Manag. 2015, 44, 165–171. [Google Scholar] [CrossRef]
- Lee, S.; Ro, H. The impact of online reviews on attitude changes: The differential effects of review attributes and consumer knowledge. Int. J. Hosp. Manag. 2016, 56, 1–9. [Google Scholar] [CrossRef]
- Rodríguez-Díaz, M.; Espino-Rodríguez, T.F.; Rodríguez-Díaz, R. A model of market positioning based on value creation and service quality in the lodging industry: An empirical application of online customer reviews. Tour. Econ. 2015, 21, 1273–1294. [Google Scholar] [CrossRef]
- Chun, R. Corporate reputation: Meaning and measurement. Int. J. Manag. Rev. 2005, 7, 91–109. [Google Scholar] [CrossRef]
- Estárico, E.H.; Medina, L.F.; Marrero, S.M. Una aproximación a la reputación en línea de los establecimientos hoteleros españoles. Pap. Tur. 2012, 52, 63–88. [Google Scholar]
- Varini, K.; Sirsi, P. Social media and revenue management; where should the two meet? J. Technol. Manag. Grow. Econ. 2012, 3, 33–46. [Google Scholar] [CrossRef] [Green Version]
- Ye, Q.; Li, H.; Wang, Z.; Law, R. The influence of hotel price on perceived service quality and value in e-tourism: An empirical investigation based on online traveler reviews. J. Hosp. Tour. Res. 2014, 38, 23–39. [Google Scholar] [CrossRef]
- Rodríguez-Díaz, M.; Espino-Rodríguez, T.F. A methodology for a comparative analysis of the lodging tourism destinations based on online customer review. J. Destin. Mark. Manag. 2018, 8, 147–160. [Google Scholar] [CrossRef]
- Torres, E.N. Deconstructing service quality and customer satisfaction: Challenges and directions for future research. J. Hosp. Mark. Manag. 2014, 23, 652–677. [Google Scholar] [CrossRef]
- Oliver, R.L. Satisfaction: A Behavioural Perspective on the Consumer; McGraw-Hill: New York, NY, USA, 1997. [Google Scholar]
- Salminen, J.; Yoganathan, V.; Corporan, J.; Jansen, B.J.; Jung, S.G. Machine learning approach to auto-tagging online content for content marketing efficiency: A comparative analysis between methods and content type. J. Bus. Res. 2019, 101, 203–217. [Google Scholar] [CrossRef]
- Chevalier, J.A.; Mayzlin, D. The effect of word of mouth on sales: Online book reviews. J. Mark. Res. 2006, 43, 345–354. [Google Scholar] [CrossRef] [Green Version]
- Reimer, T.; Benkenstein, M. When good WOM hurts and bad WOM gains: The effect of untrustworthy online reviews. J. Bus. Res. 2016, 69, 5993–6001. [Google Scholar] [CrossRef]
- Park, D.H.; Lee, J.; Han, I. The effect of on-line consumer reviews on consumer purchasing intention: The moderating role of involvement. Int. J. Electron. Commer. 2007, 11, 125–148. [Google Scholar] [CrossRef]
- Plotkina, D.; Munzel, A. Delight the experts, but never dissatisfy your customers! A multi-category study on the effects of online review source on intention to buy a new product. J. Retail. Consum. Serv. 2016, 29, 1–11. [Google Scholar]
- Araque, O.; Corcuera-Platas, I.; Sánchez-Rada, J.F.; Iglesias, C.A. Enhancing deep learning sentiment analysis with ensemble techniques in social applications. Expert Syst. Appl. 2017, 77, 236–246. [Google Scholar] [CrossRef]
- Liu, B. Sentiment Analysis: Mining Opinions, Sentiments, and Emotions; Cambridge University Press: Cambridge, UK, 2015. [Google Scholar]
- Balducci, B.; Marinova, D. Unstructured data in marketing. J. Acad. Mark. Sci. 2018, 46, 557–590. [Google Scholar] [CrossRef]
- Kiritchenko, S.; Zhu, X.; Mohammad, S.M. Sentiment analysis of short informal texts. J. Artif. Intell. Res. 2014, 50, 723–762. [Google Scholar] [CrossRef]
- Pang, B.; Lee, L.; Vaithyanathan, S. Thumbs up? Sentiment classification using machine learning techniques. arXiv 2002, preprint. arXiv:cs/0205070. [Google Scholar]
- Melville, P.; Gryc, W.; Lawrence, R.D. Sentiment analysis of blogs by combining lexical knowledge with text classification. In Proceedings of the 15th ACM SIGKDD International Conference on Knowledge Discovery and Data Mining, Paris, France, 28 June–1 July 2009; pp. 1275–1284. [Google Scholar]
- Wang, S.I.; Manning, C.D. Baselines and bigrams: Simple, good sentiment and topic classification. In Proceedings of the 50th Annual Meeting of the Association for Computational Linguistics, Jeju Island, Korea, 8–14 July 2012; Volume 2, pp. 90–94. [Google Scholar]
- Lucini, F.R.; Tonetto, L.M.; Fogliattp, F.S.; Anzanello, M.J. Text mining approach to explore dimensions of airlines customer satisfaction using online customer reviews. J. Air Transp. Manag. 2020, 83, 101760. [Google Scholar] [CrossRef]
- Alzate, M.; Arce-Urriza, M.; Cebollada, J. Mining the text of online consumer reviews to analyze brand image and brand positioning. J. Retail. Consum. Serv. 2022, 67, 102989. [Google Scholar] [CrossRef]
- Palese, B.; Usai, A. The relative importance of service quality dimensions in E-commerce experiences. Int. J. Inf. Manag. 2018, 40, 132–140. [Google Scholar] [CrossRef]
- González-Rodríguez, M.R.; Martínez-Torres, R.; Toral, S. Post-visit and pre-visit tourist destination image through eWOM sentiment analysis and perceived helpfulness. Int. J. Contemp. Hosp. Manag. 2016, 28, 2609–2627. [Google Scholar] [CrossRef]
- Kwok, L.; Xie, K.L.; Richards, T. Thematic framework of online review research. Int. J. Contemp. Hosp. Manag. 2017, 29, 307–354. [Google Scholar] [CrossRef]
- Nieto-García, M.; Muñoz-Gallego, P.A.; González-Benito, Ó. Tourists’ willingness to pay for an accommodation: The effect of eWOM and internal reference price. Int. J. Hosp. Manag. 2017, 62, 67–77. [Google Scholar] [CrossRef] [Green Version]
- West, P.M.; Broniarczyk, S.M. Integrating multiple opinions: The role of aspiration level on consumer response to critic consensus. J. Consum. Res. 1998, 25, 38–51. [Google Scholar] [CrossRef]
- Rogers Everett, M. Diffusion of Innovations, 5th ed.; Free Press: New York, NY, USA, 2003. [Google Scholar]
- Dolnicar, S.; Grabler, K.; Grün, B.; Kulnig, A. Key drivers of airline loyalty. Tour. Manag. 2011, 32, 1020–1102. [Google Scholar] [CrossRef] [Green Version]
- Calisir, N.; Basak, E.; Calisir, F. Key drivers of passenger loyalty: A case of Frankfurt–Istanbul flights. J. Air Transp. Manag. 2016, 53, 211–217. [Google Scholar] [CrossRef]
- Chow, C.K.W. On-time performance, passenger expectations, and satisfaction in the Chinese airline industry. J. Air Transp. Manag. 2015, 47, 39–47. [Google Scholar] [CrossRef]
- Park, J.W.; Robertson, R.; Wu, C.L. The effect of airline service quality on passengers’ behavioural intentions: A Korean case study. J. Air Transp. Manag. 2004, 10, 435–439. [Google Scholar] [CrossRef]
- Guo, Y.; Barnes, S.J.; Jia, Q. Mining meaning from online ratings and reviews: Tourist satisfaction analysis using latent dirichlet allocation. Tour. Manag. 2017, 59, 467–483. [Google Scholar] [CrossRef] [Green Version]
- Forgas, S.; Moliner, M.A.; Sánchez, J.; Palau, R. Antecedents of airline passenger loyalty: Low-cost versus traditional airlines. J. Air Transp. Manag. 2010, 16, 229–233. [Google Scholar] [CrossRef]
- O’Connell, J.F.; Williams, G. Passengers’ perceptions of low cost airlines and full service carriers: A case study involving Ryanair, Aer Lingus, Air Asia and Malaysia Airlines. J. Air Transp. Manag. 2005, 11, 259–272. [Google Scholar] [CrossRef] [Green Version]
- Truong, D.; Pan, J.Y.; Buaphiban, T. Low cost carriers in Southeast Asia: How does ticket price change the way passengers make their airline selection? J. Air Transp. Manag. 2020, 86, 101836. [Google Scholar] [CrossRef]
- Basuroy, S.; Chatterjee, S.; Ravid, S.A. How critical are critical reviews? The box office effects of film critics, star power, and budgets. J. Mark. 2003, 67, 103–117. [Google Scholar] [CrossRef]
- Hussain, R.; Al Nasser, A.; Hussain, Y.K. Service quality and customer satisfaction of a UAE-based airline: An empirical investigation. J. Air Transp. Manag. 2015, 42, 167–175. [Google Scholar] [CrossRef]
- Tahanisaz, S. Evaluation of passenger satisfaction with service quality: A consecutive method applied to the airline industry. J. Air Transp. Manag. 2020, 83, 101764. [Google Scholar] [CrossRef]
- Sezgen, E.; Mason, K.J.; Mayer, R. Voice of airline passenger: A text mining approach to understand customer satisfaction. J. Air Transp. Manag. 2019, 77, 65–74. [Google Scholar] [CrossRef]
- Bellizzi, M.G.; Eboli, L.; Forciniti, C.; Mazzulla, G. Passengers’ Expectations on Airlines’ Services: Design of a Stated Preference Survey and PreliminaryOutcomes. Sustainability 2020, 12, 4707. [Google Scholar] [CrossRef]
- Farooq, M.S.; Salam, M.; Fayolle, A.; Jaafar, N.; Ayupp, K. Impact of service quality on customer satisfaction in Malaysia airlines: A PLS-SEM approach. J. Air Transp. Manag. 2018, 67, 169–180. [Google Scholar] [CrossRef]
- Park, S.; Lee, J.S.; Nicolau, J.L. Understanding the dynamics of the quality of airline service attributes: Satisfiers and dissatisfiers. Tour. Manag. 2020, 81, 104163. [Google Scholar] [CrossRef]
- Noviantoro, T.; Huang, J.P. Investigating airline passenger satisfaction: Data mining method. Res. Transp. Bus. Manag. 2022, 43, 100726. [Google Scholar] [CrossRef]
- Yoon, M.G.; Lee, H.Y.; Song, Y.S. Linear approximation approach for a stochastic seat allocation problem with cancellation & refund policy in airlines. J. Air Transp. Manag. 2012, 23, 41–46. [Google Scholar]
- Dalalah, D.; Ojiako, U.; Chipulu, M. Voluntary overbooking in commercial airline reservations. J. Air Transp. Manag. 2020, 86, 101835. [Google Scholar] [CrossRef]
- Ma, J.; Tse, Y.K.; Wang, X.; Zhang, M. Examining customer perception and behaviour through social media research–An empirical study of the United Airlines overbooking crisis. Transp. Res. Part E Logist. Transp. Rev. 2019, 127, 192–205. [Google Scholar] [CrossRef]
- Seo, E.J.; Park, J.W. A study on the effects of social media marketing activities on brand equity and customer response in the airline industry. J. Air Transp. Manag. 2018, 66, 36–41. [Google Scholar] [CrossRef]
- Boubker, O.; Naoui, K. Factors affecting airline brand love, passengers’ loyalty, and positive word-of-mouth. A case study of Royal Air Maroc. Case Stud. Transp. Policy 2022, 10, 1388–1400. [Google Scholar] [CrossRef]
- Singh, B. Predicting airline passengers’ loyalty using artificial neural network theory. J. Air Transp. Manag. 2021, 94, 102080. [Google Scholar] [CrossRef]
- Koklic, M.K.; Kukar-Kinney, M.; Vegelj, S. An investigation of customer satisfaction with low-cost and full-service airline companies. J. Bus. Res. 2017, 80, 188–196. [Google Scholar] [CrossRef]
- Sandada, M.; Matibiri, B. An investigation into the impact of service quality frequent flier programs and safety perception on satisfaction and customer loyalty in the airline industry in Southern Africa. South East Eur. J. Econ. Bus. 2016, 11, 41–53. [Google Scholar] [CrossRef] [Green Version]
- Ali, F.; Dey, B.L.; Filieri, R. An assessment of service quality and resulting customer satisfaction in Pakistan International Airlines: Findings from foreigners and overseas Pakistani customers. Int. J. Qual. Reliab. Manag. 2015, 32, 486–502. [Google Scholar] [CrossRef]
- Suki, N.M. Passenger satisfaction with airline service quality in Malaysia: A structural equation modeling approach. Res. Transp. Bus. Manag. 2014, 10, 26–32. [Google Scholar] [CrossRef]
- Gupta, H. Evaluating service quality of airline industry using hybrid best worst method and VIKOR. J. Air Transp. Manag. 2018, 68, 35–47. [Google Scholar] [CrossRef]
- Lee, T.Y.; Bradlow, E.T. Automated marketing research using online customer reviews. J. Mark. Res. 2011, 48, 881–894. [Google Scholar] [CrossRef]
- Anderson, M.; Magruder, J. Learning from the crowd: Regression discontinuity estimates of the effects of an online review database. Econ. J. 2012, 122, 957–989. [Google Scholar] [CrossRef]
- Wang, H.; Lu, Y.; Zhai, C. Latent aspect rating analysis on review text data: A rating regression approach. In Proceedings of the 16th ACM SIGKDD International Conference on Knowledge Discovery and Data Mining, Washington, DC, USA, 24–28 July 2010; pp. 783–792. [Google Scholar]
- Büschken, J.; Allenby, G.M. Sentence-based text analysis for customer reviews. Mark. Sci. 2016, 35, 953–975. [Google Scholar] [CrossRef] [Green Version]
- Zhang, Z.; Zhang, Z.; Law, R. Positive and negative word of mouth about restaurants: Exploring the asymmetric impact of the performance of attributes. Asia Pac. J. Tour. Res. 2014, 19, 162–180. [Google Scholar] [CrossRef]
- Lerman, K.; Blair-Goldensohn, S.; McDonald, R. Sentiment summarization: Evaluating and learning user preferences. In Proceedings of the 12th Conference of the European Chapter of the ACL (EACL 2009), Athens, Greece, 30 March–3 April 2009; pp. 514–522. [Google Scholar]
- Ganu, G.; Elhadad, N.; Marian, A. Beyond the stars: Improving rating predictions using review text content. In Proceedings of the WebDB 2009, Providence, RI, USA, 28 June 2009; Volume 9, pp. 1–6. [Google Scholar]
- Liu, X.; Singh, P.V.; Srinivasan, K. A structured analysis of unstructured big data by leveraging cloud computing. Mark. Sci. 2016, 35, 363–388. [Google Scholar] [CrossRef]
- Titov, I.; McDonald, R. A joint model of text and aspect ratings for sentiment summarization. In Proceedings of the ACL-08: HLT, Columbus, OH, USA, 20 June 2008; pp. 308–316. [Google Scholar]
- Dun, Y.; Wang, N.; Wang, M.; Hao, T. Revealing learner inter ests through topic mining from question-answering data. Int. J. Distance Educ. Technol. (IJDET) 2017, 15, 18–32. [Google Scholar] [CrossRef]
- Insua Yañez, A. Sistema Deep Learning para el Análisis de Sentimientos en Opiniones de Productos para la Ordenación de Resultados de un Buscador Semántico; Universidad de La Coruña: A Coruña, Spain, 2019. [Google Scholar]
- McCallum, A.; Nigam, K. A comparison of event models for naive bayes text classification. In Proceedings of the AAAI-98 Workshop on Learning for Text Categorization, Menlo Park, CA, USA, 27 July 1998; Volume 752, pp. 41–48. [Google Scholar]
- Yang, Y.; Liu, X. A re-examination of text categorization methods. In Proceedings of the 22nd Annual International ACM SIGIR Conference on Research and Development in Information Retrieval, Berkeley, CA, USA, 15–19 August 1999; pp. 42–49. [Google Scholar]
- Berger, A.; Della Pietra, S.A.; Della Pietra, V.J. A maximum entropy approach to natural language processing. Comput. Linguist. 1996, 22, 39–71. [Google Scholar]
- Freund, Y.; Schapire, R.E. A decision-theoretic generalization of on-line learning and an application to boosting. J. Comput. Syst. Sci. 1995, 55, 119–139. [Google Scholar] [CrossRef] [Green Version]
- Quinlan, J. C4.5: Programs for Machine Learning; Morgan Kaufmann Publisher: San Mateo, CA, USA, 1993. [Google Scholar]
- Zhang, T. Regularized winnow methods. In Advances in Neural Information Processing Systems; 2000; pp. 703–709. Available online: https://proceedings.neurips.cc/paper/2000/file/9a1de01f893e0d2551ecbb7ce4dc963e-Paper.pdf (accessed on 24 June 2022).
- Joachims, T. Text categorization with support vector machines: Learning with many relevant features. In Proceedings of the European Conference on Machine Learning, Chemnitz, Germany, 21–23 April 1998; Springer: Berlin/Heidelberg, Germany, 1998; pp. 137–142. [Google Scholar]
- Liu, B.; Li, X.; Lee, W.S.; Yu, P.S. Text classification by labeling words. In Proceedings of the 19th National Conference on Artifical Intelligence, San Jose, CA, USA, 25–29 July 2004; Volume 4, pp. 425–430. [Google Scholar]
- Xia, R.; Zong, C.; Li, S. Ensemble of feature sets and classification algorithms for sentiment classification. Inf. Sci. 2011, 181, 1138–1152. [Google Scholar] [CrossRef]
- Levy, O.; Goldberg, Y. Dependency-based word embeddings. In Proceedings of the 52nd Annual Meeting of the Association for Computational Linguistics, Baltimore, MD, USA, 22–27 June 2014; Volume 2, pp. 302–308. [Google Scholar]
- Kusner, M.; Sun, Y.; Kolkin, N.; Weinberger, K. From word embeddings to document distances. In Proceedings of the International Conference on Machine Learning, Lille, France, 6–11 July 2015; pp. 957–966. [Google Scholar]
- Chang, Y.C.; Ku, C.H.; Le Nguyen, D.D. Predicting aspect-based sentiment using deep learning and information visualization: The impact of COVID-19 on the airline industry. Inf. Manag. 2022, 59, 103587. [Google Scholar] [CrossRef]
- Dhar, S.; Bose, I. Walking on air or hopping mad? Understanding the impact of emotions, sentiments and reactions on ratings in online customer reviews of mobile apps. Decis. Support Syst. 2022, 113769. [Google Scholar] [CrossRef]
- Stamolampros, P.; Dousios, D.; Korfiatis, N. Evaluating domestic bias on airline passengers’ ratings: The moderating effect of cultural value orientation. Int. J. Hosp. Manag. 2020, 87, 102466. [Google Scholar] [CrossRef]
- Song, C.; Guo, J.; Zhuang, J. Analyzing passengers’ emotions following flight delays-a 2011–2019 case study on SKYTRAX comments. J. Air Transp. Manag. 2020, 89, 101903. [Google Scholar] [CrossRef]
- Sharma, A.; Park, S.; Nicolau, J.L. Testing loss aversion and diminishing sensitivity in review sentiment. Tour. Manag. 2020, 77, 104020. [Google Scholar] [CrossRef]
- Tsai, C.F.; Chen, K.; Hu, Y.H.; Chen, W.K. Improving text summarization of online hotel reviews with review helpfulness and sentiment. Tour. Manag. 2020, 80, 104122. [Google Scholar] [CrossRef]
- Korfiatis, N.; Stamolampros, P.; Kourouthanassis, P.; Sagiadinos, V. Measuring service quality from unstructured data: A topic modeling application on airline passengers’ online reviews. Expert Syst. Appl. 2019, 116, 472–486. [Google Scholar] [CrossRef] [Green Version]
- Punel, A.; Hassan, L.A.H.; Ermagun, A. Variations in airline passenger expectation of service quality across the globe. Tour. Manag. 2019, 75, 491–508. [Google Scholar] [CrossRef]
- Siering, M.; Deokar, A.V.; Janze, C. Disentangling consumer recommendations: Explaining and predicting airline recommendations based on online reviews. Decis. Support Syst. 2018, 107, 52–63. [Google Scholar] [CrossRef]
- Feldman, R.; Sanger, J. The text Mining Handbook: Advanced Approaches in Analyzing Unstructured Data; Cambridge University Press: Cambridge, UK, 2007. [Google Scholar]
- Ruiz de Villa, G. Introducción a Word2vec (Skip Gram Model). 2018. Available online: https://medium.com/@gruizdevilla/introducci%C3%B3n-a-word2vec-skip-gram-model-4800f72c871f (accessed on 24 June 2022).
- Masorgo, N.; Mir, S.; Hofer, A.R. Expectations vs Experience: Managing the Adverse Effects of Service Failures on Customer Satisfaction in the Airline Industry. Transp. J. 2022, 61, 231–262. [Google Scholar] [CrossRef]
- Punel, A.; Ermagun, A. Using Twitter network to detect market segments in the airline industry. J. Air Transp. Manag. 2018, 73, 67–76. [Google Scholar] [CrossRef]
| Cluster | Rating | Total | |||||
|---|---|---|---|---|---|---|---|
| 1 | 2 | 3 | 4 | 5 | |||
| 1 | Frequency | 15 | 30 | 61 | 239 | 253 | 598 |
| % File | 2.5% | 5.0% | 10.2% | 40.0% | 42.3% | 100.0% | |
| 2 | Frequency | 15 | 37 | 77 | 308 | 163 | 600 |
| % File | 2.5% | 6.2% | 12.8% | 51.3% | 27.2% | 100.0% | |
| 3 | Frequency | 40 | 34 | 40 | 11 | 4 | 129 |
| % File | 31.0% | 26.4% | 31.0% | 8.5% | 3.1% | 100.0% | |
| 4 | Frequency | 30 | 41 | 137 | 244 | 165 | 617 |
| % File | 4.9% | 6.6% | 22.2% | 39.5% | 26.7% | 100.0% | |
| 5 | Frequency | 412 | 374 | 851 | 1096 | 601 | 3334 |
| % File | 12.4% | 11.2% | 25.5% | 32.9% | 18.0% | 100.0% | |
| Total | Total | 512 | 516 | 1166 | 1898 | 1186 | 5278 |
| % Total file | 9.7% | 9.8% | 22.1% | 36.0% | 22.5% | 100.0% | |
| IBERIA | Group1 (The quality of service–inflight experience) In general, there is an excellence satisfaction level with Iberia’ services in the reviews, however the company needs to redouble its efforts to improve the in-flight entertainment experience for passengers. Group2 (The quality of service–flight punctuality) Iberia accomplished good results when it comes to punctuality of flight Group3 (Comfort of seats) The key labels are (worse and space). Managers have to pay more attention to passenger seat space, design and comfort in order to reduce customer dissatisfaction on the mentioned topic Group4 (Flight problems: delays, cancellations, reschedule, and overbooking) Passenger satisfaction with Iberia’ service is at a good level, but the negative reviews are about delay. It is recommended that managers take decisions regarding the time of procedures such as check-in before flight. Group5 (The quality of service, check-in and boarding, baggage delivering, personnel service) Most of the negative reviews are about bad quality of service, delays to check-in baggage, and the attitude of the crew staff, which should be re-evaluated. Managers can identify the cause of passenger dissatisfaction with Iberia staff service and training new customer communication to meet up with their needs before and during the flight (check-in, boarding and handling service). |
Publisher’s Note: MDPI stays neutral with regard to jurisdictional claims in published maps and institutional affiliations. |
© 2022 by the authors. Licensee MDPI, Basel, Switzerland. This article is an open access article distributed under the terms and conditions of the Creative Commons Attribution (CC BY) license (https://creativecommons.org/licenses/by/4.0/).
Share and Cite
Zaki Ahmed, A.; Rodríguez Díaz, M. A Methodology for Machine-Learning Content Analysis to Define the Key Labels in the Titles of Online Customer Reviews with the Rating Evaluation. Sustainability 2022, 14, 9183. https://doi.org/10.3390/su14159183
Zaki Ahmed A, Rodríguez Díaz M. A Methodology for Machine-Learning Content Analysis to Define the Key Labels in the Titles of Online Customer Reviews with the Rating Evaluation. Sustainability. 2022; 14(15):9183. https://doi.org/10.3390/su14159183
Chicago/Turabian StyleZaki Ahmed, Ayat, and Manuel Rodríguez Díaz. 2022. "A Methodology for Machine-Learning Content Analysis to Define the Key Labels in the Titles of Online Customer Reviews with the Rating Evaluation" Sustainability 14, no. 15: 9183. https://doi.org/10.3390/su14159183
APA StyleZaki Ahmed, A., & Rodríguez Díaz, M. (2022). A Methodology for Machine-Learning Content Analysis to Define the Key Labels in the Titles of Online Customer Reviews with the Rating Evaluation. Sustainability, 14(15), 9183. https://doi.org/10.3390/su14159183