Article

Mechanistic Study of Porosity Formation in Liquid-Assisted Mechanochemical Synthesis of Metal-Organic Framework Cu3(BTC)2 for Adsorption-Based Applications

Department of Chemistry, Widener University, One University Place, Chester, PA 19013, USA
*
Author to whom correspondence should be addressed.
Sustainability 2022, 14(15), 9150; https://doi.org/10.3390/su14159150
Submission received: 30 June 2022 / Revised: 21 July 2022 / Accepted: 22 July 2022 / Published: 26 July 2022
(This article belongs to the Section Sustainable Chemical Engineering and Technology)

Abstract

:
The mechanochemical synthesis of metal-organic framework Cu3(BTC)2 was conducted with various amounts of water–ethanol liquid added prior to grinding. Using the XRD, SEM and N2 sorption results, an attempt was made to explain the mechanisms by which liquid may affect the formation of Cu3(BTC)2 and its porosity in the grinding process. The experimental results show that microporosity is controlled by the degree of crystallinity of Cu3(BTC)2 structures. Within the range of liquid-assisted grinding (LAG), it is found that an increase in the amount of liquid in grinding leads to a larger microporosity in Cu3(BTC)2. The formation of mesoporosity and macroporosity is determined by two competing events in LAG: particle breakage and its agglomeration. When the addition of liquid leads to particle breakage over its agglomeration as the dominant event in LAG, it results in smaller Cu3(BTC)2 particles, and the network space of these particles constitutes mesoporosity and macroporosity. When the addition of liquid gives rise to particle agglomeration as the dominant event, however, most of this network space collapses so that mesoporosity and macroporosity in the Cu3(BTC)2 samples diminish significantly.

1. Introduction

Metal-organic frameworks (MOFs) are a new class of porous architectures. In recent years, MOFs have emerged as one type of the most promising materials for adsorption-based applications, such as gas storage and wastewater treatment, thanks to their diverse pore structures and large surface areas [1,2,3]. Most MOFs are conventionally synthesized by using a solvothermal method. This method, however, is neither time- nor energy-efficient as it typically needs many hours or even days for the reaction to complete, during which process heat must be constantly introduced until the end of the reaction. Moreover, the solvothermal method raises environmental concerns since it often involves the use of an organic solvent in large amounts, which could be environmentally problematic. Therefore, it is desirable to find a more efficient and environmentally friendlier method to synthesize MOFs.
The mechanochemical synthesis of MOFs has recently drawn much attention, since it not only involves a shorter reaction time but also avoids the use of a large amount of solvent [4,5,6,7]. As a result, it offers promising solutions to several disadvantages that are associated with the solvothermal method, as mentioned above. Cu3(BTC)2 [8,9,10], MILs [11,12,13,14] and ZIFs [15,16,17] are among the groups of MOFs that have been successfully prepared by using this approach.
It is a well-known fact of MOF-formation reactions that synthetic conditions of all types of methods greatly influence the final products. In some cases, a small change in those conditions may result in the formation of MOFs with different structures and thus different properties. It is, therefore, essential that synthetic conditions for a given MOF be optimized in order to achieve its desirable properties. For example, Chui et al. [18] first reported the synthesis of Cu3(BTC)2 (named HKUST-1) by a solvothermal method at 180 °C, but the products presented a low BET surface area of 692 m2/g due to the formation of a significant amount of CuO that was caused by the high reaction temperature. Subsequent reports from various studies [19,20] show that a lower reaction temperature, along with other improved synthetic conditions, could lead to higher purity and greater surface areas of the reaction products. In terms of the mechanochemical synthesis of Cu3(BTC)2, a quantitative yield of this MOF was successfully reported at first with neat grinding (NG) [21]. It was thereafter found that liquid-assisted grinding (LAG), in which there is the presence of a small amount of liquid, either internal or external, in grinding, could greatly enhance the reaction rate as well as the crystallinity of the products [8,9,10,22]. As a result, LAG leads to a higher yield and larger surface areas of Cu3(BTC)2, which in turn improves its adsorption-related properties, e.g., H2, CO2 gas storage [8,23], removal of heavy metal ions from wastewater [24] and drug delivery [25]. Similar results were also reported for the mechanochemical synthesis of other MOFs [12,15,26]. In many of those studies, tedious trial-and-error work had been performed to optimize the synthetic conditions, whereby an attempt was made to produce the target MOF. Understanding the mechanisms by which the key synthetic parameters affect the formation of MOFs is a challenging but critical issue because gaining such insight would facilitate the synthesis of MOFs of various interests. For mechanochemical synthesis, however, there are currently only a few systematic investigations into this area. For LAG in particular, so far, there have been a very limited number of studies to address the questions of how and why the liquid additive affects the synthesis products [22,26,27,28,29]. Furthermore, their results are not conclusive, and therefore, further investigation is still warranted.
In a previous study [8], we determined the effects of certain synthetic parameters, namely the nature of the starting materials and the presence of liquid and grinding time, on the mechanochemical synthesis of Cu3(BTC)2. The results demonstrate that the presence of an internal liquid in reactants (water of hydration) or the addition of an external liquid prior to grinding could lead to increased surface areas (739 m2/g, BET) and larger hydrogen adsorption (1.31 wt.%, at 1 bar and −196 °C) of Cu3(BTC)2 than those without any liquid involved in grinding (21 m2/g and 0.06 wt.%, respectively). In this paper, an extended study was conducted to examine the roles that external liquid plays in the mechanochemical synthesis of Cu3(BTC)2, with a particular focus on the amount of liquid added prior to grinding. More importantly, efforts were made to provide an understanding of the mechanisms by which such factors may affect the formation of Cu3(BTC)2 and its porosity. Based on these findings, we demonstrated that a practical strategy for LAG could be established to synthesize Cu3(BTC)2 with a desirable porosity for adsorption-based applications, such as H2 storage.

2. Materials and Methods

2.1. Synthesis Procedures

Anhydrous copper(II) acetate, Cu(OAc)2 (98%) and 1,3,5-benzenetricarboxylic acid, H3BTC (95%) were obtained from Sigma Aldrich and used as precursor materials without further purification. SPEX 8000 M Mixer Mill (SPEX SamplePrep LLC, Metuchen, NJ, USA) was employed to carry out the mechanochemical synthesis of Cu3(BTC)2. In a typical synthesis routine, adapted from our previous study [8], 6.0 mmol of Cu(OAc)2 (1.090 g) and 4.0 mmol of H3BTC (0.840 g) were weighed and filled in a 25 mL stainless steel vial and then ground for 10 min. The ball to powder ratio was set at 10:1. Prior to grinding, a pre-set amount of ethanol (EtOH, ≥99.5%) and deionized water (H2O) mixture with a 1:1 volume ratio was added. The as-synthesized samples were dried in the air overnight and then stored for further tests.

2.2. Characterization Methods

The powder X-ray diffraction patterns were collected with a Panalytical X’Pert Pro MPD Analytical X-ray Diffractometer (Model PW3040 Pro; Malvern Panalytical Ltd., Malvern, UK) using copper Kα radiation. The Micromeritics ASAP 2020 (Micromeritics, Norcross, GA, USA) was used to measure the nitrogen adsorption/desorption isotherms of the samples at a liquid nitrogen temperature (−196 °C), from which the specific surface areas and the pore volumes of the samples were calculated. Prior to the measurement, the samples were degassed under vacuum at 200 °C for 12 h. Multipoint BET calculations were performed at a relative pressure P/P0 in the range of 0.05–0.30. The total pore volume and micropore volume were derived from the N2 adsorption isotherms at P/P0 = 0.99 and P/P0 = 0.40, respectively. The H2 adsorption capacity was measured at −196 °C up to 850 mmHg (~1.13 bar) by using the Micromeritics ASAP 2020 (Micromeritics, Norcross, GA, USA). The scanning electron microscopy (SEM) images were collected from a Hitachi S4500 field emission microscope at 5 kV (Hitachi High Technologies America Inc., Schaumburg, IL, USA).

3. Results and Discussion

3.1. XRD Analysis

In an attempt to understand how the amount of the external liquid affects the mechanochemical synthesis of Cu3(BTC)2, a mixture of ethanol and deionized water, ranging from 0 μL to 1500 μL, was added to the solid reactants prior to being ground for 10 min. To compare with similar studies [9,20,22], the ratio of the liquid volume to the mass of the reactants, as defined by η [27], was calculated and varied from 0 μL/mg to 0.777 μL/mg in the current study, as shown in Table 1. Anhydrous Cu(OAc)2 rather than hydrated Cu(OAc)2⋅H2O, which is commonly used as the metal salt in most of the published studies, was chosen in order to exclude the influence of internal liquid—water from hydration on the reaction products.
Figure 1 includes the XRD patterns for the initial reactants and the final products with various amounts of liquid (the liquid is always referred to as the external one from this point, unless noted otherwise). For the sample without any liquid added (NG), its XRD pattern (labeled as “None”) shows very broad peaks, indicating that the products after the NG process are mainly amorphous phases. Based on the locations of the characteristic peaks in the XRD patterns, coupled with the FT-IR results from our previous study [8], it can be confirmed that the products in this sample contain Cu3(BTC)2, though they have a low degree of crystallinity. Unreacted H3BTC also likely exists in this sample after grinding because the peak at 2θ = 24.6° in its XRD pattern overlaps with the strongest peak of H3BTC near this location, indicative of the aforementioned possibility. As shown by the other XRD patterns in Figure 1, the samples with liquid added prior to grinding (LAG) have much more defined and narrower peaks, which is a clear indication of a much higher degree of crystallinity. The three pronounced peaks located at 2θ = 11.9°, 13.8° and 19.4° in these XRD patterns are consistent with those reported for Cu3(BTC)2 [9,10,18], which confirms the successful formation of crystalline Cu3(BTC)2 by LAG. It is also noted that among all the samples being studied, the one with 1000 μL of liquid shows the highest intensity for the strongest peak at 2θ = 11.9°. A quantitative analysis of the full width at half maximum (FWHM) of this characteristic peak was conducted for all the LAG samples to estimate their crystallite size using the Scherrer equation based on Bragg’s law. The corresponding results in Table 1 illustrate the continuous improvement in the crystallinity of the products when the amount of added liquid increases. The crystallite size of the sample prepared with 50 μL of liquid, for instance, is about 20 nm. It then reaches 34 nm and 38 nm when 400 μL and 1000 μL of liquid are added, respectively. However, the sample prepared with 1500 μL of liquid shows a somewhat decreased crystallite size of 30 nm. It is also noteworthy that the samples with 800 μL and 1000 μL of liquid display a close similarity in their microstructure and textural properties, as shown in Figures S1 and S2. Therefore, only the latter is detailed in this paper.
In general, the successful synthesis of MOFs, such as Cu3(BTC)2, involves three elementary steps occurring in parallel and/or in series: (i) the deprotonation of ligands and dissociation of metal salts, (ii) the assembling of metal clusters, and (iii) the complexation of metal ions/clusters by the ligands to assemble a coordination motif, often referred to as secondary building unit (SBU). In the case of Cu3(BTC)2, a paddlewheel-shaped SBU is built up of four benzene-1,3,5-tricarboxylate linkers coordinated with two copper metal centers. As explained in our previous study [8], copper (II) acetate or its monohydrate is often preferred over other copper salts in the mechanochemical synthesis of Cu3(BTC)2. This is because of the fact that copper (II) acetate already adapts to a paddlewheel structure and, therefore, is thermodynamically favored to form Cu3(BTC)2 over other copper salts. After the secondary building units are formed in the reaction, the MOFs will then be constructed by repeating such units in three dimensions to form crystalline structures with pores dispersed in between.
The above-mentioned XRD results of Cu3(BTC)2 show that the addition of a liquid prior to grinding facilitates the formation of crystalline Cu3(BTC)2 during the mechanochemical synthesis. This could be explained by examining how those elementary steps of the reaction are affected when liquid is added. From a thermodynamic point of view, the presence of liquid facilitates the deprotonation of H3BTC ligands and dissociation of Cu(OAc)2 salts by solvation since such processes are much more thermodynamically favored to occur in the quasi-liquid state of reactants over their solid-state. The liquid serves as a reservoir for the deprotonated anionic ligands and cationic metal ions. It is also noted that, based on their solubilities, Cu(OAc)2 and H3BTC are both saturated with the liquid added to each sample of this study. Therefore, the complexation of Cu3(BTC)2 SBU and eventually the formation of three-dimensional crystalline structures are also thermodynamically favored under such conditions where the MOF-forming components are saturated. From a kinetic point of view, the presence of liquid enhances the mobilities of these MOF-forming components and consequently improves the reaction rate as well as the crystallinity of Cu3(BTC)2. Such thermodynamical and kinetic interpretations are consistent with what we observed from the XRD results. As shown in Figure 1, the NG sample has an incomplete formation of Cu3(BTC)2 after 10 min of grinding, while all the LAG samples have the opposite results. Moreover, the former is amorphous, indicating that only a short range of repeating SBUs exists in the sample. On the other hand, the latter are all well-defined crystalline structures, and their crystallite size increases from 20 nm (50 μL is added) to 38 nm (1000 μL is added) as a result of the thermodynamically and kinetically favored conditions for LAG vs. NG. Notably, the sample with 1500 μL of liquid shows a decrease in the crystallite size. It was observed that this sample appeared as a slurry after grinding, while all the other samples remained powdery. This may indicate the possibility of a different reaction pathway than LAG under this particular condition.

3.2. SEM Analysis

The SEM images were collected to further analyze the effect of the amount of liquid on the morphology of as-synthesized Cu3(BTC)2. Figure 2 includes a group of such images for the samples with 0, 400 and 1000 μL of liquid added prior to grinding. Under low magnification, as shown in Figure 2a,c,e, all three samples contain agglomerates. The occurrence of agglomerates is common in ground samples, which experience ball/powder collision, repeated deformation, and fracture and, therefore, contain many fresh surfaces. As a result, ground samples tend to agglomerate.
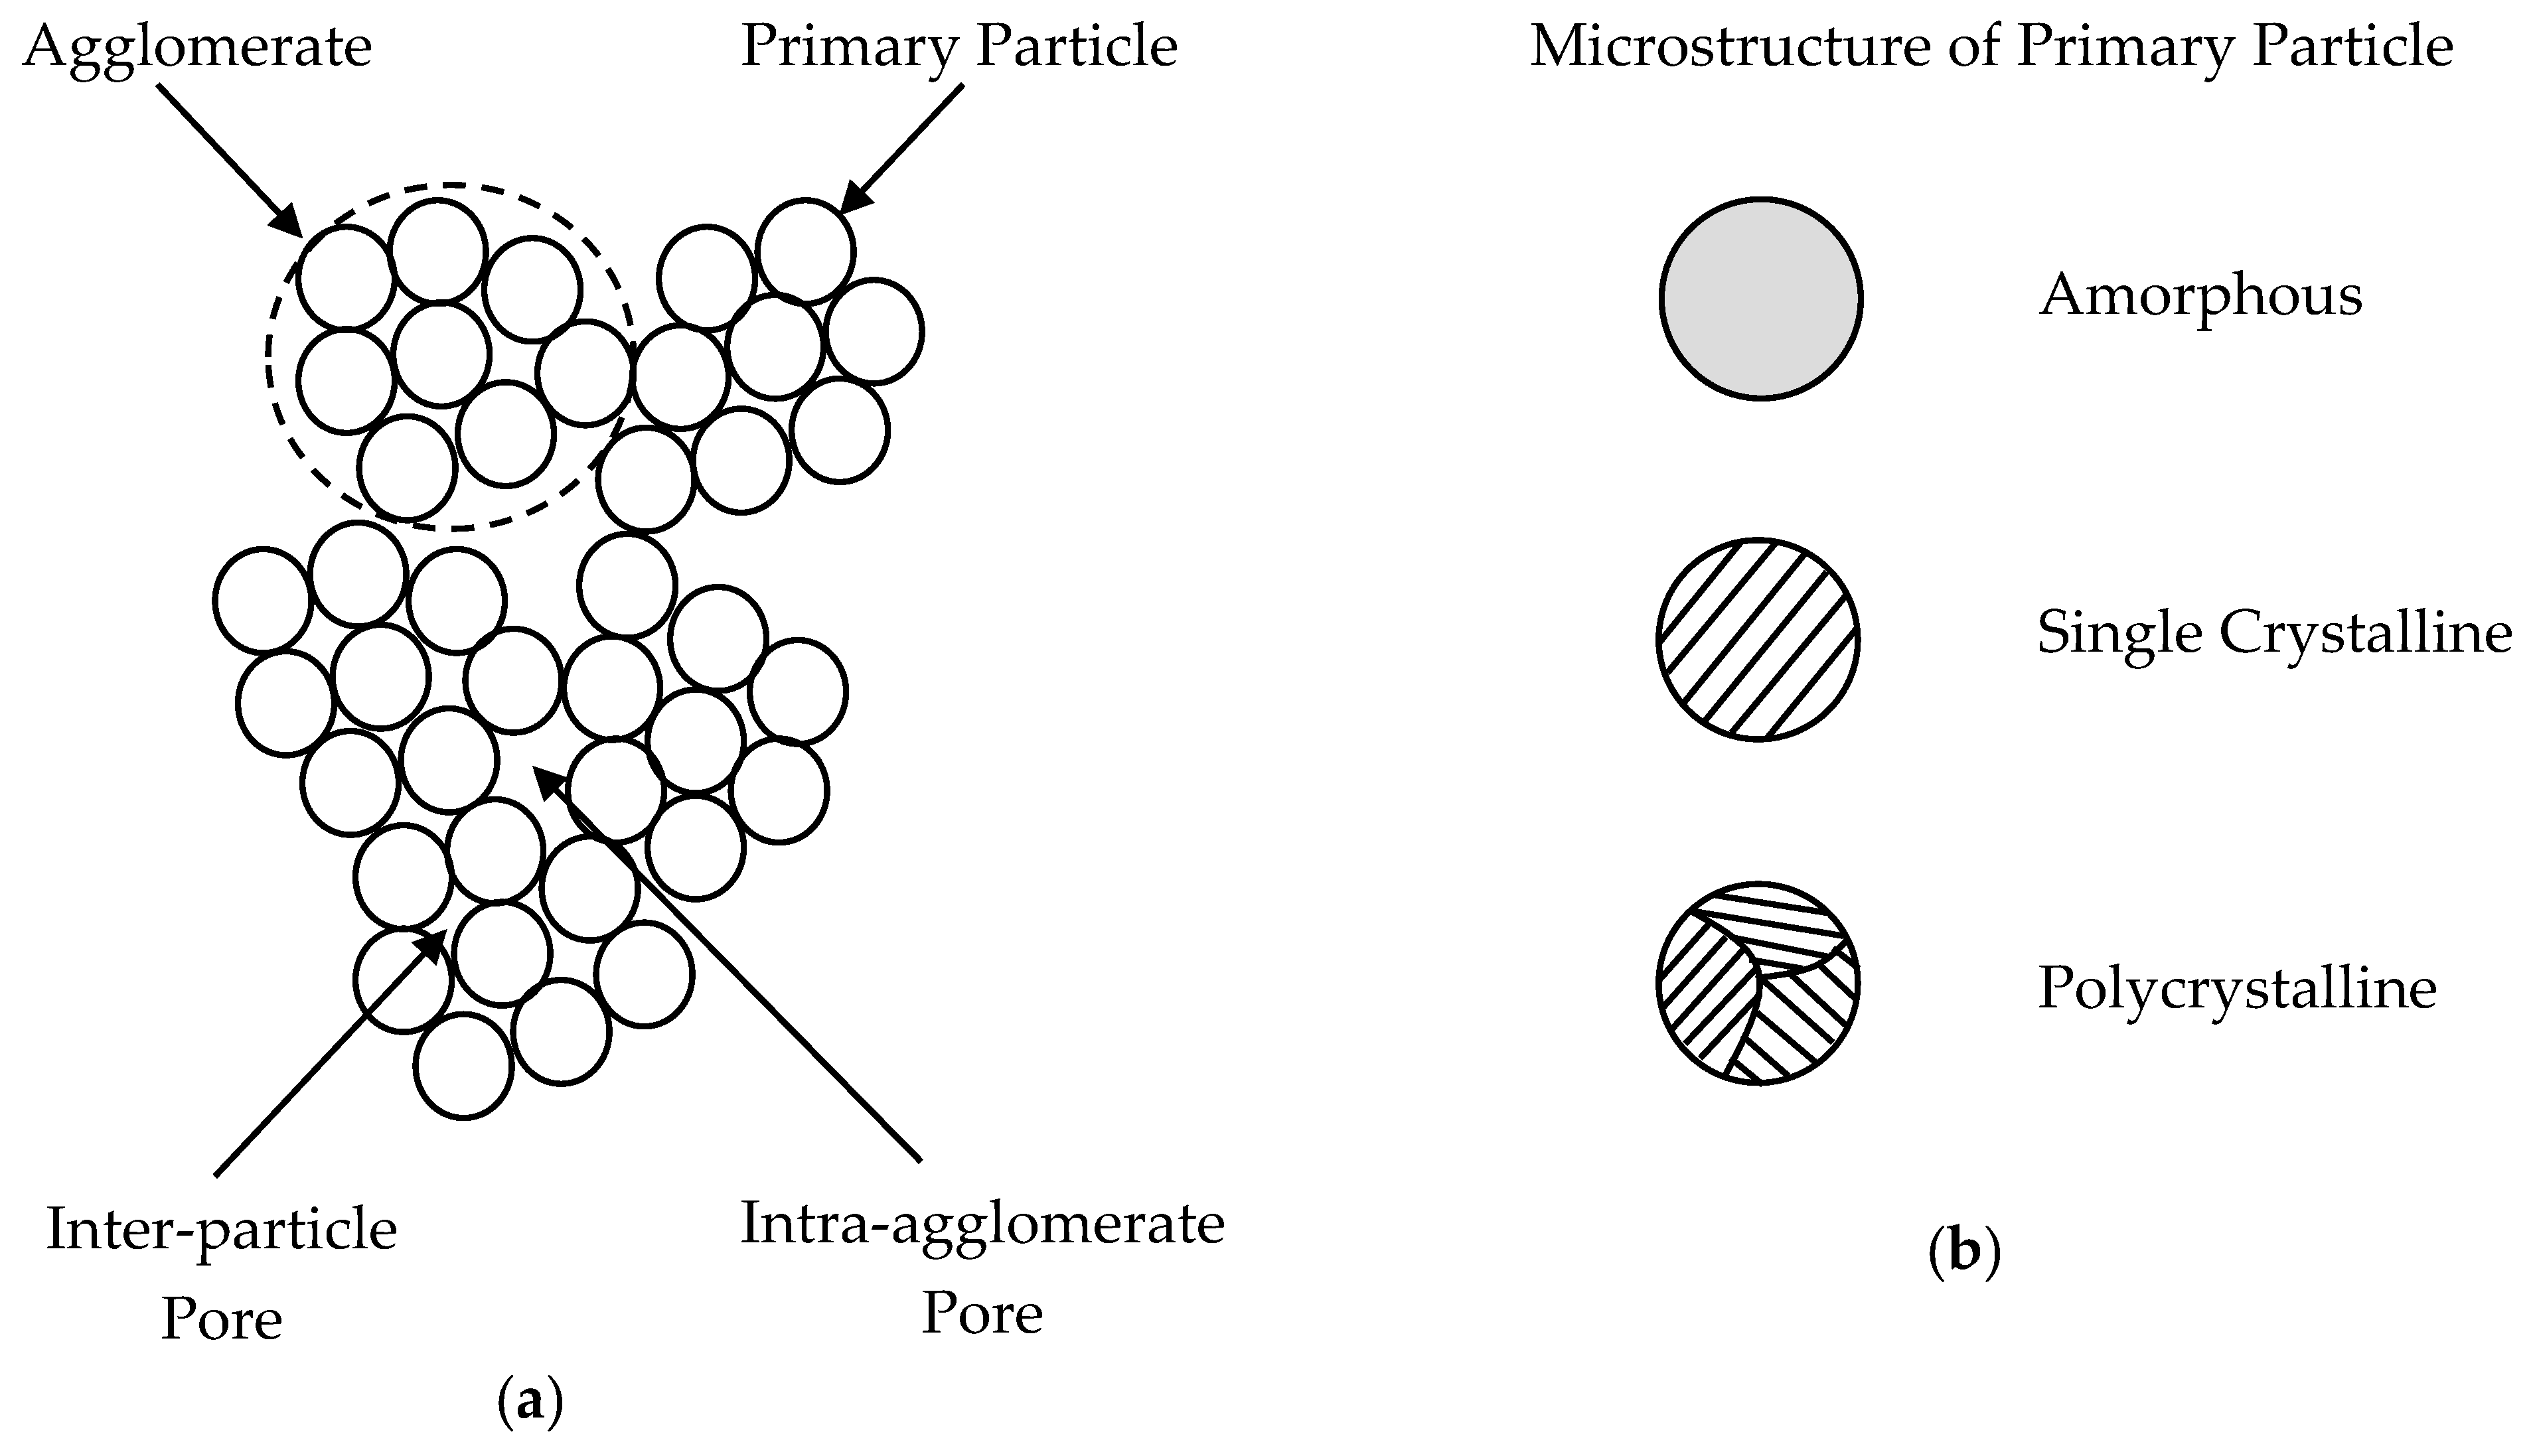
In mechanochemistry, agglomerates are often called secondary particles [30], as they are agglomerated from smaller primary particles, as illustrated by a schematic diagram in Figure 3. In most cases, the primary particles are either a single crystal or polycrystal in nature. The average size of the crystallites in these particles can be estimated by the Scherrer equation based on the XRD results, as discussed earlier. The term of “particle” is referred to as the counting units of the samples rather than their morphology since mechanochemical synthesis does not lead to powder samples, the shape of which is as well-defined as a solvothermal one.
Figure 2b,d,f show the more detailed morphology of the primary particles for the three aforementioned samples. The NG sample (Figure 2b) is characterized by many flake-like primary particles in the agglomerates. This suggests repeated deformation caused by ball/powder collision during grinding. When 400 μL of liquid is added to the sample, the majority of the resultant primary particles adopt whisker-like shapes, as shown in Figure 2d. They are estimated to be a few hundred nanometers in diameter and are the finest among these three samples. When 1000 μL of liquid is present, rod-like primary particles are dominant in the agglomerates, as shown in Figure 2f. The cross-sectional areas of these rods are approximately 1 μm in diameter, which are much larger than those seen in the sample synthesized with 400 μL of liquid.
It is known that the size of the particles resulting from the grinding process is mainly determined by two competing events: particle breakage and agglomeration of the newly created particle fragments [31]. Such an observation also applies to mechanochemical synthesis, where the grinding process leads not only to the pulverization of raw reactant materials, but also to the induction of chemical reactions between raw materials. The addition of a liquid to the reactants prior to grinding plays an important role in affecting the dominance level between these two competing events. When such an amount of liquid is added that particle breakage is dominant, it can result in a low degree of agglomeration in the products and, therefore, smaller primary particles. This is mainly because of the following: (i) the liquid phase wets particles and thus separates them from each other to suppress agglomeration, which then enhances particle breakage; (ii) the liquid phase also acts as a mechanical impact sink [32], which absorbs the mechanical energy caused by the ball/powder collision and, in turn, lowers the local temperature of the particles. A lower temperature alleviates the tendency of agglomeration. This is why, when these impacts are prominent in grinding, particle breakage tends to be dominant over the agglomeration. Such a scenario can be applied to explain the sample with 400 μL of liquid, which contains smaller particles in comparison to the one without any liquid involved.
As the amount of added liquid increases beyond 400 μL and reaches 1000 μL, however, the results show that the dominance between those two events reversed as the agglomeration becomes dominant. It is believed that there are two main reasons for what caused such a change: (i) With more liquid added, the ball/powder collision continues to be further alleviated so that the mechanical impact may not be strong enough to break the agglomerated particles as frequently as is the case with a smaller amount of added liquid. (ii) In the discussion of XRD results, it was found that the crystallite size of the sample with 1000 μL of liquid was larger when compared to the one with 400 μL. This is attributed to the continuous enhancement in the mobilities of the MOF-forming components and the rate of mass transfer among those components as more liquid is added to the samples. Such enhancement occurs not only inside the primary particles, but also across the primary particles. The former mainly contributes to crystallite growth, while the latter contributes to the agglomeration of the primary particles. As a result of these combined impacts, the agglomeration of particles is believed to be favored over particle breakage under such conditions, as is seen in the sample with 1000 μL of liquid.

3.3. N2 Adsorption/Desorption Analysis

As shown in Figure 4, the N2 adsorption/desorption isotherms were collected at −196 °C to examine the surface areas and porous properties of the Cu3(BTC)2 samples. These isotherms can be categorized into three distinct groups. The first one, including the NG sample, shows little adsorption until the relative pressure P/P0 is close to 1, where a small rise is observed. This indicates there are no micropores (pore diameter < 2 nm) in this sample, except for a small amount of larger pores, such as mesopores (2–50 nm) or macropores (>50 nm). The second group of isotherms includes the samples with 50, 200 or 400 μL of liquid, respectively. Each of these samples exhibits a superimposition of multiple types of physisorption isotherms classified by IUPAC [33]. For example, the initial part of the adsorption curve of these samples shows the characteristics of a Type-I isotherm, where a steep uptake in adsorption occurs at a very low P/P0, and then a plateau follows. Based on the IUPAC classification, this is clearly indicative of the presence of microporosity because narrow space, such as micropores, enhances the adsorbent–adsorptive (MOFs-N2) interactions, thus enabling the filling of micropores at a very low P/P0. The ending part of these adsorption isotherms does not remain flat, but instead shows a notable jump, deviating from the behaviors normally expected of the Type-I isotherm but resembling what is common for a Type-III isotherm. Such a deviation suggests the presence of mesoporosity and/or macroporosity in these samples. Furthermore, the desorption part of these curves is characteristic of a Type-IV isotherm with a pronounced H2-type hysteresis loop, which is clearly attributed to meso/macro pore blocking or cativation. The third group of isotherms, including the samples with 1000 or 1500 μL of liquid, are very similar to how a Type-I isotherm behaves. In these curves, the rise at a high P/P0 is much smaller than in others. However, more importantly, the H2 hysteresis loop is barely seen in these isotherms, indicating little mesoporosity and macroporosity in such samples.
To quantify the observations from N2 isotherms, several porosity-related calculations were performed. Using the multipoint BET model, the specific surface areas (SSA) of these samples were determined, and the results are shown in Figure 5a. Because of the fact that the BET model is built on the assumption of monolayer-multiplayer adsorption at a low P/P0 and also that micropore filling occurs exclusively at this range of relative pressures, the BET results can be regarded as a useful fingerprint for microporosity in the samples. It can be seen that the BET surface areas are very low when no liquid is added to the sample prior to grinding, whereas they are significantly improved when liquid is added. These BET values continue to increase from 315 m2/g to 851 m2/g when the amount of liquid changes from 50 μL to 1000 μL; however, they are followed by a drop to 621 m2/g when 1500 μL of liquid is present. The same trend can therefore be predicted for the microporosity in these samples because of the correlation between the BET surface areas and microporosity. The corresponding results are summarized in Table 1.
In addition to the specific surface areas, the pore volumes were also calculated using the N2 adsorption isotherms. The total pore volume was determined from the N2 adsorption isotherms at P/P0 = 0.99, while the micropore volume was determined at P/P0 = 0.40, where the pressure was low so that the adsorption in the meso/macro pores would not have started. The results are shown in Figure 5b, from which several important observations can be made as follows: (i) The total pore volume is significantly larger for the LAG samples than that for the NG ones; (ii) the total pore volume reached a maximum of 0.47 cm3/g when 400 μL of liquid was added. However, the mesoporosity/macroporosity accounts for a large portion of the total porosity in this sample and those with less than 400 μL, as illustrated by the trend line in Figure 5b; (iii) for the sample with 1000 μL, microporosity is larger than that for the samples with 400 μL or less, and also becomes much more dominant, accounting for approximately 90% of the total porosity; and (iv) the trend mentioned in (iii) reverses when the amount of liquid increases to 1500 μL.
To further understand the nature of mesoporosity/macroporosity in these samples, the mesopore/macropore size distributions of these samples were derived from the adsorption isotherm by using the Barrett–Joyner–Halenda (BJH) model. As shown in Figure 6, the three groups of samples categorized above, based on their isotherms, show distinct mesoporosity/macroporosity distribution characteristics—consistent with the BET and pore volume calculation results. First, the NG sample does not exhibit any peaks within the range of either the mesopores or macropores. This indicates that the very minimal amount of porosity in this sample is likely from the features, the size of which is beyond the calculation limits of the BJH model (~100 nm). Second, the samples with 400 μL or less liquid show pronounced peaks in the BJH pore size distribution. For the sample with 50 μL, the distribution has a broadened peak between 25 and 45 nm. For the sample with 200 μL, however, the curve includes two peaks at 18 and 42 nm, respectively. More importantly, these two peaks are better defined in terms of width and height. The same trend continues to be seen in the sample with 400 μL, which shows one dominant peak near 66 nm. The narrow width and the large height of these peaks indicate that the mesopores and/or macropores are more ordered structures from the interior of the samples rather than some features on the surface of the samples. Third, the results show that the prominent mesoporosity and macroporosity almost diminish from the samples prepared with 1000 and 1500 μL of added liquid.

3.4. Mechanistic Analysis of the Effect of Liquid on Porosity Formation

When evaluating all the results described above, it is clear that the mechanochemically synthesized Cu3(BTC)2 samples in this study exhibit hierarchical porosities and that the external liquid plays an essential role in controlling the formation of such porosities. Microporosity originates from structurally intrinsic pores because they are generated when metal centers and organic ligands are assembled through coordination. This is why micropores are formed inside the primary particles of crystalline Cu3(BTC)2. As a result, it is expected that microporosity has a positive correlation with the degree of crystallinity of these particles.
The NG samples are mostly amorphous and, therefore, have a low degree of crystallinity. As a result, these samples contain few micropores, as illustrated schematically in Figure 7. Their very minimal amount of porosity arises, likely from the structural features on the surface of the agglomerates. When a small amount of liquid is added, the process becomes liquid-assisted grinding (LAG). The corresponding results show that the crystallinity of the LAG samples is significantly improved. When the amount of liquid increases from 50 μL to 1000 μL, such an improvement continues, as indicated by the change in the crystallite size. As explained above, a higher degree of crystallinity of the samples leads to an increase in their microporosity, as illustrated schematically by the grids in Figure 7. This trend for microporosity is seen within the whole range of LAG for the synthesis of Cu3(BTC)2 until the amount of liquid reaches 1000 μL. As for the sample with 1500 μL, the process changes from solid-state grinding to slurry grinding. It is believed that the underlying reaction mechanism has also changed, and a detailed analysis of it needs further study; however, it is currently beyond the scope of this paper.
Based on the results of this study, we believe that mesoporosity and macroporosity in the Cu3(BTC)2 samples arise mainly from the network space of their primary particles, as those illustrated as “inter-particle” pores in Figure 3, and therefore, are affected by the size of these particles. In traditional porous materials, e.g., activated carbons, these spaces are most likely closed and thus are unable to contribute to porosity in the adsorption measurements. This is also what is expected of the NG sample in this study. In the case of porous MOFs, however, these spaces could be accessible through micropore channels at the proper pressure. As for those “intra-agglomerate” pores shown in Figure 3, they are likely too large to account for any meaningful adsorption.
As discussed in the SEM Section 3.2, there are two competing events in the LAG synthesis: particle breakage and the agglomeration of the newly created particle fragments. Which of these events is dominant will determine the size of the primary particles and their network space formed in such a process. This, in turn, will control the formation of mesoporosity and macroporosity. When particle breakage is dominant, the primary particles tend to be smaller so that the network space of these particles (referred to as “inter-particle pores”) could result in the formation of mesopores and macropores, as illustrated in Figure 7. These pores are accessible through micropores inside the primary particles. This scenario applies to the samples with 400 μL or less of liquid in the LAG synthesis of Cu3(BTC)2. It is also important to realize that the size of such mesopores and macropores and their respective percentage in the total pore volumes can be tailored by controlling the amount of liquid, as indicated by the BJH results. When the amount of liquid is increased to 1000 μL, however, agglomeration is believed to be the dominant event. As a result, the primary particles become larger, and many mesopore/macropore-contributing network spaces collapse, as illustrated in Figure 7.

3.5. H2 Adsorption Measurement

Cu3(BTC)2 and other MOFs are often utilized for adsorption-based applications, where preparing target MOFs with desirable porosity is essential to their performance. In this regard, it is of great benefit to realize that the formation of hierarchical porosities in MOFs could be controlled to a certain extent by adding various amounts of liquid in the LAG synthesis, as demonstrated by the Cu3(BTC)2 results presented herein. This strategy can be employed to synthesize the target MOFs with a desirable porosity for specific applications. In this study, the H2 adsorption capacity of Cu3(BTC)2 was examined to demonstrate such a strategy. It is well-known that for a physical adsorption process, gas molecules are restrained inside the pores of adsorbents only by a weak force, such as the van der Waals force. As a result, smaller gas molecules, e.g., H2 and CH4, will be more effectively adsorbed into smaller pores. As shown in Figure 8a, H2 adsorption in the Cu3(BTC)2 samples is significantly improved when liquid is added, and the adsorption continues to rise until the amount of liquid reaches 1000 μL. The maximum capacity at 1.44 wt% is comparable with other reports for Cu3(BTC)2 under similar conditions [34,35]. Figure 8b was plotted to demonstrate the relationship between porosity and the H2 adsorption capacity. It can be seen that there is a positive linear correlation between the microporosity of the Cu3(BTC)2 samples and their H2 adsorption capacities, which clearly does not apply to the total porosity of the samples. Therefore, the LAG synthesis with 1000 μL, which leads to the maximum microporosity, is optimal for H2 adsorption in the Cu3(BTC)2 samples.

4. Conclusions

The liquid-assisted grinding (LAG) method is effective and efficient for quantitatively synthesizing crystalline Cu3(BTC)2 metal-organic frameworks. The results show that LAG gives rise to a faster reaction rate and greater crystallinity of the Cu3(BTC)2 products, while neat grinding only leads to the partial completion of a reaction and amorphous phase of the products. As the amount of liquid increases from 50 μL to 1000 μL, a larger crystallite size, thus a greater degree of crystallinity of Cu3(BTC)2, is observed.
External liquid plays an essential role in controlling the formation of porosity in Cu3(BTC)2. Microporosity arises from the structurally intrinsic pores formed inside the crystal structures of the primary Cu3(BTC)2 particles. A larger amount of liquid in the LAG synthesis contributes to a larger microporosity in the Cu3(BTC)2 samples. Mesoporosity and macroporosity result from the network space of the primary particles, which is also affected by the amount of liquid in the synthesis. When the presence of liquid leads to particle breakage as the dominant event in the LAG process, it results in smaller primary particles, and the network space of these particles constitutes mostly mesoporosity and macroporosity. The size of such mesopores and macropores and their percentage in the total pore volumes can also be tailored by changing the amount of added solvent. When the presence of liquid promotes the agglomeration over particle breakage as the dominant event, most of the network space disappears so that mesoporosity and macroporosity in the samples diminish accordingly. By using the H2 adsorption results, we demonstrated that such control over hierarchical porosity could be utilized for applications which are desirable for a particular type of porosity in the MOFs.

Supplementary Materials

The following supporting information can be downloaded at: https://www.mdpi.com/article/10.3390/su14159150/s1, Figure S1: XRD patterns of mechanochemical synthesis products from Cu(OAc)2 + H3BTC with 800 μL and 1000 μL of H2O and ethanol (volume ratio 1:1) added prior to grinding; Figure S2: N2 adsorption-desorption isotherms of Cu3(BTC)2 prepared from grinding Cu(OAc)2 + H3BTC with addition of 800 μL and 1000 μL of H2O and ethanol.

Author Contributions

H.Y. planned the research, conducted a portion of the experimental work and created the original draft preparation. With H.Y.’s supervision, J.N.W. and J.R.M. performed the remaining experiments and initial data analysis. All authors have read and agreed to the published version of the manuscript.

Funding

Part of J.N.W. and J.R.M’s work was financially supported by Widener University as the participants of the Undergraduate Research and Creative Activities (SURCA) program.

Institutional Review Board Statement

Not applicable.

Informed Consent Statement

Not applicable.

Data Availability Statement

Not applicable.

Conflicts of Interest

The authors declare no conflict of interest.

References

  1. Wang, B.; Xie, L.-H.; Wang, X.; Liu, X.-M.; Li, J.; Li, J.-R. Applications of Metal–Organic Frameworks for Green Energy and Environment: New Advances in Adsorptive Gas Separation, Storage and Removal. Green Energy Environ. 2018, 3, 191–228. [Google Scholar] [CrossRef]
  2. Van de Voorde, B.; Bueken, B.; Denayer, J.; De Vos, D. Adsorptive Separation on Metal–Organic Frameworks in the Liquid Phase. Chem. Soc. Rev. 2014, 43, 5766–5788. [Google Scholar] [CrossRef] [PubMed] [Green Version]
  3. Li, H.; Wang, K.; Sun, Y.; Lollar, C.T.; Li, J.; Zhou, H.-C. Recent Advances in Gas Storage and Separation Using Metal–Organic Frameworks. Mater. Today 2018, 21, 108–121. [Google Scholar] [CrossRef]
  4. Szczęśniak, B.; Borysiuk, S.; Choma, J.; Jaroniec, M. Mechanochemical Synthesis of Highly Porous Materials. Mater. Horiz. 2020, 7, 1457–1473. [Google Scholar] [CrossRef]
  5. Tao, C.-A.; Wang, J.-F. Synthesis of Metal Organic Frameworks by Ball-Milling. Crystals 2020, 11, 15. [Google Scholar] [CrossRef]
  6. Głowniak, S.; Szczęśniak, B.; Choma, J.; Jaroniec, M. Mechanochemistry: Toward Green Synthesis of Metal–Organic Frameworks. Mater. Today 2021, 46, 109–124. [Google Scholar] [CrossRef]
  7. Mottillo, C.; Friščić, T. Advances in Solid-State Transformations of Coordination Bonds: From the Ball Mill to the Aging Chamber. Molecules 2017, 22, 144. [Google Scholar] [CrossRef] [Green Version]
  8. Yang, H.; Orefuwa, S.; Goudy, A. Study of Mechanochemical Synthesis in the Formation of the Metal–Organic Framework Cu3(BTC)2 for Hydrogen Storage. Microporous Mesoporous Mater. 2011, 143, 37–45. [Google Scholar] [CrossRef]
  9. Klimakow, M.; Klobes, P.; Thünemann, A.F.; Rademann, K.; Emmerling, F. Mechanochemical Synthesis of Metal−Organic Frameworks: A Fast and Facile Approach toward Quantitative Yields and High Specific Surface Areas. Chem. Mater. 2010, 22, 5216–5221. [Google Scholar] [CrossRef]
  10. Seo, Y.-K.; Hundal, G.; Jang, I.T.; Hwang, Y.K.; Jun, C.-H.; Chang, J.-S. Microwave Synthesis of Hybrid Inorganic–Organic Materials Including Porous Cu3(BTC)2 from Cu(II)-Trimesate Mixture. Microporous Mesoporous Mater. 2009, 119, 331–337. [Google Scholar] [CrossRef]
  11. Souza, B.E.; Möslein, A.F.; Titov, K.; Taylor, J.D.; Rudić, S.; Tan, J.-C. Green Reconstruction of MIL-100(Fe) in Water for High Crystallinity and Enhanced Guest Encapsulation. ACS Sustain. Chem. Eng. 2020, 8, 8247–8255. [Google Scholar] [CrossRef]
  12. Souza, B.E.; Tan, J.-C. Mechanochemical Approaches towards the in Situ Confinement of 5-FU Anti-Cancer Drug within MIL-100(Fe) Metal–Organic Framework. CrystEngComm 2020, 22, 4526–4530. [Google Scholar] [CrossRef]
  13. Mao, Y.; Qi, H.; Ye, G.; Han, L.; Zhou, W.; Xu, W.; Sun, Y. Green and Time-Saving Synthesis of MIL-100(Cr) and Its Catalytic Performance. Microporous Mesoporous Mater. 2019, 274, 70–75. [Google Scholar] [CrossRef]
  14. Leng, K.; Sun, Y.; Li, X.; Sun, S.; Xu, W. Rapid Synthesis of Metal–Organic Frameworks MIL-101(Cr) Without the Addition of Solvent and Hydrofluoric Acid. Cryst. Growth Des. 2016, 16, 1168–1171. [Google Scholar] [CrossRef]
  15. Taheri, M.; Bernardo, I.D.; Lowe, A.; Nisbet, D.R.; Tsuzuki, T. Green Full Conversion of ZnO Nanopowders to Well-Dispersed Zeolitic Imidazolate Framework-8 (ZIF-8) Nanopowders via a Stoichiometric Mechanochemical Reaction for Fast Dye Adsorption. Cryst. Growth Des. 2020, 20, 2761–2773. [Google Scholar] [CrossRef]
  16. Tanaka, S.; Kida, K.; Nagaoka, T.; Ota, T.; Miyake, Y. Mechanochemical Dry Conversion of Zinc Oxide to Zeolitic Imidazolate Framework. Chem. Commun. 2013, 49, 7884. [Google Scholar] [CrossRef]
  17. Tanaka, S.; Nagaoka, T.; Yasuyoshi, A.; Hasegawa, Y.; Denayer, J.F.M. Hierarchical Pore Development of ZIF-8 MOF by Simple Salt-Assisted Mechanosynthesis. Cryst. Growth Des. 2017, 18, 274–279. [Google Scholar] [CrossRef]
  18. Chui, S.S.-Y.; Lo, S.M.-F.; Charmant, J.P.H.; Orpen, A.G.; Williams, I.D. A Chemically Functionalizable Nanoporous Material [Cu3(TMA)2(H2O)3]n. Science 1999, 283, 1148–1150. [Google Scholar] [CrossRef]
  19. Schlichte, K.; Kratzke, T.; Kaskel, S. Improved Synthesis, Thermal Stability and Catalytic Properties of the Metal-Organic Framework Compound Cu3(BTC)2. Microporous Mesoporous Mater. 2004, 73, 81–88. [Google Scholar] [CrossRef]
  20. Schlesinger, M.; Schulze, S.; Hietschold, M.; Mehring, M. Evaluation of Synthetic Methods for Microporous Metal–Organic Frameworks Exemplified by the Competitive Formation of [Cu2(Btc)3(H2O)3] and [Cu2(Btc)(OH)(H2O)]. Microporous Mesoporous Mater. 2010, 132, 121–127. [Google Scholar] [CrossRef]
  21. Pichon, A.; James, S.L. An Array-Based Study of Reactivity under Solvent-Free Mechanochemical Conditions—Insights and Trends. CrystEngComm 2008, 10, 1839. [Google Scholar] [CrossRef]
  22. Stolar, T.; Batzdorf, L.; Lukin, S.; Žilić, D.; Motillo, C.; Friščić, T.; Emmerling, F.; Halasz, I.; Užarević, K. In Situ Monitoring of the Mechanosynthesis of the Archetypal Metal–Organic Framework HKUST-1: Effect of Liquid Additives on the Milling Reactivity. Inorg. Chem. 2017, 56, 6599–6608. [Google Scholar] [CrossRef] [PubMed]
  23. Steenhaut, T.; Grégoire, N.; Barozzino-Consiglio, G.; Filinchuk, Y.; Hermans, S. Mechanochemical Defect Engineering of HKUST-1 and Impact of the Resulting Defects on Carbon Dioxide Sorption and Catalytic Cyclopropanation. RSC Adv. 2020, 10, 19822–19831. [Google Scholar] [CrossRef] [PubMed]
  24. Abbasi, A.R.; Karimi, M.; Daasbjerg, K. Efficient Removal of Crystal Violet and Methylene Blue from Wastewater by Ultrasound Nanoparticles Cu-MOF in Comparison with Mechanosynthesis Method. Ultrason. Sonochem. 2017, 37, 182–191. [Google Scholar] [CrossRef] [Green Version]
  25. Panda, J.; Sahu, S.N.; Pati, R.; Panda, P.K.; Tripathy, B.C.; Pattanayak, S.K.; Sahu, R. Role of Pore Volume and Surface Area of Cu-BTC and MIL-100 (Fe) Metal-Organic Frameworks on the Loading of Rifampicin: Collective Experimental and Docking Study. Chem. Sel. 2020, 5, 12398–12406. [Google Scholar] [CrossRef]
  26. Julien, P.A.; Užarević, K.; Katsenis, A.D.; Kimber, S.A.J.; Wang, T.; Farha, O.K.; Zhang, Y.; Casaban, J.; Germann, L.S.; Etter, M.; et al. In Situ Monitoring and Mechanism of the Mechanochemical Formation of a Microporous MOF-74 Framework. J. Am. Chem. Soc. 2016, 138, 2929–2932. [Google Scholar] [CrossRef]
  27. Friščić, T.; Childs, S.L.; Rizvi, S.A.A.; Jones, W. The Role of Solvent in Mechanochemical and Sonochemical Cocrystal Formation: A Solubility-Based Approach for Predicting Cocrystallisation Outcome. CrystEngComm 2009, 11, 418–426. [Google Scholar] [CrossRef]
  28. Hasa, D.; Miniussi, E.; Jones, W. Mechanochemical Synthesis of Multicomponent Crystals: One Liquid for One Polymorph? A Myth to Dispel. Cryst. Growth Des. 2016, 16, 4582–4588. [Google Scholar] [CrossRef] [Green Version]
  29. Strobridge, F.C.; Judaš, N.; Friščić, T. A Stepwise Mechanism and the Role of Water in the Liquid-Assisted Grinding Synthesis of Metal–Organic Materials. CrystEngComm 2010, 12, 2409. [Google Scholar] [CrossRef]
  30. Fan, G.; Wen, Y.; Liu, B.; Yang, W. An Insight into the Influence of Crystallite Size on the Performances of Microsized Spherical Li(Ni0.5Co0.2Mn0.3)O2 Cathode Material Composed of Aggregated Nanosized Particles. J. Nanopart. Res. 2018, 20, 43. [Google Scholar] [CrossRef]
  31. Knieke, C.; Sommer, M.; Peukert, W. Identifying the Apparent and True Grinding Limit. Powder Technol. 2009, 195, 25–30. [Google Scholar] [CrossRef]
  32. Dodd, A.C.; McCormick, P.G. Factors Affecting the Particle Size of Powders Synthesised by Mechanochemical Processing. J. Metastable Nanocryst. Mater. 2003, 15–16, 545–552. [Google Scholar] [CrossRef]
  33. Thommes, M.; Kaneko, K.; Neimark, A.V.; Olivier, J.P.; Rodriguez-Reinoso, F.; Rouquerol, J.; Sing, K.S.W. Physisorption of Gases, with Special Reference to the Evaluation of Surface Area and Pore Size Distribution (IUPAC Technical Report). Pure Appl. Chem. 2015, 87, 1051–1069. [Google Scholar] [CrossRef] [Green Version]
  34. Lee, J.; Li, J.; Jagiello, J. Gas Sorption Properties of Microporous Metal Organic Frameworks. J. Solid State Chem. 2005, 178, 2527–2532. [Google Scholar] [CrossRef]
  35. Peedikakkal, A.M.P.; Aljundi, I.H. Mixed-Metal Cu-BTC Metal–Organic Frameworks as a Strong Adsorbent for Molecular Hydrogen at Low Temperatures. ACS Omega 2020, 5, 28493–28499. [Google Scholar] [CrossRef]
Figure 1. XRD patterns of reactants H3BTC and Cu(OAc)2, and mechanochemical synthesis products from Cu(OAc)2 + H3BTC with various amounts of H2O and ethanol (volume ratio 1:1) added prior to grinding.
Sustainability 14 09150 g001
Figure 2. SEM images of Cu3(BTC)2 prepared from grinding Cu(OAc)2 + H3BTC with addition of various amounts of H2O and EtOH: (a) and (b) 0 μL; (c) and (d) 400 μL; (e) and (f) 1000 μL.
Sustainability 14 09150 g002
Figure 3. Schematic diagrams of (a) agglomerates and primary particles, and (b) types of microstructures of primary particles after grinding.
Sustainability 14 09150 g003
Figure 4. N2 adsorption–desorption isotherms of Cu3(BTC)2 prepared from grinding Cu(OAc)2 + H3BTC with the addition of various amounts of H2O and ethanol (solid symbol: adsorption; open symbol: desorption).
Sustainability 14 09150 g004
Figure 5. Effects of a different amount of H2O and EtOH on the properties of Cu3(BTC)2 (a) BET surface areas and (b) mesopore volume, micropore volume and total pore volume (the total height of the column).
Sustainability 14 09150 g005aSustainability 14 09150 g005b
Figure 6. BJH pore size distributions of Cu3(BTC)2 prepared from grinding Cu(OAc)2 + H3BTC with addition of a different amount of H2O and EtOH.
Sustainability 14 09150 g006
Figure 7. Schematic diagrams of the formation mechanism of hierarchical porosity in Cu3(BTC)2 prepared by mechanochemical synthesis.
Sustainability 14 09150 g007
Figure 8. (a) H2 uptake at 1 bar and −196 °C of Cu3(BTC)2 prepared from grinding Cu(OAc)2 + H3BTC with addition of a different amount of H2O and EtOH. (b) The correlation between H2 uptake and pore volume.
Sustainability 14 09150 g008
Table 1. Summary of mechanochemical synthesis conditions of Cu3(BTC)2 with a different amount of liquid and their textural properties.
Type of GrindingLiquid Amount (μL)Liquid/Reactant Ratio, η (μL/mg)Crystallite Size
(nm)
BET Specific Surface Areas (m2/g)Pore Volume
(cm3/g)
H2 Uptake at −196 °C and 1 Bar (wt%)
Total Pores (P/P0 = 0.99)Microspores (P/P0 = 0.40)Micro/Total Ratio
NG00N/A210.050.010.210.06
LAGB.D. *500.0259203150.260.130.500.60
1000.0518214170.340.180.530.78
2000.104234410.330.180.550.79
4000.207347390.470.290.621.31
A.D.8000.415388210.370.330.891.38
10000.518388510.380.340.891.44
Slurry15000.777306210.350.250.711.16
* B.D.—Breakage Dominant; A.D.—Agglomeration Dominant.
Publisher’s Note: MDPI stays neutral with regard to jurisdictional claims in published maps and institutional affiliations.

