Article

Geochemical Speciation, Risk Assessment, and Sources Identification of Heavy Metals in Mangrove Surface Sediments from the Nanliu River Estuary of the Beibu Gulf, China

1
Guangxi Key Laboratory of Green Chemical Materials and Safety Technology, Beibu Gulf University, Qinzhou 515000, China
2
College of Petroleum and Chemical Engineering, Beibu Gulf University, Qinzhou 515000, China
*
Authors to whom correspondence should be addressed.
Sustainability 2022, 14(15), 9112; https://doi.org/10.3390/su14159112
Submission received: 2 June 2022 / Revised: 21 July 2022 / Accepted: 21 July 2022 / Published: 25 July 2022
(This article belongs to the Special Issue Soil Heavy Metal Pollution, Remediation, and Risk Assessment)

Abstract

:
To better understand heavy metal pollution and the potential ecological risk of mangrove sediments in the Nanliu River estuary, the speciation and distribution characteristics of heavy metals Fe, Mn, Zn, Co, Ni, Cd, Cr, Cu, and Pb in 13 surface sediments in the study area were determined and analyzed using a modified four-step BCR extraction method, and the ecological risk of heavy metals was assessed using the Geo-accumulation Index (Igeo), Potential Ecological Risk Index (RI), Risk Assessment Code (RAC), Pollution Load Index (PLI), Individual contamination factors (ICF) and Global contamination factor (GCF) methods, and source analyses were performed using correlation analysis and cluster analysis. The results showed that the heavy metal was in the order of Fe > Mn > Cu > Zn > Cr > Pb > Co > Ni > Cd. Except for Fe, Zn, Ni, Cr, Pb, and Co, the average heavy metal content of Mn, Cd, and Cu all exceeded the environmental background value; the Fe, Zn, Co, Ni, Cr, Cu, and Pd are mainly in the residual speciation, while Mn and Cd are mainly weak acid extraction and oxidation, respectively, both of which are predominantly in unstable speciation and are easily released into the environment. Mn and Cd pose a substantial ecological risk, while Cu and Pb present a moderate risk and require precaution. The source analysis results indicate that Fe, Mn, Zn, Ni, Cr, and Pb are most likely to originate from natural sources and the transportation industry, Co and Cu are likely to be mainly from ship manufacturing industrial activities, and Cd is likely to be mainly from agriculture and aquaculture. The GCF and PLI results show that places with high heavy metal enrichment and ecological risk are primarily located in areas with high industrial, agricultural, or human activity impacts.

1. Introduction

With rapid industrialization and urbanization, heavy metal pollution has become one of the most prominent problems in the ecological environment of Mangrove ecosystems, which are found along the estuarine shores in tropical and subtropical regions [1,2]. The complex physical and chemical processes result in heavy metals transportation and deposition in the sediments of the Mangrove environment [3,4]. Thus, sediments serve as the ultimate heavy metal sink [5,6]. However, when the environmental conditions change, heavy metals in sediments can be released into the overlying water, becoming the “secondary pollution source” [7,8]. Moreover, heavy metals in sediments are characterized by high toxicity, wide sources, easy accumulation, and non-degradability [9,10]. Consequently, heavy metals accumulated in sediments have toxic effects on aquatic organisms and can affect human health through food chain transmission [11,12]. Thus, clarifying the sources, behavior, and risk of heavy metals in the surface sediments of the Mangrove environment is crucial for the protection of Mangrove ecosystems.
Generally, heavy metals can be found in a variety of chemical forms in sediments (acid-soluble, reducible, oxidizable, and residual) and generally exhibit a variety of mobility, biological availability, and potential toxicity properties [13]. The fractions’ content influences the heavy metals’ bioavailability; for example, the residual is more stable and less likely to be released [14]. Thus, the overall quantity of trace metals, while an important index in the evaluation of sediment contamination, might not fully indicate their potential bioavailability or toxicity. To better understand the potential and actual impacts of elevated levels of metals in sediments, it is necessary to identify and quantify the geochemical speciation of a metal found in sediments.
The Nanliu river estuary is a developed agricultural, aquaculture, and light-industrial area in the Beibu Gulf region, and it is surrounded by a large number of mangroves. Mangroves in the Nanliu river estuary will face increasing environmental pressure due to the rapid development of industry and agriculture in this basin. In recent years, there has been an ever-increasing interest in the fate and ecological risk of heavy metals in Beibu Gulf; various studies have been conducted to evaluate the contamination of heavy metals in the soil of the coastal wetland [15], petroleum-producing regions [16], and the surface seawater and sediments of the Beibu Gulf [17,18]. However, previous studies have mostly focused on the heavy metal contamination of sediments using just the total metal concentration as a criterion to determine its potential influence as a pollutant [19]. To date, no scientific research regarding geochemical speciation, risk assessment, and sources identification of heavy metals in Mangrove surface sediments from the Nanliu river estuary of the Beibu Gulf. Therefore, in this study, a sequential extraction technique was used to interpret the geochemical speciation and provide a risk assessment of heavy metals in sediment samples collected from Mangrove surface sediments of the Nanliu river estuary, China. The objectives of the present work were (i) to assess the distribution characteristics of total and geochemical speciation of heavy metals; (ii) to evaluate the bioavailability and ecological risk of heavy metals in different geochemical fractions in the sediments; (iii) to determine the potential sources of the heavy metals through correlation and cluster analysis.

2. Materials and Methods

2.1. Sample Collection and Preparation

The study region is in Hepu County, Beihai City, Guangxi, in the mangrove distribution area of the Nanliu River estuary, and the sampling site’s detailed structure is depicted in Figure 1. The Nanliu river estuary mostly receives water from riversides industrial complexes and aquaculture wastewater discharge points along the riverbanks (Figure 1). These large industrial setups contain many metal-related factories with daily activities, including metal surface treatment, computer chip manufacturing, and packaging. Thus, the sampling approach was based on the assumption of fully portraying the environment of the study area, with a total of 13 sampling locations chosen. From each sampling station, three sediment samples were collected and then mixed thoroughly to achieve a composite sample [20], and therefore, a total of 39 sediment samples (surface, 0–10 cm) were collected with a plastic spatula from March 2020 to August 2021 for analysis. After mixing, the samples were packed in clean polyethylene bags labeled with the sampling time, location, and sample number. After bringing the samples to the lab, freeze-drying at −50 °C in a freeze dryer (ALPHA 2-4 LSC, CHRIST, Osterode, Germany), the impurities were removed from the dried samples, crushed in a mortar, and then the samples were sieved through a 62-μm mesh nylon sieve. The sieved samples were placed in a clean plastic bag, sealed, labeled, and stored in a dry, cool spot for later use.

2.2. Sample Analysis

Determination of physical and chemical parameters: The total organic carbon (TOC) was determined by the loss-of-ignition method. The sediment samples were baked in a crucible at 105 °C to constant weight, then taken out, immediately put into a dryer, cooled, and weighed. Then, the crucible was transferred to a muffle furnace, heated to 550 °C, burned for 5 h, cooled in the dryer, weighed, and the ratio of losing weight to sediment weight was calculated to obtain the total organic carbon content of the sediment. The sample repetition error in the laboratory was less than 5%, measuring pH and SAL, weighing 15 g of the sample, placing it in a 50 mL centrifuge tube, adding 15mL of ultrapure water, shaking for 1h, and standing for 3–5 h. Using the pH composite electrode (E-201-D, LEI-CI, Shanghai, China) and the conductivity electrode (DJS-1D, LEI-CI, Shanghai, China) in the multi-parameter analyzer (DZS-708, LEI-CI, Shanghai, China), the pH and salinity (SAL) of the leachate were measured respectively (average value was obtained after three parallel measurements).
Determination of Total Heavy Metals: ~0.1 g of the sediment samples were weighed into a PTFE microwave digestion tank, 6 mL of concentrated HNO3 and 3 mL of concentrated HCl (2:1) were added, and once the reaction was steady, the bottle cap was tightened and placed in the microwave digestion apparatus (MARS6, CEM, Matthews, NC, USA); the working method is shown in Table 1. After the microwave digestion, the microwave digestion tube was removed and placed in the matched acid-driving equipment to drive the acid at 180 °C until it was nearly dry; then 1.00 mL of 50% HNO3 was added, slightly heat-leached, and transferred to a 50 mL volumetric flask, the volume was fixed with pure water, and it was left to stand. After passing through a 0.45 μm filter membrane, the sample was placed in a centrifuge tube and analyzed with an inductively coupled plasma emission spectrometer ICP-OES (Optima8000, PerkinElmer, Waltham, MA, USA).
Extraction and Determination of geochemical speciation of Heavy Metals: An improved BCR four-step continuous extraction method [21] was adopted to analyze the geochemical speciation of heavy metals in sediments. According to the different kinds of extraction agents and extraction sequences, the geochemical speciation of heavy metals in sediments can be divided into the acid-soluble/exchangeable fraction (F1), Reducible fraction (F2), the oxidizable fraction (F3), and the residual fraction (F4). The total amount of each heavy metal is the sum of four forms, and the first three forms are also called effective forms. The extraction reagents and methods are shown in Table 2. After each heavy metal speciation extraction, it was centrifuged at 4000 rpm for 10min, the supernatant was taken, and the residue was washed with ultrapure water twice, centrifuged, the supernatants were combined, passed through a 0.45μm membrane, transferred to a 50mL volumetric flask, and the volume was fixed with 3% dilute nitric acid solution, and analyzed with an inductively coupled plasma emission spectrometer ICP-OES (Optima8000, PerkinElmer, Waltham, MA, USA). All of the reagents used were reagent grade, and all of the laboratory wares were soaked in 10% HNO3 for 2–3 days and then rinsed with ultrapure water.
During sample analysis, in order to determine the accuracy of the digestion procedure, a standard material (BCR-701) was digested using the same protocol. Quality control (QC) and quality assurance (QA) were performed by analyzing replicates and method blanks [22]. To check the accuracy of measurement, the reference sample was rechecked after every 5 samples. The recovery rates of the total heavy metals were all between 85% and 120%. Comparing the sum of the four speciation of the heavy metals with the total heavy metals in sediments, the recovery rates were between 82% and 120%, i.e., quality control of the extracted nine elements was conducted to assure that the recoveries were within reasonable limits, resulting in Fe, Mn, Zn, Co, Ni, Cd, Cr, Cu, and Pb recoveries of 82.96, 106.78, 101.19, 98.12, 100.37, 119.16, 101.20, 98.41, and 107.62, respectively. The standard deviations of all of the heavy metals in the parallel samples were all less than 10%, which met the requirements of quality control and quality assurance.

2.3. Evaluation Methods

2.3.1. Geo-Accumulation Index (Igeo)

The Geo-accumulation Index (Igeo) was proposed by Muller, a scientist from the Sediment Research Institute of Heidelberg University in Germany, in 1969 [23]. It is a quantitative index for studying heavy metal pollution in sediments that can reflect the enrichment degree of heavy metals in sediments and is widely used to assess the pollution level of heavy metals in sediments. The calculation formula is as follows:
I g e o = log 2 C n / K B n
where Cn is the concentration of element n in the sediment; Bn is the geochemical background value of this element in the sediment. In this study, the background values of Fe, Mn, Zn, Co, Ni, Cd, Cr, Cu, and Pb [24,25] were 38100.00, 159.32, 48.25, 14.60, 24.00, 0.072, 21.41, 11.305, and 20.43 μg/g; K is a coefficient to take into account the variation of the background value that may be caused by the difference of rocks in different places (generally the value is K = 1.5) [26]. The pollution degree of heavy metals in sediments can be classified into seven grades based on Igeo values [27]: Igeo ≤ 0, unpollution; 0 < Igeo ≤ 1, unpolluted to slightly pollution; 1 < Igeo ≤ 2, moderate pollution; 2 < Igeo ≤ 3, moderately to strongly polluted; 3 < Igeo ≤ 4, intensity pollution; 4 < Igeo ≤ 5, severe pollution; Igeo > 5, extremely strong pollution.

2.3.2. Potential Ecological Risk Index (RI)

The potential ecological risk index technique takes into account all of heavy metals’ ecological, environmental, and toxicological consequences and can accurately depict their potential impact on the ecosystem [28]. The content of heavy metals in soil should be determined first in this method, and the single pollution coefficient can be calculated by a ratio with the background value of heavy metals in soil. The toxicity response coefficient of each heavy metal element can then be used to determine the single coefficient of potential ecological harm, and ultimately, a weighted calculation can be used to produce the potential ecological harm index of heavy metals in regional soil. The toxicity response coefficients of heavy metals Mn, Zn, Co, Ni, Cd, Cr, Cu, and Pb are 1, 1, 5, 5, 30, 2, 5, and 5, respectively [29]. The calculation formula is:
E f i = T r i C f i = T r i C r i / C n i
R I = i = 1 n E f i i = 1 n T r i C f i = i = 1 n T r i C r i / C n i
where RI is the comprehensive potential ecological hazard index of various heavy metals in the sampling points; E f i is the potential ecological hazard index of a single heavy metal; T r i is the toxicity response coefficient of heavy metal; C f i is the pollution coefficient of this element;   C r i is the measured content of this element; C n i is the environmental background value of this element. The relationship between the potential ecological hazard index and potential ecological hazard level is shown in Table 3.

2.3.3. Risk Assessment Code (RAC)

The risk assessment coding method assesses the ecological risk of pollutants based on the proportion of acid-soluble/exchangeable heavy metals in the sum of the speciation of four heavy metals. It is a classic evaluation method based on heavy metal forms that are primarily used to assess the bioavailability and mobility of heavy metals in sediments [30]. The calculation formula is as follows:
R A C = F 1 /   ( F 1 + F 2 + F 3 + F 4 ) × 100 %  
where F1 is the content of acid-soluble/exchangeable fraction; F2 is the content of reducible fraction; F3 is the content of oxidizable fraction; F4 is the content of residual fraction. Risk assessment coding method to evaluate risk level division [31]: RAC ≤ 1%, devoid of risk; 1% < RAC ≤ 10%, low risk; 10% < RAC ≤ 30%, moderate risk; 30% < RAC ≤ 50%, high risk; RAC ≥ 50%, very high risk.

2.3.4. Individual Contamination Factors (ICF) and Global Contamination Factor (GCF)

The contamination factor technique incorporates the effects of the acid-soluble/exchangeable fraction, reducible fraction, and an oxidizable fraction of heavy metals on the environment. Individual contamination factors (ICF) for each sediment sample were calculated by dividing the sum of the non-residual fractions (i.e., acid-soluble/exchangeable, reducible, and oxidizable) by the residual fraction of each sample, while the Global Contamination Factor (GCF) for each sampling site was calculated by adding the ICF of all the heavy metals obtained for the sediment samples [32,33]. The following is the calculating formula:
I C F =   ( F 1 + F 2 + F 3 )   / F 4  
G C F = i = 1 n I C F i  
where, F1 is the content of acid-soluble/exchangeable fraction; F2 is the content of reducible fraction; F3 is the content of oxidizable fraction; F4 is the content of residual fraction; ICFi is an individual contamination factors of certain heavy metals. Both the ICF and GCF classifications were interpreted as suggested by [34]: ICF < 0 & GCF < 6, low risk; 1 < ICF ≤ 3 and 6 < GCF ≤ 12, moderate risk; 3 < ICF ≤ 6 & 12 < GCF ≤ 24, moderate-high risk; ICF > 6 and GCF > 24, high risk.

2.3.5. Pollution Load Index (PLI)

The pollution-load index method integrates the pollution of multiple heavy metal elements and can reflect each heavy metal element’s contribution to the pollution of the study area as well as its variation in space [35]. The method must first compute the pollution coefficient (CF) of a single heavy metal element, followed by the pollution load index PLI of the sampling point. The calculation formula is as follows:
C F i = C i / C 0 i
P L I = C F 1 × C F 2 × C F 3 × × C F n n
where CFi is the pollution coefficient of heavy metal i; Ci is the measured value of heavy metal i in the sediment; C0i is the background value of heavy metal i; PLI is the pollution load index of a sampling point; n is the number of heavy metals participating in the evaluation. The pollution index method to evaluate pollution grade classification [35]: PLI < 1 means no pollution, and PLI ≥ 1 means there is some pollution.

2.4. Data Procession

The data were calculated and processed using Excel 2010 (Microsoft Inc., Redmond, WA, USA) for the relevant calculations, and SPSS 25.0 (SPSS Inc., Chicago, IL, USA) was used for descriptive statistics, including mean, range, standard deviation, coefficient of variation, principal component analysis, correlation analysis, and cluster analysis. Principal component analysis, correlation analysis, and cluster analysis were employed to reveal the interrelationship among the heavy metals in the sediment samples in order to identify the possible sources of contamination. Pearson’s correlation analysis and one-way ANOVA were explored at significant levels as p ≤ 0.05 as well as a 95% confidence level. The distribution of the Geochemical speciation of heavy metals, as well as the findings of the evaluation techniques, were plotted using Origin2018 (OriginLab Inc., Northampton, MA, USA).

3. Results and Discussion

3.1. Physical and Chemical Parameters of Sediments and Distribution Characteristics of Heavy Metal Content

The average, standard deviation, lowest, maximum, and variation coefficients of the elements Fe, Mn, Zn, Ni, Co, Cd, Cr, Cu, Pb, and the physical and chemical parameters (pH, TOC, SAL) in Nanliu River mangrove sediments are shown in Table 4. The average contents of heavy metals were: 6148.18, 264.34, 28.18, 7.60, 5.70, 0.16, 18.18, 54.80, 13.58 μg/g, respectively. The average value of heavy metals is in order of Fe > Mn > Cu > Zn > Cr > Pb > Co > Ni > Cd. Compared with the regional environmental background values [24,25], the average contents of three heavy metals, Mn, Cd, and Cu, except Fe, Zn, Co, Ni, Cr, and Pb, exceeded the regional environmental background values by 1.66, 2.22, and 4.84 times, respectively, which may be caused by the long-term influence of anthropogenic activities in the study area located at the mouth of the sea. The concentration range of nine heavy metals is highly diverse, with coefficients of variation ranging from 5.10 to 48.03%, indicating that the geographical distribution of heavy metals in mangrove sediments in Nanliu River is quite varied. Fe, Mn, Zn, Ni, Co, Cr, and Pb have variation coefficients ranging from 20.29 to 48.03%, indicating that human activities have a significant impact on these heavy metals. Although the coefficient of variation of Cd and Cu is less than 10%, the average level of Cd and Cu surpasses the environmental background value, showing that they are affected to some amount by human activities [36].
Salinity is one of the factors that affect the aggregation and deposition of sediments; high salinity can promote the adsorption of heavy metals and further encourage the aggregation and deposition processes in sediments [37]. The salinity of sediments in the study area ranges from 0.23 to 0.75%, with an average value of 0.42% and a coefficient of variation of 31.15%, which are different. The salinity of sampling points S4 and S5 is high, 0.75% and 0.52%, respectively, which may be able to store more seawater and accumulate salt in seawater; Sampling point S3 has the lowest salinity. It shows that heavy metals are easily enriched in the sediments of sampling points S4 and S5.
The organic matter acted as metal-binding agents to complex and retain heavy metals in sediments [38]. The TOC of sediment in the study area ranges from 2.13 to 9.73%, with an average of 3.97% and a coefficient of variation of 55.26%, which is quite different. Sampling points S4 and S5 have higher TOC, which are 9.73% and 7.17%, respectively. Sample point S2 has the lowest TOC. It shows that heavy metals are easily complex and retained in the sediments of sampling points S4 and S5.
pH is the main factor affecting the adsorption characteristics of heavy metals, which controls the solubility of hydroxides, carbonates, and phosphates of heavy metals and also affects the hydrolysis of heavy metals in sediments and organic matter, dissolved clay surface charge changes, and the formation of ion pairs [39]. Changes in the ionic composition influence adsorption-desorption reactions, particularly by lowering the pH, which could cause the remobilization of metals in acid-soluble [40]. The pH of sediments in the study area ranges from 6.38 to 7.77, with an average value of 7.16 and a coefficient of variation of 4.59%, with little difference. Among them, the pH values of sampling points S4 and S5 are low, 6.69 and 6.38, respectively; Sampling point S3 has a higher pH of 7.77. It shows that the heavy metals in the sediments of sampling points S4 and S5 are easy to migrate and transform.
A summary of the pollution situation of other similar estuaries and coasts in the world is helpful for understanding the pollution situation in this study area [41]. The total amount of heavy metals in the mangrove sediments in similar areas is shown in Table 5. By comparing the total amount of heavy metals in the mangrove sediments between the study area and some areas, it is found that the Fe content in the study area is lower than that in the Central Arabian Gulf Shoreline, Karankadu, and Hooghly River Estuary, and Sundarban; the Mn content is lower than in other areas in the table, except that it is higher than the central coastline of the Central Arabian Gulf shoreline; the Zn content is lower than that of the areas in the table; the Co content is higher than other areas in the table except lower than Maowei Sea. The Ni content is lower than that of the areas in the table; Cd content is lower than other areas in the table, except that it is higher than that in the Khambhat region Gulf. The Cr content is lower than that of the areas in the table; the Cu content is lower than other areas in the table except for Zhanjiang Bay, Khambhat region Gulf, Karankadu, Hooghly River Estuary, and Sundarban. The Pb content is lower than in other areas in the table, except that it is higher in the Khambhat region Gulf and Central Arabian Gulf shoreline. On the whole, the heavy metal pollution in the study area is relatively low compared with the areas in the table.

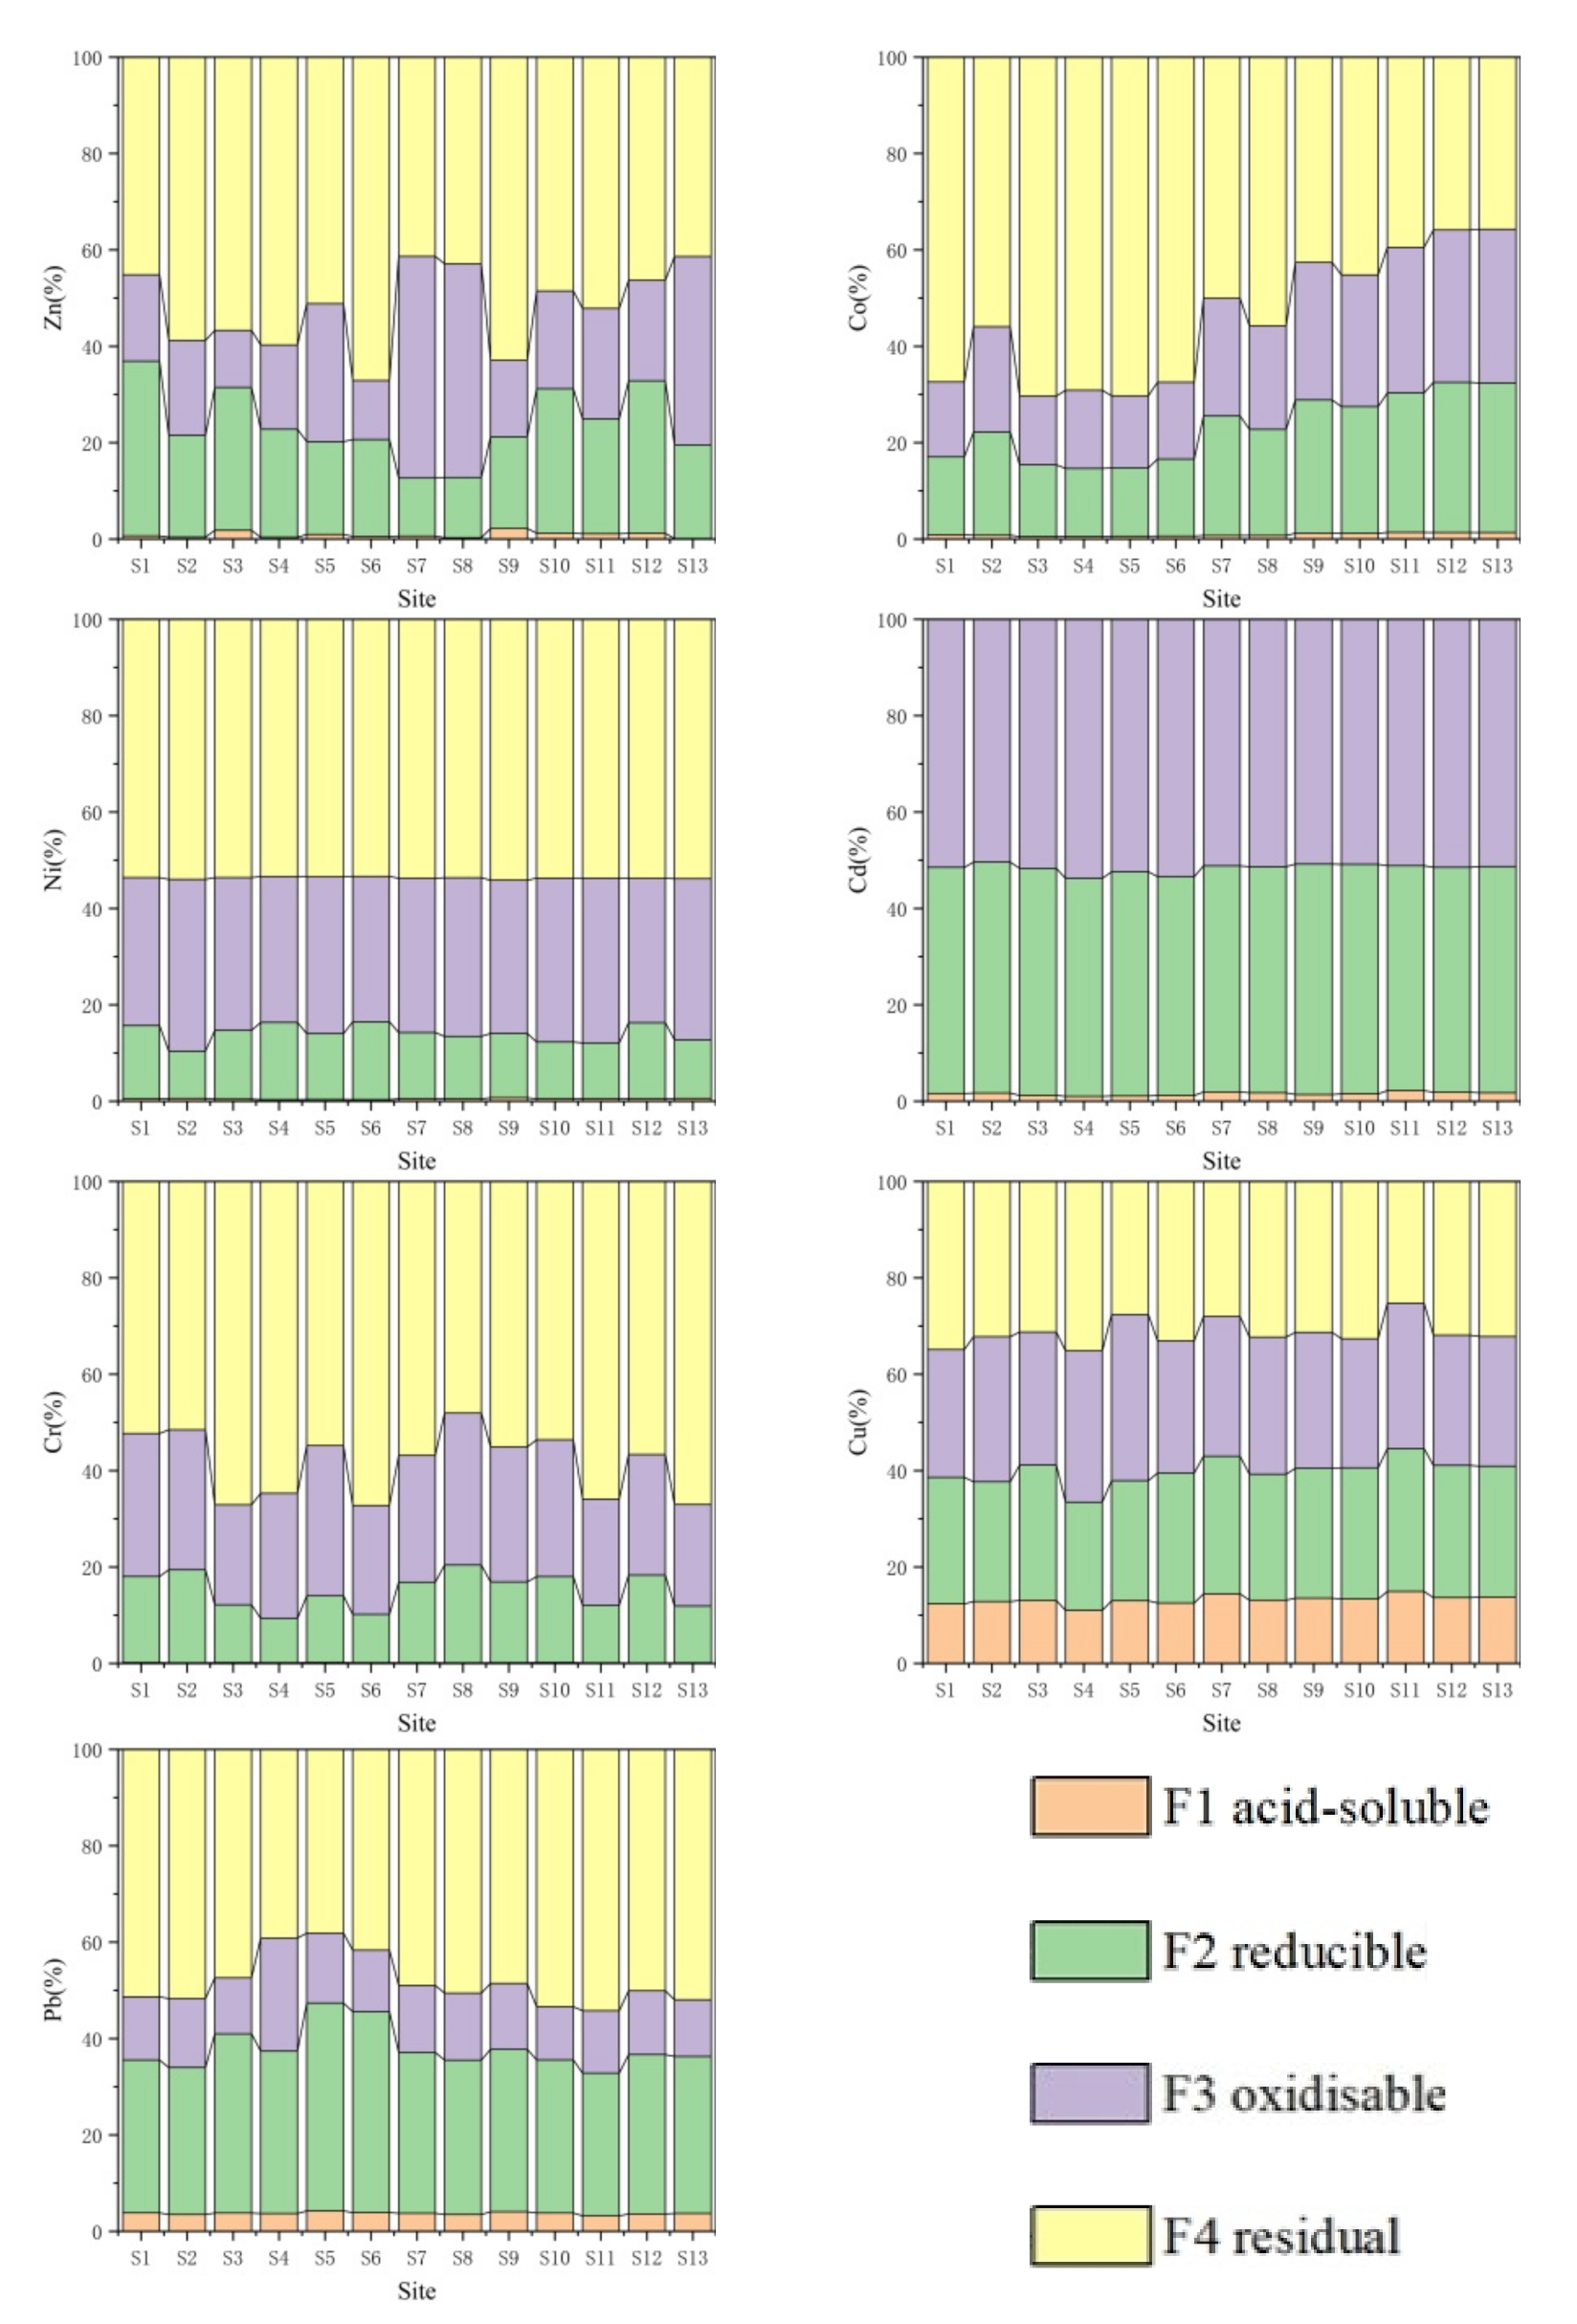
3.2. Distribution Characteristics of Geochemical Speciation of Heavy Metals

According to the results obtained by the improved BCR four-step continuous extraction method, the proportion of geochemical speciation of heavy metals in the Nanliu River mangrove forest sampling site is shown in Figure 2. Each heavy metal’s fraction of BCR occurrence type is distinct, and it can be categorized into three categories based on the primary forms.
The first type is mainly in the F1 speciation, in which only Mn is primarily F1 state, with a level of 135.39 g/g, accounting for 51.64% of the total, showing that Mn is easily released into the environment under acidic conditions and has a high bioavailability. Heavy metals in the F1 speciation are more likely to be discharged into the environment or directly consumed by organisms than in other geochemical species, necessitating special monitoring [49]. The F2 + F3 speciation, which includes Fe (50.81%), Cd (98.44%), and Cu (55.43%) and has F2 + F3 speciation contents of 3291.02 g/g, 0.18 g/g, and 29.73 g/g, respectively, indicates that they are prone to migration with changes in Eh and may cause secondary pollution to the environment. The F4 speciation, which includes Zn (51.86 percent), Co (54.24 percent), Ni (53.67 percent), Cr (58.52 percent), and Pb (48.23 percent), dominates the third group, showing that they are stable, difficult to transport and bioavailable, and difficult to pollute the environment [50].
In general, the bioavailable contents of Mn and Cd are high (almost all sampling sites account for more than 80%), and the bioavailable contents of Fe, Zn, Co, Cr, and Pb account for a significant proportion (most sampling sites account for more than 50%), which should be given some attention.

3.3. Geo-Accumulation Index (Igeo)

The geo-accumulation index approach was used to calculate the Igeo, and the results are given in Figure 3. The following are the average Igeo values of heavy metals in mangrove sediments from the Nanliu River: Cu > Cd > Mn > Cr > Pb > Co > Zn > Ni. Cu has an average Igeo of 1.69, indicating moderate pollution; Cd and Mn have average Igeo values of 0.48 and 0.05, respectively, indicating slight contamination; Cr, Pb, Co, Zn, and Ni all have Igeo average values of less than 0, showing un-pollution. The research location is near the Nanliu River’s estuary, where domestic sewage, agricultural sewage, and industrial wastewater are all dumped onto the estuary, which could be one of the sources of Cu pollution.
In terms of the plane. Mn has an Igeo value of 1.03 at sampling point S4, indicating moderate pollution; it was slightly polluted between 0.35 and 0.58 at sampling points S5, S6, S8, S9, S10, and S13; and sampling locations S1, S2, S3, S7, S11, and S12 are all less than 0, indicating un-pollution. Cd Igeo values ranged between 0.35 and 0.58 at all sampling stations, indicating that the environment was unpolluted to slightly polluted. Cu has an Igeo value between 1.50 and 1.89 at all sampling stations, indicating moderate pollution; Cr, Pb, Co, Zn, and Ni have Igeo values less than 0 at all sampling points, indicating un-pollution. In general, upstream industrial and agricultural pollution emissions may be linked to heavy metal pollution at sampling sites.

3.4. Potential Ecological Risk Index (RI)

The potential ecological risk index (RI) approach was used to compute individual ecological hazard indices (Figure 4). The mean E f i values of the heavy metals in the Nanliu River mangrove sediments follow the order: Cd > Cu > Pb > Co > Cr > Mn > Ni > Zn. Generally, Cd has the highest E f i value of 62.96, corresponding to a strong ecological hazard level, and the other heavy metals have mean E f i values ranging from 0.58 to 24.24, corresponding to a slight ecological hazard level [29]. However, this contradicts the findings of the Igeo evaluation, which suggest that Cu pollution is predominant, whereas Cd pollution is slight. The distinction between the two evaluation methods is that the RI takes into account not only the concentration but also the toxicity coefficient of each heavy metal, whereas the Igeo method just takes into account the content of heavy metals.
The RI values of heavy metals ranged from 95.01 to 103.67, with an average value of 98.25, indicating that the heavy metals in the mangrove sediments of the Nanliu River were typically at a moderate level of ecological hazard. It is worth noting that the E f i   value of Cd is the most significant contribution to the comprehensive potential ecological hazard index, suggesting that Cd is the largest pollution factor of regional ecological risk.

3.5. Risk Assessment Code (RAC)

Since the metals in the sediments are linked to distinct fractions with varied strengths, the result can give a clear indicator of sediment reactivity, which can then be used to determine the risk associated with heavy metals. A risk assessment code (RAC) is used to assess this. The results of the RAC calculations for the heavy metals are displayed in Figure 5, with the heavy metals listed in order of Mn > Cu > Pb > Cd > Co > Zn > Ni > Cr. The Mn is mainly an acid-soluble/exchangeable fraction in the sediment, which makes it highly available, and Mn has an average RAC rating of 51.64%, which places it in the extremely high-risk category. Cu has an average RAC value of 13.21%, which places it in the moderate risk category. Pb and Cd had average RAC values of 3.75% and 1.56%, respectively, which are considered low risk. Co, Zn, Ni, and Cr had average RAC values of 0.91%, 0.88%, 0.50%, 0.48%, and 0.17%, respectively, indicating that the acid-soluble/exchangeable proportion of these heavy metals is very low, posing no environmental impact.
From a planning perspective, the RAC values of Mn are at high risk at all sample sites, particularly S2, S3, S7, S8, S9, S10, S12, and S13. While Cu is at moderate risk, with RAC values ranging from 11.00 to 14.94% at all sample sites; Pb and Cd manifested low risk at all sample points (RAC = 1.03~4.24%); Co is at low risk only at sample sites S9~S13, and the rest of the sample sites are at devoid of risk; Zn is at low risk (RAC=1.09~2.21%) at S3, S10, S11, and S12 sample sites, and the rest of the sampling sites are at no risk; in addition, Ni, Cd, and Cr are no-risk-at-all sample sites. Overall, areas with high RAC concentration and high risk are primarily dispersed in S3 and S13 samples, indicating that the heavy metal elements in these samples have high mobility and high secondary release capacity.

3.6. Individual Contamination Factors (ICF) and Global Contamination Factor (GCF)

The heavy metals with a high ICF have a short retention time and are easily released into the environment, posing a high risk to aquatic life. Individual contamination factors (ICF) and global contamination factor (GCF) for the heavy metals were calculated, and the results are shown in Figure 6. The mean values of the ICF for the eight heavy metals in the mangrove sediments of the Nanliu River were, in descending order, Mn > Cu > Pb > Zn > Co > Ni > Cr. It is worth noting that the residual state of Cd has not been detected, and the ICF value cannot be directly calculated by the formula. However, because the reducible and oxidizable speciation of Cd accounts for a very high proportion, it can be inferred that the average ICF value of Cd is the highest among all heavy metals. Thus, Cd and Mn are high risks, Cu and Pb are moderate risks, and Zn, Co, Ni, and Cr are all low-moderate risks.
The risk of other heavy metal elements, except Cd, was consistent with the RAC assessment results. When assessing the ecological risk of Cd using the assessment approach based on the geochemical speciation of heavy metals, the RAC method ranks it as low risk, whereas the ICF method ranks it as high risk. This is due to the fact that the RAC technique only examines the weak acid-soluble state of Cd, but the ICF method considers the weak acid-soluble state, reducible state, and the oxidizable state of Cd. When the environment changes, this metastable geochemical speciation is easily released and pollutes the environment. As a consequence, the ICF method is more suitable for the actual situation of the study area.
In terms of the plane, Cd was at high risk at all sampling locations, while Mn was considered the moderate-high risk at sampling points S1, S4, S5, S6, S9, S10, and S12, and the rest of the sampling points were considered high risk; however, Cu was at moderate risk at all points; Pb was at moderate risk except S1, S2, S8, S10, S11, and S13 sample sites. Except for S7, S9, S10, S11, S12, S13 (Co), and S8 (Cr), which were a moderate risk, Zn, Co, Ni, and Cr were low to moderate risk at the sampling locations.
Since the ICF value of Cd could not be detected, it was removed from the GCF computation. According to GCF calculations, the level of heavy metal pollution in most sampling sites is at a moderate-high risk, except for S1, S4, S6, and S9, which are at moderate risk. In particular, the combined potential risk of sampling sites S3 and S13 is extremely high (Figure 6), showing higher heavy metal activity and secondary release capacity than other sites, which is consistent with the RAC evaluation results.

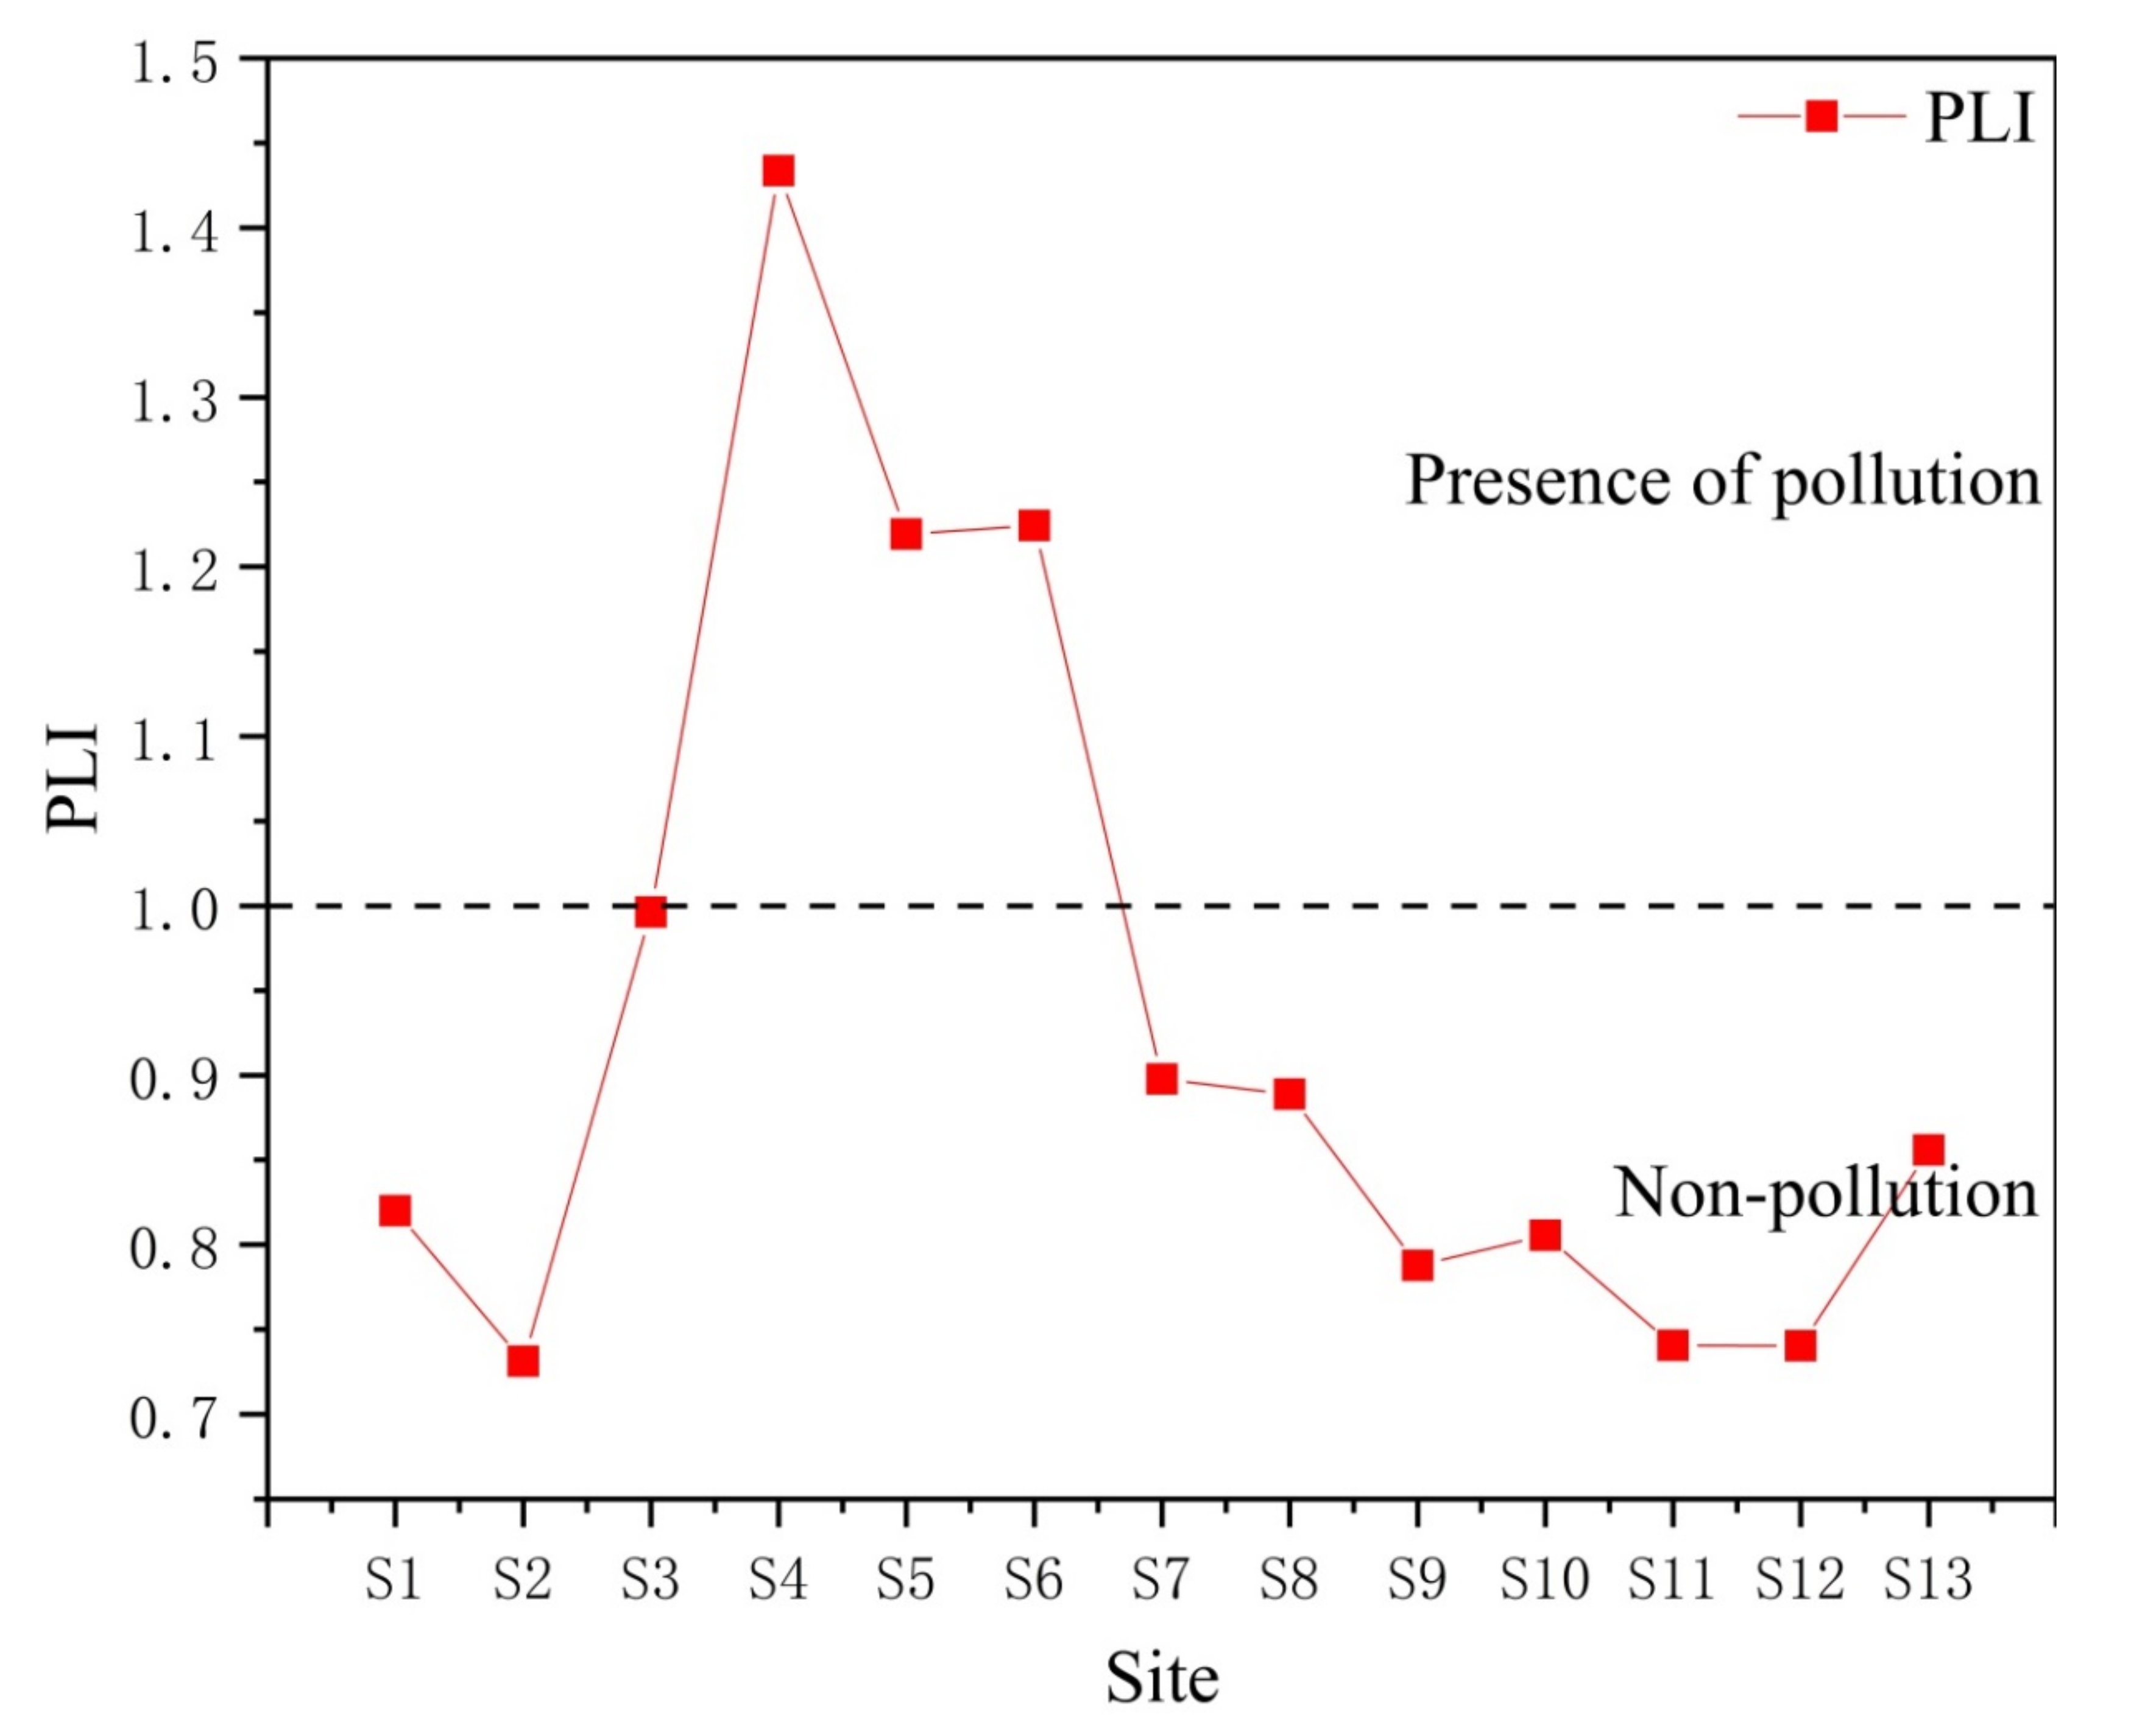
3.7. Pollution Load Index (PLI)

The pollution load index method was used to calculate the pollutant load index of heavy metals. The evaluation results are depicted in Figure 7. The mean PLI values of each sampling point in the mangrove sediments of the NanLiu River are as follows, in descending order: S4 > S6 > S5 > S3 > S7 > S8 > S13 > S1 > S10 > S9 > S11 > S12 > S2. There is some heavy metal contamination at sampling sites S3, S4, S5, and S6, but it is non-polluting at the remaining sampling sites.
The heterogeneity in total metal concentrations and the fractions of bioavailable and nonbioavailable metals across all 13 sites may be attributed in part to mineral weathering and transport characteristics, anthropogenic inputs, and other sediment components. However, the contribution from anthropogenic activities is the most significant and easily visible in river estuarine systems. Combining the results of RAC and GCF, the high level of heavy metal pollution at sample stations S3, S4, S5, and S6, and the moderate-high potential risk at sampling sites S3 and S13 could be attributed to the frequent industrial and agricultural activities of the upstream ship manufacturing plant, as well as neighboring farmland and aquaculture ponds.

3.8. Heavy Metal Pollution Source Analysis

According to the ecological risk assessment, heavy metals have polluted the mangrove sediments in the Nanliu River to some extent; thus, it is critical to identify the primary causes of pollution to recognize and prevent heavy metal pollution in the Nanliu River. The sources of heavy metal elements in sediments were investigated using multivariate statistical methods such as correlation analysis and cluster analysis as a result of the heavy metal element determination in Nanliu River mangrove sediments.

3.8.1. Correlation Analysis

The correlation analysis of the heavy metals in the research region was undertaken to determine if the sources of the eight heavy metals were consistent. If there is a significant positive correlation between the elements, it indicates that the elements have similar sources or geochemical behaviors; if there is a significant negative correlation between the elements, it indicates that the elements’ sources are different, and there may even be some antagonism. The physical and chemical properties of mangrove sediment in Nanliu River and Pearson correlation coefficients of nine heavy metals are shown in Table 6.
pH was significantly negatively correlated with Fe, Ni, and Pb, indicating that when pH decreased, more Fe, Ni, and Pb would be enriched; SAL was significantly positively correlated with TOC, Fe, Mn, Zn, Ni, and Pb, indicating that when SAL increased, with the increase in salt ions, Fe, Mn, Zn, Ni, and Pb are more easily enriched; moreover, the influence of SAL change on the mineralization of soil organic carbon is that the increase in SAL will lead to an increase in soil osmotic pressure, a decrease in microbial activity, and a decrease in the mineralization rate of soil organic carbon. Therefore, the increase in SAL will lead to a decrease in the decomposition rate of organic matter, which shows a positive correlation between TOC and SAL [51]. In addition, TOC is significantly positively correlated with SAL, Fe, Mn, Zn, Co, Ni, Cr, and Pb and significantly negatively correlated with Cd, indicating that the source or interaction mechanism between Cd and TOC may be quite different from other heavy metals.
The correlation coefficients of Fe and Ni, Pb, Ni-Pb are greater than 0.9; Mn and Fe, Ni, are between 0.8 and 0.9; Zn and Fe, Mn, Ni and Pb, Co and Fe, Ni, Cu and Pb, Cr-Ni, Cu-Co correlation coefficients are between 0.7 and 0.8, and the above elements are significantly correlated at the P=0.01 level, indicating that these heavy metals had similar or identical sources. Co and Mn, Zn, and Cr have correlation coefficients between 0.5 and 0.7, and the above elements are significantly related at the P=0.05 level, indicating that they come from the same or similar sources. However, Cd is negatively correlated with other heavy metal elements, suggesting that Cd comes from a different source.

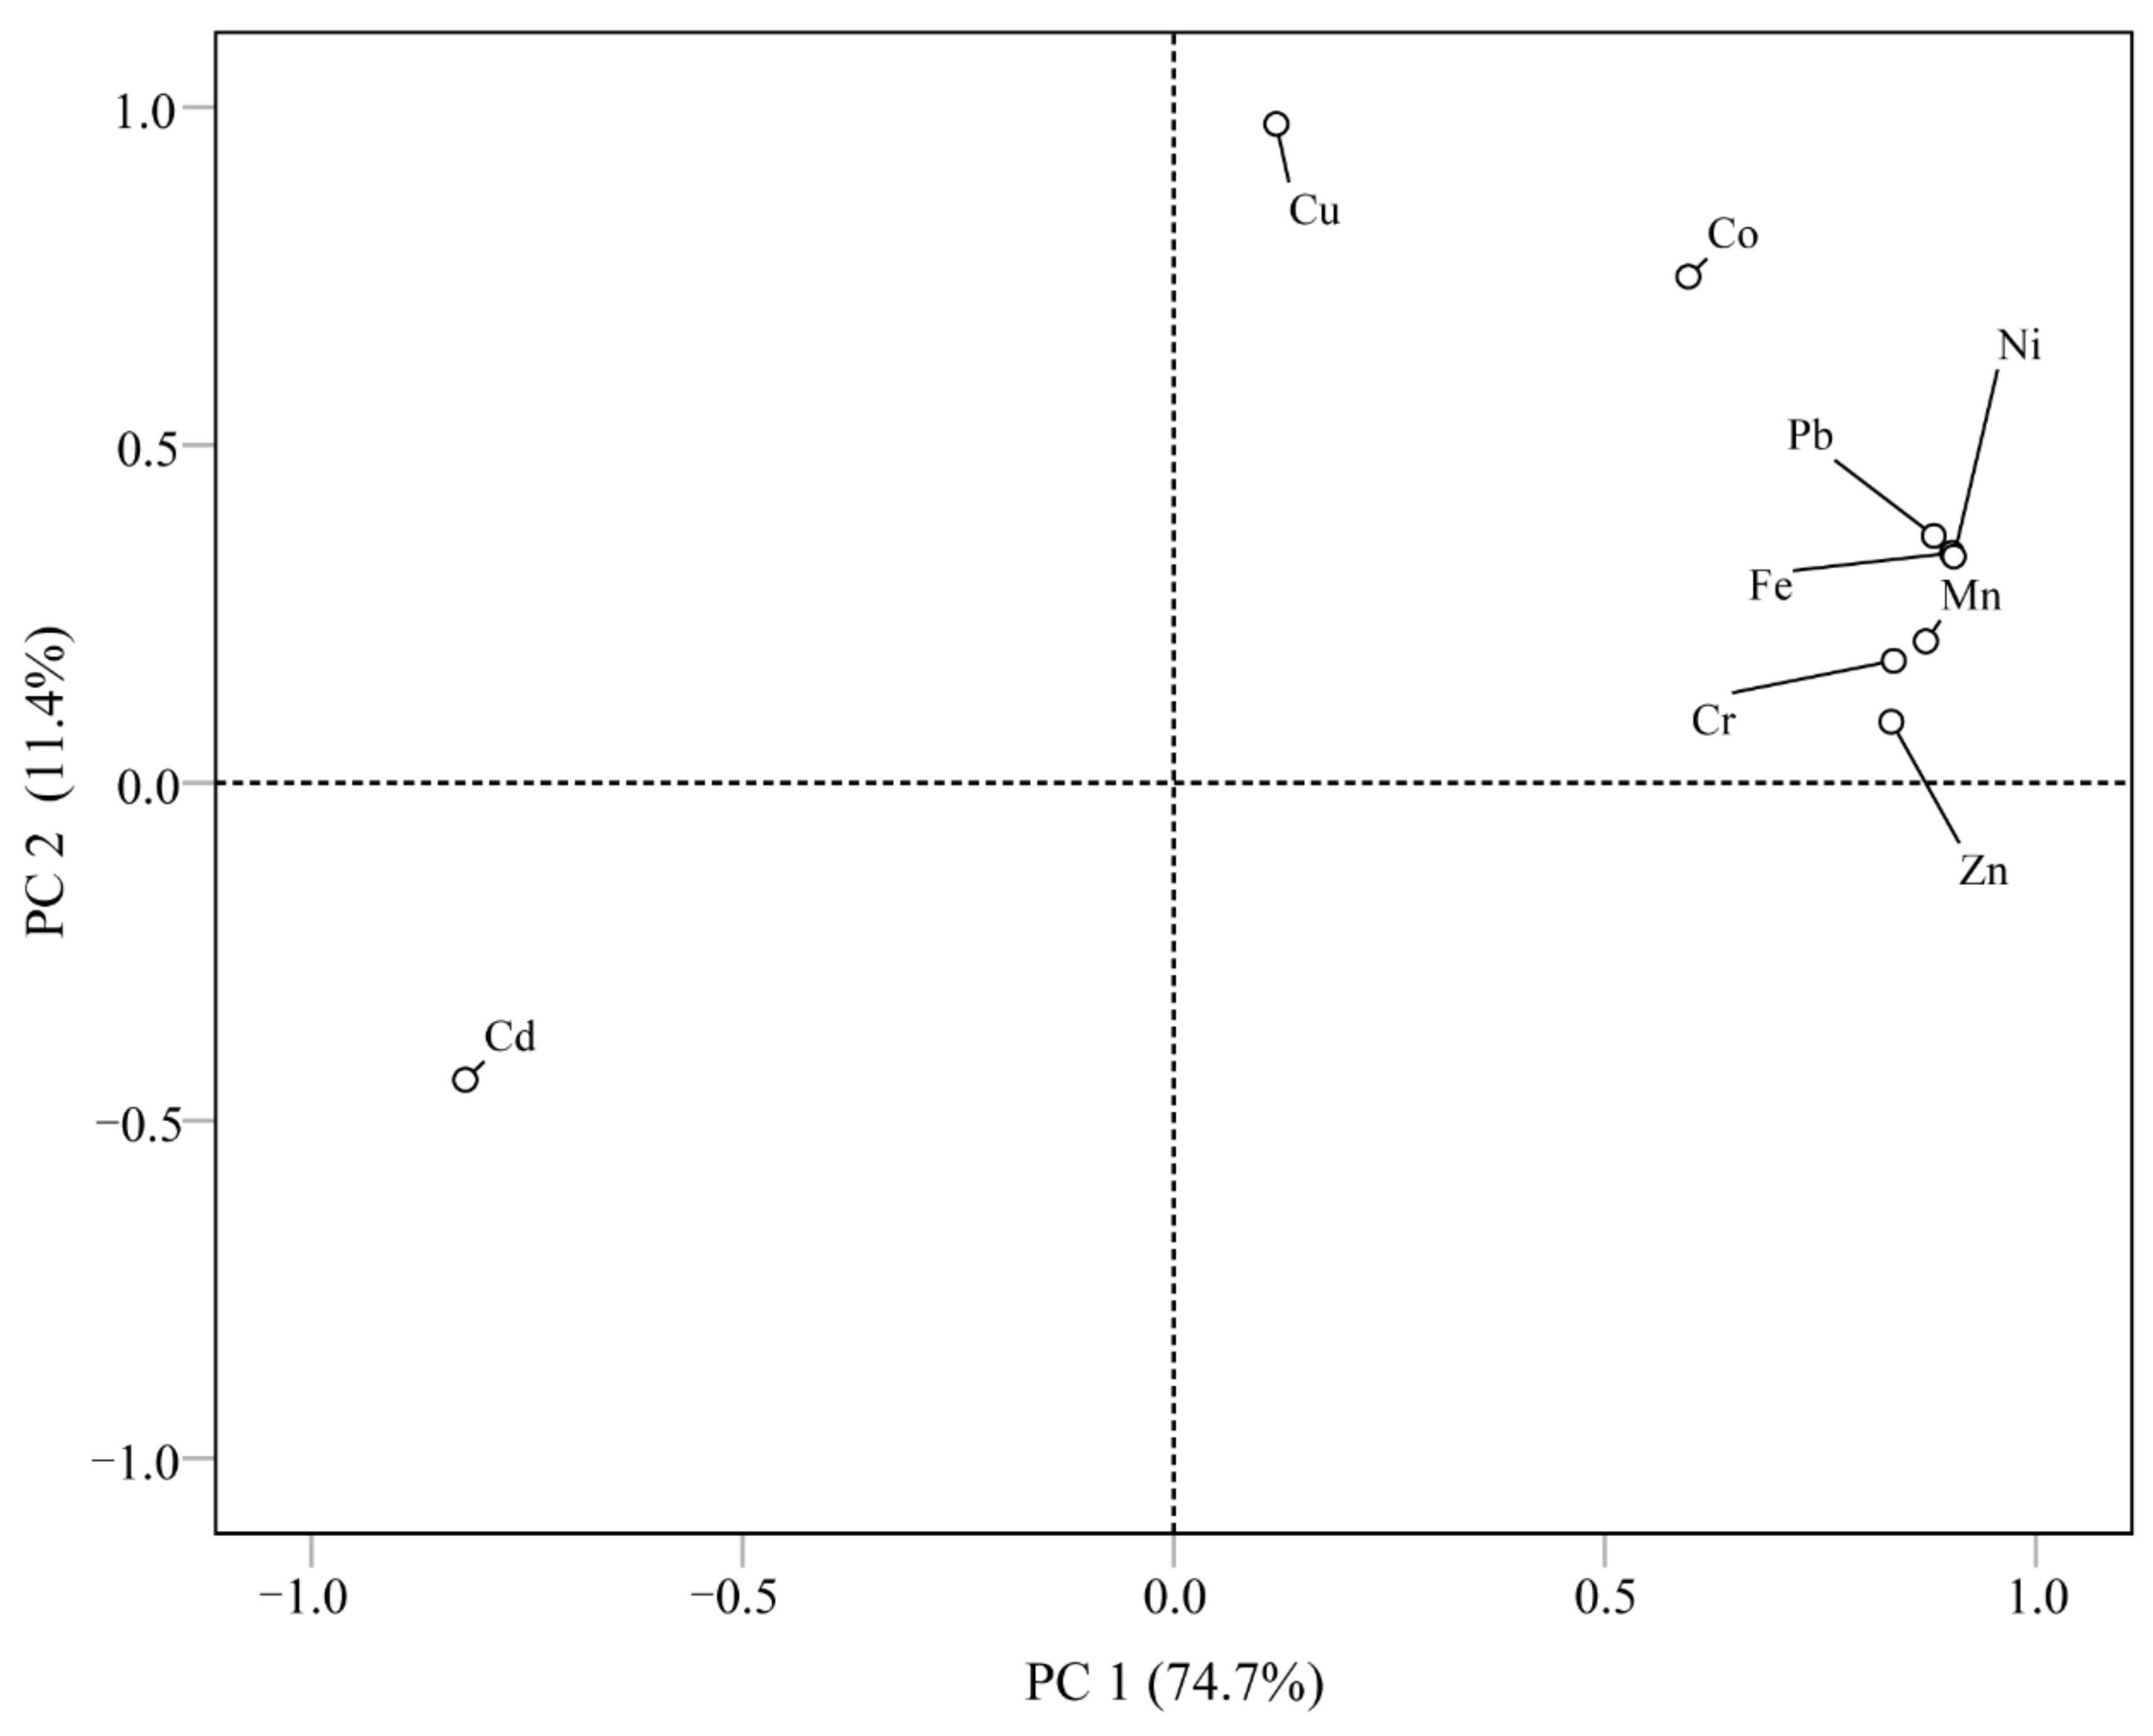
3.8.2. Principal Component Analysis (PCA) and Cluster Analysis (CA)

A multivariable statistical analysis can be used to analyze element interrelations and potential sources. Thus, PCA and CA were applied to a data set of 39 samples and nine heavy metals in order to determine the origins of heavy metals in the mangrove sediments from Nanliu River, and the results are shown in Figure 8 and Figure 9, respectively.
The PCA results passed the Bartlett sphericity tests (p < 0.001), demonstrating that PCA was suitable for assessing the heavy metals in these sediments. The trace metals in the sediments were recognized as two principal components in this study; the first principal component (PC1) and the second principal component (PC2) of the samples that explained the variance accounted for 74.7 % and 11.4 % of the total variance, respectively. Fe, Mn, Zn, Ni, Cr, and Pb were the dominant variables in PC1, indicating these metals may have the same source; Co and Cu were the dominant variables in PC2, showing that Co and Cu may have the same source; whereas Cd have highly negative loadings with other metals, depicting that Cd may have the different source. The PCA analysis results are highly consistent with the correlation of heavy metal elements (Table 6).
In general, the amount of Fe and Mn in the sediment is rarely greatly influenced by human activity [52], as their abundance is high, indicating that Fe and Mn represent a natural origin. However, Zn, Ni, Cr, and Pb content are mainly affected by human activities [53], suggesting that the first component represented both natural and anthropogenic sources. The enrichment of Co and Cu in the sediments of the Nanliu river estuary was high, suggesting that the second component mainly represented an anthropogenic source.
The results of CA show that the sources of heavy metal elements in Nanliu mangrove sediments can be divided into three categories. The first category includes Ni, Pb, Fe, Mn, Zn, and Cr. The above six heavy metal elements are closely related and may have similar or identical sources, which is consistent with the results of PCA. Fe and Mn are mainly derived from rock weathering, whereas Pb primarily comes from tail gas produced by coastal cars, ships, and agricultural machinery [54]. Furthermore, the presence of Ni in sediment may be due to petroleum-related activities [55], whereas Zn is commonly used as a hardness additive in automobile tires, antioxidant, and lubricant detergent, all of which produce Zn dust. As a result, such elements may be primarily derived from natural sources and the transportation industry.
The second category is Co and Cu, which may have similar or identical sources. Cu is commonly used in machinery manufacturing and electronic industry manufacturing, and there is a certain ship manufacturing distribution in the upper reaches of the estuary of the Nanliu River and surrounding areas, indicating that these elements may primarily come from ship manufacturing industrial activities.
The third category is Cd, which is a separate category, indicating that Cd may be different from other heavy metal elements and have a separate source. Chemical fertilizers, herbicides, and feeds all contain a certain amount of Cd, and farmland and aquaculture ponds are widely scattered along the Nanliu River’s estuary. As a result, agriculture and aquaculture may be the primary sources of Cd.

4. Conclusions

(1)
The mean values of Fe, Mn, Zn, Ni, Co, Cd, Cr, Cu, and Pb in the mangrove sediments of Nanliu River were as follows: Fe > Mn > Cu > Zn > Cr > Pb > Co > Ni > Cd. Fe, Zn, Co, Ni, Cr, Cu, and Pd are mainly in the residual speciation and are difficult to release, while Mn is mainly in the weakly acid-soluble speciation, and Cd is mainly in the reducible speciation, both of which have a significant secondary release potential.
(2)
The results of the Igeo index method show that Cu is moderately polluted, and Cd and Mn are slightly polluted. However, the results of RI showed that Cd > Cu > Pb > Co > Cr > Mn > Ni > Zn, and the potential environmental harm of Cd pollution is predominant. The distinction between the two evaluation methods is mainly caused by the high toxicity coefficient of Cd.
(3)
The results of the RAC analysis show that Mn is at a very high-risk level, Cu is at a medium-risk level, Cd and Pb are at a low-risk level, and Co, Zn, Ni, and Cr are at a risk-free level. A combination of heavy metal speciation, Igeo, RI, RAC, and ICF analysis suggests that Mn and Cd, which are predominantly in unstable speciation, are easily released in the environment and are therefore of high ecological risk, while Cu and Pb are also of some ecological risk and require precaution.
(4)
The results of the source analysis, based on correlation analysis and cluster analysis, show that Fe, Mn, Zn, Ni, Cr, and Pb may mainly originate from natural sources and the transportation industry, Co and Cu may mainly originate from ship manufacturing industrial activities, and Cd has a different source than heavy metal elements and may mainly originate from agriculture and aquaculture. The GCF and PLI results suggest that heavy metal enrichment and considerable ecological risk samples are located in the upper part of the region where there are frequent industrial and agricultural activities of the upstream ship manufacturing plant, as well as neighboring farmland and aquaculture ponds.

Author Contributions

B.C. conceived the research route of this article and wrote the manuscript. R.H. helps in the preparation of the paper and in checking the drafts of the paper. F.W. helps review the revised manuscript. G.H. helps with the convenience of the experiment. P.C. provided many constructive suggestions. All authors have read and agreed to the published version of the manuscript.

Funding

This research was funded by the Guangxi Natural Science Foundation, China (2020GXNSFBA297128), the Special Talent Project of Guangxi Science and Technology Base, China (Guike AD20238041), the Cultivation Project Jointly funded by Guangxi Natural Science Foundation (2019GXNSFAA245016) and the Innovative Train Program for Guangxi Province College Students (202011607292 and 202111607020).

Institutional Review Board Statement

Not applicable.

Informed Consent Statement

Not applicable.

Data Availability Statement

Data are available on request from the authors.

Acknowledgments

Thanks to Riming Wang for providing all relevant samples.

Conflicts of Interest

The authors declare no conflict of interest.

References

  1. Singh, J.K.; Yadav, A.K.; Gupta, S.; Verma, R. Heavy metal pollution in coastal environment and its remediation using mangroves: An eco-sustainable approach. Wetlands Conservation: Current Challenges and Future Strategies; John Wiley & Sons Ltd.: Hoboken, NJ, USA, 2021; Volume 8, pp. 201–228. [Google Scholar]
  2. Masnavi, M.R.; Amani, N.; Ahmadzadeh, A. Ecological landscape planning and design strategies for mangrove communities (Hara forests) in South-Pars special economic energy zone, Asalouyeh-Iran. Environ. Nat. Resour. Res. 2016, 6, 44–57. [Google Scholar] [CrossRef] [Green Version]
  3. Maurya, P.; Kumari, R. Toxic metals distribution, seasonal variations and environmental risk assessment in surficial sediment and mangrove plants (A. marina), Gulf of Kachchh (India). J. Hazard. Mater. 2021, 413, 125345. [Google Scholar] [CrossRef] [PubMed]
  4. Ranjan, P.; Ramanathan, A.L.; Kumar, A.; Singhal, R.k.; Datta, D.; Venkateshm, M. Trace metal distribution, assessment and enrichment in the surface sediments of Sundarban mangrove ecosystem in India and Bangladesh. Mar. Pollut. Bull. 2018, 127, 541–547. [Google Scholar] [CrossRef] [PubMed]
  5. Chandrasekaran, A.; Senthil Kumar, C.K.; Sathish, V.; Manigandan, S.; Tamilarasi, A. Effect of minerals and heavy metals in sand samples of Ponnai river, Tamil Nadu, India. Sci. Rep. 2021, 11, 1–14. [Google Scholar]
  6. Liu, Y.; Wang, Q.; Zhuang, W.; Yuan, Y.; Yuan, Y.; Jiao, K.; Wang, M.; Chen, Q. Calculation of Thallium’s toxicity coefficient in the evaluation of potential ecological risk index: A case study. Chemosphere 2018, 194, 562–569. [Google Scholar] [CrossRef]
  7. Aigberua, A.; Tarawou, T. Speciation and mobility of selected heavy metals in sediments of the nun river system, Bayelsa State, Nigeria. Environ. Toxicol. Stud. J. 2018, 2, 1–9. [Google Scholar]
  8. Ma, L.; Abuduwaili, J.; Liu, W. Spatial distribution and ecological risks of the potentially-toxic elements in the surface sediments of lake Bosten, China. Toxics 2020, 8, 77. [Google Scholar] [CrossRef]
  9. Guan, J.; Wang, J.; Pan, H.; Yang, C.; Qu, J.; Lu, N.; Yuan, X. Heavy metals in Yinma River sediment in a major Phaeozems zone, Northeast China: Distribution, chemical fraction, contamination assessment and source apportionment. Sci. Rep. 2018, 8, 1–11. [Google Scholar] [CrossRef] [Green Version]
  10. Jafarabadi, A.R.; Bakhtiyari, A.R.; Toosi, A.S.; Jadot, C. Spatial distribution, ecological and health risk assessment of heavy metals in marine surface sediments and coastal seawaters of fringing coral reefs of the Persian Gulf, Iran. Chemosphere 2017, 185, 1090–1111. [Google Scholar] [CrossRef]
  11. Nazeer, S.; Hashmi, M.Z.; Malik, R.N. Distribution, risk assessment, and source identification of heavy metals in surface sediments of River Soan, Pakistan. Clean–Soil Air Water 2016, 44, 1250–1259. [Google Scholar] [CrossRef]
  12. Saadati, M.; Soleimani, M.; Sadeghsaba, M.; Hemami, M.R. Bioaccumulation of heavy metals (Hg, Cd and Ni) by sentinel crab (Macrophthalmus depressus) from sediments of Mousa Bay, Persian Gulf. Ecotoxicol. Environ. Saf. 2020, 191, 211–228. [Google Scholar] [CrossRef]
  13. Khan, Y.K.; Toqeer, M.; Shah, M.H. Mobility, bioaccessibility, pollution assessment and risk characterization of potentially toxic metals in the urban soil of Lahore, Pakistan. Environ. Geochem. Health 2022, 45, 1–22. [Google Scholar] [CrossRef] [PubMed]
  14. Mukherjee, P.; Das, P.K.; Ghosh, P. The extent of heavy metal pollution by chemical partitioning and risk assessment code of sediments of sewage-fed fishery ponds at East Kolkata Wetland, a Ramsar Site, India. Bull. Environ. Contam. Toxicol. 2022, 108, 731–736. [Google Scholar] [CrossRef]
  15. Gan, H.; Lin, J.; Liang, K.; Xia, Z. Selected trace metals (As, Cd and Hg) distribution and contamination in the coastal wetland sediment of the northern Beibu Gulf, South China Sea. Mar. Pollut. Bull. 2013, 66, 252–258. [Google Scholar] [CrossRef]
  16. Yang, J.; Wang, W.; Zhao, M.; Chen, B.; Dada, O.A.; Chu, Z. Spatial distribution and historical trends of heavy metals in the sediments of petroleum producing regions of the Beibu Gulf, China. Mar. Pollut. Bull. 2015, 91, 87–95. [Google Scholar] [CrossRef]
  17. Lao, Q.; Su, Q.; Liu, G.; Shen, Y.; Chen, F.; Lei, X.; Qing, S.; Wei, C.; Zhang, C.; Gao, J. Spatial distribution of and historical changes in heavy metals in the surface seawater and sediments of the Beibu Gulf, China. Mar. Pollut. Bull. 2019, 146, 427–434. [Google Scholar] [CrossRef] [PubMed]
  18. Xu, D.; Wang, R.; Wang, W.; Ge, Q.; Zhang, W.; Chen, L.; Chu, F. Tracing the source of Pb using stable Pb isotope ratios in sediments of eastern Beibu Gulf, South China Sea. Mar. Pollut. Bull. 2019, 141, 127–136. [Google Scholar] [CrossRef] [PubMed]
  19. Wang, R.; Xu, D.; Ge, Q. Modern modes of sediment distribution and the anthropogenic heavy metal pollution record in northeastern Beibu Gulf, south China sea. Mar. Pollut. Bull. 2020, 150, 110694. [Google Scholar] [CrossRef]
  20. Chen, Z.; Huang, S.; Chen, L.; Chen, B.; Li, M.; Huang, H. Distribution, source, and ecological risk assessment of potentially toxic elements in surface sediments from Qingfeng River, Hunan, China. J. Soils. Sediments 2021, 21, 2686–2698. [Google Scholar] [CrossRef]
  21. Cuong, D.T.; Obbard, J.P. Metal speciation in coastal marine sediments from Singapore using a modified BCR-sequential extraction procedure. Appl. Geochem. 2006, 21, 1335–1346. [Google Scholar] [CrossRef]
  22. Chowdhury, A.; Naz, A.; Maiti, S.K. Bioaccumulation of potentially toxic elements in three mangrove species and human health risk due to their ethnobotanical uses. Environ. Sci. Pollut. Res. 2021, 28, 33042–33059. [Google Scholar] [CrossRef]
  23. Muller, G. Index of geoaccumulation in sediments of the Rhine River. Geojournal 1969, 2, 108–118. [Google Scholar]
  24. Lin, H.; Lan, W.; Feng, Q.; Zhu, X.; Zhao, B. Pollution and ecological risk assessment, and source identification of heavy metals in sediment from the Beibu Gulf, South China Sea. Mar. Pollut. Bull. 2021, 168, 112403. [Google Scholar] [CrossRef] [PubMed]
  25. Jiang, R.; Huang, S.; Wang, W.; Liu, Y.; Lin, C. Heavy metal pollution and ecological risk assessment in the Maowei sea mangrove, China. Mar. Pollut. Bull. 2020, 161, 111816. [Google Scholar] [CrossRef]
  26. Mondal, P.; Schintu, M.; Marras, B.; Bettoschi, A.; Biswas, J. Geochemical fractionation and risk assessment of trace elements in sediments from tide-dominated Hooghly (Ganges) River Estuary, India. Chem. Geol. 2020, 532, 119373. [Google Scholar] [CrossRef]
  27. Srilert, C.; Van, T.P. Spatial and temporal variabilities of surface water and sediment pollution at the main tidal-influenced river in Ca Mau Peninsular, Vietnamese Mekong Delta. J. Hydrol. Reg. Stud. 2022, 41, 101–133. [Google Scholar]
  28. Hakanson, L. An ecological risk index for aquatic pollution control. A sedimentological approach. Water Res. 1980, 14, 975–1001. [Google Scholar] [CrossRef]
  29. Huang, K.; Ma, L.; Abuduwaili, J.; Liu, W.; Issanova, G.; Saparov, G.; Lin, L. Human-induced enrichment of potentially toxic elements in a sediment core of lake Balkhash, the largest lake in Central Asia. Sustainability 2020, 12, 4717. [Google Scholar] [CrossRef]
  30. Perin, G.; Craboledda, L.; Lucchese, M.; Cirillo, R.; Orio, A.A. Heavy metal speciation in the sediments of northern Adriatic Sea. A new approach for environmental toxicity determination. Heavy Metals Environ. 1985, 2, 454–456. [Google Scholar]
  31. Zhang, G.; Bai, J.; Xiao, R.; Zhao, Q.; Jia, J.; Cui, B.; Liu, X. Heavy metal fractions and ecological risk assessment in sediments from urban, rural and reclamation-affected rivers of the Pearl River Estuary, China. Chemosphere 2017, 184, 278–288. [Google Scholar] [CrossRef]
  32. Ikem, A.; Egiebor, N.O.; Nyavor, K. Trace elements in water, fish and sediment from Tuskegee Lake, Southeastern USA. Water Air Soil Pollut. 2003, 149, 51–75. [Google Scholar] [CrossRef]
  33. Yao, Z.G.; Gao, P.; Zhang, J.L.; Li, B.L. Speciation of trace elements in sediments from Dongting Lake, central China. Water Pollution VIII: Modelling, Monitoring and Management; WIT Press: Chilworth, UK, 2006; Volume 95, pp. 119–128. [Google Scholar]
  34. Zhao, S.; Feng, C.; Yang, Y.; Niu, J.; Shen, Z. Risk assessment of sedimentary metals in the Yangtze Estuary: New evidence of the relationships between two typical index methods. J. Hazard. Mater. 2012, 241, 164–172. [Google Scholar] [CrossRef] [PubMed]
  35. Tomlinson, D.L.; Wilson, J.G.; Harris, C.R.; Jeffrey, D.W. Problems in the assessment of heavy-metal levels in estuaries and the formation of a pollution index. Helgol. Meeresunters. 1980, 33, 566–575. [Google Scholar] [CrossRef] [Green Version]
  36. Kumar, V.; Sharma, A.; Kaur, P.; Sidu, G.P.S.; Bali, A.S.; Bhardwaj, R.; Thukral, A.K.; Cerda, A. Pollution assessment of heavy metals in soils of India and ecological risk assessment: A state-of-the-art. Chemosphere 2019, 216, 449–462. [Google Scholar] [CrossRef] [PubMed]
  37. Shi, C.; Ding, H.; Zan, Q.; Li, R. Spatial variation and ecological risk assessment of heavy metals in mangrove sediments across China. Mar. Pollut. Bull. 2019, 143, 115–124. [Google Scholar] [CrossRef] [PubMed]
  38. Li, R.; Qiu, G.Y.; Chai, M.; Shen, X.; Zan, Q. Effects of conversion of mangroves into Gei Wai ponds on accumulation, speciation and risk of heavy metals in intertidal sediments. Environ. Geochem. Health 2019, 41, 159–174. [Google Scholar] [CrossRef]
  39. Zhang, Y.; Zhang, H.; Zhang, Z.; Liu, C.; Sun, C.; Zhang, W.; Marhaba, T. pH effect on heavy metal release from a polluted sediment. J. Chem. 2018, 18, 1–7. [Google Scholar] [CrossRef]
  40. Liu, M.; Chen, J.; Sun, X.; Hu, Z.; Fan, D. Accumulation and transformation of heavy metals in surface sediments from the Yangtze River estuary to the East China Sea shelf. Environ. Pollut. 2019, 245, 111–121. [Google Scholar] [CrossRef] [PubMed]
  41. Naz, A.; Chowdhury, A.; Mishra, B.K.; Karthikeyan, K. Distribution of heavy metals and associated human health risk in mine, agricultural and roadside soils at the largest chromite mine of India. Environ, Geochem. Health 2018, 40, 1–21. [Google Scholar] [CrossRef]
  42. Chai, M.; Li, R.; Ding, H.; Zan, Q. Occurrence and contamination of heavy metals in urban mangroves: A case study in Shenzhen, China. Chemosphere 2019, 219, 165–173. [Google Scholar] [CrossRef]
  43. Gopalakrishnan, G.; Wang, S.; Mo, L.; Zou, J. Distribution determination, risk assessment, and source identification of heavy metals in mangrove wetland sediments from Qi’ao Island, South China. Reg. Stud. Mar. Sci. 2020, 33, 100–112. [Google Scholar] [CrossRef]
  44. Zhou, X.; Wang, Y.P.; Song, Z. Heavy Metal Contamination and Ecological Risk Assessments in Urban Mangrove Sediments in Zhanjiang Bay, South China. ACS Omega. 2022, 24, 21306–21316. [Google Scholar] [CrossRef] [PubMed]
  45. Singh, J.K.; Kumar, P.; Kumar, R. Ecological risk assessment of heavy metal contamination in mangrove forest sediment of Gulf of Khambhat region, West Coast of India. SN Appl. Sci. 2020, 2, 1–11. [Google Scholar] [CrossRef]
  46. Sankarappan, R.; Gopalakrishnan, G.; Shanmugam, R.; Magalingam, R.; Ayyamperumal, R. Diffusion, textural characteristics, and source identification of the heavy metals in the Karankadu mangrove sediments, South India. Arab. J. Geosci. 2021, 14, 1–11. [Google Scholar] [CrossRef]
  47. Mondal, P.; Reichelt-Brushett, A.J.; Jonathan, M.P.; Babu, S.S.; Sarkar, S.K. Pollution evaluation of total and acid-leachable trace elements in surface sediments of Hooghly River Estuary and Sundarban Mangrove Wetland (India). Environ. Sci. Pollut. Res. 2018, 25, 5681–5699. [Google Scholar] [CrossRef] [PubMed]
  48. Al-Kahtany, K.; El-Sorogy, A.; Al-Kahtany, F.; Youssef, M. Heavy metals in mangrove sediments of the central Arabian Gulf shoreline, Saudi Arabia. Arab. J. Geosci. 2018, 11, 1–12. [Google Scholar] [CrossRef]
  49. Sun, J.; Yu, R.; Hu, G.; Su, G.; Zhang, Y. Tracing of heavy metal sources and mobility in a soil depth profile via isotopic variation of Pb and Sr. Catena 2018, 171, 440–449. [Google Scholar] [CrossRef]
  50. Bothner, M.H.; Ten Brink, M.B.; Manheim, F.T. Metal concentrations in surface sediments of Boston Harbor—Changes with time. Mar. Environ. Res. 1998, 45, 127–155. [Google Scholar] [CrossRef]
  51. Setia, R.; Marschner, P.; Baldock, J.; Chittleborough, D.; Smith, P.; Simth, J. Salinity effects on carbon mineralization in soils of varying texture. Soil Biol. Biochem. 2011, 43, 1908–1916. [Google Scholar] [CrossRef]
  52. Lin, C.; He, M.; Liu, X.; Guo, W.; Liu, S. Distribution and contamination assessment of toxic trace elements in sediment of the Daliao River System, China. Environ. Earth Sci. 2013, 70, 3163–3173. [Google Scholar] [CrossRef]
  53. Cao, Y.; Lei, K.; Zhang, X.; Xu, L.; Lin, C.; Yang, Y. Contamination and ecological risks of toxic metals in the Hai River, China. Ecotoxicol. Environ. Saf. 2018, 164, 210–218. [Google Scholar] [CrossRef] [PubMed]
  54. Badr, N.B.E.; El-Fiky, A.A.; Mostafa, A.R.; Al-Mur, B. Metal pollution records in core sediments of some Red Sea coastal areas, Kingdom of Saudi Arabia. Environ. Monit. Asses. 2009, 155, 509–526. [Google Scholar] [CrossRef] [PubMed]
  55. Vazquez, F.G.; Sharma, V.K. Major and trace elements in sediments of the Campeche Sound, southeast Gulf of Mexico. Mar. Pollut. Bull. 2004, 48, 87–90. [Google Scholar] [CrossRef]
Figure 1. The map showing the location and sampling sites in the Nanliu River estuary of the Beibu Gulf, South China. FAP: Farmland and aquaculture ponds; SM: ship manufacturing; IP: Industrial port; EIP: Electronic industrial.
Sustainability 14 09112 g001
Figure 2. The proportion distribution of heavy metals in four geochemical speciation at 13 sampling sites.
Sustainability 14 09112 g002aSustainability 14 09112 g002b
Figure 3. Box plots of the Igeo values for heavy metals in Mangrove surface sediments from the Nanliu river estuary of the Beibu Gulf, South China.
Sustainability 14 09112 g003
Figure 4. Potential ecological hazard index of heavy metals at different sampling sites.
Sustainability 14 09112 g004
Figure 5. Box plots of the RAC values for heavy metals in Mangrove surface sediments from the Nanliu river estuary of the Beibu Gulf, South China.
Sustainability 14 09112 g005
Figure 6. The global contamination factor (GCF) of heavy metals at different sampling sites.
Sustainability 14 09112 g006
Figure 7. The pollution load index of heavy metals in Mangrove surface sediments from the Nanliu river estuary of the Beibu Gulf, South China.
Sustainability 14 09112 g007
Figure 8. PCA loadings of components 1 and 2 for the nine heavy metals in surface sediments from the Nanliu river estuary of the Beibu Gulf, South China.
Sustainability 14 09112 g008
Figure 9. Cluster analysis results of heavy metals in mangrove sediments from the Nanliu river estuary of the Beibu Gulf, South China.
Sustainability 14 09112 g009
Table 1. Working Methods of Microwave Digester.
StepPower (W)Warming up Time (Min)Temperature (°C)Retention Time (Min)
1120061206
21200618015
Table 2. BCR extraction morphology, steps, and reagents.
Step (Fraction)ReagentProcedure
1 (F1: Exchangeable acid-soluble)0.11 mol/L CH3COOH20 mL CH3COOH + 1 g sample Shake at 220 rpm for 16 h
2 (F2: Reducible)0.5 mol/L NH2OH·HCl (pH = 1.5)20 mL NH2OH·HCl + residue from step1and shake at 220 rpm for 16 h
3 (F3: Oxidizable)30%H2O2, 1.0 mol/L NH4OAC (pH = 2)10 mL 30% H2O2 + residue from step2, 85 °C reaction for until nearly dry + 25 mL NH4OAC (pH = 2), shake at 220 rpm for 16 h
4 (F4: Residual)HNO3, HCl6 mL HNO3 + 3 mL HCl, microwave digestion
Table 3. Relationship between potential ecological hazard index and potential ecological hazard level.
ValueGrades of Ecological
Risk for a Single Metal
ValueGrades of Ecological
Risk for a Single Metal
E f i ≤ 30Low riskRI ≤ 70Low risk
30   <   E f i ≤ 60Moderate risk70 < RI ≤ 140Moderate risk
60   <   E f i ≤ 120Considerable risk140 < RI ≤ 280Considerable risk
120   <   E f i ≤ 240High riskRI ≥ 280Very high risk
E f i ≥ 240Very high risk
Table 4. Total Heavy Metals in Mangrove Surface Sediments of Nanliujiang River and Their Physical and Chemical Parameters (μg/g).
Itemμg/g%pH
FeMnZnCoNiCdCrCuPbSALTOC
Mean6148.18264.3428.187.605.700.1618.1854.8013.580.423.977.16
SD2952.76106.2212.683.112.250.015.755.212.760.132.200.33
Min3546.83129.4613.484.383.700.1612.0347.9610.820.232.136.38
Max11,809.07487.1251.2112.1611.510.1429.0162.7419.610.759.737.77
CV/%48.0340.1845.0140.9139.425.1031.659.5120.2931.1555.264.59
Table 5. Comparison of heavy metals concentrations in surface sediment in the various mangrove sediments around the world (μg/g).
LocationFeMnZnCoNiCdCrCuPb
Present study6148.18264.3428.187.605.700.1618.1854.8013.58
Maowei sea, China [25]-54016620.150.70.79096.561.948.9
Shenzhen Futian, China [42]-2351351-1175.7049.882.6105
Qi’ao Island, China [43]-1346.3241.7-50.49.5389.281.570.6
Zhanjiang Bay, China [44]---2.917.860.19-18.2420.07
Khambhat region Gulf, India [45]-669.01684.0220.24634.6550.08648.18911.6417.135
Karankadu, India [46]42,798485194-245-4727
Hooghly River Estuary and Sundarban, India [47]25,05051753.76-27.720.1729.7133.8814.27
Central Arabian Gulf shoreline, Saudi Arabia [48]7946.9122.528.353.9481.051.6750.65209.84.395
Table 6. Correlation between Physical and Chemical Parameters of Mangrove Sediments and Nine Heavy Metals in Nanliu River of the Beibu Gulf, South China.
pHSALTOCFeMnZnCoNiCdCrCuPb
pH1−0.733 **−0.749 **−0.713 **−0.425−0.484−0.305−0.711 **0.221−0.352−0.072−0.690 **
SAL 10.870 **0.730 **0.744 **0.584 *0.4490.817 **−0.3310.4990.3740.708 **
TOC 10.939 **0.842 **0.761 **0.703 **0.991 **−0.635 *0.734 **0.4320.950 **
Fe 10.838 **0.727 **0.799 **0.949 **−0.874 **0.782 **0.4170.947 **
Mn 10.707 **0.647 *0.848 **−0.789 **0.734 **0.3420.785 **
Zn 10.598 *0.768 **−0.688 **0.5530.2180.748 **
Co 10.754 **−0.803 **0.637 *0.762 **0.792 **
Ni 1−0.842 **0.773 **0.4490.963 **
Cd 1−0.815 **−0.514−0.847 **
Cr 10.2650.757 **
Cu 10.449
Pb 1
**. At the level of 0.01 (two tails), the correlation is significant, *. At the level of 0.05 (two tails), the correlation is significant.
Publisher’s Note: MDPI stays neutral with regard to jurisdictional claims in published maps and institutional affiliations.

