Abstract
The emission of GHG has been steadily increasing in the last few decades, largely facilitated by the transport sector, which has been responsible for more than two-thirds of the manmade emissions in Europe. In cities, one of the possible solutions to decrease the emissions from fossil fuel engines is to replace vehicles with electric ones. This solution can be applied to the urban public fleet, namely by replacing urban buses with electric vehicles. Thus, this research work focuses on the Portuguese case study, which serves as an example of achieving zero CO2 emissions from buses by 2034. This timeframe of replacing the current bus fleet, mostly powered by fossil fuels, with a fully electric fleet is proven to bring financial, environmental, and health benefits to the population. The pathway to the decarbonization of urban public transport will unequivocally contribute directly to the accomplishment of several UN Sustainable Development Goals (SDGs), such as the promotion of affordable and clean energy and sustainable cities and communities, as well as to the increasing climate action (SDGs 7, 11, and 13, respectively). In addition, it will provide an opportunity for the replacement of existing buses that are generally less efficient than electric buses, from both an energy and an environmental point of view. As a result of the methodology, the Portuguese urban bus fleet would be totally replaced by electric buses by 2034 (83% battery-electric and 17% hydrogen-electric), which results in zero CO2 emission from this type of public transport.
1. Introduction
The decarbonization of transport aims to contribute to the resolution of two very demanding social problems: the degradation of air quality due to pollution and the harmful effects of climate change [1].
The transport sector is the one that most depends on the use of fossil fuels, whose combustion results in the emission of carbon dioxide (CO2) and other greenhouse gases (GHG). The road transport sector is a major air pollutant in Europe, it is responsible for 72% of the total manmade emissions to the atmosphere [2]. Besides, over 50% of the manmade CO2 emissions are from the transport sector, specifically passenger vehicles [3].
Furthermore, the combustion process of motor vehicles causes the release or formation of other polluting species such as particulate matter (PM), nitrogen oxides (NOx), or ozone (O3). In urban areas, both private and public transports are a significant source of air pollutants, that are emitted as exhaust gases, and are combined with noise to have a degrading effect on environmental quality and human health [4,5,6]. All the pollution emitted from the use of fossil-fueled vehicles in cities results in the death of more than 7 million people every year worldwide [7]. In Europe, air pollution is considered the biggest environmental risk, which induces degradation in people’s lives and the premature death of about 400,000 people [5].
On the other hand, with the Paris Agreement at the Conference of the Parties (COP) of the United Nations Framework Convention on Climate Change (UNFCC), in 2015, the countries involved assumed the commitment to limit global warming by the end of the century to below 2 °C, trying to make an effort to reach the target of 1.5 °C. For this, countries should achieve carbon neutrality by 2050. Thus, to decrease the emission of air pollution from road vehicles, the European Union set an ambitious climate goal to reduce CO2 emissions by 40% in 2030 and 60% in 2040 [8,9]. To achieve these goals “clean technology” has to be developed and deployed, such as electric vehicles, which have the potential to attain sustainable results in combination with renewable and nonpolluting electric energy sources [10,11,12,13,14,15].
Some measures throughout the years have been taken in order to reduce the amount of air pollution emitted by vehicles in Europe, such as the establishment of emission standards for vehicle engines, which are the Euro vehicular standards. Although, the commitment to shift public transport from fossil-fueled engines to electric-powered batteries is a step forward toward the total decarbonization of the transport sector. The reduction and elimination of the use of fossil fuels as a source of energy for the movement of vehicles, through the adoption of renewable and sustainable sources, is the key to the definitive solution to the problems of GHG emissions and air pollution from transport, especially in what concerns urban public transport [16].
Focusing on the public transport sector, electrification has emerged as a leading option for decarbonizing ground transportation [17,18,19,20,21,22]. Nowadays, the leading commercial options are battery-electric vehicles (BEVs) and hydrogen fuel-cell vehicles (HFCVs) [23]. For BEVs, the propulsion is ensured exclusively by an electric motor, using electricity stored in an onboard battery that is charged through its own dedicated charging equipment. On the other hand, in HFCVs, propulsion is provided exclusively by an electric motor, using electricity generated onboard by a fuel cell powered by compressed hydrogen (H2) and using oxygen from the atmosphere. As with BEVs, this type of vehicle has no pollutant emissions associated with their trips, they only generate steam.
In Portugal, the current bus fleet, composed mostly of fossil-fueled vehicles, is seeing some development in the sense of becoming more sustainable in the future. Efforts have been made to shift the bus fleet to electric vehicles as a pathway to becoming a zero-emission public transport across the country. As of 2021, 55 urban buses that run in Portugal are electric, and the investments for this area will allow more electric vehicles to come, even full electrification of the fleet by 2034.
The present work is an extension of the urban bus fleet replacement and scraping methodology developed by Ribeiro and Mendes [24]. In the mentioned work, the authors presented a detailed study on the age distribution and fuel type of three categories of buses (i.e., minibuses, standard and articulated buses) to develop a methodology enabling the replacement and scrapping of all fossil-fuelled buses in Portugal in a timeframe of four-teen years. Such a study only focused on the timeline of the replacement of the old urban bus fleet with zero-emission engines (i.e., BEVs and HFCVs) and the estimated costs asso-ciated with its renewal. In the initial paper, the investment in the new bus fleet was esti-mated, based on the following indicators: Total Investment for Zero Emissions, Reference Value (maintenance of fossil fuels and CNG), and the difference between these two—the Cost of Decarbonization. However, the previous work [24] did not quantify the possible reduction in emissions achieved by the replacement and scraping of the entire Portuguese urban bus fleet with electric engines throughout the fourteen-year timeframe.
Thus, the present work aims to present a distinct methodology to estimate CO2e emis-sions for different buses, based on the fuel type and the CO2e emission factor for each EU-RO emission class. Using the same Portuguese case study presented in Ribeiro and Mendes [24], this paper takes a completely different approach by analysing and assessing the impact of the negative externalities of the fleet operation. For this purpose, CO2e emis-sions are estimated yearly for fourteen years to provide all pathways to the decarboniza-tion of the Portuguese urban bus fleet, with a special focus on the avoided CO2 emissions, and their respective costs. This research introduces a novel approach for studies on in-vestment in fleet scraping and replacement considering the price of carbon emissions in the European market.
Following this perspective, the present research work aims to:
- (i)
- Develop a novel methodology to quantify the possible CO2 reduction, i.e., carbon neutrality, from the complete replacement of the urban bus fleet in Portugal from die-sel and gas/CNG to fully electric buses, based on criteria for scraping and replacing the urban bus fleet with electric buses defined by Ribeiro and Mendes [24];
- (ii)
- Present the results of a full decarbonization of the urban bus fleet in Portugal as a way to demonstrate the feasibility of the methodology presented, namely in the re-duction in CO2 emissions and corresponding costs.
The paper is organized as follows. Section 2 presents a methodology for an urban bus fleet decarbonization process that includes the estimation of CO2 emissions and the re-spective decarbonization costs. In Section 3, a brief characterization of the urban bus fleet in Portugal is made. In Section 4, the criteria for scraping and replacing the urban bus fleet according to vehicle age are presented, based on the results presented in Section 3. Section 5 addresses the timeframe for the replacement of the bus fleet with electric engines throughout the years. Section 6 presents the main results of the application of the pro-posed methodology for the replacement of the bus fleet, namely CO2 emission reduction for the entire bus fleet (minibuses, standard and articulated buses), the total avoided CO2 emissions and the respective economic benefit of this reduction. Finally, Section 7 presents the main conclusions of this work.
2. Urban Bus Fleet Decarbonization Methodology
After addressing the issue of decarbonization of the transport sector, and in particular urban public transport, within the scope of the theme of combating climate change and reducing atmospheric pollution, the following methodological points are addressed in the next sections:
- (i)
- Characterization of the urban road public transport fleet in terms of vehicle typology, age, engine, and emission classes;
- (ii)
- Presentation of a scenario for the scraping and replacement of buses, based on maximum age and zero-emission engine criteria;
- (iii)
- Calculation of the trajectory over time from the reduction in CO2 emissions to the total decarbonization of the urban bus fleet for Portugal.
The methodology for the gradual decrease in GHG emission is divided into two different phases. First, the calendar for the replacement of the bus fleet is made to identify the number of urban buses that still generate CO2 emissions and the number of electric ones in the fleet. Next, the trajectory of the emission reduction is obtained according to the emission factor and the urban bus fleet. Figure 1 shows a flowchart of the methodology presented for this paper.
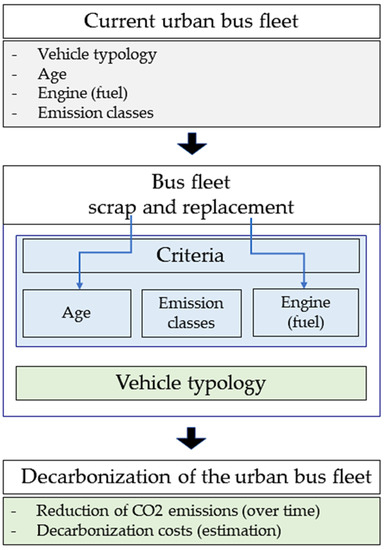
Figure 1.
Flowchart of the methodology for the bus fleet decarbonization.
CO2 Emission Factors for Urban Buses
A crucial part of the bus fleet decarbonization relies on the knowledge of the emissions made each year by the fossil-fuel engines. In order to achieve the current and future CO2 emission of the urban bus fleet, the CO2 emission factor for each type of bus must be correlated to the number of kilometres traveled each year. Table 1 shows the current factor that is used according to the classification of the engine for standard buses, which can range from Euro 0 to Euro VI [25]. The CO2 emission factor for minibuses and articulated buses is derived from the weighting of the values from standard buses according to their fuel consumption.

Table 1.
CO2 emission factor for standard buses.
In addition to the emission factor for buses according to their Euro classification, the annual kilometres traveled must be known in order to calculate the emissions from each bus type and Euro category. In Portugal, minibuses travel on average 30,000 km per year, while standard buses, which are the most common type of bus in the country, travel 50,000 km per year, which is the same amount that articulated buses travel. The annual kilometres traveled by each type of bus can be seen in Table 2. Although, as the kilometres traveled changes every year, a more accurate length of annual travel is used to calculate the CO2 emission in the results section.
Table 2.
Annual kilometres traveled by buses in Portugal.
3. Urban Bus Fleet in Portugal
The urban buses, then, are categorized into three different categories, which are: (i) minibuses—capacity of 20 to 50 passengers; (ii) standard buses—capacity of 50 to 105 passengers; and (iii) articulated buses—capacity higher than 105 passengers [26]. Data from 2020 shows that in Portugal there are currently 14,390 buses of all types, although only 5633 buses meet the urban bus criteria. The urban bus fleet comprises 509 mini (10%), 4808 standards (85%), and 316 (5%) articulated buses, with an average age of 11.6, 16.3, and 15.6 years, respectively, being the average age of the entire urban bus fleet which is 15.9 years old (Figure 2). A detailed description of the characteristics of the Portuguese urban bus fleet is provided elsewhere [24].
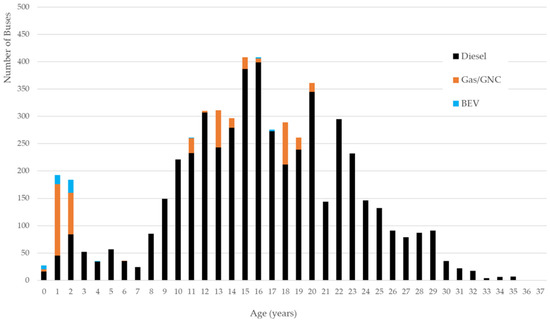
Figure 2.
Age distribution for the urban bus fleet.
Bus Emission Classification
The European Union has strict legislation that regulates the emission of pollutants from vehicles. Thus, manufacturers and companies must improve their engines to meet the specification set in Europe [27]. The Euro regulation that addresses pollutant emissions from vehicle engines is a clear commitment to the decrease in air pollution across Europe, whose benefits expand beyond the borders of the European Union, since most G20 members and several emerging economies in Asia and Latin America set standards based on the European-devised system [28].
The buses considered for purchase in the European Union follow the emission protocols set by the Euro standards since 1988, when Euro 0 was created, with the last update in 2014 with the advent of Euro VI [29].
In Portugal, most of the buses fall into Euro III and Euro II standards, which means that the engines need to be replaced with less pollutant ones. On the other hand, there is a growing number of buses in the Euro V and Euro VI categories. Table 3 and Figure 3 show the number of buses by the type of fuel and by each category of Euro standard in Portugal.
Table 3.
Bus classification under Euro standards in Portugal.
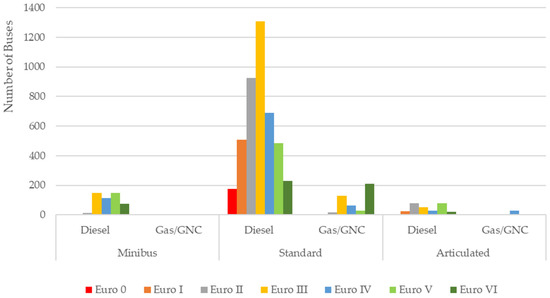
Figure 3.
Number of buses by category and type of fuel.
The distribution of the Portuguese bus fleet over Euro emission standards is not very different from the general panel in Europe, as 28% of all buses rely upon Euro III standards, 25% under Euro V, and 18% under Euro II [30]. However, the bus fleet must be renewed to reduce air pollution, which culminates in the replacement of fossil-fueled buses with electric ones that do not emit CO2 into the atmosphere. Thus, the next section of this paper presents a methodology and pathway to the full decarbonization of the Portuguese bus fleet.
4. Criteria for Scrap and Replacement of the Urban Bus Fleet According to Vehicle Age
The criteria for the bus fleet scrap and replacement in Portugal are presented to stim-ulate the sustainability of the urban public transport sector. Other criteria could have been selected, but the authors have already adopted and fully justified their choice, as dis-cussed in a previous paper [24]. Thus, a trajectory of scraping and replacement is defined to assure the complete decarbonization of the urban bus fleet, which will have a maximum age of fourteen years old by the end of the total replacement of fossil-fueled buses with electric buses. The age of scrap of buses is fixed at 14 years because it is two times the life cycle of an electric battery, whose replacement would cost as much as a new electric bus. After the first seven years of usage, only the battery is replaced in order to decrease the residue caused by the eventual disposal of the bus structure. However, after the second period of seven years, the bus in its totality is replaced.
Thus, for minibuses, all fossil-fueled and electric vehicles will be replaced by BEVs. Articulated vehicles fueled by fossil fuels will be replaced by HFCVs since BEVs are not suitable for this type of vehicle, which needs a bigger battery in order to move a large vehicle, and standard urban buses will be replaced by both BEVs and HFCVs, following the percentages presented in Table 4.
Table 4.
Criteria for scraping and replacement of the bus fleet.
Starting from 2021, all urban buses are replaced when they reach a predetermined age, starting with the oldest buses at a replacement rate that is economically feasible for the companies, until all buses older than fourteen years can be replaced. In the following years, the rule stays the same, which will allow all buses fueled by fossil fuels to be replaced by BEVs and HFCVs by 2028. However, for articulated vehicles, due to their size and weight, it is considered that an electric battery is not the most suitable option due to increasing operating costs from the weight of the batteries required for this type of bus. On the other hand, the market is now starting to develop articulated buses fueled by hydrogen. Thus, it is considered that the replacement only should start in 2024 to provide more time for the industry to prepare and respond to the market needs.
It is important to mention that for articulated buses, due to their dimension and weight, VEBs are not recommended, instead, for this type of bus, the recommended engine is the HFCVs. Thus, the replacement of articulated buses can be scheduled to start only in 2024, when hydrogen fuel-cell vehicles will be available in the market. On the other hand, it is expected that all fossil-fueled buses in Portugal will be replaced by BEVs and HFCVs by 2034.
In addition, the replacement of fossil-fueled engines for electric engines in buses will determine the improvement of charging stations and electric power stations as city and transport infrastructures, since the charging of bus batteries needs special power treatment.
5. Timeframe for the Replacement of the Bus Fleet
According to the projections for this research work, it is possible that in Portugal all bus fleets become zero emissions by 2034. The replacement of the current fossil-fueled bus fleet can occur following the criteria of the fourteen-year-old replacement, which means that when a bus reaches the age of fourteen years, it is going to be replaced by a new one that can contribute to the zero-emission criteria (i.e., a new fleet of electric buses). For this, all types of urban buses are going to be replaced, such as minibuses, standard buses, and articulated buses. More detailed information regarding the three categories of the urban bus fleet can be ob-tained elsewhere [24].
Considering the bus fleet in Portugal in 2020 (5633 vehicles), it is expected to take up to fourteen years to completely replace the entire urban bus fleet with electric engines. Figure 4 and Figure 5 show how the replacement would take place considering the entire fleet from 2020 to 2034.
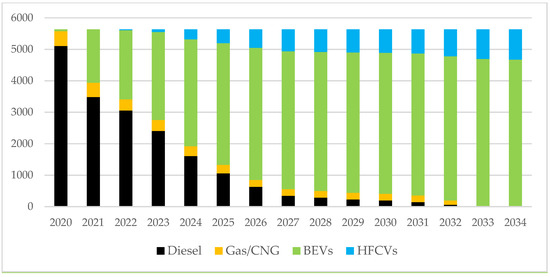
Figure 4.
Replacement of the bus fleet with electric engines throughout the years.
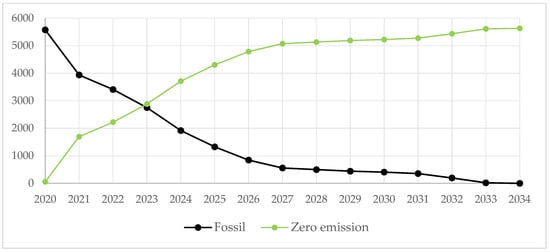
Figure 5.
Accumulated vehicles (fossil-fueled vs. zero-emission).
As it is possible to infer from Figure 4 and Figure 5, only in 2034 will diesel vehicles not be used in the urban bus fleet, which will represent the total conversion of the engines to electric-powered ones. This rate of replacement will define the decarbonization of the public transport of the entire country, which depends on the CO2e emission factor of each engine.
6. Results
This section shows the total annual CO2e (amount of gases equivalent to the quantity of carbon dioxide in the atmosphere) emissions for each type of bus and the differences in GHG emissions according to the number of buses that run with fossil fuels (emissions factor) and the kilometres traveled. Year by year, it is possible to see a decrease in pollutant emissions because of the replacement of fossil-fueled buses with electric vehicles.
For minibuses, it is possible to notice that the CO2e emission from diesel-fueled vehicles is greater than vehicles fueled by Gas/CNG. This difference in emission is because there are more diesel buses available that travel greater distances every year. The power of the decarbonization achieved by the replacement of the minibus fleet can be seen as early as the first five years, in which it is possible to observe a 56% reduction in CO2e emission, which represents fewer than 5451 tons of CO2e in the atmosphere. Table 5 and Figure 6 show year by year the difference in CO2e emission by minibuses according to the rate of vehicle replacement with sustainable technology.
Table 5.
CO2e emission reduction for minibuses.
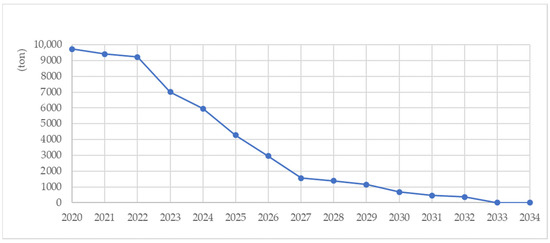
Figure 6.
Decrease in CO2e emission by minibuses.
For standard buses, the difference in CO2 emission is even greater than for minibuses. This type of bus is the most used in the country, which contributes to more pollution from the burning of both diesel and gas/CNG fuels. As it can be seen in Table 6, the drops in CO2 emission from standard buses represent a great decrease in air pollution from public urban transport. Only in the first five years of bus replacement there is a drop of more than 80% in the amount of CO2 emitted into the atmosphere. From Figure 7, it is possible to see a considerable drop in emissions from 2020 until 2026, when the number of fossil-fueled standard buses reaches a number below 500. The following years face a less accentuated decrease, however, the replacement of the remaining buses with electric engines allows reaching the milestone of zero CO2 emissions from standard buses in 2034, when all standard bus fleet will be composed of BEVs and HFCVs.
Table 6.
CO2e emission reduction for standard buses.
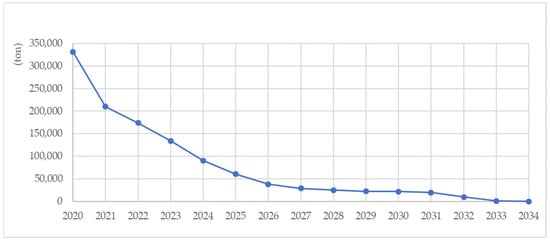
Figure 7.
Decrease in CO2e emission by standard buses.
For articulated buses, the decrease in CO2 emission is no different, however, as the replacement of the vehicles only starts in 2024, the pollution only starts to drop this year, as can be seen in Table 7 and Figure 8. Only in the first years of the bus fleet replacement more than 50% of pollution is reduced, when the decrease is more accentuated. The next years are marked by the reduction in the total emission of CO2 by articulated buses until the year 2034, when the entire articulated bus fleet will be replaced with electric engines that create zero emissions to the atmosphere.
Table 7.
CO2e emission reduction for articulated buses.
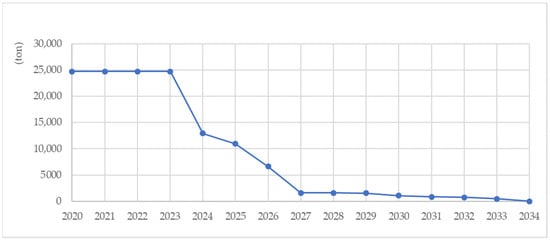
Figure 8.
Decrease in CO2e emission by articulated buses.
After evaluating the reduction in CO2 emission from different types of buses according to their specific rate of replacement for electric engines, the total reduction in all buses in Portugal shows a bigger picture of the benefits of the zero-emission pathways to achieve sustainable urban public mobility. The results in Table 8 and Figure 9 show the amount of CO2 that is not emitted as a result of the replacement of the bus fleet. At the end of 2034, when all buses will run on electricity, 1,356,884 tons of CO2e will be emitted in a timeframe of fourteen years. This same number also tells us that in the next fourteen years after the total zero-emission bus fleet replacement, the benefits in air quality will be considerable, since the expected pollution from urban public transport will be zero.
Table 8.
CO2 emission reduction for the entire bus fleet.
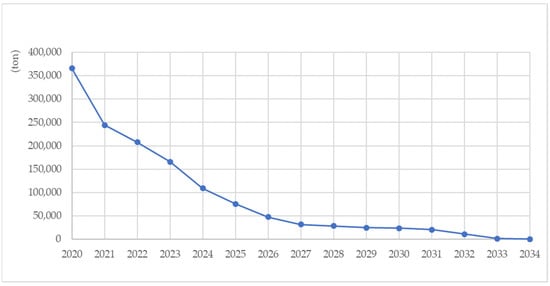
Figure 9.
The total decrease in CO2 emissions from buses.
In addition to the environmental benefits of the pathway to zero emission by the public urban bus fleet, the avoided emissions also represent savings for the economy of the country. Table 9 shows the value of avoided emissions to reflect what would be the cost of non-decarbonization and if the carbon emitted was valued at the price of the ton of carbon emitted on the European market (ETS). The value is calculated by multiplying the volume of emissions avoided by the estimated market price, starting from 50 euros in 2021 to 120 euros in 2030 [31].
Table 9.
Prevented CO2 emissions and their respective cost.
Both Table 9 and Figure 10 show the benefits of the total electrification of the bus fleet in Portugal, namely in economic terms as well as in environmental terms. At the end of the fourteen years of the bus fleet replacement, almost EUR 420,000,000 could be saved in CO2 emissions. In addition, the kilometers not traveled by fossil-fueled buses in the same timeframe represent a reduction of more than 4 million tons of CO2 emitted to the atmosphere.
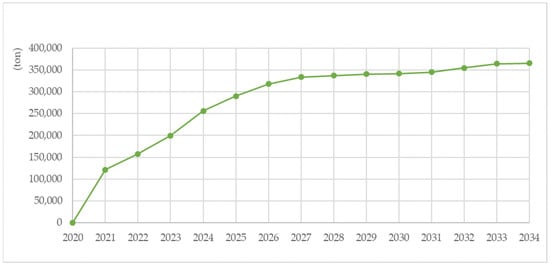
Figure 10.
Total avoided emissions by the replacement of the bus fleet.
7. Conclusions
The replacement of fossil fuels with electricity in urban public transport can make a very significant contribution to reducing GHG emissions, within the framework of the Portuguese National Energy and Climate Plan objectives [32], as well as to reducing atmospheric pollution in urban areas.
A previously published paper [24] addressed the methodological procedure for the replacement and scraping of urban buses and the associated costs, whereas the present paper mainly focuses on the environmental benefits (i.e., reduction in CO2 emissions) of a sustainable decarbonization process for the Portuguese urban bus fleet.
This research work innovatively shows and justifies the need to act in order to reduce the impact of public transport in view of the climatic challenges that humankind now faces.
In Portugal, the urban bus fleet was composed of 5633 vehicles on 31 December 2020, of which 509 were minibuses, 4808 were standard buses, and 316 were articulated buses. The average age of the bus fleet was 15.9 years, with 23% of the fleet over 21 years old. In the urban bus fleet (2020), 91% of vehicles were powered by diesel, 8% by natural gas, and 1% by electricity. Among fossil-powered vehicles, 39% met Euro IV or later standards, while 61% met Euro III or earlier standards.
From the methodology proposed in this research work, the replacement of the bus fleet follows the criteria of the complete decarbonization of the bus fleet by 2034, considering the maximum age of 14 years for vehicles. This would result in a decrease in the average age of vehicles from 15.9 years (2020) to a minimum of 4.3 years in 2026, reaching 9.9 years in 2034.
In the replacement of the fleet of 5,633 vehicles, 4,675 (83%) would be battery-electric, while 958 (17%) would be hydrogen-electric. After the first five years of the replacement of the bus fleet (in 2026), annual CO2 emissions would be reduced by 87%. By 2034, after which GHG emissions would be zero, the volume of avoided CO2eq emissions would be 4.1 million tons. Considering the price per ton of carbon to vary from EUR 50 to EUR 120, avoided emissions would have a reference value of EUR 417 M.
Following what was described in this research work, it is also important to measure the impact and how the decrease in other pollutants will occur with the replacement of the urban bus fleet, which will be the theme for future works.
In short, the replacement of the bus fleet in Portugal represents both environmental and economic benefits for all. The total zero-emissions bus fleet, despite the investments needed for it to occur, will bring, in the long term, savings and quality of life for its users and the population in general.
Author Contributions
Conceptualization, J.F.G.M. and P.J.G.R.; methodology, J.F.G.M. and P.J.G.R.; formal analysis, J.F.G.M. and P.J.G.R.; investigation, J.F.G.M. and P.J.G.R.; resources, J.F.G.M.; data curation, J.F.G.M. and P.J.G.R.; writing—original draft preparation, J.F.G.M. and P.J.G.R.; supervision, J.F.G.M. All authors have read and agreed to the published version of the manuscript.
Funding
This research was funded by Fundação Mestre Casais.
Institutional Review Board Statement
Not applicable.
Informed Consent Statement
Not applicable.
Data Availability Statement
Not applicable.
Acknowledgments
We would like to thank the data contribution from the Instituto da Mobilidade e dos Transportes, I.P.
Conflicts of Interest
The authors declare no conflict of interest.
References
- Varga, B.O.; Mariasiu, F.; Miclea, C.D.; Szabo, I.; Sirca, A.A.; Nicolae, V. Direct and Indirect Environmental Aspects of an Electric Bus Fleet under Service. Energies 2020, 13, 336. [Google Scholar] [CrossRef] [Green Version]
- European Environmental Agency Greenhouse Gas Emissions from Transport in Europe. Available online: https://www.eea.europa.eu/ims/greenhouse-gas-emissions-from-transport (accessed on 28 March 2022).
- OECD/IEA. Saving Oil in a Hurry; IEA: Paris, France, 2005; ISBN 9264109412. [Google Scholar]
- Jakub, S.; Adrian, L.; Mieczysław, B.; Ewelina, B.; Katarzyna, Z. Life Cycle Assessment Study on the Public Transport Bus Fleet Electrification in the Context of Sustainable Urban Development Strategy. Sci. Total Environ. 2022, 824, 153872. [Google Scholar] [CrossRef] [PubMed]
- Kumbaroǧlu, G.; Canaz, C.; Deason, J.; Shittu, E. Profitable Decarbonization through E-Mobility. Energies 2020, 13, 4042. [Google Scholar] [CrossRef]
- Ribeiro, P.; Fonseca, F.; Santos, P. Sustainability Assessment of a Bus System in a Mid-Sized Municipality. J. Environ. Plan. Manag. 2020, 63, 236–256. [Google Scholar] [CrossRef]
- WHO. New WHO Global Air Quality Guidelines Aim to Save Millions of Lives from Air Pollution. Available online: https://www.who.int/news/item/22-09-2021-new-who-global-air-quality-guidelines-aim-to-save-millions-of-lives-from-air-pollution (accessed on 28 March 2022).
- European Commission. EU Action on Climate Change; European Commission: Brussels, Belgium, 2019. [Google Scholar]
- Perissi, I.; Jones, A. Investigating European Union Decarbonization Strategies: Evaluating the Pathway to Carbon Neutrality by 2050. Sustainability 2022, 14, 4728. [Google Scholar] [CrossRef]
- Göhlich, D.; Kunith, A.; Ly, T. Technology Assessment of an Electric Urban Bus System for Berlin. WIT Trans. Built Environ. 2014, 138, 137–149. [Google Scholar] [CrossRef] [Green Version]
- Nanaki, E.A.; Koroneos, C.J.; Roset, J.; Susca, T.; Christensen, T.H.; De Gregorio Hurtado, S.; Rybka, A.; Kopitovic, J.; Heidrich, O.; López-Jiménez, P.A. Environmental Assessment of 9 European Public Bus Transportation Systems. Sustain. Cities Soc. 2017, 28, 42–52. [Google Scholar] [CrossRef]
- Kenworthy, J.R.; Svensson, H. Exploring the Energy Saving Potential in Private, Public and Non-Motorized Transport for Ten Swedish Cities. Sustainability 2022, 14, 954. [Google Scholar] [CrossRef]
- Sovacool, B.K.; Noel, L.; Kester, J.; Zarazua de Rubens, G. Reviewing Nordic Transport Challenges and Climate Policy Priorities: Expert Perceptions of Decarbonisation in Denmark, Finland, Iceland, Norway, Sweden. Energy 2018, 165, 532–542. [Google Scholar] [CrossRef] [Green Version]
- Ribeiro, P.; Dias, G.; Pereira, P. Transport Systems and Mobility for Smart Cities. Appl. Syst. Innov. 2021, 4, 61. [Google Scholar] [CrossRef]
- Dzikuć, M.; Miśko, R.; Szufa, S. Modernization of the Public Transport Bus Fleet in the Context of Low-Carbon Development in Poland. Energies 2021, 14, 3295. [Google Scholar] [CrossRef]
- Liu, J.; Cui, J.; Li, Y.; Luo, Y.; Zhu, Q.; Luo, Y. Synergistic Air Pollutants and GHG Reduction Effect of Commercial Vehicle Electrification in Guangdong’s Public Service Sector. Sustainability 2021, 13, 11098. [Google Scholar] [CrossRef]
- Ku, A.Y.; Souza, A.; McRobie, J.; Li, J.X.; Levin, J. Zero-Emission Public Transit Could Be a Catalyst for Decarbonization of the Transportation and Power Sectors. Clean Energy 2021, 5, 492–504. [Google Scholar] [CrossRef]
- Lajunen, A.; Lipman, T. Lifecycle Cost Assessment and Carbon Dioxide Emissions of Diesel, Natural Gas, Hybrid Electric, Fuel Cell Hybrid and Electric Transit Buses. Energy 2016, 106, 329–342. [Google Scholar] [CrossRef]
- Li, X.; Castellanos, S.; Maassen, A. Emerging Trends and Innovations for Electric Bus Adoption—A Comparative Case Study of Contracting and Financing of 22 Cities in the Americas, Asia-Pacific, and Europe. Res. Transp. Econ. 2018, 69, 470–481. [Google Scholar] [CrossRef]
- Kwon, Y.; Kim, S.; Kim, H.; Byun, J. What Attributes Do Passengers Value in Electrified Buses? Energies 2020, 13, 2646. [Google Scholar] [CrossRef]
- Lefèvre, J.; Briand, Y.; Pye, S.; Tovilla, J.; Li, F.; Oshiro, K.; Waisman, H.; Cayla, J.M.; Zhang, R. A Pathway Design Framework for Sectoral Deep Decarbonization: The Case of Passenger Transportation. Clim. Policy 2021, 21, 93–106. [Google Scholar] [CrossRef]
- Verbrugge, B.; Hasan, M.M.; Rasool, H.; Geury, T.; el Baghdadi, M.; Hegazy, O. Smart Integration of Electric Buses in Cities: A Technological Review. Sustainability 2021, 13, 12189. [Google Scholar] [CrossRef]
- Islam, A.; Lownes, N. When to Go Electric? A Parallel Bus Fleet Replacement Study. Transp. Res. Part D Transp. Environ. 2019, 72, 299–311. [Google Scholar] [CrossRef]
- Ribeiro, P.J.G.; Mendes, J.F.G. Public Transport Decarbonization via Urban Bus Fleet Replacement in Portugal. Energies 2022, 15, 4286. [Google Scholar] [CrossRef]
- Agência Portuguesa do Ambiente. National Inventory Report 2021 Portugal; Agência Portuguesa do Ambiente: Lisbon, Portugal, 2021. [Google Scholar]
- Ferraz, A.; Torres, I. Transporte Público Urbano, 2nd ed.; Rima: São Carlos, SP, Brazil, 2004. [Google Scholar]
- EEA. Road Transport 2019. In EMEP/EEA Air Pollutant Emission Inventory Guidebook 2019—Update October 2020; European Environmental Agency: Copenhagen, Denmark, 2019; Volume 53, pp. 1689–1699. [Google Scholar]
- Mulholland, E.; Miller, J.; Braun, C.; Jin, L.; Rodríguez, F. Quantifying the Long-Term Air Quality and Health Benefits from Euro 7/VII Standards in Europe; International Cuoncil on Clean Transportation: Berlin, Germany, 2021. [Google Scholar]
- UNECE. UNECE to Adopt New Ceilings of Emissions for Trucks and Buses. Available online: https://unece.org/transport/press/unece-adopt-new-ceilings-emissions-trucks-and-buses (accessed on 31 March 2022).
- UITP. Bus Systems in Europe: Towards a Higher Quality Of Urban Life and a Reduction of Pollutants and CO₂ Emissions; UITP Europe: Brussels, Belgium, 2015. [Google Scholar]
- OECD. Effective Carbon Rates 2021: Pricing Carbon Emissions through Taxes and Emissions Trading; OECD Publishing: Paris, France, 2021. [Google Scholar]
- República Portuguesa. Plano Nacional Energia-Clima; República Portuguesa: Lisbon, Portugal, 2019. [Google Scholar]
Publisher’s Note: MDPI stays neutral with regard to jurisdictional claims in published maps and institutional affiliations. |
© 2022 by the authors. Licensee MDPI, Basel, Switzerland. This article is an open access article distributed under the terms and conditions of the Creative Commons Attribution (CC BY) license (https://creativecommons.org/licenses/by/4.0/).