Article

Water Yield Alteration in Thailand’s Pak Phanang Basin Due to Impacts of Climate and Land-Use Changes

by
Rungruang Janta
1,2,
Laksanara Khwanchum
1,2,*,
Pakorn Ditthakit
2,3,
Nadhir Al-Ansari
4 and
Nguyen Thi Thuy Linh
5
1
School of Languages and General Education, Walailak University, Nakhon Si Thammarat 80160, Thailand
2
Center of Excellence in Sustainable Disaster Management, Walailak University, Nakhon Si Thammarat 80160, Thailand
3
School of Engineering and Technology, Walailak University, Nakhon Si Thammarat 80160, Thailand
4
Department of Civil, Environmental and Natural Resources Engineering, Lulea University of Technology, 97187 Lulea, Sweden
5
Institute of Applied Technology, Thu Dau Mot University, Thu Dau Mot 75000, Vietnam
*
Author to whom correspondence should be addressed.
Sustainability 2022, 14(15), 9106; https://doi.org/10.3390/su14159106
Submission received: 25 May 2022 / Revised: 15 July 2022 / Accepted: 20 July 2022 / Published: 25 July 2022

Abstract

:
Climate and land-use change are important factors in the hydrological process. Climatic and anthropic changes have played a crucial role in surface runoff changes. The objective of this research was to apply land-use change and future climate change to predict runoff change in the Pak Phanang River Basin. The Cellular Automata (CA)-Markov model was used to predict the land-use change, while the climate data from 2025 to 2085 under RPC2.6, RPC4.5, and RPC8.5 were generated using the MarkSim model. Additionally, the Soil and Water Assessment Tool (SWAT) combined land-use change and the generated meteorological data to predict the runoff change in the study area. The results showed that the annual runoff in the area would increase in the upcoming year, which would affect the production of field crops in the lowland area. Therefore, a good water drainage system is required for the coming years. Since the runoff would be about 50% reduced in the middle and late 21st century, an agroforestry system is also suggested for water capturing and reducing soil evaporation. Moreover, the runoff change’s overall impact was related to GHG emissions. This finding will be useful for the authorities to determine policies and plans for climate change adaptation in the Malay Peninsula.

1. Introduction

The watershed is a natural water support area from the rainfall, which flows into the channel or stream and to the mainstream. Runoff storage is an important primary water volume that flows into natural or man-made reservoirs, storing water for various purposes. The process of water recirculation takes place in the process from precipitation entering the system to flowing in streams by surface runoff and interflow out of the basin system. Some parts of the water are absorbed into the soil profile with vegetation cover as an important mechanism, including the infiltration process and soil moisture content. Any area with a tree canopy serves to intercept rainwater partially stuck on the canopy. The process of interception also reduces the initial impact and slows the through and stem fall to the ground gradually, which is part of the hydrological process [1,2].
The Intergovernmental Panel on Climate Change (IPCC) report (2020) shows that the global temperature has increased by about 1.1 °C from 1850 to 1900, and it is expected to reach 1.5 °C or more in the next 20 years. Numerous studies have investigated the impact of global warming on water resources, particularly surface runoff [3,4,5,6,7]. Climate-related factors such as air temperature, relative humidity, water evaporation rate, and wind speed can contribute to water evaporation. As a result, the water level in the streams has decreased gradually. Especially in the dry season, even if it heavily rains until there is surface runoff, there is still an effect from the heat of the air. The rate of water evaporation, wind speed, and relative humidity of the air allow the rainwater that falls to evaporate as more water vapor enters the atmosphere due to climate factors [8]. The most significant and noticeable global climate change is the increase in air temperature, which is consistent with human activities that release greenhouse gases that rise steadily [9,10].
Recently, human activities that result in land-use and land cover (LULC) changes have played a crucial role in surface runoff changes. The natural environment of different areas has changed over time from the past to the present. Changes in the economy, society, education, agriculture (including the climate, soil, water, mineral environment), and land-use conditions have effected LULC changes [11,12]. Due to the growth in the economic and social development of the country and the world, the amount of runoff in the hydrological process (that is, the amount of runoff production) has changed. Some places have imbalances in the water cycle, causing some areas to flood in the flooding season and other areas to suffer from drought, which results in water use conflicts. Therefore, it is necessary to manage water in the watershed area to be balanced and sufficient for use in various activities with regard to LULC changes [13,14].
An increase in global temperature is related to the amount of atmospheric greenhouse gas concentration. The IPCC’s Fifth Assessment Report (AR5) projected a rise in the global mean temperature by the late 21st century based on scenarios of the emission and concentration of atmospheric greenhouse gases or the Representative Concentration Pathways (RCPs). Each scenario may provide a different impact on regional hydrology. In order to understand the impact of future climate change and land-use change on hydrology in the Malay Peninsula particularly, this study focuses on Thailand, which was 19th in the list of countries most affected by extreme events in the period 2000–2019 [15]. This study aims to forecast future runoff change in the Malay Peninsula (Thailand) under three scenarios (RCP2.6, RCP4.5, and RCP8.5) that alter land-use. The Pak Phanang River Basin was selected for evaluation because this area consists of various land-use types and climates based on terrain types. The results might provide information for improving policies and plans on climate change adaptation in the Malay Peninsula.

2. Materials and Methods

This study used various models to simulate the land-use change and weather information and predict the runoff change in the future. The MarkSim model was developed at the International Centre for Tropical Agriculture (CIAT) to simulate the weather data for the crop model [16]. The model combines both climate models and RCP scenarios to generate the daily weather in the future. MarkSimGCM used a dataset of interpolated surface weather from about 10,000 stations around the world to generate daily data for multiple years and at any point in the world. In this study, the MarkSim model was used to simulate the future climate factors (i.e., precipitation and temperature).
A hydrological model (Soil and Water Assessment Tool; SWAT) is important for assessing water resources to plan and manage current and future water resources. This hydrological model can analyze watersheds with a distributed parameter model and assess watershed conditions with hydrological complexity [17]. It was applied to predict uncertainties of future runoff under LULC and climate changes. The overall procedures are presented as follows: (1) collecting data (i.e., Digital Elevation Model; DEM, Soil series, LULC, Weather information, Runoff data), (2) studying the general condition of the Pak Phanang River Basin in Nakhon Si Thammarat Province, (3) analyzing and preparing the required data in the SWAT model, (4) importing the data into the SWAT model, (5) studying the sensitivity of the parameters in the SWAT model, (6) calibrating the model, (7) testing the reliability of the model, and (8) applying the model under changing future conditions. This study projected future LULC changes from the past to present land-use projections. Then, it predicted the amount of runoff under the LULC changes. Next, it created a projection of the future climate change from projected minimum controlled greenhouse gas emissions (RCP2.6) if the highest levels of greenhouse gas emissions (RCP8.5) were already projected. The results of both forecasts were used to estimate runoff volumes with the SWAT model, as shown in the study framework in Figure 1.

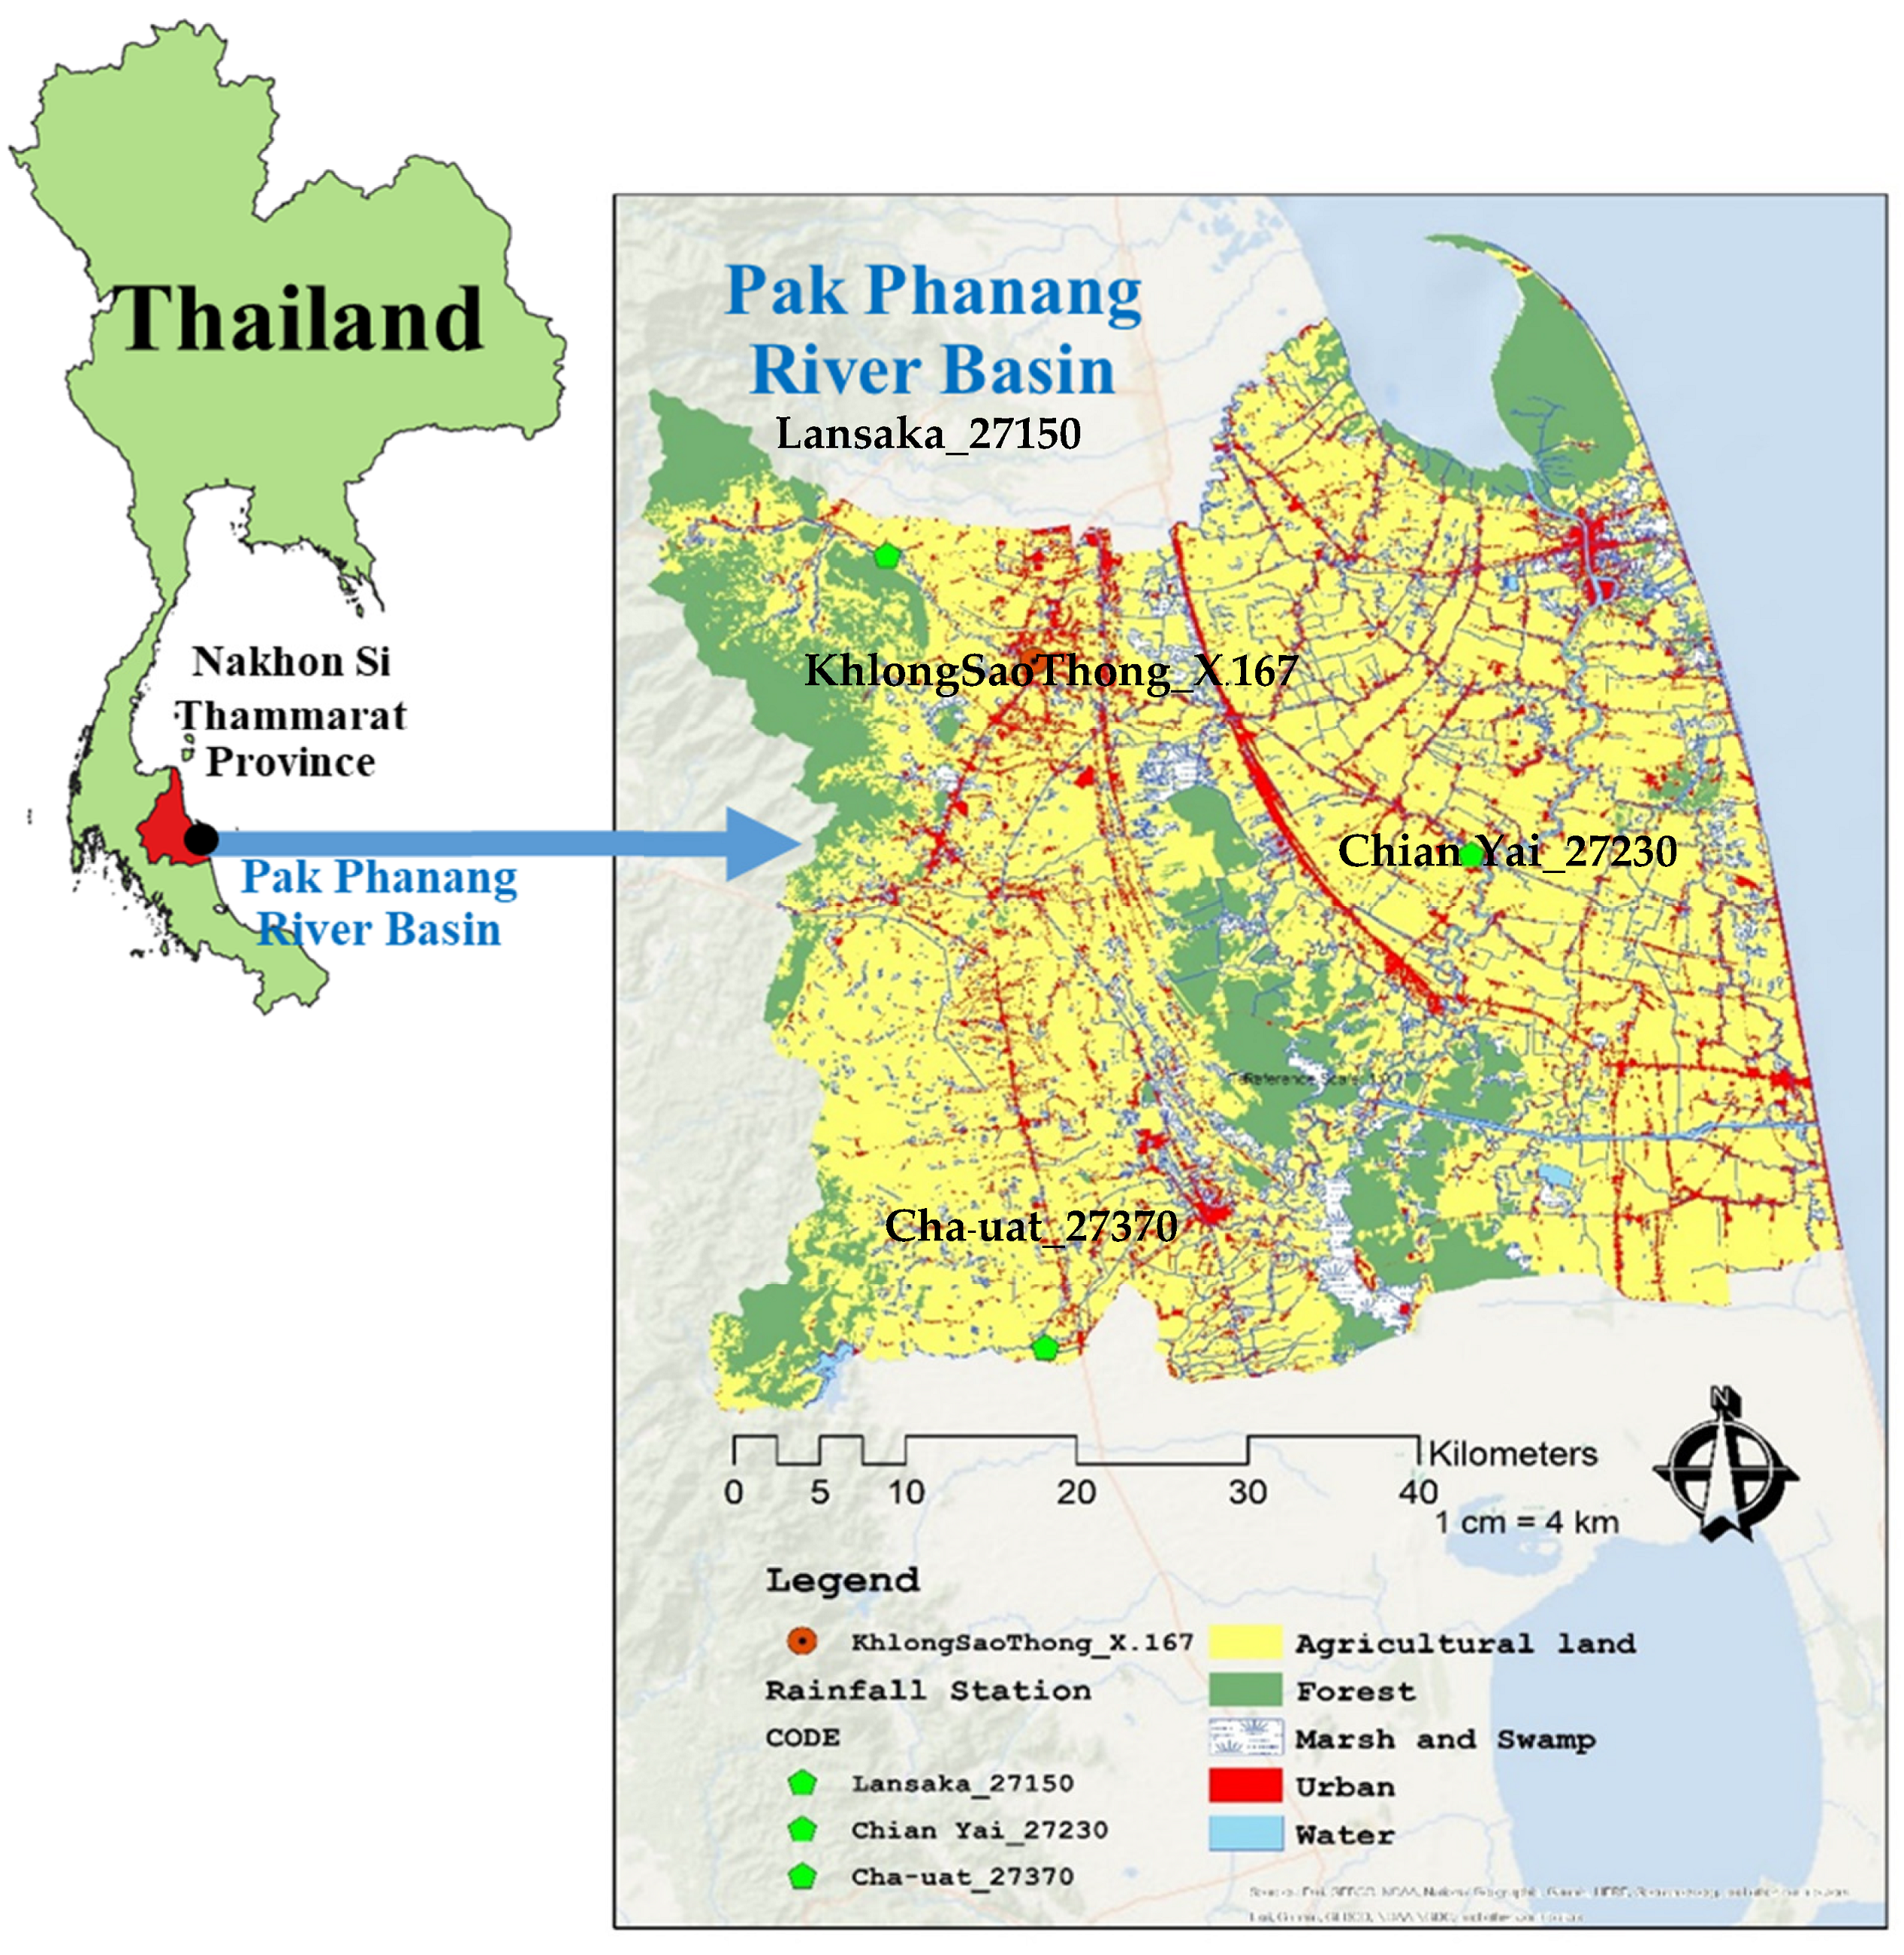
2.1. Description of the Study Area

The Pak Phanang River Basin is located in the eastern coastal plain in the southern part of Nakhon Si Thammarat Province. It has an area of about 3122 square kilometers [18]. The watershed area is divided into three parts; the upper part is a high mountainous area, which is an area parallel to the coast. The middle part is an undulating area. The lower watershed is a lowland area adjacent to the Eastern Seaboard. Although most of the population is involved in agriculture, there has been low productivity because the area is a flood plain with acidic soil (pH = 5.5) and low fertility [19,20]. There is also flooding during the rainy season and water shortages during the dry season. The Pak Phanang River is the main river in this area, flowing from the western side to the Gulf of Thailand on the eastern side of the basin. Community areas are located along the Pak Phanang River. The other land use in the Pak Phanang River Basin varies according to plant species and depending on the topography of the basin. The high mountainous area is naturally forested in the west of the watershed and gradually slopes down to the plains in the east. Most of the plains are located in the middle and to the east of the basin, and are mostly used for farming. Some are mangrove areas and include the Nipa palm (Nypa fruticans Wurmb) in the middle of the basin. In Ron Phibun and Cha-uat districts, there are marshy areas with waterlogging at certain times of the year. This area includes the Melaleuca Forest, which has been cleared to become deserted rice fields with scattered seeds and saplings. The high area from the undulating slo pes to the foot of the hill is mostly rubber, coconut, and mixed plantations with villages scattered everywhere. The coastal areas include shrimp farms and mangrove forests as part of the land use in the Pak Phanang River Basin [19,20], as shown in Figure 2.
In addition, the watershed area also has land utilization activities that change from forest to agricultural land or commercial land. This causes the area to absorb water at a reduced rate or not be able to absorb rainwater. In the agricultural area, when more rain falls, the forest area is reduced and the use of machinery in the agricultural area makes the ground compact. The soil absorbs less rainwater; as the rain falls, there are no trees or soil to absorb the water. This results in the topsoil running off and flowing into the lower areas. Most buildings or structures use materials that do not absorb rainwater, such as cement floors, parking lots, concrete roads, and steel construction. Since the falling rain flows together, it results in a large amount of ground runoff while the surface runoff worsens. Falling rain into lowlands erodes and carries away sediments rich in plant nutrients from the decomposition and decay of plant residues, causing soil loss and erosion. Water and nutrients are also removed from agricultural forest areas due to soil erosion in the Pak Phanang River Basin [21,22].

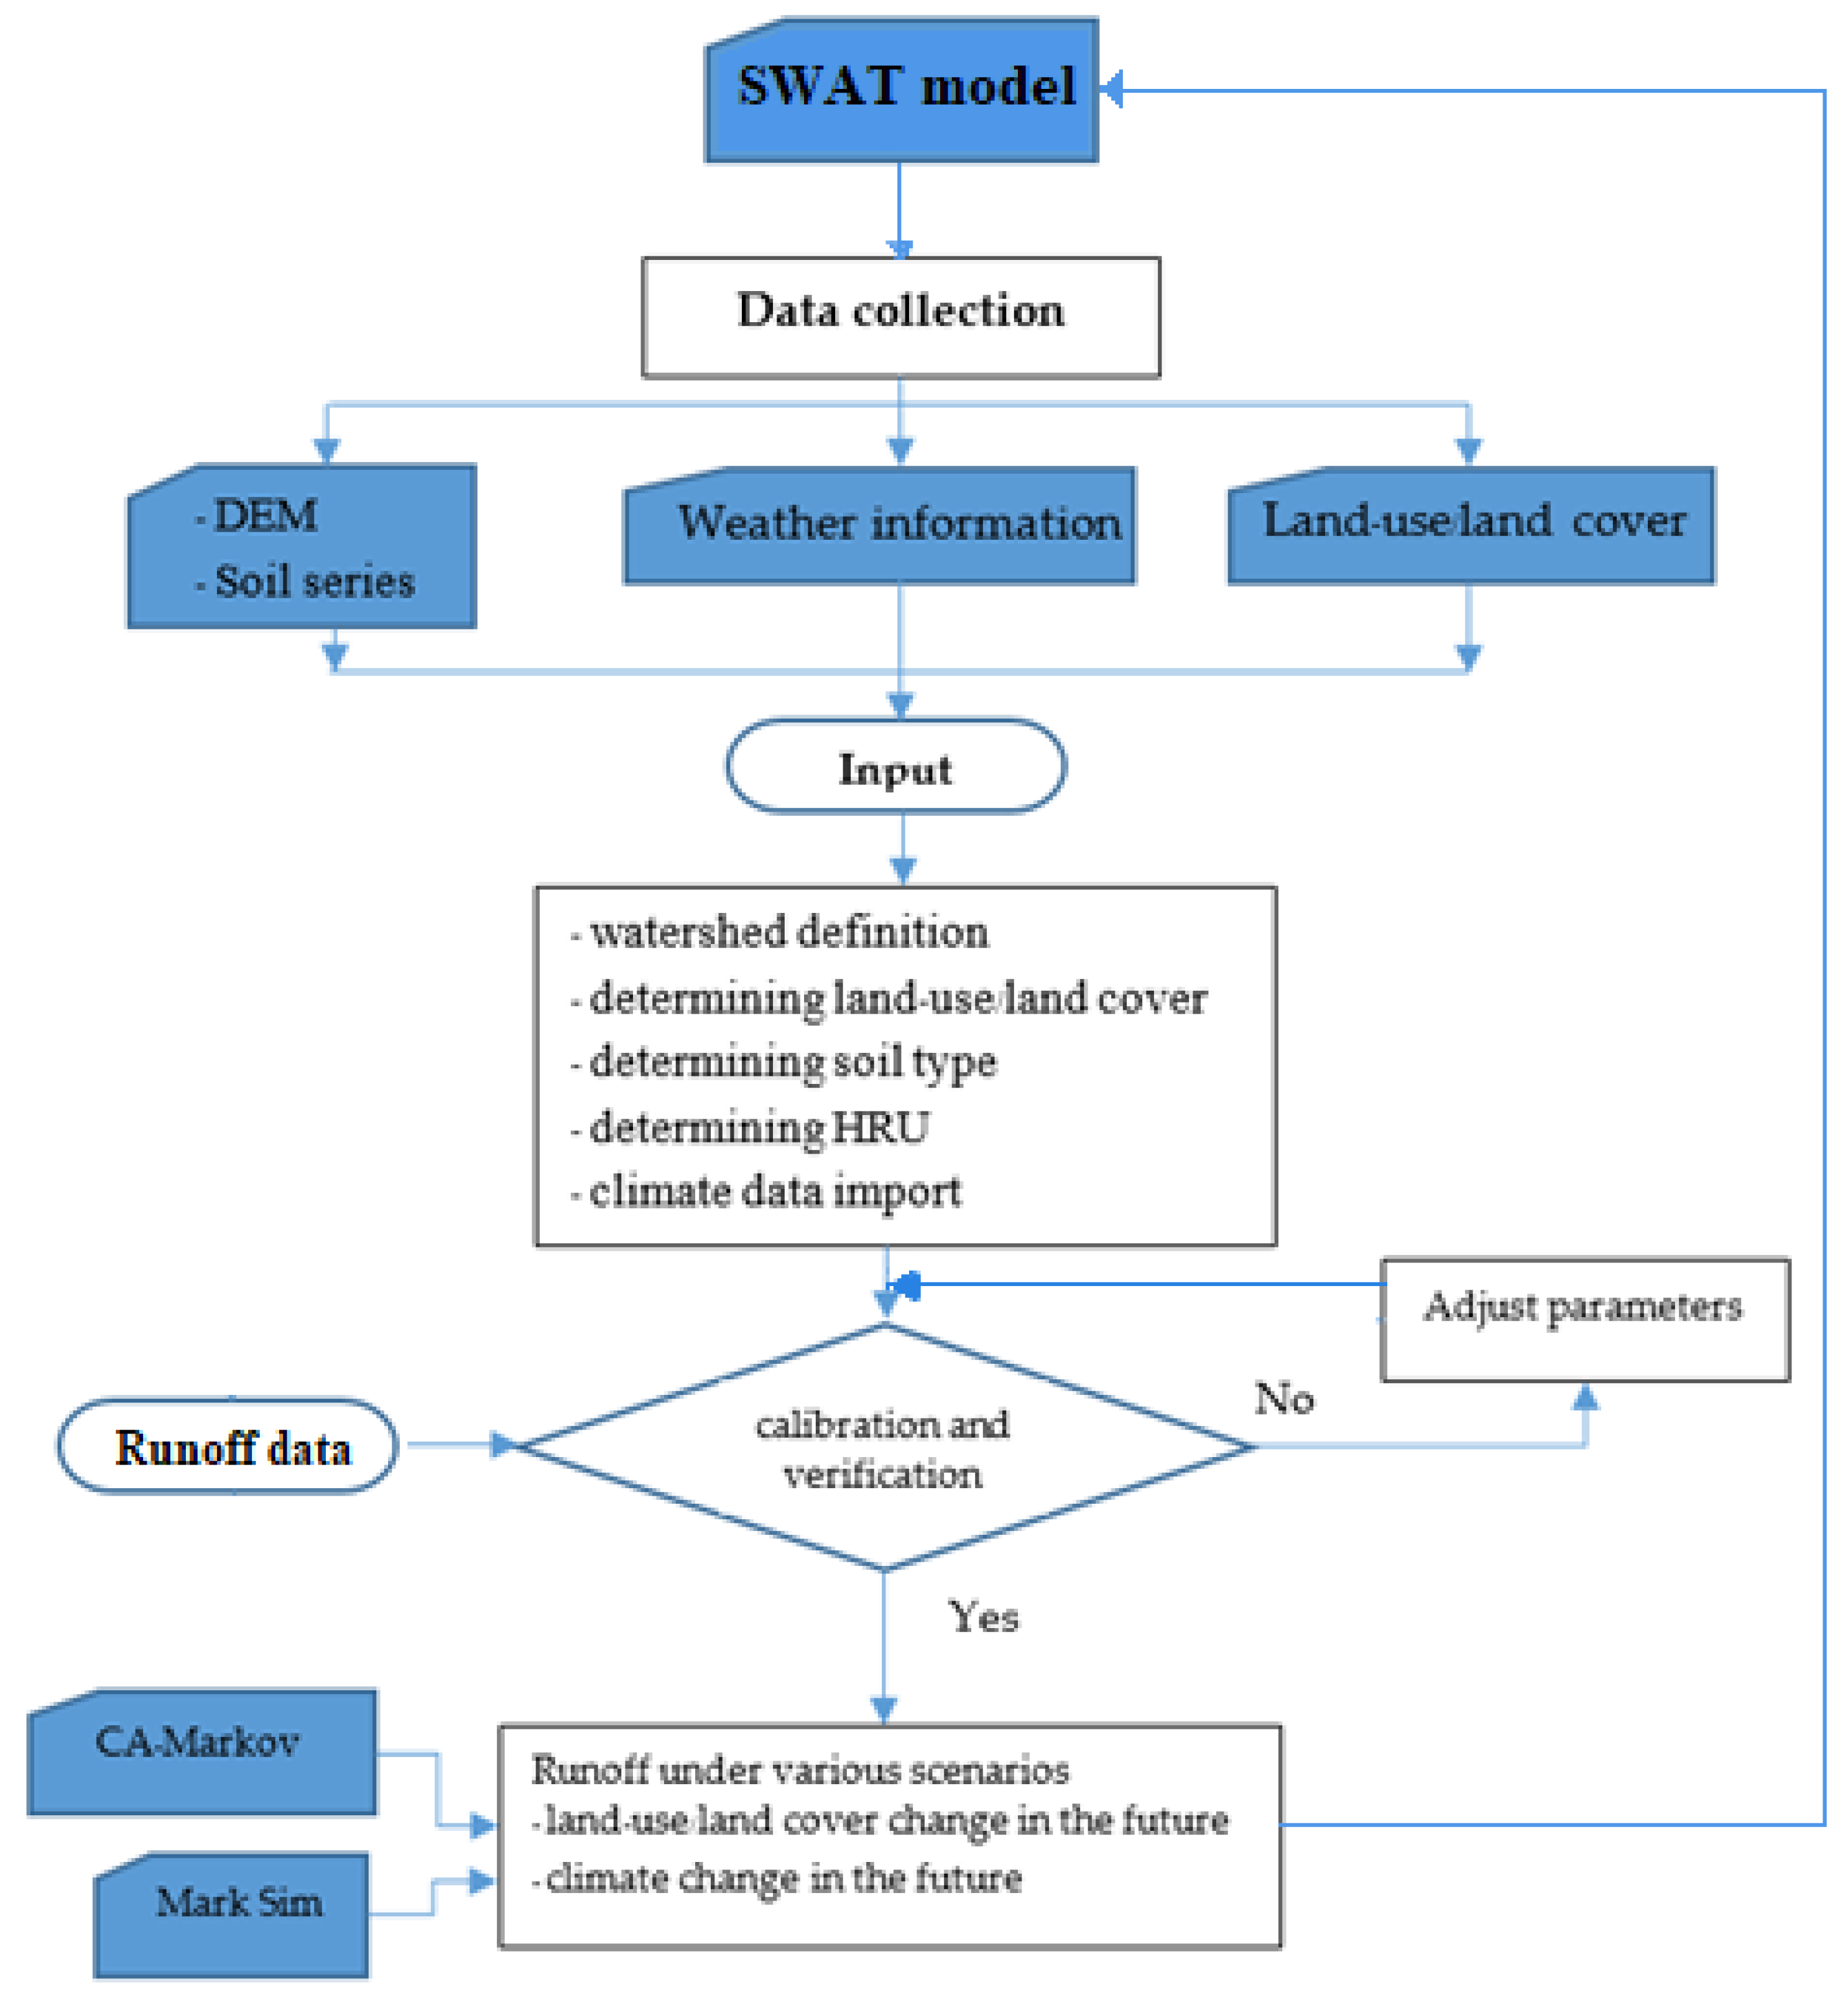
2.2. Data Used in the Study of the SWAT Model

In this study, the factors affecting the hydrological characteristics were used by the Geographic Information System (GIS) to prepare the input data, which was used for analysis in the SWAT model. The input data include the following.
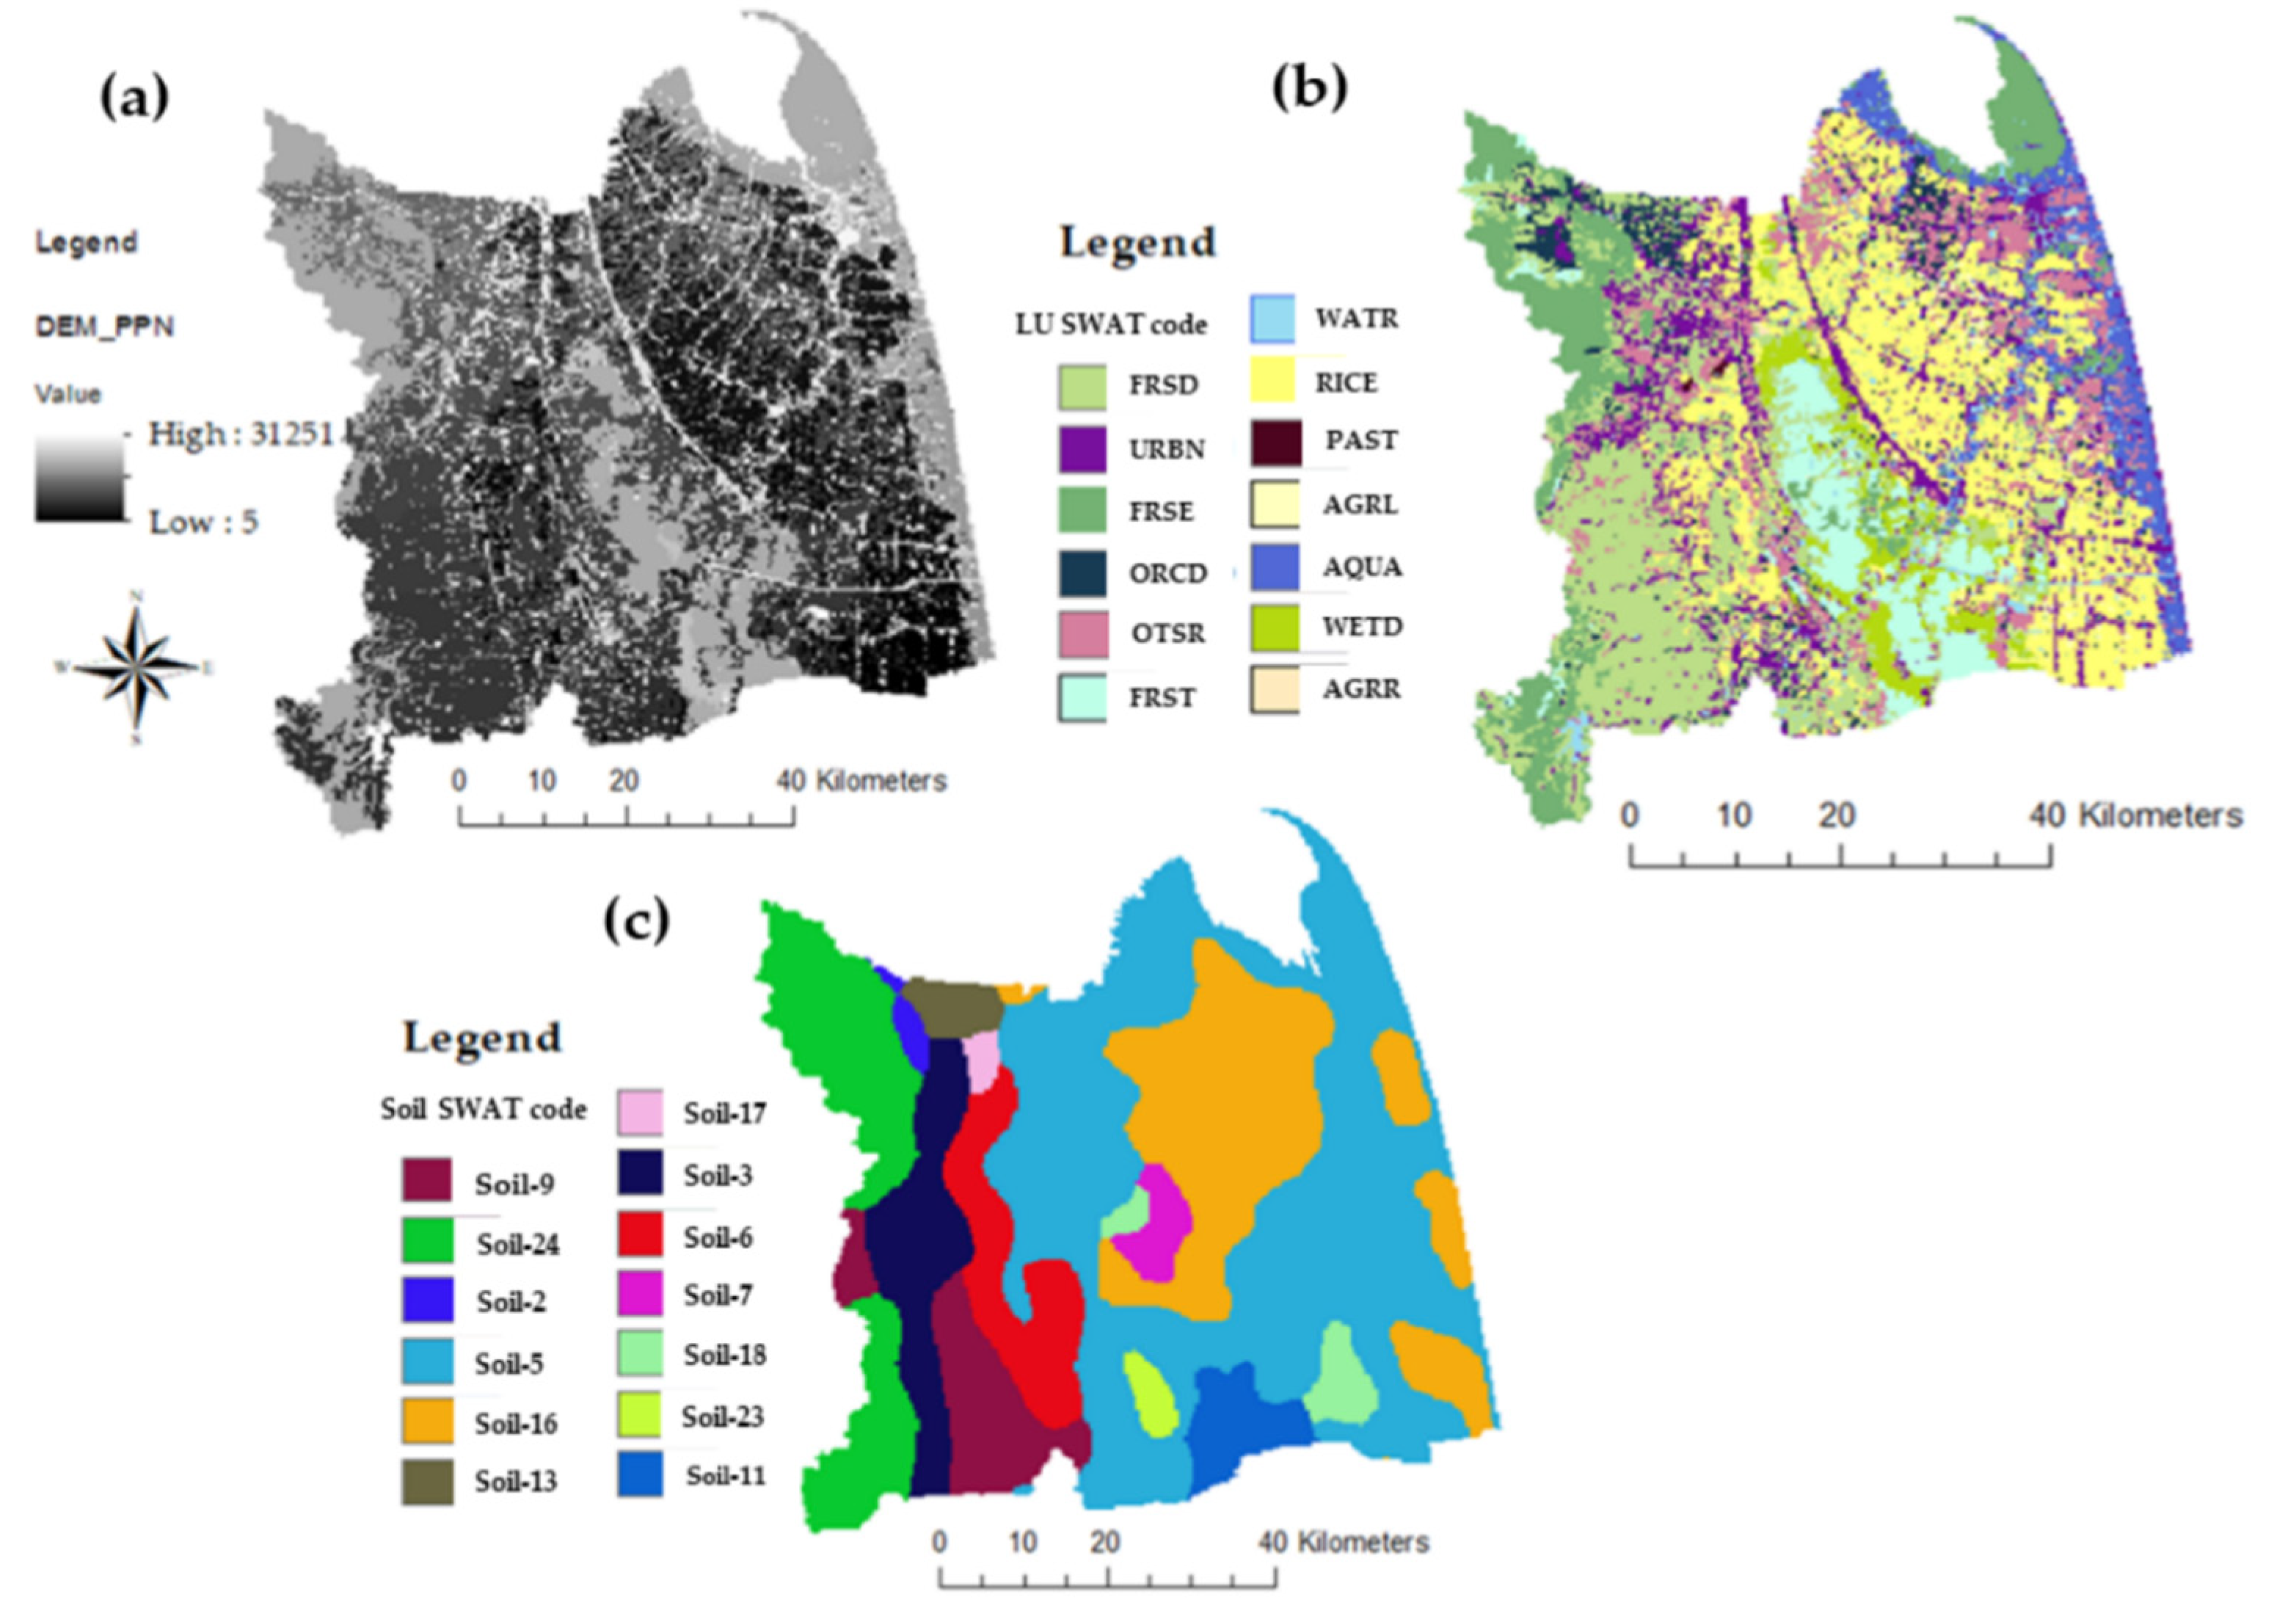
  • Digital Elevation Model (DEM) data are from a topographical database that shows the elevation of a watershed area, which is obtained from altitude or elevation points. The data can be stored, processed, and presented in models in various formats. In this study, a geographic reference system (WGS 1984 UTM Zone 47 N) with a resolution of 5 m was used for raster data (Figure 3a).
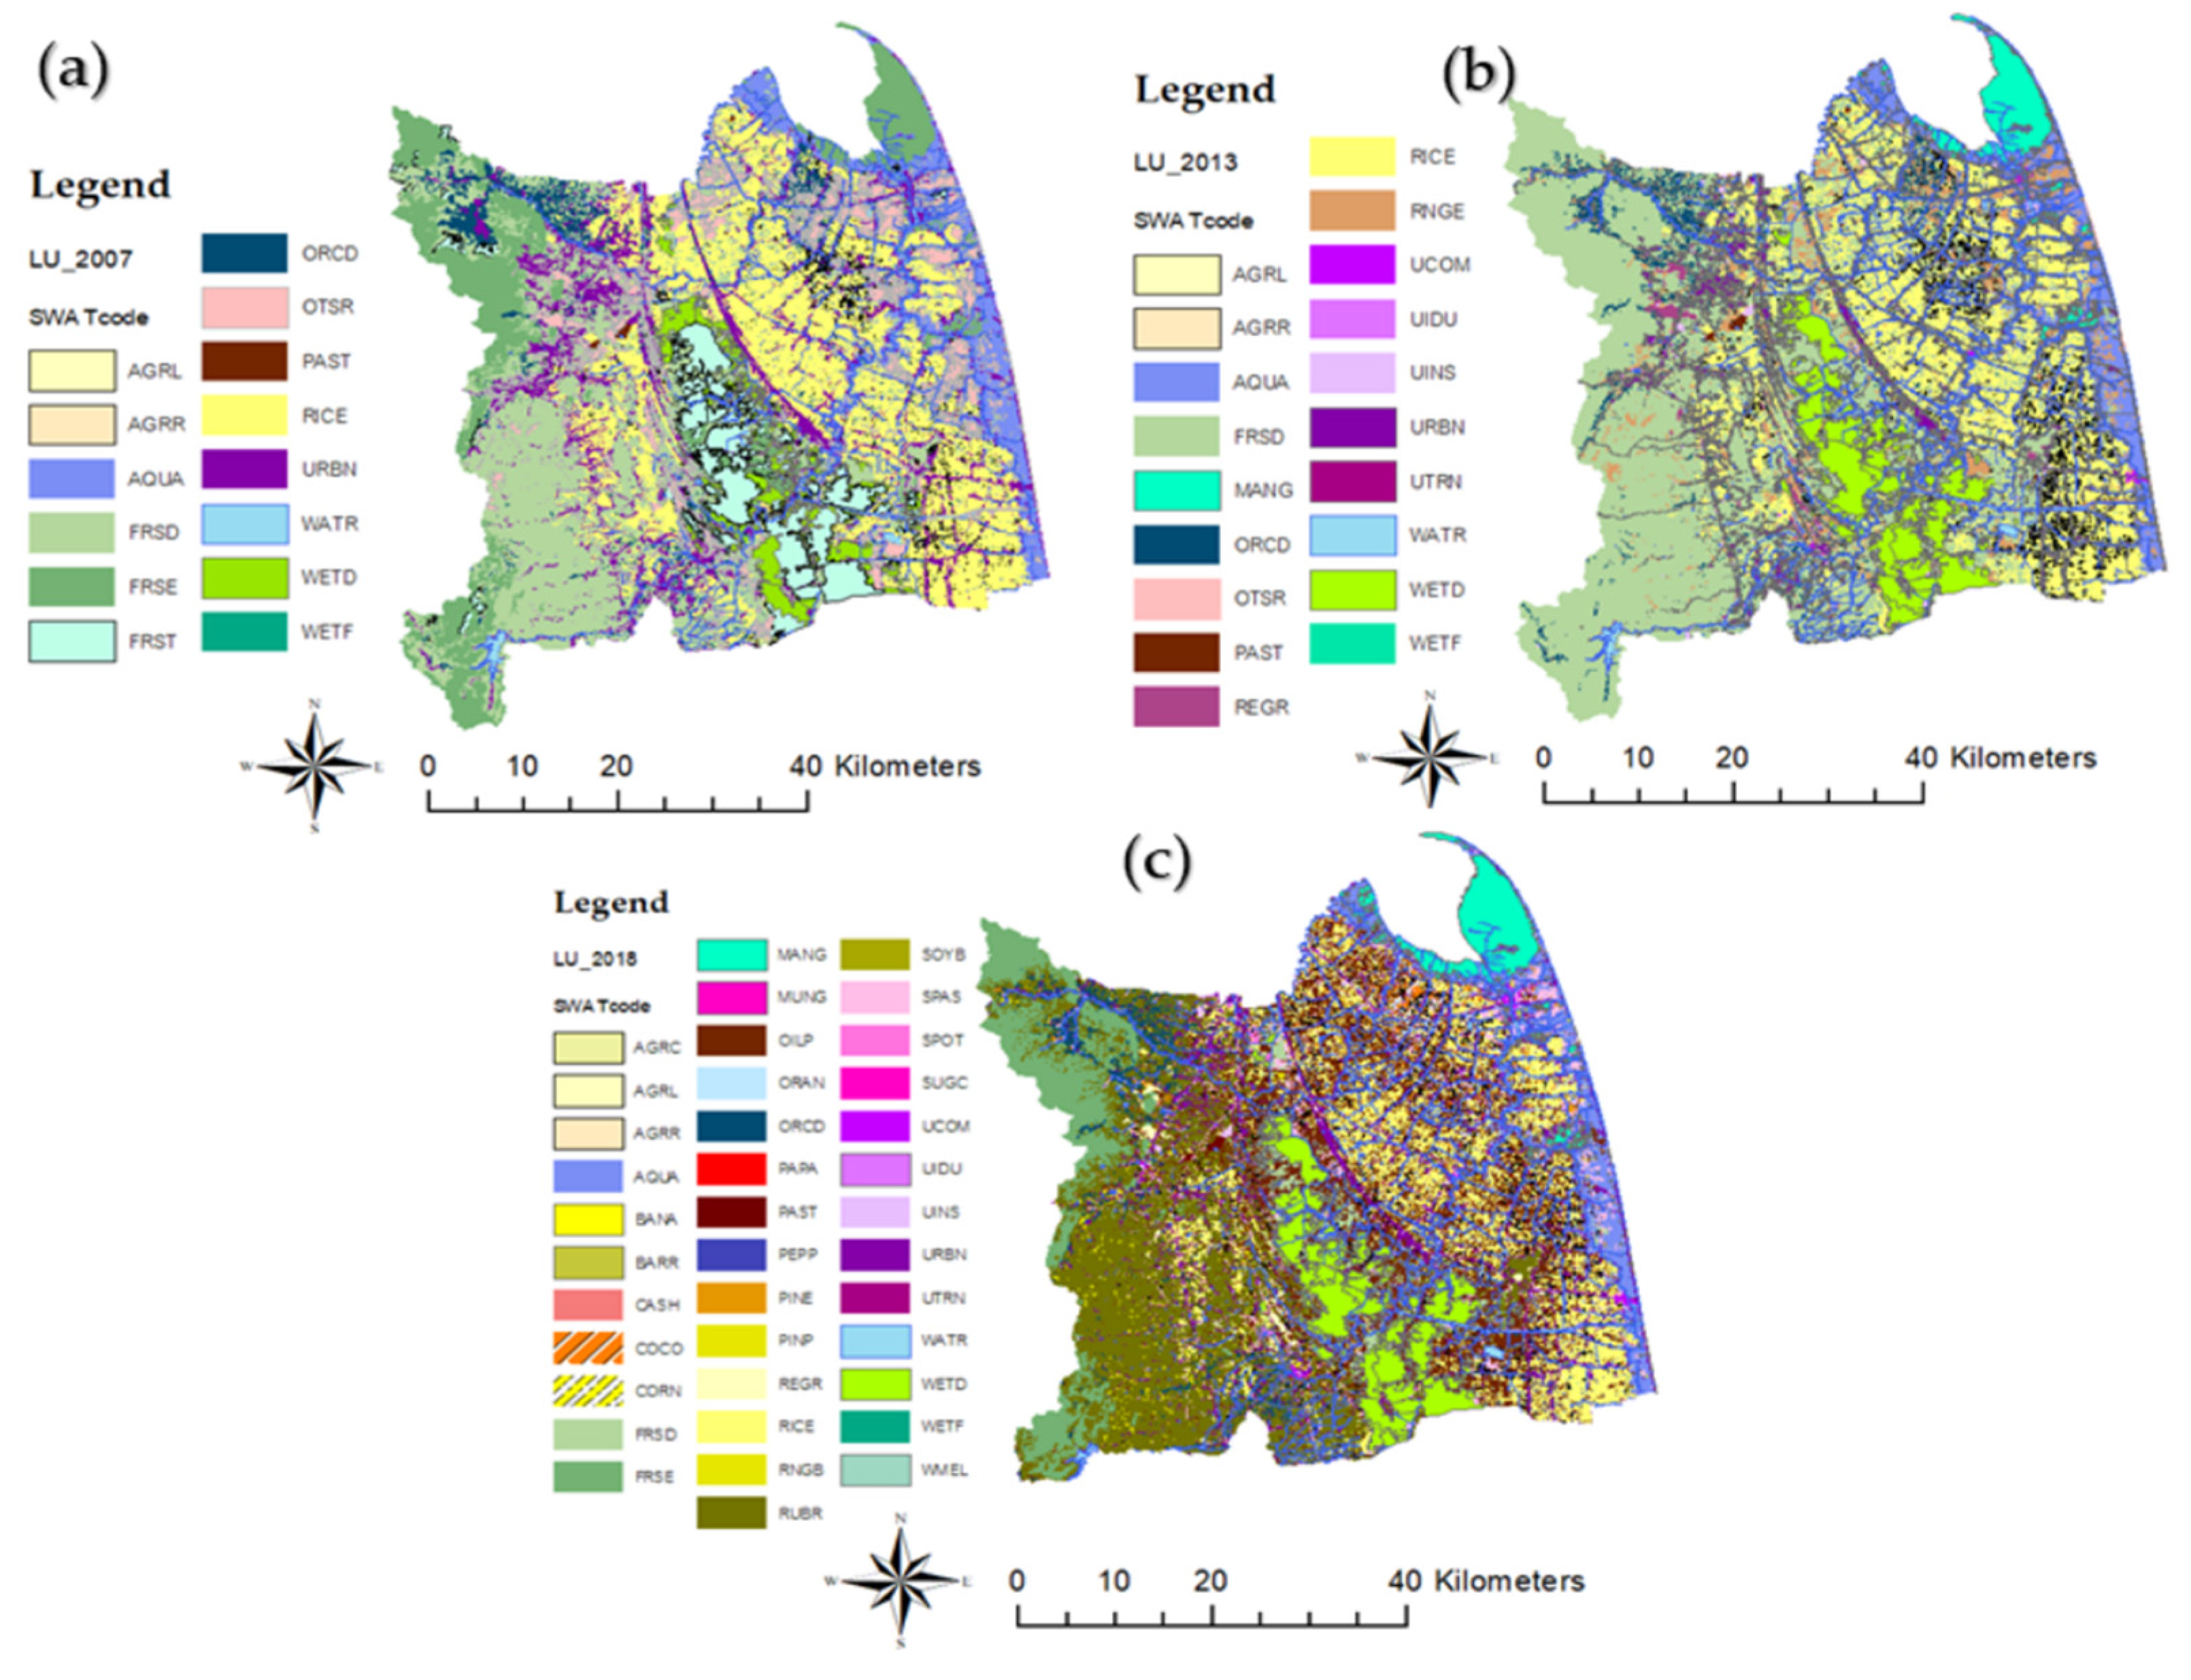
  • LULC data were collected from the Land Development Department in 2007 and 2018, and were used to study past and present land-use projections. The CA-Markov model was used to study future land-use changes. Land use was divided into different areas (e.g., forest, agriculture, accommodation, and water resources), and the information obtained must have characteristics that can be used in reclassifying to the ArcSWAT database suite by SWAT code (Figure 3b).
  • Data of Soil map were collected from the Department of Land Development. The data revealed that there were 13 soil series in the study area. Most of the soil series is soil-5, moderately fertile clay soil with poor drainage, followed by soil-16 with moderate fertility and loamy soil with poor drainage. The slope compact of the watershed is shallow soils with rocky or plain rocks found, in which the soil fertility is very low, which is soil-24. In addition, soil-3 with rubble, and gravel were mixed in the soil layer from good to poor drainage and low soil fertility. Soil-6 is loamy soil; it has poor drainage and moderate soil fertility. Soil-9 is loamy soil with good to moderate drainage and moderate soil fertility. In addition, soil-2, -7, -11, -13, -17, -18, and -23 are a minority of the total area. Soil series data need attributes that can be used in reclassifying to the ArcSWAT database as shown below (Figure 3c).
Arnold and Fohrer found that the SWAT computations were based on the hydrological simulations of the watershed, which can be divided it into two major sections. These sections include: (1) the land parameters of the hydrological cycle as the first section of the SWAT model. This is the section that controls the quantity of runoff, sediment yield, and nutrient and pesticide loadings in each sub area’s main channel; and (2) the section that explores the movement of water, nutrients, pesticides, sediment yield, etc. in the watershed. For this research, the SWAT model was calibrated through the water balance equation with the soil phase as the parameter in the hydrological cycle as shown in Equation (1).
SW t = SW 0 + i = 1 t ( R day Q surf E a W seep Q gw )
Parameters explained below: SWt is the final water content of the soil (mm), SW0 is the initial water content of the soil on the day i (mm), t is the time (days), Rday,i is the total precipitation on the day i (mm), Qsurf,i is the total surface runoff on the day i (mm), Ea,i is the total evapotranspiration on the day i (mm), Wseep,i is the amount of percolation and interflow exiting the soil profile bottom on the day i (mm), and Qgw,i is the total return flow on the day i (mm)
The individual water balance equations were simulated using hydrological models with well-established correlations. Although the SWAT model is distributed with a complex hydrological model, it is still widely used [23]. This research assumes the streamflow modeling of the SWAT performance, which was tested using the method of calibration where six delicate model parameters were adjusted for sensitivity analysis.
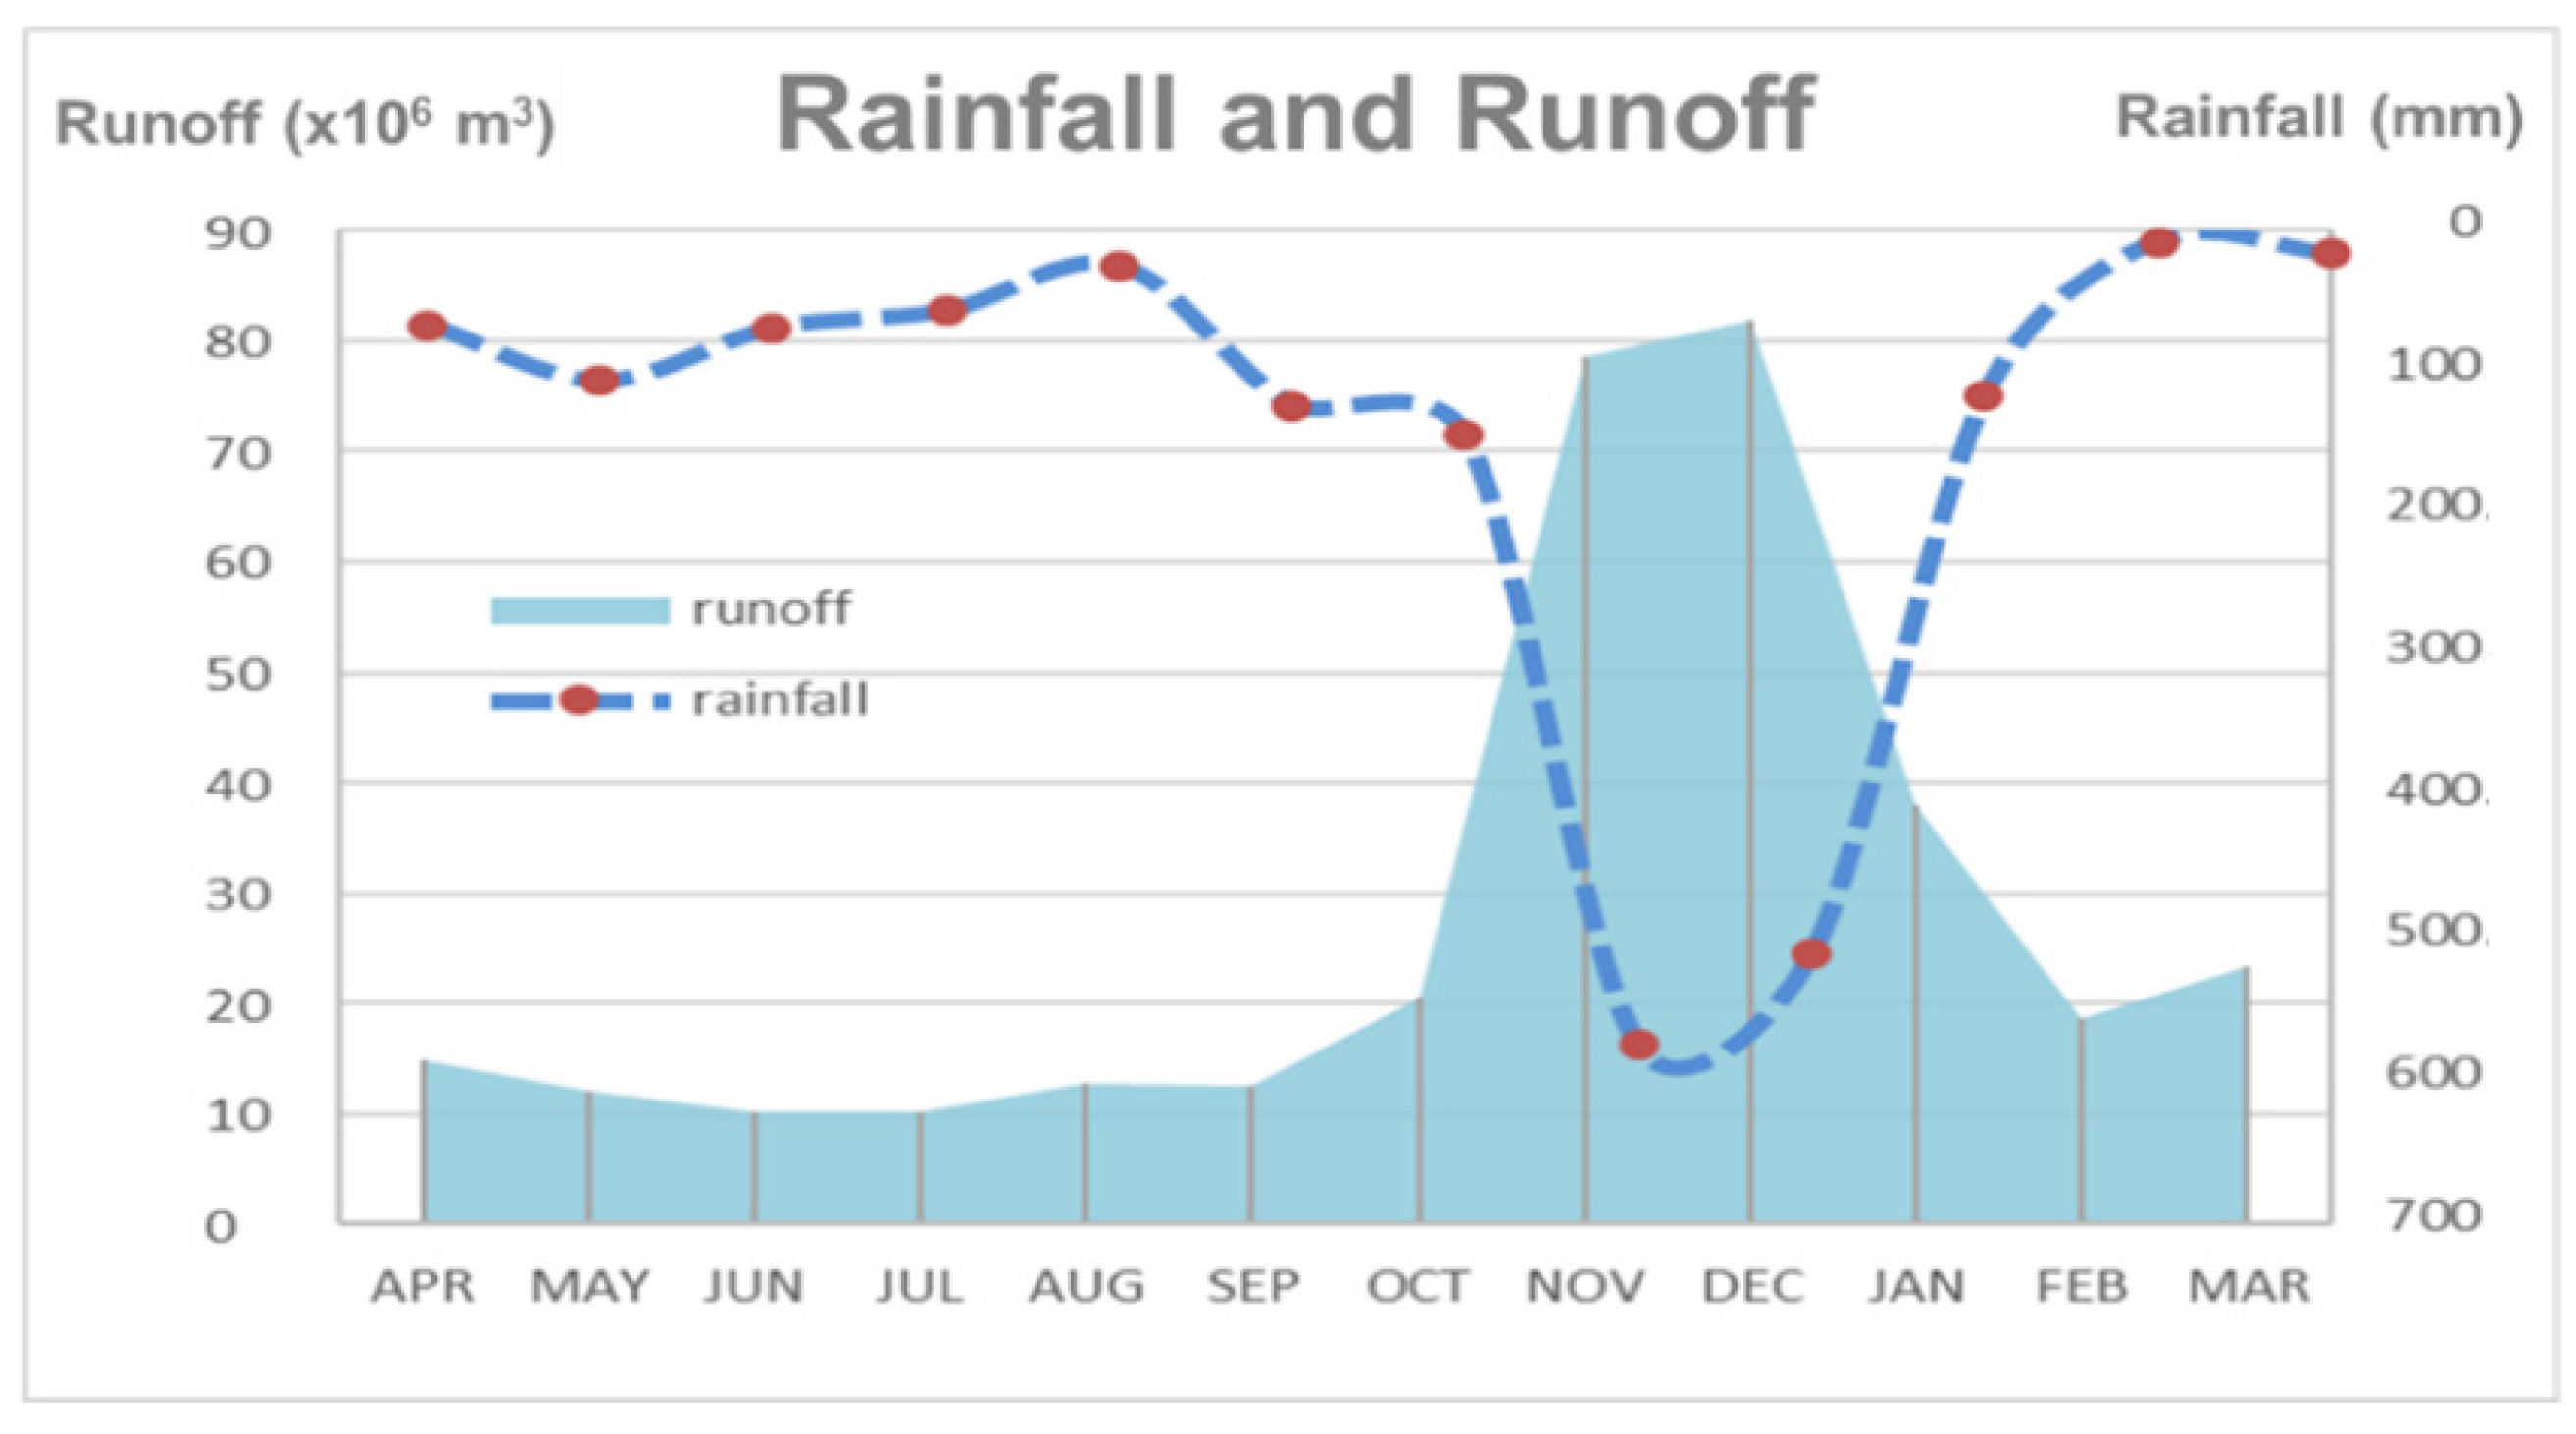
  • Hydrological data using data on daily runoff-rainfall were collected from the Hydrology and Water Management Center 2008–2018, namely Ban Sao Thong Station (X.167), Ron Phibun District, Nakhon Si Thammarat Province. It has a total catchment area of 251.99 km2 at latitude of 8.1644 and longitude of 99.5430.
  • Watershed dataset and stream database were prepared with shapefile and ArcSWAT on the Watershed Delineation step, and link its attributes to watershed file when using the predefined watershed and stream layers in ArcSWAT 2012.
  • Meteorological data for 2006–2019 using the highest–lowest temperature data were collected from three stations, namely Pak Phanang Station at latitude of 8.3571 and longitude of 100.1981, Chian Yai Station at latitude of 8.0851 and longitude 100.1324, and Lan Saka Station at latitude 8.3403 and longitude 99.8281. The locations of the climate measurement stations have been provided in a table file in text format (*.txt). The climatic data used consists of daily precipitation data and maximum–minimum temperature data.

2.3. Land-Use/Land-Cover Change in the Pak Phanang River Basin

Forecasting the direction of land-use change and soil cover using the technique of overlaying data on land use with a Cellular Automata (CA)-Markov model in GIS was conducted to predict changes in land use in 2030. Previously, many LULC change simulations were studied using this model. The model was used to determine the relationship between urban development and probabilistic drivers of change in land-use type based on suitability and probabilities to change from one type to another and based on the number of developed neighborhoods [24]. In this study, the probability of change together with environmental factors that cause changes in land use were determined; such as the distance from the road, distance from the water source, distance from the village, etc., which can be used to assess both the direction, size, and position of the land-use change. This research selected land-use data of the study area in 2007 and 2018 from the Department of Land Development in the shapefile format. The analysis was based on the land-use code of the SWAT model from a database of land use and provided information that affects land-use changes. In this research, the factors of elevation, slope, distance from the water source, distance from the village, and the distance from the road were selected.

2.4. Generation of Weather Data

The MarkSim™ DSSAT weather file generator, which was available on the web application (http://gismap.ciat.cgiar.org/MarkSimGCM, accessed on 11 November 2021), was used to generate daily weather data for the study area. MarkSim is well known as a tool for downscaling climate information [25,26]. Details of the MarkSim operation are described by Jones and Thornton (2000 and 2013) [27,28]. In brief, MarkSim generates daily weather data including maximum/minimum temperature, rainfall, and solar radiation employing both stochastic downscaling and climate typing to downscale future climate projections for the General Circulation Models (GCMs). Daily rainfall was simulated by a third-order Markov process, which predicted parameters by the regression model from the weather class of the area. The daily weather generated from MarkSim can select both climate models and Representative Concentration Pathways (RCPs) according to the greenhouse gas concentration based on the IPCC-Fifth Assessment Report (AR5).
The daily weather was predicted by downscaling climate models based on the IPCC AR5 data (CMIP5). Table 1 shows a list of the climate models selected for calculation in this study.
The RCPs refer to the scenario of the radiative forcing target level in 2100, increasing from the pre-industrial period. It is associated with greenhouse gas (GHG) concentrations. Three RCPs were used for climate modeling and research based on the IPCC Fifth Assessment Report (AR5) in 2014. Details of the RCPs used in this study are shown in Table 2.
The weather data including the maximum temperature, minimum temperature, and rainfall of the three study areas were generated using the MarkSim web version for IPCC AR5 data (CMIP5). For each station, the weather data were calculated using a combination of 17 models (Table 1) with nine replications for three RCPs (RCP2.6, RCP4.5, and RCP8.5) during the 2020–2100 period. A total of three years including 2025, 2055, and 2085 were selected to represent the weather of each decade.
Since meteorological monitoring stations were not installed in the study areas, observation data obtained from nearby stations in the province were used to compare with the daily weather data generated by MarkSim. The observation data from three meteorological stations in the Pak Phanang River Basin, including the Pak Phanang Station, Chian Yai Station, and Lan Saka Station, between 2007–2019 were selected for regression analysis and data collection.

2.5. Performance Evaluation Methods

Comparison of the results between the simulated data from the SWAT model and the observed data can be applied to the management of water resources accurately and reliably after examination. Therefore, a comparative test is needed between the model and the measured data in the field. The runoff in comparison with the index relative to the comparison is shown as follows.
Coefficient of Determination (R2) is a statistical variable used to describe the variation in a factor in relation to another linearly. R2 has a value between 0 and 1, where the two factors are related to the extent that they are reliable. The value of R2 can be calculated from Equation (2) [32].
R 2 = i = l n O i O ¯ P i P ¯ i = l n O i O ¯ 2   i = l n P i P ¯ 2 2
where i is the No., n is the amount of data, O i is the measurement value, O ¯ is the average of all measurements, P i is the simulated data, and P ¯ is the average of all models.
Nash–Sutcliffe Efficiency (NSE) is an index that is commonly used to tell values. Model accuracy or model performance in estimating the desired value can be calculated from Equation (3) [33].
NSE = 1 i = 1 n Y i Y ^ i 2 i = 1 n Y i Y ¯ 2
where Y i is the observed value at i (and i is between 1 to n), Y ^ i is the simulated data from the model of the Y i value, and Y ¯ is the average of Y i .
Root Mean Square Error (RMSE) is the standard deviation of the runoff measuring station (qr) and simulated data (qm), where n is the amount of data used for the calibration (equal to the amount of data from the available runoff measuring station) as shown in Equation (4) [34].
RMSE = 1 n i = 1 n q r q m i 2
The statistical evaluation of the measurement error for the SWAT model calibration and validation with the monthly streamflow, including NSE, R2, and RMSE are shown in Table 3.

3. Results and Discussions

3.1. SWAT Analysis and Performance of the SWAT Model

The SWAT application was used to analyze LULC changes by evaluating situations based on land use needs in the Pak Phanang River Basin. The results of the data were imported in the watershed definition step of determining land use, soil, and HRUs. The SWAT model provided simulation on multiple HRUs based on land use, soil, and slope options at thresholds of 2/3/4 percent, respectively. The results found 1409 HRUs and 51 subbasins in the Pak Phanang watershed delination (about 197,901.60 ha).
This can be applied for evaluating scenarios of diverse LULC alterations in the hydrological process. This study was able to evaluate the runoff from changes in LULC by creating three scenarios that may occur in the future based on the past and current use of the land. To evaluate the SWAT model’s performance, the observed runoff data from monitoring gauge station X.167 were collected for 11 years during 2008–2018. We divided the data into two parts: (1) the first 5 years (2008–2012) for model calibration, and (2) the final 6 years (2013–2018) for model validation. Table 4 shows six sensitive parameters in our SWAT model.
A susceptibility analysis of 16 variables expected to influence the Pak Phanang River Basin on runoff yields. After analyzing the sensitivity, it is possible to determine which parameters should be adjusted in order for the model to calculate the runoff volume as close as possible to the reality. However, considering that only 10 parameters were correlated with the monthly flow estimates, only six parameters were the most sensitive. According to studies, the first six parameters have a relatively high sensitivity. The curve number parameter is the most sensitive. The most sensitive parameter is curve number (CN2) with very high sensitivity, followed by: soil evaporation compensation factor (ESCO), available water capacity of the soil layer (SOL_AWC), average slope steepness (SLOPE), threshold water depth in the shallow aquifer for return flow to occur (GW_QMN), and soil depth (SOL_Z), with high sensitivity. These were controlling the surface runoff in the watershed, as shown in Table 4.
Soil plays a vital role in drainage and water retention in the watershed. The soil can hold water in three parts: the first part is the water that is a chemical component of the soil, such as clay minerals. The second part is the water stored as a membrane coating the soil’s surface. Finally, the third part is the water in the micro-pore and macro-pore of the soil particle. In natural conditions, the soil water storage capacity more or less depends on the soil depth, soil structure, soil pore, soil organic matter, and depth of the roots zone. There are 13 soil series in the Pak Phanang River Basin. The soil series database has been compiled from the Department of Land Development, at 32.74% (Soil-5). The geological structure is a very deep clay group formed by river sediments. Neutral or alkaline soil reaction, bad drainage, and fertility are low to moderate. The soil is suitable for growing crops and for growing vegetables or fruits.

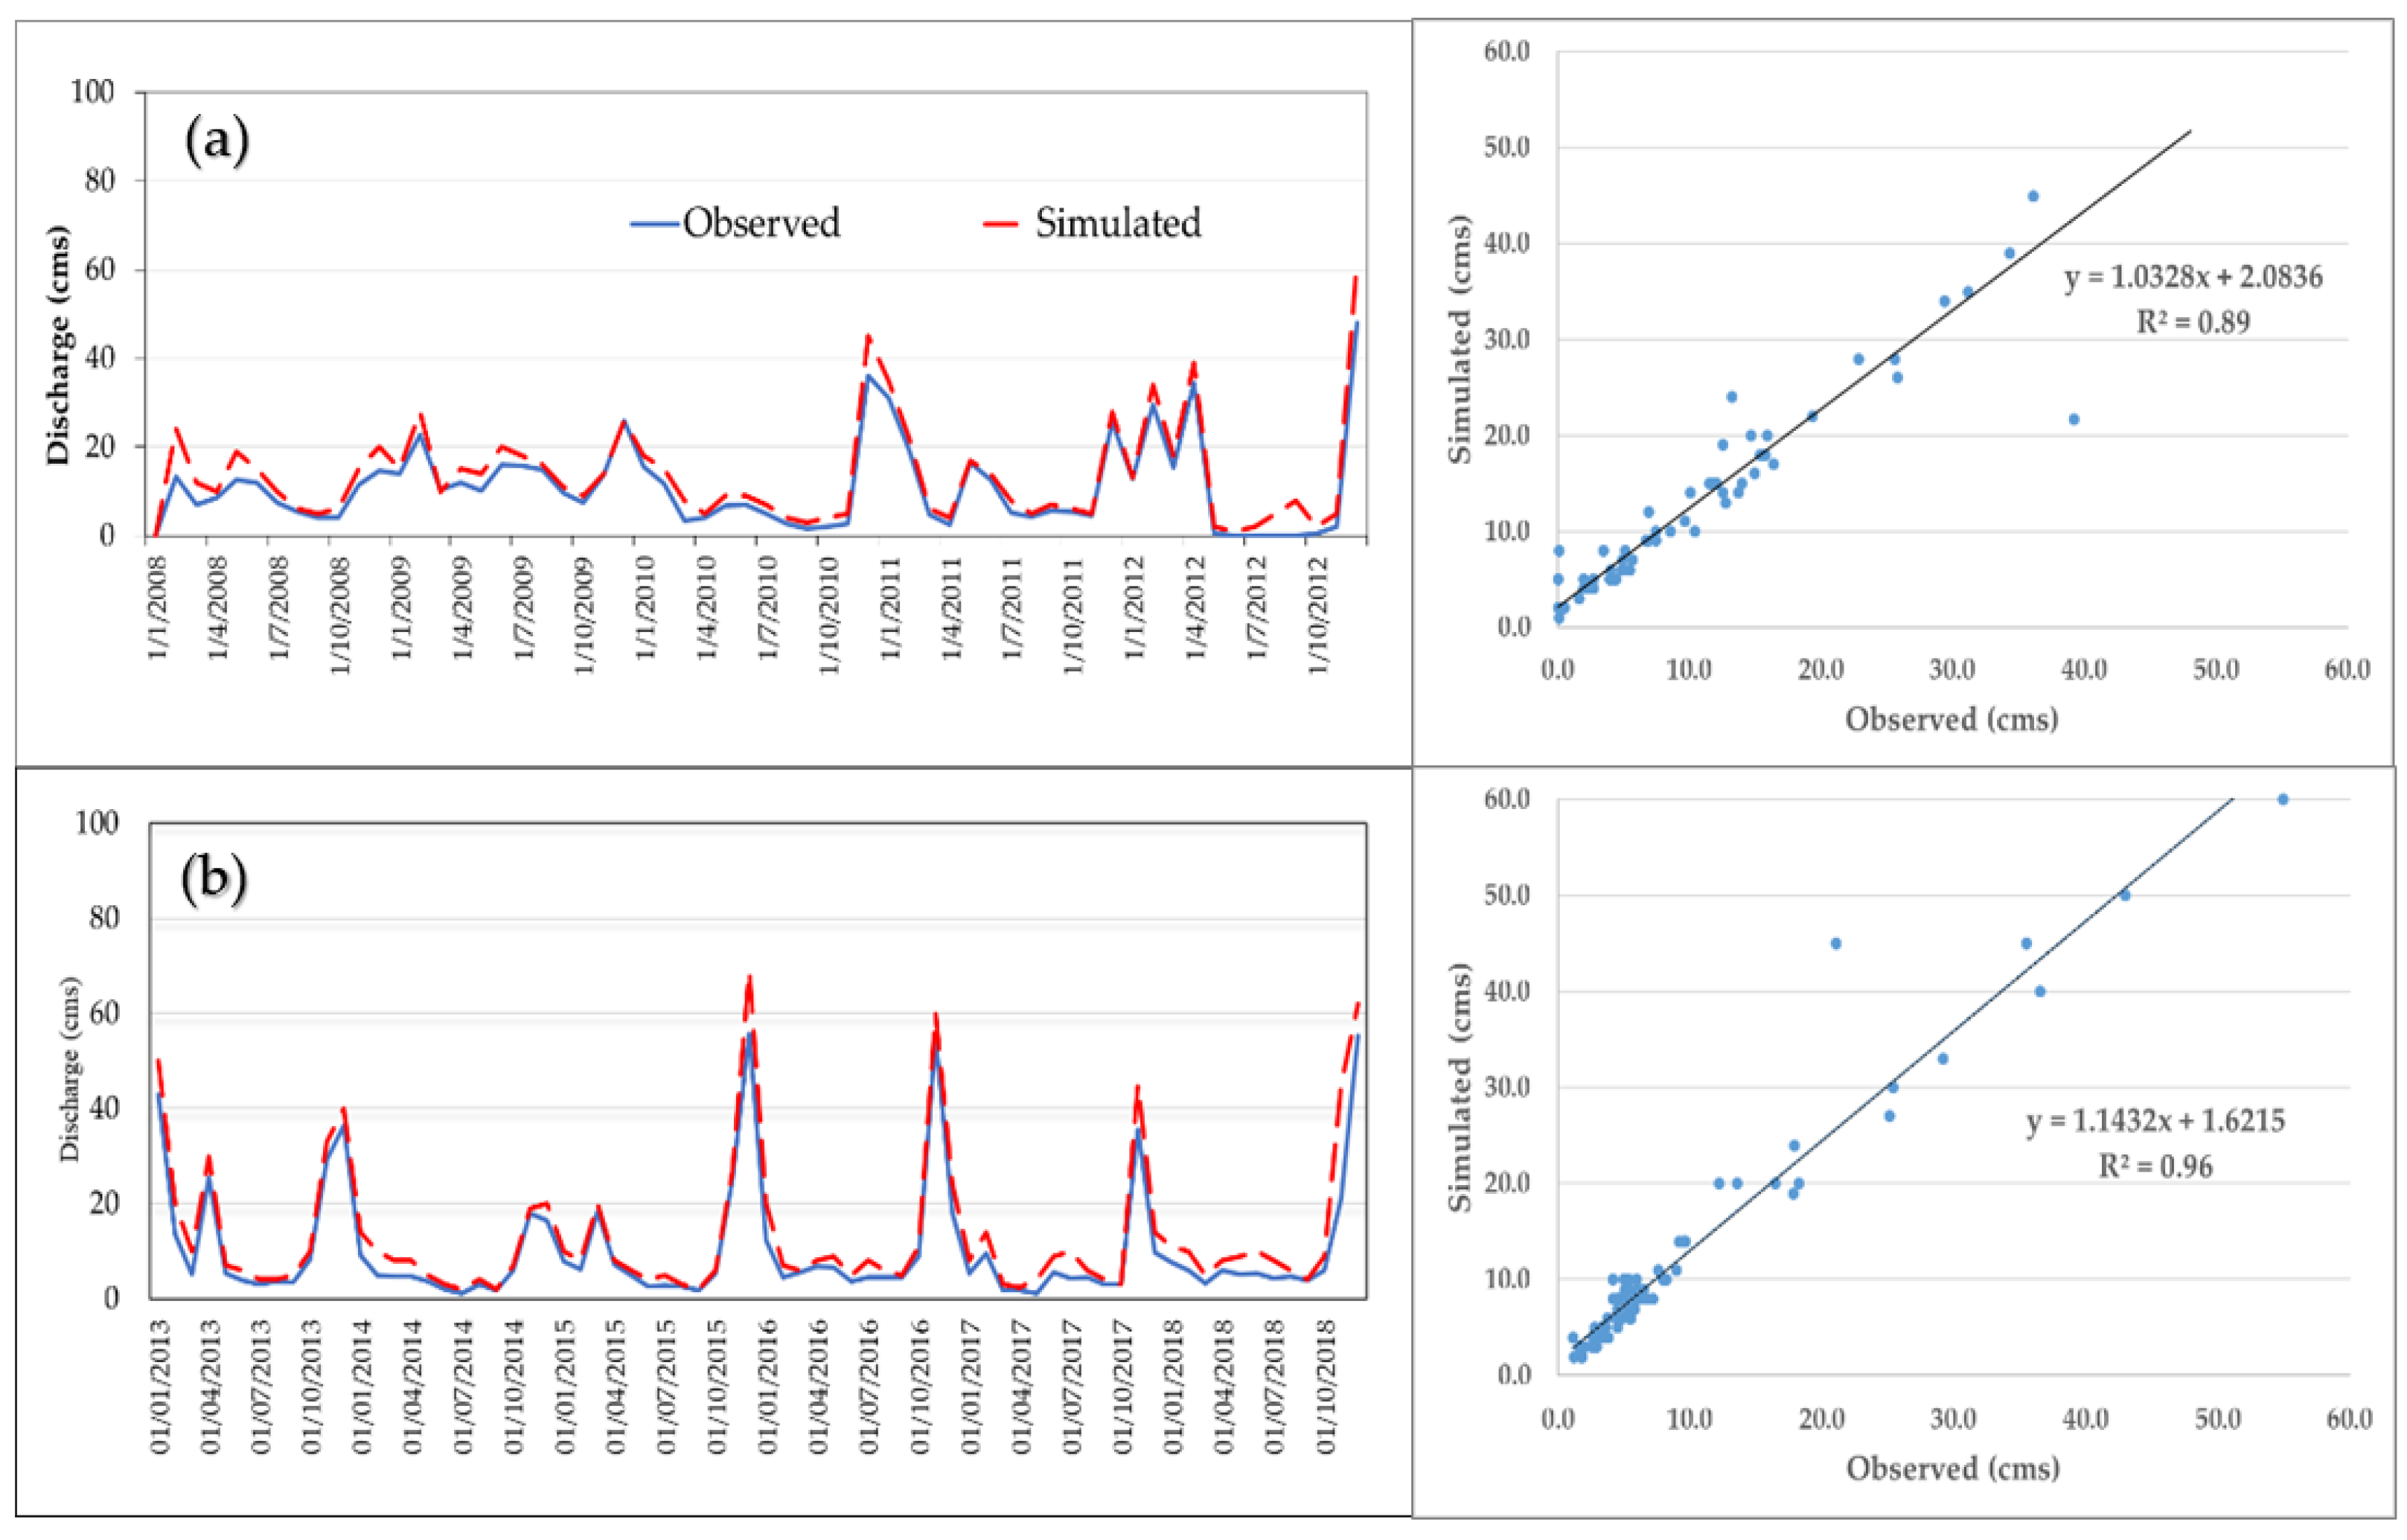
3.2. SWAT Calibration and Validation

The first 5 years’ dataset during 2008–2012 was used for setting model calibration, and the final 6 years’ dataset during 2013–2018 was used for determining model validation. Model calibration and validation were performed by comparing the simulation results with the observed daily discharge of the X.167 runoff station. The simulation results of the monthly streamflow and the observation streamflow were compared to the calibration and validation, as shown in Figure 4.
The above figures depict that the observed and simulated daily streamflow were found to be quite similar. Consequently, SWAT could be utilized to calculate the hydrological process in the Pak Phanang River Basin, which has rapidly changed LULC, especially in agricultural areas.
Table 4 shows the results of the models’ accuracy. In comparing the model’s results, it can be seen that the validation period (2013–2018) showing the goodness-of-fit of the data from the observed station (X.167) was better than the calibration period (2008–2012). For the monthly calibration and validation, the total R2 values were 0.89 and 0.96, respectively; the RMSE values were 4.42 cms and 4.65 cms, respectively; and the NSE values were 0.82 and 0.86, respectively. When looking at the NSE values, it was found that they were higher than the reference values of NSE, where greater than 0.75 means very good, which was further enhanced with the revision criteria recommended by previous researchers. Previous literature has found that the satisfaction level of the SWAT model was when the NSE value was greater than 0.5, and it was termed as a very good level when the NSE value was greater than 0.75 [35]. Recently, a study [36] applied the SWAT model to estimate runoff volumes. The yielded NSE values for the calibrated and validated monthly runoff were 0.86 and 0.70, respectively; and the R2 values were 0.85 and 0.89, respectively.

3.3. LULC Change in the Pak Phanang River Basin

The Pak Phanang River Basin did not have contradictions in terms of water and land resources. Most of the area in this watershed was abundant in agriculture, and most areas were lowlands and wetlands. Especially in the central area to the outlet, which is agricultural, the water supply is important for economic and social development, including creating a balanced ecosystem along with agriculture. From the aforementioned development plan on the importance of long-term sustainability in the future, water restrictions will be a key factor in land-use and land-cover changes in the watershed. It is very necessary to improve the water use ratio in order to have water availability, which will have a significant effect on land-use patterns. Land utilization of the Pak Phanang River Basin in 2007, 2013, and 218 was determined using the data obtained from the SWAT model with an area of 1577.78 km2, as shown in Figure 5.
It was found that in 2006–2007, there was a total area of 577.58 km2 of evergreen/perennial and mixed trees, comprising of all woody plants. In 2012–2013, the area increased to 841.10 km2, comprising of woody and evergreen forests. In 2017–2018, the area was reduced to only 88.43 km2, comprising of deserted/degraded perennials, mixed perennials, eucalyptus, teak, chamchuree, tako, and interspersed shrub/coconut meadows. Most of these were replaced by rubber plantation areas that were increased in 2017–2018 to an area of 611.29 km2. The oil palm area was 233.88 km2 and the area of mangrove forest/peat swamp forest was 134.78 km2. It can be seen that from 2006–2007 until 5 years later in 2012–2013, the land use had not changed much. There was an area of evergreen/perennial forest. Mixed lumber increased by 16.7%, community and urban areas/miscellaneous areas decreased by 10.46%, and paddy field areas decreased by 4.01%. However, when looking at the changes during 2012–2013 and 5 years later in 2017–2018, the land use had changed drastically. The rubber plantation area had increased by 38.74%, while the area of evergreen/perennial forest and the mixed wood was reduced by only 5.60%.
Based on such historical trends, it is possible to visualize events from changes arising from economic and social needs. A projection of an event that may occur in the future can be achieved through gathering information from events that have happened in the past. Socio-economic scenarios focusing on the 20-Year Strategy of the Office of Agricultural Economics (2017–2036). Under the aforementioned strategy, the focus is on resolving weaknesses and strengthening strengths to facilitate the long-term development of the agricultural sector to achieve the vision of “Securing Farmers, Prosperous Agricultural Sector, Sustainable Agricultural Resources”. This includes the aims to: strengthen farmers and farmer institutions; increase production efficiency and raise the standard of agricultural products.; increase the competitiveness of the agricultural sector with technology and innovation; manage agricultural and environmental resources in a balanced and sustainable manner; and develop a government management system. Economic growth in Southeast Asia so far shows that more than half of the watershed is covered by rubber and palm oil. Likewise, the upper and middle areas of the Pak Phanang River Basin crops and forests as almost all of the area will be converted into rubber farms and will be covered by oil palm plantations in the middle and lower areas. In addition, in the area of the lower Pak Phanang Basin, the paddy will be converted to oil palm as it was in the past, during the year 2018.
The implementation of conservative measures (conservation) to achieve economic and social development in parallel with environmental conservation leads to sustainable development goals. The socio-economic and conservation scenarios were projected for future periods. The conservation scenario focuses on increasing the conservation forest area by 25% in line with the 20-year National Strategy Framework (2017–2036) National Development Strategy, Strategy 4: Environmentally friendly growth for sustainable development, Goal 1: Maintain and restore natural resource bases Indicator 1.1. The proportion of forest area is 40% of the country’s area. This can be divided into 25% forest area for conservation and 15% economic forest area to increase planting forest area and restore upstream forest, as shown in Figure 6.

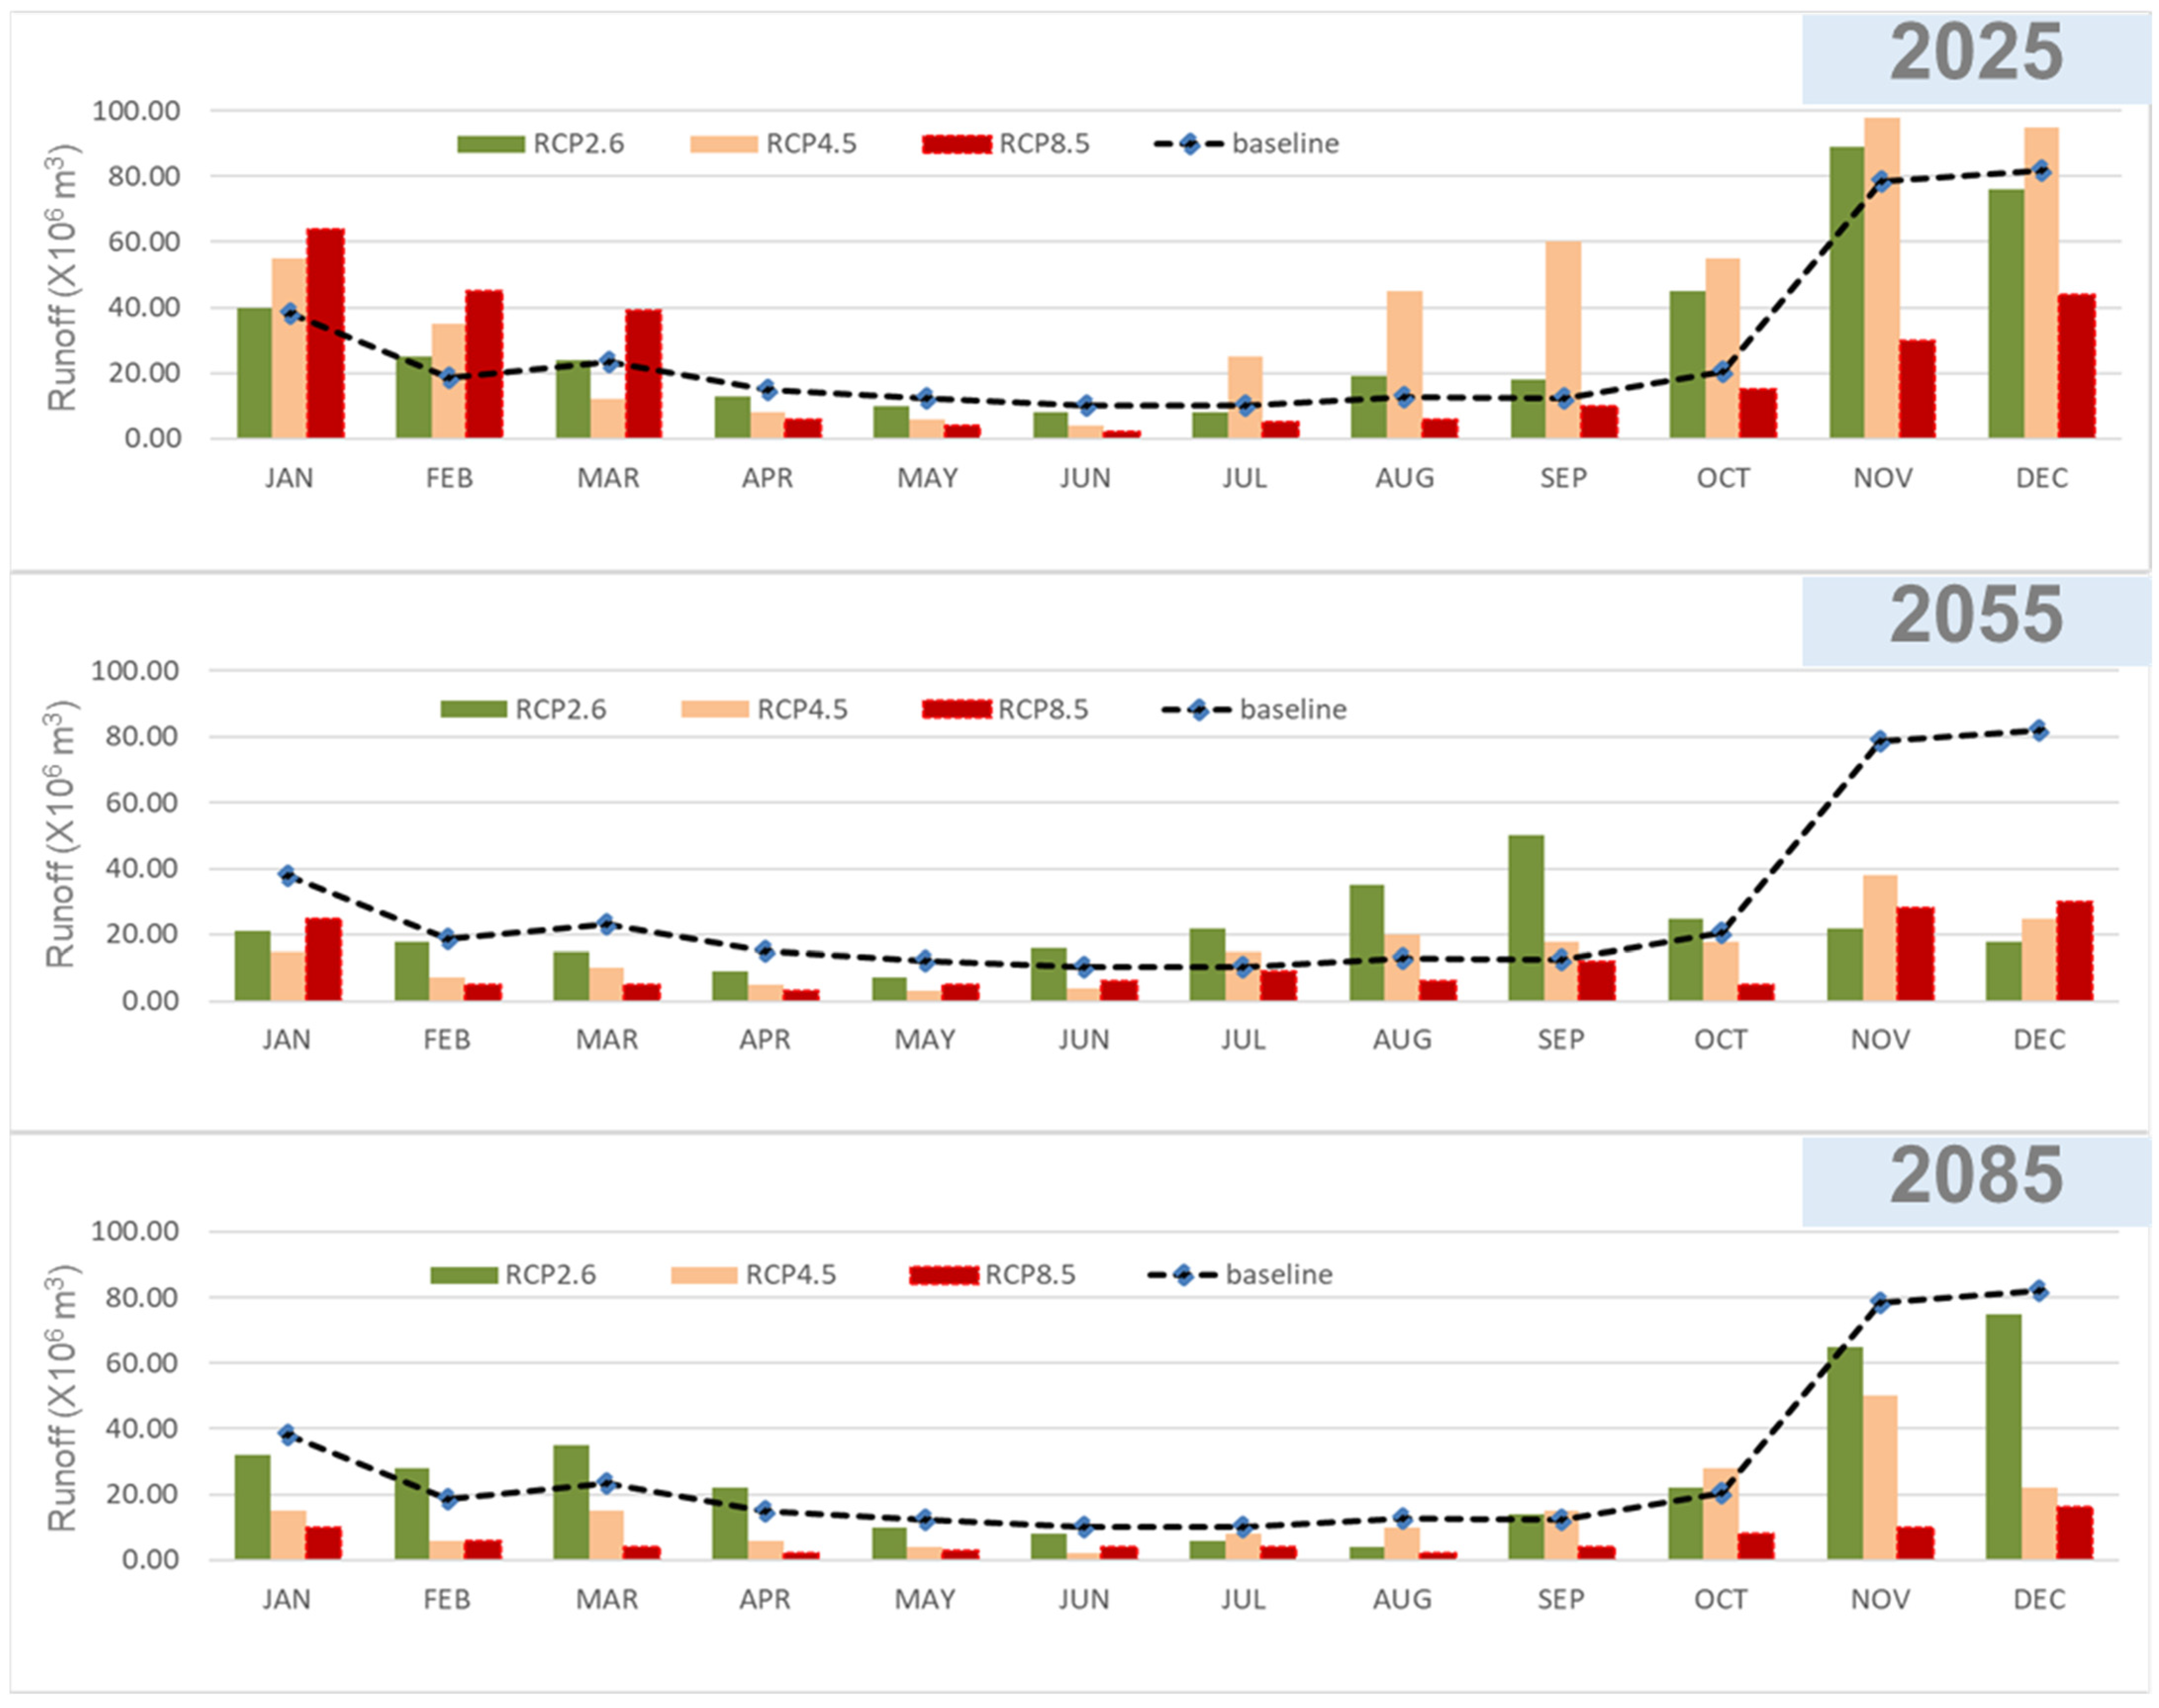
3.4. Effects of Climate Change on Future Runoff

The monthly average of maximum and minimum temperature and rainfall of the generated data and observation data was a good fit (p value < 0.05) and had a strong correlation with the r value 0.7–0.9 at 95% confidence for all RCPs. The regression results of the weather data are shown in Figure 7. It indicates that the generated data were underestimated when compared with the observation data. Consequently, the regression equation was applied to correct the generated weather, as shown in Table 5.
The weather data of the three study areas were generated by MarkSim. According to the results of running MarkSim, the impact of climate change was analyzed, taking the 1993–2018 flow as the baseline flow (Figure 8) compared with the future flows for 2025, 2055, and 2085. Precipitation and minimum–maximum temperature were the climate change drivers considered for the impact assessment. The monthly percentage change in runoff in the three scenarios, i.e., RCP2.6, RCP4.5, and RCP8.5, for the periods are presented in Figure 9.
The overall results presented runoff in the Pak Phanang River Basin as less than 20 × 106 m3 from April to June (dry season), while the highest runoff value crested during November to January (rainy season). The average annual runoffs in 2025 under RCP2.6, RCP4.5, and RCP8.5 were 31.6 × 10⁶, 41.5 × 10⁶, and 22.5 × 10⁶, respectively. The runoff values under RCP2.6 and RCP4.5 were greater than the baseline, while the value under RCP8.5 was less than the baseline (Table 6). The results related to another study [37], which also observed the runoff increasing in Asia’s river basins from high precipitation and glacier melt. Increasing precipitation should have a greater impact on increasing runoff in the Pak Phanang River Basin because most of the rivers originate from the mountains in this area. For 2055 and 2085, the runoffs ranged between 6.1 × 10⁶ and 26.8 × 10⁶ m3, and the volume was reduced from the baseline for all scenarios. A comparison between RCP scenarios indicated that the runoff changes under RCP4.5 and RCP8.5 were higher than that of RCP2.6. The results revealed that the runoff changes in the Peninsula were influenced by the future climate change depending on the volume of greenhouse gases (GHGs) emitted. For the upcoming year (2025), the annual runoff in the area would increase, and the government should consider flood prevention measures, particularly during the rainy season. For the middle and late 21st century, the runoff would decrease. This area may have more drought stress. The overall impacts are positively related to the GHG emissions. The results of this study are similar to another study on runoff change in Asia and Southeast Asia [38,39]. Therefore, adaptation measures for climate change, particularly an agricultural management plan, should be considered for the Malaysia Peninsula. In the upcoming year (2025), field crops such as rice and watermelon in lowland areas will suffer the most due to this increase in runoff. A good water drainage system is required for the lowland area in order to reduce the remaining water in the area. The cases of rubber trees and oil palm seem to be less affected by short-term flooding. For the middle and late 21st century, approximately 50% of the runoff will decrease from climate change, so a shift to an agroforest system is suggested for adaptation measures because it offers both productivity and sustainable use of land and water [40].
However, this study made predictions based on present and past socio-economic growth in the Pak Phanang River Basin. We selected the year in which we forecast future land-use changes that will see the most significant historical patterns of change: 2030. Therefore, the 2030 land-use pattern was taken as an input to assess future runoff volumes so that future land-use policies can be revised based on this forecast. As weather conditions change, the forecasted runoff volume will change as well. Moreover, the future climate in this study was calculated based on the Representative Concentration Pathway (RCP) scenarios in the 5th IPCC report, in which the proportion of different GHGs and aerosols differed from the Shared Socioeconomic Pathway (SSP) scenarios in the 6th IPCC report. Nevertheless, referring to the projected temperature in 2100, the runoff impact of PRC2.6, PRC 4.5, and PRC 8.5 should be related to the SSP1-1.9/SSP1-2.6, SSP2-4.5, and SSP5-8.5.

4. Conclusions

This study estimated the runoff change in the Pak Phanang River Basin based on the LULC change by the SWAT model, which was used to estimate land use in 2007, 2013, and 2018. The land-use forecast data were based on the CA-Markov model for land-use projections in 2030. We found that in the future years, most of the area in this basin will be transformed into urban areas. Importing the changing land-use data into the SWAT model to estimate runoff volume, it was found that the runoff volume increased the most by 49.28% in the RCP4.5 scenario, and the runoff volume dropped to the lowest by 78.12% in the RCP4.5 scenario from the baseline year as well. The results of the evaluation provided suitable parameters for estimating runoff by the SWAT model, and it can be concluded that the runoff after calibration was close to the actually measured runoff and provided good statistical values when compared to many studies.
For R2 between the variable land-use types and the estimated runoff, it was found that the forest areas played a more important role in controlling runoff in the study area than the agricultural areas. This result is consistent with the result of determining the water balance when the rainfall is constant. Changes in land use are directly related to evaporation and the amount of surface water that controls runoff. Therefore, runoff management in the study area should focus on the increase or decrease in forests.
Increasing conservation of forest areas will increase the potential to protect forest resources and wildlife more effectively. The aforementioned part of the area has been declared a national park and can also develop tourism potential for surrounding communities. This is to promote economic mechanisms for the locality and to be able to use a portion of the national park revenue to benefit local government organizations; as well as to use the income to develop efficiency in the protection of forest resources and wildlife in order to create sustainable economic, social and environmental stability in the local area in the future. In China, the holistic perspective was applied for sustainability problems solving water shortage [41] such as: (1) changing tillage practices based on the water requirement of vegetation cultivation to increase water yield and reduce nutrient loads and (2) applying the Integrated Soil-crop System Management program (ISSM) to solve soil acidification from fertilizer using. The nature–society–human interdependent relationship or integration of scientific knowledge, villager participation, and environmental government policy was important to sustainable development.
The LULC change was used to predict future runoff change in the Pak Phanang River Basin under three climate change scenarios including RCP2.6, RCP4.5, and RCP8.5 during 2025–2085. The results indicated an increase in runoff in the coming years due to an increase in precipitation. However, it would decrease in the middle to late the 21st century. Therefore, a good water drainage system in lowland areas is required for the coming years and an agroforestry system is also suggested for adaptation measures in the middle to late the 21st century.

Author Contributions

Conceptualization, L.K. and R.J.; methodology, L.K. and R.J.; software, L.K. and R.J.; validation, L.K.; formal analysis, R.J.; investigation, P.D., N.A.-A. and N.T.T.L.; resources, L.K. and R.J.; data curation, L.K. and R.J.; writing—original draft preparation, L.K. and R.J.; writing—review and editing, P.D., N.A.-A. and N.T.T.L.; visualization, L.K. and R.J.; supervision, L.K., P.D. and R.J.; project administration, L.K. and R.J.; funding acquisition, P.D., N.A.-A. and N.T.T.L. All authors have read and agreed to the published version of the manuscript.

Funding

This research was funded by the WU grant (WU63245) from Walailak University, Thailand.

Institutional Review Board Statement

Not applicable.

Informed Consent Statement

Not applicable.

Data Availability Statement

Not applicable.

Acknowledgments

The authors would like to thank Chanapha Kerdwan for her support in preparing data and information to input in the SWAT model. Special thanks belong to Walailak University for the financial support for this research through the WU grant (WU63245).

Conflicts of Interest

The authors declare no conflict of interest.

References

  1. Rogério de Mello, C.; Norton, L.D.; Pinto, L.C.; Beskow, S.; Curi, N. Agricultural watershed modeling: A review for hydrology and soil erosion processes. Cienc. Agrotecnologia 2016, 40, 7–25. [Google Scholar] [CrossRef] [Green Version]
  2. Vereecken, H.; Huisman, J.A.; Hendricks Franssen, H.J.; Brüggemann, N.; Bogena, H.R.; Kollet, S.; Javaux, M.; van der Kruk, J.; Vanderborght, J. Soil hydrology: Recent methodological advances, challenges, and perspectives. Water Resour. Res. 2015, 51, 2616–2633. [Google Scholar] [CrossRef]
  3. Piao, S.; Ciais, P.; Huang, Y.; Shen, Z.; Peng, S.; Li, J.; Zhou, L.; Liu, H.; Ma, Y.; Ding, Y.; et al. The impacts of climate change on water resources and agriculture in China. Nature 2010, 467, 43–51. [Google Scholar] [CrossRef] [PubMed]
  4. Kusangaya, S.; Warburton, M.L.; Van Garderen, E.A.; Jewitt, G.P. Impacts of climate change on water resources in southern Africa: A review. Phys. Chem. Earth Parts A B C 2014, 1, 47–54. [Google Scholar] [CrossRef]
  5. Wang, H.; Khayatnezhad, M.; Youssefi, N. Using an optimized soil and water assessment tool by deep belief networks to evaluate the impact of land use and climate change on water resources. Concurr. Comput. Pract. Exp. 2022, 34, e6807. [Google Scholar] [CrossRef]
  6. Ortegón, Y.A.; Acosta-Prado, J.C.; Acosta Castellanos, P.M. Impact of Land Cover Changes on the Availability of Water Resources in the Regional Natural Park Serranía de Las Quinchas. Sustainability 2022, 14, 3237. [Google Scholar] [CrossRef]
  7. Daba, M.H.; You, S. Quantitatively assessing the future land-use/land-cover changes and their driving factors in the upper stream of the Awash River based on the CA–markov model and their implications for water resources management. Sustainability 2022, 14, 1538. [Google Scholar] [CrossRef]
  8. Letta, M.; Tol, R.S.J. Weather, Climate and Total Factor Productivity. Tour. Manag. Perspect. 2019, 5, 51–56. [Google Scholar] [CrossRef] [Green Version]
  9. Absalon, D.; Ślesak, B. Air temperature increase and quality of life in an anthropogenically transformed environment: A case study. Pol. J. Environ. Stud. 2012, 21, 235–239. [Google Scholar]
  10. Nastos, P.T.; Matzarakis, A. The effect of air temperature and human thermal indices on mortality in Athens, Greece. Theor. Appl. Climatol. 2012, 108, 591–599. [Google Scholar] [CrossRef]
  11. Heald, C.L.; Spracklen, D.V. Land Use Change Impacts on Air Quality and Climate. Chem. Rev. 2015, 115, 4476–4496. [Google Scholar] [CrossRef] [Green Version]
  12. Borrelli, P.; Robinson, D.A.; Fleischer, L.R.; Lugato, E.; Ballabio, C.; Alewell, C.; Meusburger, K.; Modugno, S.; Schütt, B.; Ferro, V.; et al. An assessment of the global impact of 21st century land use change on soil erosion. Nat. Commun. 2017, 8, 2013. [Google Scholar] [CrossRef] [Green Version]
  13. Chalise, D.; Kumar, L. Land use change affects water erosion in the Nepal Himalayas. PLoS ONE 2020, 15, e0231692. [Google Scholar] [CrossRef] [Green Version]
  14. Gao, J.; Li, F.; Gao, H.; Zhou, C.; Zhang, X. The impact of land-use changes on water-related ecosystem services: A study of the Guishui River Basin, Beijing, China. J. Clean. Prod. 2017, 163, 148–155. [Google Scholar] [CrossRef]
  15. Eckstein, D.; Künzel, V.; Schäfer, L. Global Climate Risk Index 2021; Germanwatch e.V.: Berlin, Germany, 2021; pp. 1–51. [Google Scholar]
  16. Climate Change, Agriculture and Food Security (CCAFS). Stochastic Weather Generating Tool That Uses MarkSim Application to Generate Simulated Daily Weather Data. Available online: https://ccafs.cgiar.org/resources/tools/marksimgcm-weather-generating-tool (accessed on 27 June 2022).
  17. Neitsch, S.L.; Arnold, J.G.; Kiniry, J.R.; Williams, J.R. Soil and Water Assessment Tool Theoretical Documentation (Version 2005). Available online: http://swatmodel.tamu.edu/media/1292/SWAT2005theory.pdf (accessed on 25 June 2022).
  18. Mumtas, M.; Wichien, C. Stakeholder Analysis for Sustainable Land Management of Pak Phanang River Basin, Thailand. Procedia Soc. Behav. Sci. 2013, 91, 349–356. [Google Scholar] [CrossRef] [Green Version]
  19. Noicharoen, D.; Parkpian, P.; Shipin, O.V.; Polprasert, C.; DeLaune, R.D.; Kongchum, M. Effect of salinity on adsorption and desorption of paraquat in Pak Phanang river sediment, Thailand. J. Environ. Sci. Health 2012, 47, 1897–1908. [Google Scholar] [CrossRef]
  20. Yongchalermchai, C.; Yongsatisak, S.; Khampeera, A.; Tannayopas, D. Land use changes in Pak Phanang Basin using satellite images and geographic information system. Songklanakarin J. Sci. Technol. 2004, 26, 93–102. [Google Scholar]
  21. Mumtas, M. Sustainability indicators for assessing and monitoring the resource management of Pak Phanang river basin, Thailand. Procedia Soc. Behav. Sci. 2013, 91, 341–348. [Google Scholar] [CrossRef] [Green Version]
  22. Mumtas, M. Sustainability Indicators for Assessing and Monitoring the Sustainable Land Management in the Commercial Rice Zone of the Lower Pak Phanang River Basin, Thailand. Agric. Agric. Sci. Procedia 2016, 11, 77–83. [Google Scholar] [CrossRef]
  23. Arnold, J.H.; Fohrer, N. SWAT2000: Current capabilities and research opportunities in applied watershed modeling. Hydrol. Process. 2005, 19, 563–572. [Google Scholar] [CrossRef]
  24. Zhou, L.; Dang, X.; Sun, Q.; Wange, S. Multi-scenario simulation of urban land change in Shanghai by random forest and CA-Markov model. Sustain. Cities Soc. 2020, 55, 102045. [Google Scholar] [CrossRef]
  25. Ouma, P.O.; Odera, P.A.; Mukundi, J.B. Spatial modelling of weather variables for plant disease applications in Mwea Region. J. Geosci. Environ. Prot. 2016, 4, 127–136. [Google Scholar] [CrossRef] [Green Version]
  26. Eitzinger, A.; Läderach, P.; Rodrigue, B.; Fisher, M.; Beebe, S.; Sonder, K.; Schmidt, A. Assessing high-impact spots of climate change: Spatial yield simulations with Decision Support System for Agrotechnology Transfer (DSSAT) model. Mitig. Adapt. Strateg. Glob. Chang. 2017, 22, 743–760. [Google Scholar] [CrossRef] [Green Version]
  27. Jone, P.G.; Thornton, P.K. MarkSim: Software to Generate Daily Weather Data for Latin America and Africa. J. Agron. 2000, 92, 435–453. [Google Scholar] [CrossRef] [Green Version]
  28. Jone, P.G.; Thornton, P.K. Generating downscaled weather data from a suite of climate models for agricultural modelling applications. Agric. Syst. 2013, 114, 1–5. [Google Scholar] [CrossRef]
  29. International Livestock Research Institute (ILRI). 2010. MarkSimTM DSSAT Weather File Generator. Available online: http://gismap.ciat.cgiar.org/MarkSimGCM/docs/doc.html (accessed on 17 April 2021).
  30. Van Vuuren, D.P.; Edmond, J.; Kainuma, M.; Riahi, K.; Thomson, A.; Hibbard, K.; Hurtt, G.C.; Kram, T.; Krey, V.; Lamarque, J.-F.; et al. The representative concentration pathways: An overview. Clim. Chang. 2011, 109, 5–31. [Google Scholar] [CrossRef]
  31. Meinshausen, M.; Smith, S.J.; Calvin, K.; Daniel, J.S.; Kainuma, M.L.T.; Lamarque, J.-F.; Matsumato, K.; Montzka, S.A.; Raper, S.C.B.; Riahi, K.; et al. The RCP greenhouse gas concentrations and their extensions from 1765 to 2300. Clim. Chang. 2011, 109, 213–241. [Google Scholar] [CrossRef] [Green Version]
  32. Lee Rodgers, J.; Nicewander, W.A. Thirteen ways to look at the correlation coefficient. Am. Stat. 1988, 42, 59–66. [Google Scholar] [CrossRef]
  33. Nash, J.E.; Sutcliffe, J.V. River flow forecasting through conceptual models: Part 1—A discussion of principles. J. Hydrol. 1970, 10, 282–290. [Google Scholar] [CrossRef]
  34. Barnston, A.G. Correspondence among the correlation, RMSE, and Heidke forecast verification measures; refinement of the Heidke score. Weather Forecast. 1992, 7, 699–709. [Google Scholar] [CrossRef] [Green Version]
  35. Hugo, H.C.S.; Adriana, M.C.; Joao, H.M.V.; Marysol, A.S.; Annika, K.; Luis, F.S.F.; Fernando, A.L.P. Hydrologic modeling for sustainable water resources management in Urbanized Karst Areas. Int. J. Environ. Res. Public Health 2019, 16, 2542. [Google Scholar] [CrossRef] [Green Version]
  36. Juan, A.C.M.; Tamar, A.C.A.; Sebastian, A.Z.M. Calibration and uncertainty analysis for modelling runoff in the Tambo River Basin, Peru, using sequential uncertainty fitting ver-2 (SUFI-2) algorithm. Air Soil Water Res. 2021, 14, 1178622120988707. [Google Scholar] [CrossRef]
  37. Lutz, A.F.; Immerzeel, W.W.; Shrestha, A.B.; Bierkens, M.F.P. Consistent increase in High Asia’s runoff due to increasing glacier melt and precipitation. Nat. Clim. Chang. 2014, 4, 587–592. [Google Scholar] [CrossRef] [Green Version]
  38. Zakizadeh, H.Z.; Ahmadi, H.; Zehtabiyan, G.R.; Moeini, A.; Moghaddamnia, A. Impact of climate change on surface runoff: A case study of the Darabad River, northeast of Iran. J. Water Clim. Chang. 2021, 12, 82–100. [Google Scholar] [CrossRef]
  39. Takada, A.; Hiramatsu, K.; Trieu, N.A.; Harada, M.; Tabata, T. Valuation of Impact of Climate Change and Rural Development on Rainfall-Runoff in a Southeast Asian Watershed by a Distributed Model Incorporated with Tank Models for Several Land Uses. In Proceedings of the 22nd IAHR-APD Congress 2020, Sapporo, Japan, 14–17 September 2020. [Google Scholar]
  40. Ong, C.K.; Black, C.R.; Muthuri, C.W. Modifying forestry and agroforestry to increase water productivity in the semi-arid tropics. Perspect. Agric. Vet. Sci. Nutr. Nat. Resour. 2006, 1, 1–19. [Google Scholar] [CrossRef] [Green Version]
  41. Gao, J.G. Applying Humboldt’s holistic perspective in China’s sustainability. Geogr. Sustain. 2021, 2, 123–126. [Google Scholar] [CrossRef]
Figure 1. Flow chart of this study.
Sustainability 14 09106 g001
Figure 2. LULC map of Pak Phanang River Basin in 2018, Nakhon Si Thammarat Province, Thailand.
Sustainability 14 09106 g002
Figure 3. The input data file for preparation into the SWAT model; (a) Digital Elevation Model: DEM, (b) LULC map, and (c) soil series map.
Sustainability 14 09106 g003
Figure 4. Calibration (a) and validation (b) results of the SWAT model at the X.167 runoff measuring station.
Sustainability 14 09106 g004
Figure 5. LULC change in (a) 2007, (b) 2013, and (c) 2018 in the Pak Phanang River Basin. Remarks: AGRC = Agricultural Land-Close-grown, AGRL = Agricultural Land-Generic, AGRR = Agricultural Land-Row Crops, AQUA = Aquatic, BANA = Bananas, BARR = Barren, CASH = Cashews, COCO = Coconuts, CORN = Corn, FRSD = Forest-Deciduous, FRSE = Forest-Evergreen, FRST = Forest-Mixed, MANG = Mangos, MUNG = Mung Beans, OILP = Oil Palms, ORAN = Oranges/Pomelos, ORCD = Orchard, PAPA = Papayas, PAST = Pasture, PEPP = Peppers, PINE = Pine, PINP = Pineapples, RICE = Rice, RNGB = Range-Brush, RUBR = Rubber Trees, SOYB = Soybeans, SPAS = Summer Pasture, SPOT = Sweet potatoes, SUGC = Sugarcanes, UCOM = Commercial, UIDU = Industrial, URBN = Residential, UTRN = Transportation, WATR = Water, WETD = Wetlands-Swamp forest, WETF = Wetlands-Forested, and WMEL = Watermelons.
Sustainability 14 09106 g005
Figure 6. The three future periods spatial distribution (a) economic scenarios, and (b) conservation scenarios.
Sustainability 14 09106 g006
Figure 7. Regression results of the weather between the MarkSim generated data and the observation data.
Sustainability 14 09106 g007
Figure 8. Average monthly rainfall and runoff for the historic period (1993–2018).
Sustainability 14 09106 g008
Figure 9. Annual runoff for the RCP scenarios for 2025, 2055, and 2085.
Sustainability 14 09106 g009
Table 1. General Circulation Models used in this study. The information adapted from the manual of MarkSim™ DSSAT weather file generator and Ouma et al. [25,29].
No.ModelsResolutionNo.
1Beijing Climate Center Climate System Model version 1 (BCC-CSM1-1)2.8125 × 2.8125Beijing Climate Center, China Meteorological Administration
2Beijing Climate Center Climate System Model version 2 with a moderate resolution (BCC-CSM1-1-M)2.8125 × 2.8125
3Commonwealth Scientific and Industrial Research Organisation (CSIRO-Mk3-6-0)1.875 × 1.875Commonwealth Scientific and Industrial Research Organisation and the Queensland Climate Change Centre of Excellence
4First Institute of Oceanography-Earth System Model (FIO-ESM)2.812 × 2.812The First Institute of Oceanography, SOA, China
5Geophysical Fluid Dynamics Laboratory Climate Model version 3 (GFDL-CM3)2.0 × 2.5Geophysical Fluid Dynamics Laboratory
6Geophysical Fluid Dynamics Laboratory Climate Model (GFDL-ESM2G)2.0 × 2.5
7Geophysical Fluid Dynamics Laboratory Climate Model (GFDL-ESM2M)2.0 × 2.5
8Goddard Institute of Space Studies (GISS-E2-H)2.0 × 2.5NASA Goddard Institute for Space Studies
9Goddard Institute of Space Studies (GISS-E2-R)2.0 × 2.5
10Hadley Global Environment Model 2-Earth System (HadGEM2-ES)1.2414 × 1.875Met Office Hadley Centre
11Institute Pierre Simon Laplace-Low Resolution (IPSL-CMSA-LR)1.875 × 3.75Institute Pierre-Simon Laplace
12Institute Pierre Simon Laplace-Mid Resolution (IPSL-CMSA-MR)1.2587 × 2.5
13An atmospheric chemistry coupled version of MIROC-ESM (MIROC-ESM)2.8125 × 2.8125Atmosphere and Ocean Research Institute (The University of Tokyo), National Institute for Environmental Studies, and Japan Agency for Marine-Earth Science and Technology
14An atmospheric chemistry coupled version of MIROC-ESM (MIROC-ESM-CHEM)2.8125 × 2.8125
15Model for Interdisciplinary Research on Climate (MICRO5)1.4063 × 1.4063Japan Agency for Marine-Earth Science and Technology, Atmosphere and Ocean Research Institute (The University of Tokyo), and National Institute for Environmental Studies
16Meteorological Research Institute (MRI-CGCM3)1.125 × 1.125Meteorological Research Institute
17Norwegian Earth System Model (NorESM1-M)1.875 × 2.5Norwegian Climate Centre
Table 2. Representative Concentration Pathways adapted from Van Vuuren et al. and Meinshausen et al. [30,31].
RCPDescription
RCP2.6The radiative forcing peaks at ~3 W/m2 before 2100, and then declines to 2.6 W/m2 (GHGs peak at ~450 ppm CO2eq in 2050, and then decreases).
RCP4.5The radiative forcing increases to ~4.5 W/m2 before 2100, and then stabilizes at that level (stabilization GHGs ~550 ppm CO2eq).
RCP8.5The radiative forcing increases to 8.5 W/m2 by the end of 2100 according to high greenhouse gas emissions (GHGs increase to ~1000 ppm CO2eq in 2100).
Table 3. The streamflow of SWAT calibration and validation.
Evaluation StatisticsThe X.167 Runoff Measuring Station
CalibrationValidation
NSE0.820.86
R20.890.96
RMSE4.424.65
Table 4. Sensitive parameters to inflow in SWAT model in this study.
RankParameters Name CodeDefinitionMinMaxRelative SensitivityCategory of Sensitivity
1CN2SCS runoff CN for moisture condition II4010570Very high
2ESCOEvaporation from soil compensation factor010.55High
3SOL_AWCThe soil available water capacity (mm/mm soil)010.85High
4SLOPEAverage slope steepness (m/m) N0.000010.450.65High
5GW_QMNThe depth of water in shallow aquifers to allow for reverse flow. (mm)06000400High
6SOL_ZThe depth of soil. (mm)040002000High
Remark: Relative sensitivity is the index of determines the parameter value sensitivity.
Table 5. Regression equation between the MarkSim generated data (x value) and the observation data (y value).
Weather DataRCPsRegression EquationR2
Maximum temperatureRCP2.6y = 1.2457x − 6.9730.8324
(Tmax)RCP4.5y = 1.228x − 6.41310.8395
RCP8.5y = 1.2216x − 6.17050.8288
Minimum temperatureRCP2.6y = 1.2883x − 6.60960.7983
(Tmin)RCP4.5y = 1.2727x − 6.22160.7883
RCP8.5y = 1.2572x − 5.83660.8025
RainfallRCP2.6y = 0.9091x − 6.50620.8410
(Rain)RCP4.5y = 0.9431x − 10.1270.8653
RCP8.5y = 0.9143x − 6.94810.8585
Table 6. Runoff change on climate and land-use change scenarios in the Pak Phanang River Basin in 2025, 2055, and 2085.
YearRunoff (×106 m3)Runoff Change (%)
BaselineRCP2.6RCP4.5RCP8.5RCP2.6RCP4.5RCP8.5
202527.8031.2541.5022.5012.4149.28−19.06
205527.8021.5014.8311.58−22.66−46.64−58.33
208527.8026.756.0811.69−3.78−78.12−57.93
Publisher’s Note: MDPI stays neutral with regard to jurisdictional claims in published maps and institutional affiliations.

