Article

Livelihood Impacts of Large-Scale Agricultural Investments Using Empirical Evidence from Shashamane Rural District of Oromia Region, Ethiopia

College of Development Studies, Addis Ababa University, Addis Ababa 1000, Ethiopia
*
Author to whom correspondence should be addressed.
Sustainability 2022, 14(15), 9082; https://doi.org/10.3390/su14159082
Submission received: 9 June 2022 / Revised: 6 July 2022 / Accepted: 8 July 2022 / Published: 25 July 2022

Abstract

:
The impact of Large Scale Agricultural Investments (LSAI) on local people’s livelihood improvement has received less attention than it deserves in Ethiopia in general, and the Oromia regional states in particular. The main objective of this study was to analyze the impact of LSAI, which began operations in 2008, on 10,000 hectares of fertile land in the Shashamane rural district of Oromia region, Ethiopia to enhance the quality of life of the local people. A quasi-experimental study design strategy was used to achieve this goal. We obtained primary data from 300 households, comprising 134 treatment homes (households in a community with LSAI) from the Shashamane rural district and 166 control households (households in a community without LSAI) from the Shala district using systematic random sampling. Analysis was undertaken using principal component analysis (PCA) and propensity score matching (PSM). The Sustainable Livelihoods Framework (SLF) was used to examine the theoretical concept with empirical findings. According to the Average Treatment Effect on Treated (ATT) results, the treated households’ natural, human, and financial capital were −0.91, −0.81, and −0.15 less than control families, respectively. Loss of household livelihoods has deepened and exacerbated local poverty. Businesses have not mechanized and controlled these sizable portions of the parcel; instead, peasants have worked on them and exploited the idle parcel. The research suggests that the government’s pro-LSAI investment policy is desirable. However, weak institutional frameworks for protecting local people’s livelihoods as well as LSAI malpractice and the lack of continuous follow-up are causing the LSAI policy to fail. To mitigate the negative impact of LSAI on peasants, it is necessary to consider the local people’s livelihoods, responsive institutions, and accountable ventures.

1. Introduction

As a result of the 2008 increase in global agricultural commodity and energy prices [1], high population pressure in rural areas, the rising middle-income population in the urban centers, and swift inflation in agriculture services, large scale agricultural investment (LSAI) in developing and low-income countries is now being promoted [2,3]. Even though the land is globally limited, its fertility is required to produce agricultural commodities [4]. The increasing demand for fertile land combined with a limited resource basis will cause the increasing scarcity of agricultural land [2,5]. The agriculture sector, dominated by small farms with less than 2 hectares and managed by family labor, is the backbone of the Ethiopian economy [6]. Ethiopia is a rural country with almost 80% of its population living in rural areas, and land is the most central means of livelihood for rural farmers [7]. Ethiopia has immense potential for investment for several reasons. Agricultural investment opportunities are the major investment areas in the country [8] and since 2008, the scale and pace of ongoing LSAIs have been remarkable [9]. These include large-scale agro-investments, small-scale intensive agri-business such as floriculture; investment in other sectors that require agricultural raw materials (for instance, breweries); and the industrial construction and mushrooming of cities and towns [10,11]. On top of this, Ethiopia has great market potential in crops and livestock production compared to the Middle East, Europe, and Asia. For the past five consecutive years, the agriculture sector has grown faster with a more than 11% average annual growth rate, and this growth has triggered an increase in the domestic market for both livestock and food crops [12]. Under the Old Regime (Imperial period), large–scale mechanized agriculture (commercial farming) was seen as a vibrant force for the rural revolution, leading to mechanized agriculture expanding rapidly and in a variety of ways by the 1960s. Cereal pulses, sesame seeds, pepper, fruit, and vegetables, which were the most significant, were among the prominent expanding goods. Early mechanized farms focused on a small number of commercial crops such as sugarcane, cotton, and coffee, but by the 1970s, a wide range of crops was being grown for both the domestic and international markets, with cereal pulses, sesame seeds, pepper, fruit, and vegetables being the most significant. The full extent of mechanized agriculture will probably never be known because the registration of large-scale farm registration has been limited to district administration [12,13]. Since the 1975 radical land reform, the de jure land tenure system throughout Ethiopia has stated ownership [14]. Following the provisions of the current FDRE’s (Federal Democratic Republic of Ethiopia) Constitution, the land tenure system allows the federated states in Ethiopia to develop their own land administration and agricultural investments policy [FDRE, 1995]. Ethiopia, and the Oromia regional state investment-friendly policies, are based on the premise that the promotion of agriculture investments will lead to positive synergies for improvements in the livelihoods of rural smallholders, which will provide previously unavailable employment and off-farm income opportunities that will result in even greater benefits [15]. In recent times, land transactions for large-scale commercial farming in Ethiopia have experienced a significant increase [16,17,18]. To secure these opportunities, the Government of Ethiopia has strategically encouraged land deals for LSAIs as part of its five-year Growth and Transformation Plan (GTP), envisioning that the nation will secure food and cross the threshold prominence of lower-middle-income countries by 2025 [19,20]. In the Oromia regional state, the government has leased out more than one million hectares of land to foreign and domestic investors who are supposed to cultivate food and biofuels in large-scale farming [12]. In the country, the Oromia regional state is among the top three regions regarding LSA. These LSAIs have contributed to a rise to the recent widespread Oromo protests (2014–2018), and consequently, more than 1000 people have been killed, and tens of thousands exposed to gross violations of human rights [21]. Furthermore, in terms of the land size and scale of its acquisition, this is likely to continue because of: (i) the urgency toward the production of agro-fuels as an alternative to fossil fuels; (ii) the scarcity of land resulting from population growth and urbanization; (iii) the price scramble and global food shortages as demand increases from big economies such as India and China; (iv) the scarcity of fresh water in some regions; and (v) an increased demand for certain raw materials from tropical countries [2,3]. Despite the fact that many types of research have been conducted regarding the acquisition of large farmland, monetary income to the government, human rights violations, migration and compensation for land, domestic market expansion, and new job opportunities, further studies are required regarding the overall livelihood impacts of LSAIs [16]. Moreover, studies [4,22] have also discussed that there is little information on the impacts of agricultural investments on the improvement in the livelihoods of the local community in implemented areas and the country at large. Moreover, the impact of LSAIs on livelihood improvement above all in Oromia has been, however, not yet fully understood. As a result, the livelihood impacts of Elfora-Agro-industrial P.L.C (Private Limited Company) in Shashamane rural district, Oromia Region, Ethiopia, where the operation began in 2008, are unknown. The purpose of this study was to determine whether or not LSAIs improve the local community livelihood outcomes. Natural, human, financial, physical, and social capital were used to assess the improvements or otherwise of the local community’s livelihood conditions. The paper thus makes two contributions. First, it provides insights into the impact of LSAI on the livelihoods of the local community, which is one of the most debated issues; second, it employs all of the livelihood assets or the five livelihood indicators for its multiple dimensions as well as robust econometric models such as PSM (propensity score matching). The following sections present the analytical and conceptual framework, materials and research method, results, discussions, and conclusions.

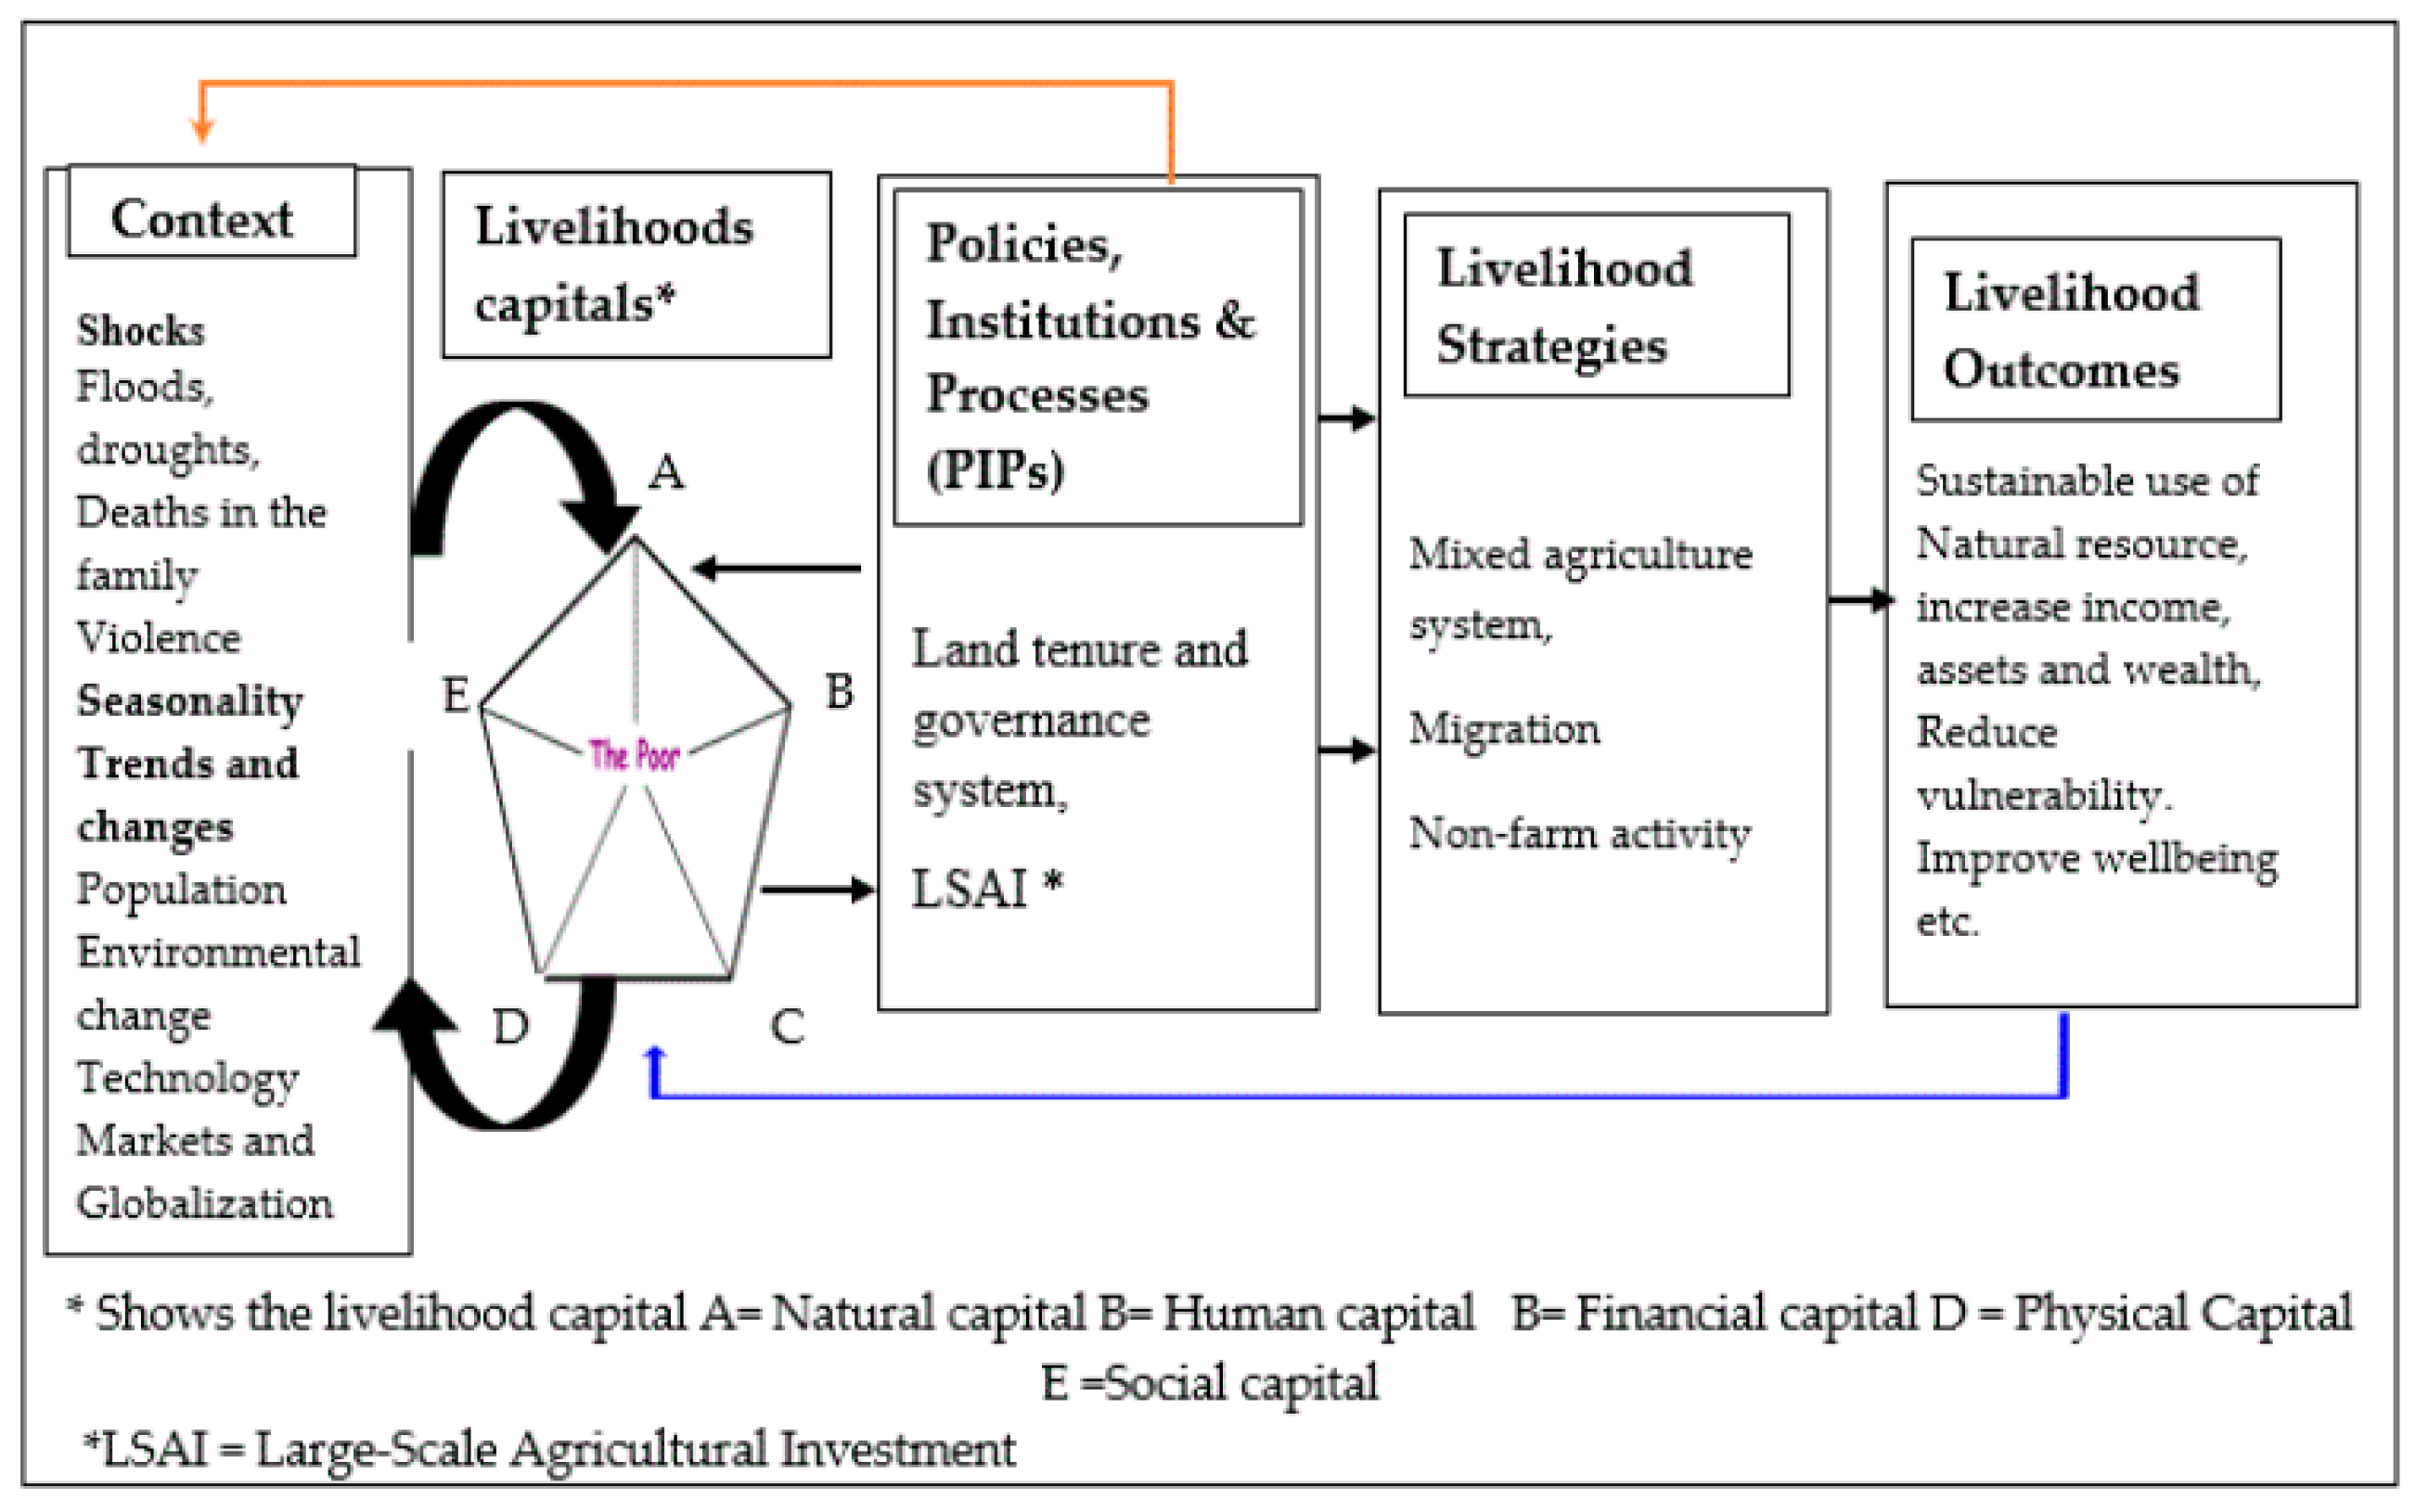
2. Analytical and Conceptual Framework

Aiming to examine the impact of LSAI on the livelihood (the means of gaining a living) of local people in Oromia regional state, Ethiopia, this study employed the Sustainable Livelihood Framework (SLF), binary logistic model, and PSM [23,24]. Several authors have defined the term sustainable livelihood in different ways in connection with natural resource management, agricultural development, poverty alleviation, and food security. Nonetheless, considering the most common definitions, a sustainable livelihood can be defined as people’s capacity to maintain living while surviving shocks and stresses and enhancing their quality of life on a long-term basis (i.e., both now and in the future) without jeopardizing the livelihood options of others [25,26,27,28]. Knowing this, we undertook many studies regarding the livelihood context in several countries such as Mali, Bangladesh, Zimbabwe, Ethiopia, and Uganda [29]. Various institutions including the FAO of the United Nations, the Overseas Development Institute, the Institute of Development Studies, and the European Union, and non-governmental organizations such as the Cooperative for Assistance and Relief Everywhere Inc. and OXFAM and donors (e.g., the UK Department for International Development (DFID) and the United Nations Development Program (UNDP) have developed frameworks to analyze the sustainability of livelihoods [30,31]. The SLF in Figure 1 contains five components: context, assets, policies and institutions, livelihood strategies, and livelihood outcomes [32]. The context indicates trends and shocks in the external environment of individuals, households, and communities that affect people’s livelihoods (e.g., conflict, illnesses, floods, droughts, pests, and diseases) [33]. Livelihood assets are the resources on which people depend to carry out their livelihood strategies. According to some international scientific consensus, livelihood capital comprises five categories vis-a-vis human (education, skills, labor, health), natural (land, forest, water), physical (livestock, roads, markets), financial (savings, credit, income), and social (networks and connections) capital [25,33]. Policies and institutions are the formal and informal rules that enable or hinder access to assets, especially land and livelihood strategies [8]. Intensification, migration, pastoralism, and non-pastoral activities are some of the livelihood strategies that have been undertaken to live [33,34]. Livelihood strategies lead to livelihood outcomes. We can relate these outcomes to income and well-being, reducing vulnerability, improved living standards, reducing poverty, and the sustainable use of natural resources [35,36,37]. A conceptual framework, work used to assess the impact of large-scale land investments on livelihood, is presented in Figure 1, which indicates how the variables interact with each other. Therefore, we adopted the Sustainable SLF to capture the full impact of LSAI on the local community livelihood because SLF recognizes human agency and examines how household livelihood strategies are built [38]. The SLF is also strong enough to soundly identify explanatory variables used in the empirical analysis. This study answered the following two questions. (1) What are the impacts of LSAI on the local people’s livelihood in the Shashamane rural district in the Oromia regional state? (2) What are the possible determinants of household livelihood in the Shashamane rural district affected by LSAIs?

3. Materials and Research Method

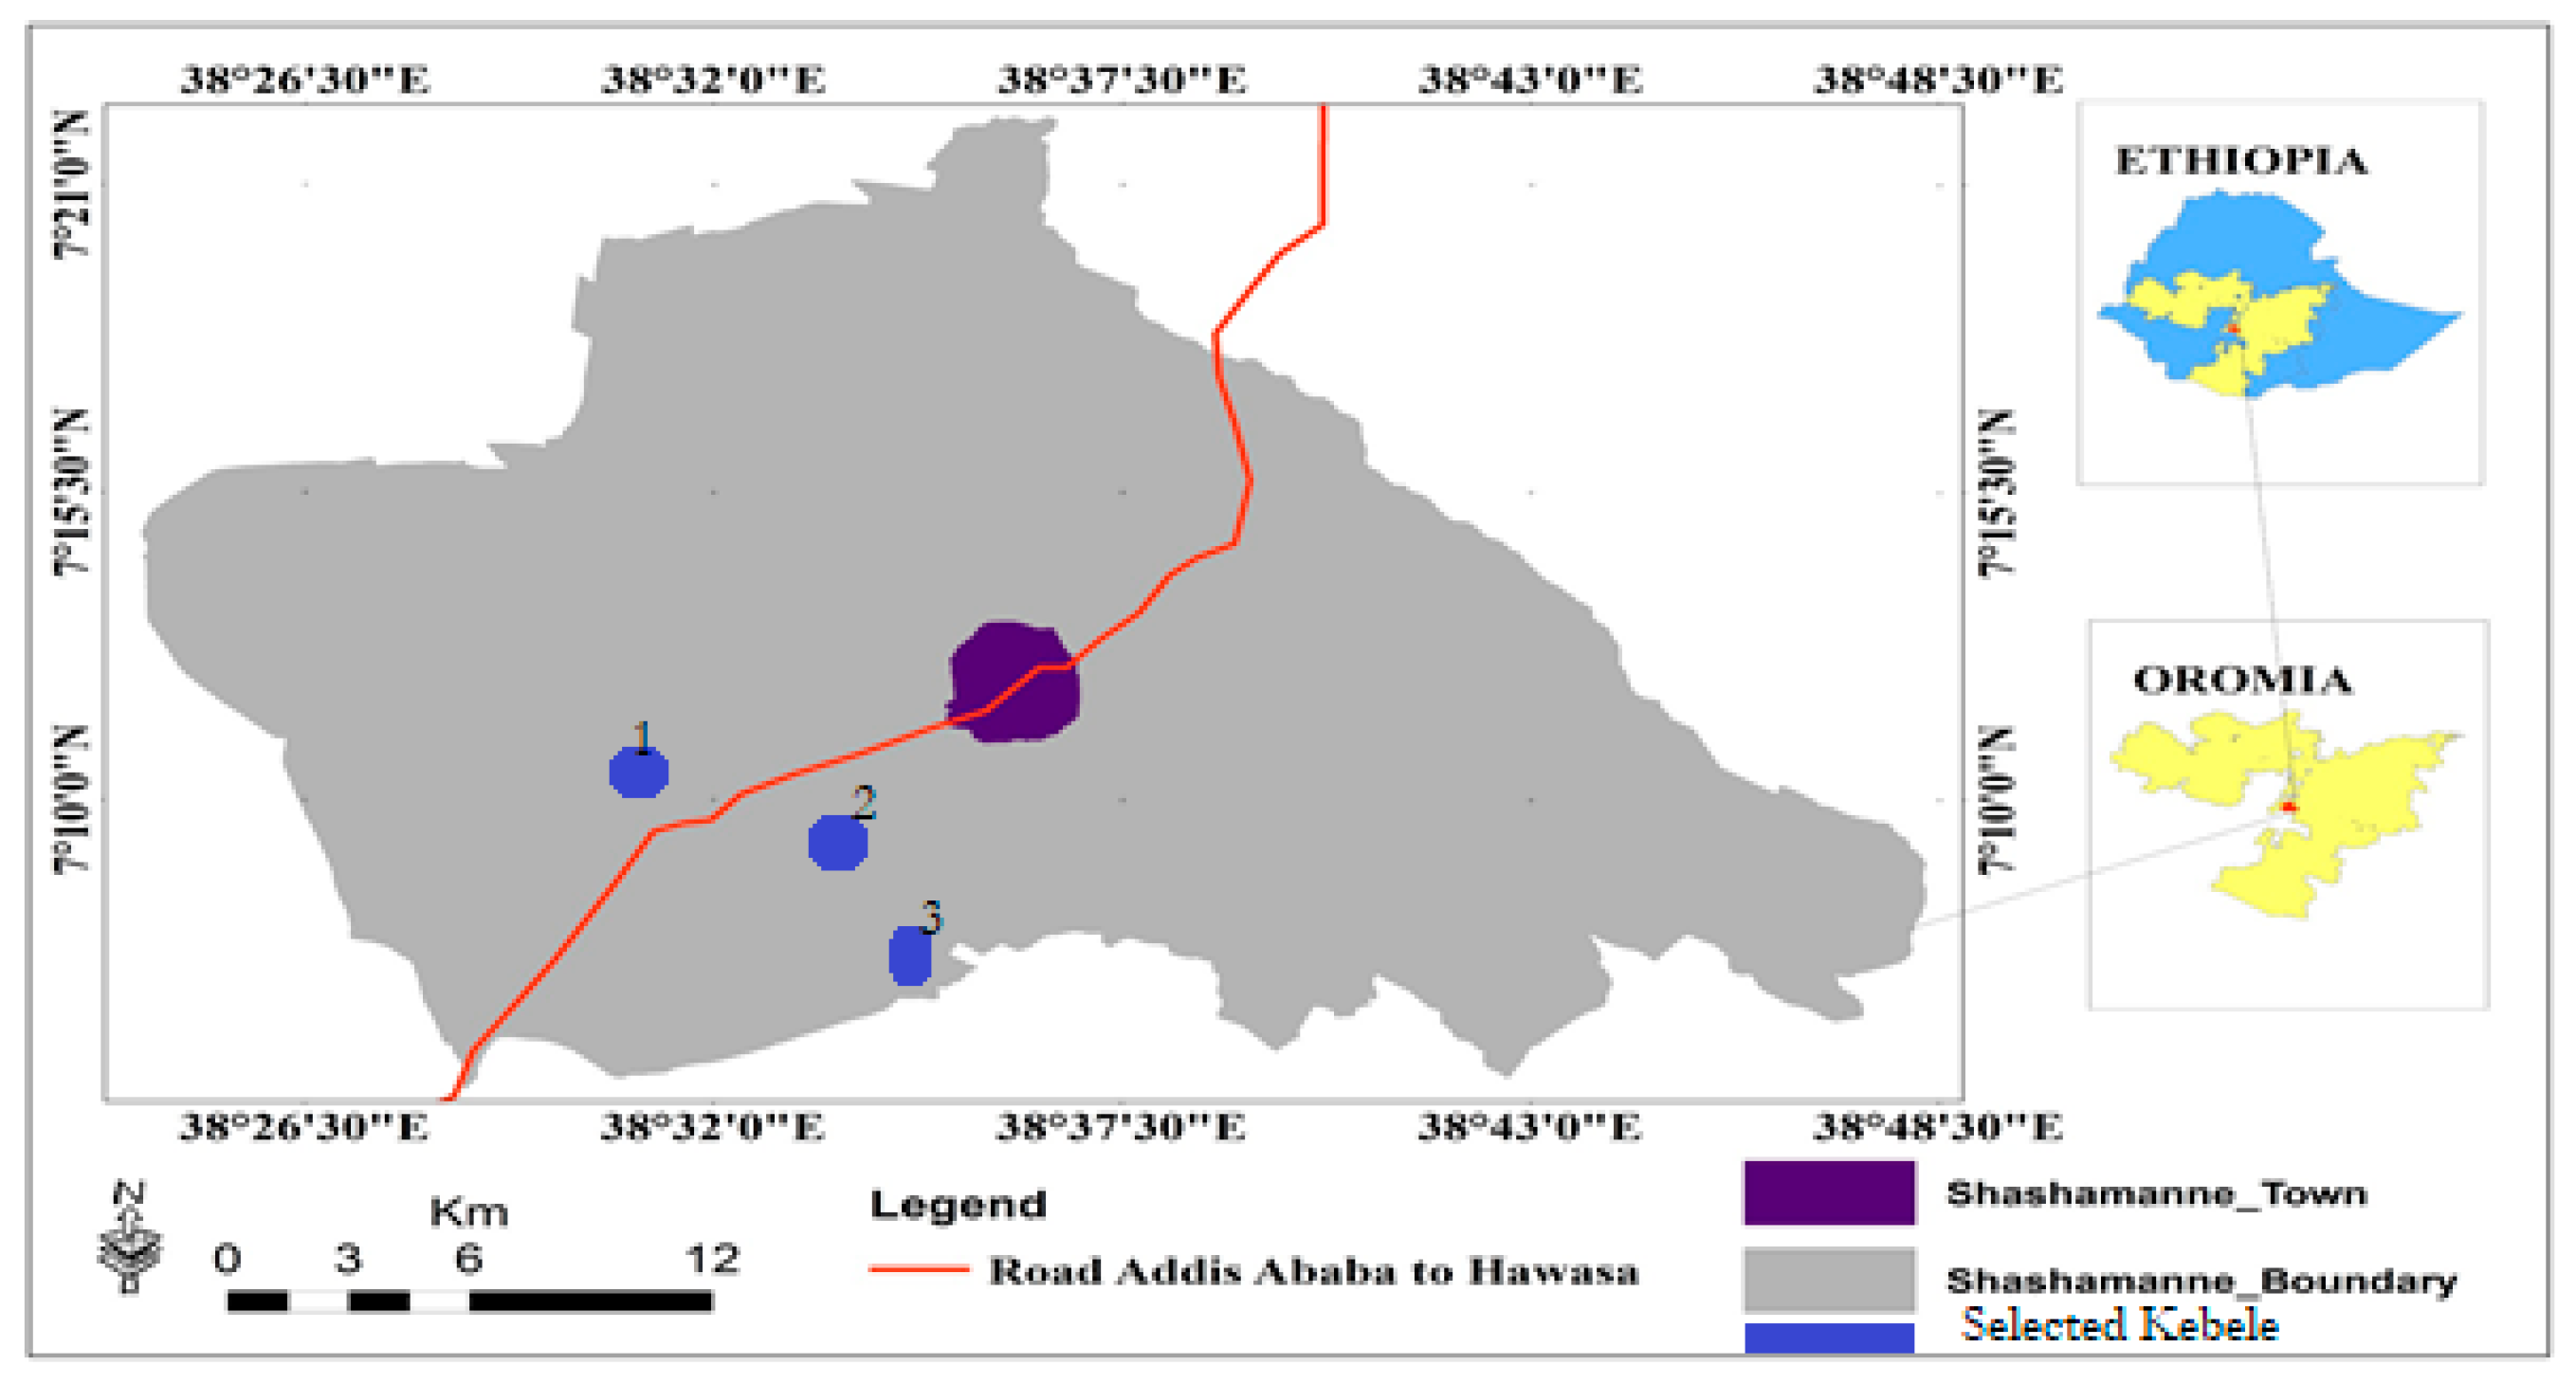
3.1. Description of the Study Area

Background of Elfora Agro-Industries P.L.C. and Shallo-Melga LSAI Farm Project

Under the MIDROC Ethiopia Investment Group, the Agriculture and Agro-processing Cluster, Elfora Agro-Industries P.L.C., and Saudi Star Agriculture Development companies’ lease is 140,000 and 10,000 ha, but the company aims to increase this to 500,000 ha in all parts of Ethiopia for different investment projects in the country [39]. Elford Agro-Industries P.L.C.’s Shallo and Melga farm is one of the companies engaged in agricultural and agro-processing operations in Shashamane rural district, 250 km (kilometer) from the capital Addis Ababa. This farm currently cultivates and grows commercial maize (BH661, BH546), wheat, haricot bean (Nassri, Awassa, Dume), white beans, and soya beans using water from Tikure Woha River and groundwater irrigation for the domestic and international market. The selected areas (1) Toga (2), B/Dannaba and (3) D/Calalaqaa kebele (kebele, lower administration unit in Ethiopia) are adjacent to the farm, and are about 5 km, 7 km, and 5.5 km far in the west, east–west, and east directions of the farm, respectively (see Figure 2). The Shala district can be found outside a 30 km radius of Elford Agro-Industries P.L.C. in the west.

3.2. Research Design

To achieve the objective of the study, a quasi-experimental, and cross-sectional survey research design was implemented, which are among the non-experimental research designs. Primary and secondary types of data were collected through both quantitative and qualitative approaches.

Quasi-Experimental Design

Two groups were used to compare the five livelihood capital differences between households in the district and kebele with LSAIs, and households in the district and kebele without LSAIs were classified as the treated and control groups.

3.3. Sampling Techniques and Sample Size

To determine the appropriate sample size, the nature of the population, the purpose of the study, the level of precision and confidence or risk, and the degree of variability in the attributes being measured were major considerations [41,42]. While there are no universal guidelines, the sample size is usually governed by the populace to be tested. Generally, due to easy access to data, cost-effectiveness, and easy management of the data, the study population is selected purposively. More specifically, multi-stage sampling procedures are used to select sample respondents. First, the Shashamane rural district was selected purposely for the reason that it has had a noticeable capacity of having the LSAI program for more than 10 years. Furthermore, the motive for selecting the area was due to its higher population, the presence of many other private small to LSAI and the limited study on livelihood capitals, and the fact that it is a future investment focus area. In this stage, the Shale district, which is 30 kms far from the investment, was also selected. In the second stage, from the Shashamane district, seven kebeles that were less than or equal to 10 kms far away from the investment, and 19 kebeles from the Shale district that had similar livelihoods before the investment were selected. In the third stage, six (three from Shashamane and three from the Shale districts) kebeles were randomly selected. To determine a representative sample, Cochran (1977) [43] was applied considering a 95% confidence level (z = 1.96), 70% estimated proportion of an attribute in the population (p), and 5% of the level of precision (E) from 4698 (6% or 300 of the total population was sampled) total households. Finally, 300 sample sizes, 134 households from the LSAI area (treatment group) and 166 households from non-LSA or without a LSAI (control group) were identified using a simple random sampling technique from each stratum.
n 0 = Z 2 p q e 2 = 1.96 2 × 0.65 ( 1 0.65 ) 0.05 2 = 3.841 × 0.65 × 0.3 0.0025 = 322.64
where no is the sample size; z = is the selected critical value of desired confidence level; p = is the degree of variability in the population; q = 1 − p and E is the desired level of precision.
n 0 = n 0 1 + ( n 0 1 ) N = 322.64 1 + ( 322.64 1 ) 4698 = 302 ~ 300
where n = desired sample size.
A commonly used margin of error in social science surveys is 10% of the expected average value [42]. Apart from this, 3%, 5%, 7%, and 10% of margin of error are accepted in determining the sample size. Considering available resources to manage the study, a 5% precision level was used to determine the sample size [41,44]. However, for this study, and considering the available resources and time to manage the study, we used a 0.5% precision level and a 70% estimated proportion of an attribute in the population (N) to determine the sample size. This 300 was distributed through to the six kebele using the proportional to size (PPS) formula (see Appendix A Table A1):
n i = n 0 × N i N
where ni is the sample of strata I; Nis is the population of strata; n = total sample size
n 1 = n 0 × N i N = 300 × 2098 4698 = 134
n 2 = n 0 × N i N = 300 × 2600 4698 = 166

Sampling Producer

This study employed a systematic sampling.
K = N n = 4698 300 = 16
So, every sixteenth household was selected until the sample size was completed.

3.4. Methods of Data Analysis

Both descriptive statistics and an econometric model were employed. Data collection was undertaken at the Shashamane district (Toga, B/Dannaba, and D/Calalaqaa) and Shala District kebeles (Solicha, Waka, and Bute) with the time interval from October to December 2020. Before collecting the relevant data, the questionnaire was pretested and finally approved through face validity and its reliability was also confirmed by estimating the Cronbach’s alpha (α = 0.79), which is within an acceptable range of the coefficients of reliability [45]. After verification and coding of the filled-in questionnaires, the survey data were entered into Stata/MP version 16.0 and PS SS version 25. The questionnaire used for this study was based on close- and open-ended type of questions, and the structure was classified into five livelihood capitals: A—natural capital such as productive land, irrigation, soil, forests, water, air, and so on, B—human capital such as education, skills, knowledge, the ability to work, and good health, C—financial capital such as savings in bank or microfinance, access to financial services, and regular inflows of money access to institutions and savings, D—physical capital such basic infrastructure, for example, transport and communication systems, shelter, water and sanitation systems, and energy infrastructure, E—social capital such membership of groups or organizations as well as the federal, regional, and local Institutions governing LSAI and outcomes as depicted in the conceptual formwork (Figure 1). The descriptive statistics used include the mean, standard deviation, minimum, paired sample t-test, and chi-square test to make important comparisons. To analyze the impact of LSAIs on the livelihood of the local people, a PSM analysis was applied [46].

3.4.1. Econometrics Model Analysis

Based on the surveyed data type, ease of analysis, and interpretation, PSM econometric analysis tools are appropriate for the study. The objective of employing PSM is to minimize the selection bias from treatment groups in observational datasets. It was used to form a comparison group that is similar to the treatment group in terms of the observable characteristics and to estimate the impact of LSAI on the livelihood level of the households. Moreover, a simple comparison of these two groups may result in serious biases and confusing conclusions. PSM is a pertinent approach to avoid such problems of bias and misleads, as proposed by several authors [24,47,48], and is one of the existing econometric methods to deal with these biases [46]. The model was also fitted to provide a cause and effect explanation in a quasi-experimental design and properly construct statistical treatment and comparison groups [49] and it measures the magnitude of the impact in terms of the Average Treatment Effect on the Treated households (ATT). PSM can be used to estimate the program or impact of the policy change effects whenever the program implementation generates pools of treated and untreated individuals from which the two matched groups can be drawn. The other reason to implement PSM among other non-experimental methods is that evaluation research lies in devising methods to reliably estimate (the impact of policy change), so that informed decisions about program expansion and termination can be made [50,51]. The details of the PSM model and its specifications are given below.

Model Specification

The PSM estimators of ATT can be written by Caliendo (2008) as:
t A T T = E ( Y 1 Y 0 / D = 0 , P ( X ) ) = E ( Y 1 / D = 1 , P ( X ) ) E ( Y 0 / D = 0 , P ( X ) )

Sensitivity Analysis

This part is the last step of the PSM was conducted to check whether the findings of the study are free from hidden bias. The basic question to be answered here is whether inference about the treatment effects may be changed by unobserved factors [48,52]. The estimation of treatment effects with matching estimators is based on the confoundedness or selection of observable assumptions. However, if there are unobserved variables that affect assignment into treatment and the outcome variable simultaneously, a ‘hidden bias’ might arise [46]. Since it is not possible to estimate the magnitude of selection bias with non-experimental data, the problem can be addressed by sensitivity analysis [52]. To check for unobservable biases, the Rosenbaum bounding approach sensitivity analysis was performed on the computed outcome variables for deviation from the conditional independence assumption [46,47].

Livelihoods Asset/Wealth

As livelihood asset/wealth index is used as an outcome variable, we were interested in measuring and scrutinizing whether or not it is impacted by the intervention variable (LSAI). The concept of livelihoods is a reference point for a wide range of people involved in different aspects of development policy formulation and planning. As analysts point out, there are two broad approaches to defining livelihoods. One has a narrower economic focus on production, employment, and household income. The other is to take a more holistic view that unites concepts of economic development, reduced vulnerability, and environmental sustainability while building on the strengths of the rural poor [28,36]. The livelihood concepts and methodological approaches used for this research are rooted in the conceptual framework of sustainable livelihoods as presented in Figure 1. This study also used the FAO classification of the five livelihood assets under different livelihood components [51]. Therefore, to properly address the multi-dimensional nature of wealth, we operationalized it along the five livelihood assets dimensions used as indicators to capture the livelihood status of the households as follows. (i) Human capital includes labor, skills, creativity, education, and a social network; (ii) natural capital refers to one’s access to natural resources such as land, water, minerals, forest, pastures, and crops; (iii) physical capital is about food stocks, livestock, tools, or machinery; (iv) financial capital refers to money, loans, credit, remittances, state transfers, or savings; and (v) the last ‘capital’ is social capital, which mainly concerns the quality of relationships among different people and the extent to which one can rely on support from the family or perhaps mutual assistance [25,53].

Weight Allocation and Data Requirement

To identify the relevant variables and arrive at relative weights, to consolidate these variables into a single index, principal components analysis (PCA) was chosen. Recently, many scholars have used principal component analysis to measure the sustainable livelihood adopted by the Department for International Development (DFID), poverty, and vulnerability [54,55,56]. We employed data-driven non-price weighted indices of PCA because PCA is a broadly used statistical-based technique to construct a sustainable livelihood index and determine a single variable, one for each of the five livelihood assets. It is a type of factor analysis that is often used to reduce dimensions of data, or find out hidden variables, by digging out a linear combination that preeminently depicts the co-variance among all components [57,58]. Every household is categorized by an asset index, Ai, which is a function of a set of variables, aij, representing their ownership of asset j:
A i = f ( a i j ) = f ( a i 1 , , a i k )
where j = [1; k].
Each household asset index, Ai, can, consequently, be calculated as the sum of assets (durables or other households’ capital description) owned by the household, to which a weight is assigned for each asset as of the following equation.
A i = ( v 1 × a i 2 ) + ( v 2 × a i 2 ) + + ( v k × a i k )
This index can be constructed based on the data related to household assets by creating an m × n matrix, X, where n represents the ownership of asset items (columns) to be collected from m households (rows). Subsequently, every component of the matrix X is normalized by deducting the column mean from it and dividing the variations by the column standard deviation to create a new m × n matrix, Y. Furthermore, the n × n correlation matrix, R, is calculated from the normalized data matrix, Y.
( R O I ) V = 0
Based on the above equation, O and V can be solved [59]. In Equation (3), O represents a vector of eigenvalues, I stands for an identity matrix, and V represents a matrix of eigenvectors related to the eigenvalues in O. Each eigenvector will then be balanced to check that its sum of squares becomes equivalent to the total variance. Following this, the result of the normalized matrix of asset items, Y, and the matrix of scaled eigenvectors, V* creates a set of uncorrelated linear groupings of the asset items for every household j, called principal components. The asset index is typically assumed to be the first principal component (the efficient component) that is related to the largest eigenvalue. The first principal component explains the highest variation in the original dataset. It assigns the larger weights to assets that largely vary across households; hence, assets found in most households receive small weights. In this study, LSAI was taken as the dependent variable, which is explained by different demographic, socio-economic, and institutional factors. Moreover, the treatment and control households differed in several characteristics (such as sex, age, family size, dependency ratio, land size, etc.), which might influence the probability of participation in the LSAI. Based on previous studies [24,55,60], specific conditions in the study area and 14 independent variables were selected. The full lists of the explanatory variables’ names, descriptions, units of measure, and expected signs are presented and summarized in Appendix A, Table A2.

4. Empirical Results

4.1. Descriptive and Summary Statistics for Treatment and Control Sample Households

The analyzed data consisted of 300 properly filled questionnaires, where 134 (44.6%) of respondents were from Shashamane rural households (in a community with a LSAI) and 166 (55.4%) of respondents were from the Shala district (household community without a LSAI) in the West Arsi Zone, Oromia Region, Ethiopia. The results of the descriptive statistics presented in Table 1 show that there was a significant difference between the treatment and control groups in their age, education, total family size, dependency ratio, farmland size, total livestock owned in tropical livestock units, distance to potable water points, availability of nearest market, training on agricultural technology, and access to credit. However, no significant difference was observed between the two groups in variables such as sex, perception of aid, availability of all-weather roads, and the nearest health center. The results of the descriptive statistics presented in Table 1 also show that 95.6% of households were male households. Out of the total respondents, 85.7% of respondents went to school, and the majority had completed primary education. However, only 14.3% did not have the chance to go to school. The results of the study also revealed that the market was accessible for about 65.6% of the treatment households, whereas 81.15 of the control groups accessed the market for their products. Regarding the accessibility of water, only 7.46% of respondents from the treatment group accessed at least 20 L of water per person per day from a source 10 km away from their dwelling in the past year, but it was 30.7% for the control group. The percentage distribution of the treatment and control groups concerning access to training in agricultural technology in the past year was 75.3 and 57.8%, respectively. The chi-square test showed that there was a significant difference between the treatment and control groups in sex, education, market access, access to water of at least 20 L of water per person per day, and agricultural technology at less than 1% significance level.
In Table 2, the t-test results are shown of the characteristics of the respondent households selected. The mean age of treatment households was 42 years, whereas it was 45 years for the control households. This implies that younger households participated in the LSAI project. The mean total family size of treatment households was 4.88 years and the mean total family size of control households was 5.83 family members, implying that relatively fewer households participated in the LSAI project. The results of the t-test showed (−4.4246) that there was a statistically significant mean difference between the treatment and control households at 1%. The households of the treatment group had on average fewer family members compared to the control group. Furthermore, the mean dependency ratio of the treatment and control sample households was 94.89 and 125.63, respectively. The results of the t-test showed that (−4.33) there was a statistically significant mean difference between the treatment and control households in their dependency ratio at a 1% significance level. The mean landholding size of the treatment group and control group households was 1.19 and 2.06, respectively. This shows that the control groups had a relatively larger land size than the treatment groups. The results of the t-test (−11.21) showed that there was a statistically significant mean difference in far/land size between the treatment and control households in their dependency ratio that was significant at 1%. The mean livestock holding of the treatment and control households was 5.12 and 6.58 in TLU (total livestock unit), respectively. This shows that the control groups had a relatively large TLU than that of the treatment groups. The results of the t-test showed that there was a statistically significant mean difference between the treatment and control households at 1%.

4.2. Descriptive and Summary Statistics of Livelihood Impact Indicator

The study results also showed a statistically significant mean difference between the five livelihood impact indicators. The average natural capital for treatment households was lower than (0.05) that for the control households (0.97) with a standard deviation of 0.15 for the treatment and 0 for the control groups, respectively. This implies that most precious natural capital resources are diminished due to LSAI (source). The average human capital for treatment households was 0.13 and the average human capital for control households was 0.95 with a standard deviation of 0.17 and 0.06, respectively. The mean financial capital for treatment households was 0.00, whereas for the control households, it was 0.05 units. Physical capital was higher for the treatment households (0.98) than for the control households (0.043). The average social capital was higher for the treatment households (0.812) than for the control households (0.00). This implies that LSAIs have a positive impact on the treatment of households in social capital due to the highest population. The results of the t-test showed that there was a statistically significant mean difference between the treatment and control households in their natural, human, financial, physical, and social capital at a 1% significance level (see Table 3).

4.3. Regression Result of the Binary Logistic Model

Of the total 14 variables included in the study, eight were significant (see Table 4). The positively significant variables were sex (p = 0.068, at 10% significant), total family size (p = 0.003, at 1%, significant), dependency ratio (p = 0.018 at 5%), farmland size (p = 0.000, at 1% significant), total livestock amount (p = 0.000, 1% significant), and training on agricultural technology (p = 0.040, at 5% significant). However, access to credit (p = 0.000) and availability of the nearest market (p = 0.002,) negatively and significantly influenced the probability of program participation at 1% significance. This negative relationship between access to credit, availability of the nearest market, and program participation implies that the probability of program participation decreases with an increase in access to credit and availability of the nearest market. Age, education, perception of aid, distance to potable water points, the availability of all-weather roads, and the availability of the nearest health center were not significant in explaining those participating in the LSAI program.

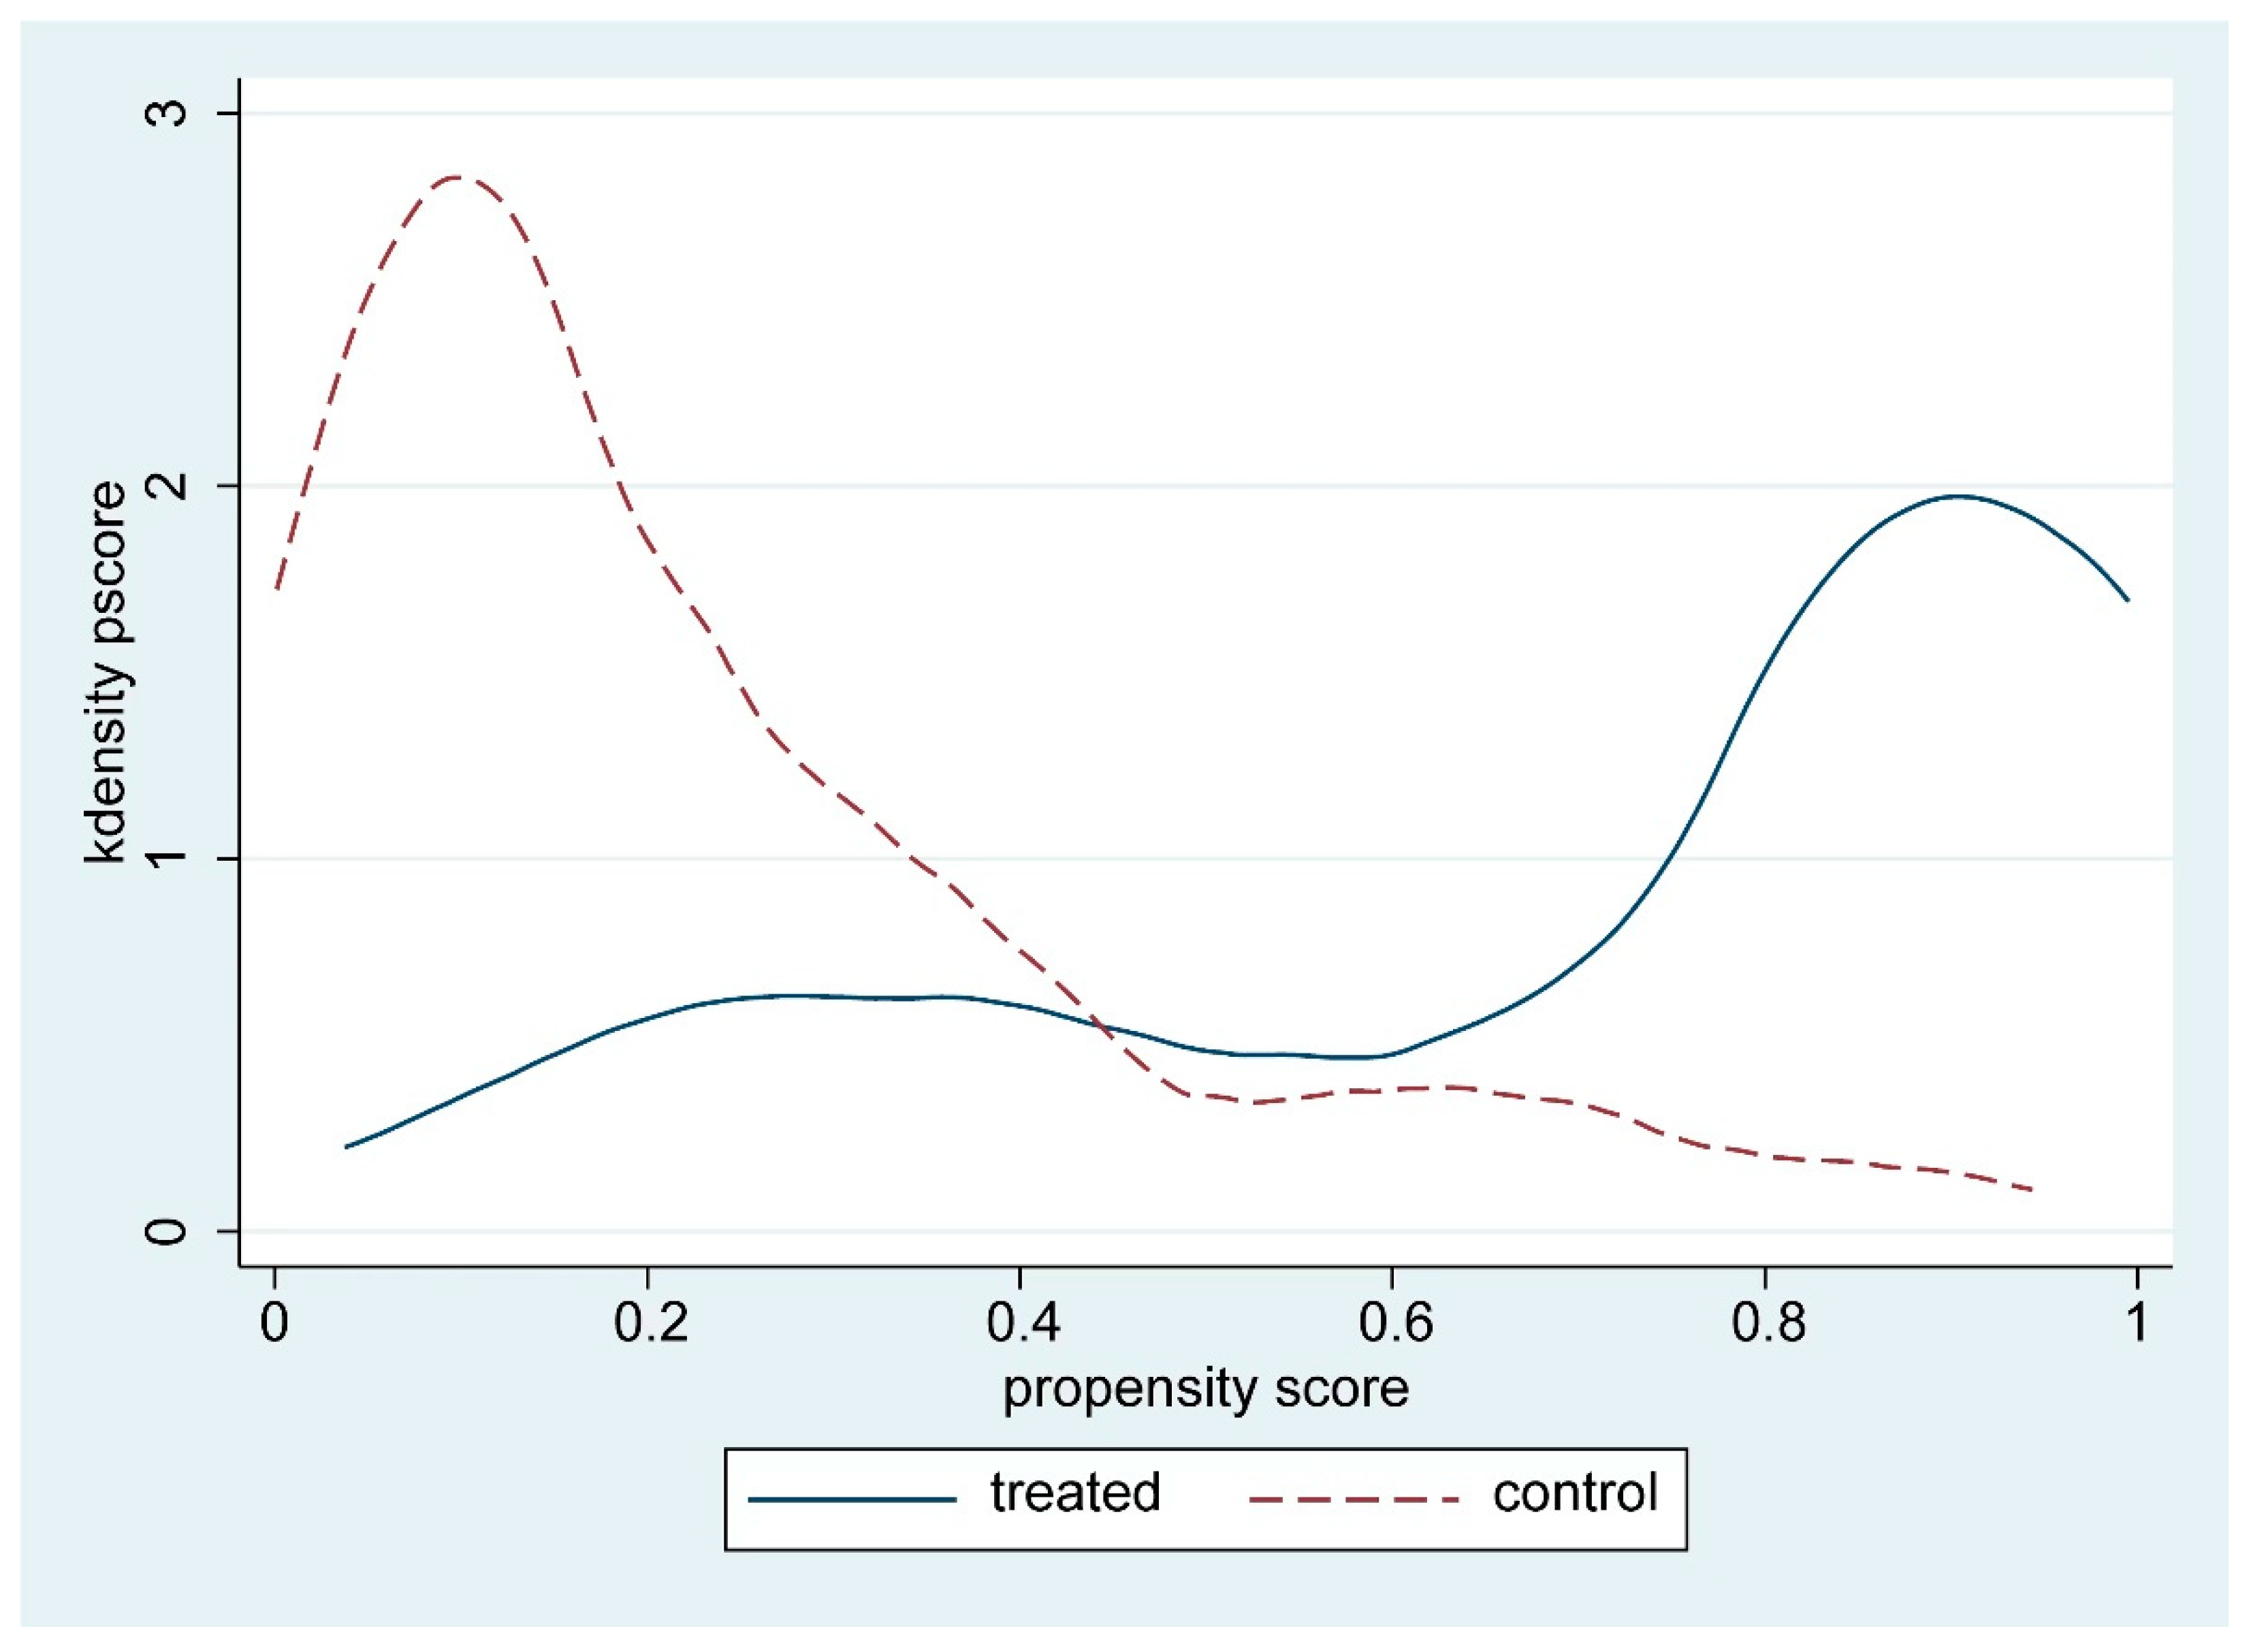
4.4. Propensity Score Estimation Result

This section presents the performance criteria of the matching algorithms (see Appendix A Table A3), the kernel densities of the propensity scores of the treatment and control households, and common support for propensity score estimation in Figure 3 and Figure 4.

4.5. Estimation of ATT

This part addresses the average treatment effect on the treated (ATT) households using the five livelihood capital or assets. Table 5 shows the results of the Average Treatment effect on Treated (ATT) households on natural, human, financial, physical, and social capital.

4.6. Sensitivity Analysis

The result of sensitivity analysis using the Rosenbaum bounding approach revealed that it is free of hidden bias (see Appendix A, Table A4).

5. Discussion

Proponents of LSAI argue that access to irrigation, dissemination of technologies, and generating local employment opportunities to improve the livelihoods of the local people are the major contributions of the LSAI [17]. For instance, studies by Baumgartner (2015), Deininger (2016) [61], and Hufe (2017) [62] also demonstrated that LSAI has the potential to create markets and jobs as well as increase the rate of adoption of harvesting technology and input use (seeds, fertilizer, farm equipment, etc.). Others have also argued that LSAI has been seen as an opportunity to increase foreign direct investment and improve infrastructure connectivity such as dry and wet roads, telecommunication, water access, education, and other basic services [22,63,64]. Collier (2012) [65] also argued that for countries with ample uncultivated land resources that had remained heavily dependent on the agricultural sector, the LSAI provides a great role in more rapid rural development and poverty reduction. However, in contrast to the results by Collier, (2012) [65], Keeley et al. (2014) [17], Deininger and Xia, (2016) [61], and Hufe and Heuermann (2017) [62], we found that the mean landholding size of the treatment group and control group households was 1.19 and 2.06 ha, respectively, which was statistically significant at 1%. This has brought about the decline in local community assets such as forest resources, and exacerbated a shortage of farmland size. The future of small-scale landholders now no longer benefits from the LSAI, which means that the LSAI cannot sincerely play a critical function in the livelihood improvement of the local community. It is acknowledged that land serves as the basis for community values in addition to being a fixed asset and is necessary for raising enough crops and animals to provide a supply of food [66]. The mean livestock holding of the treatment and control households in TLU was 5.12 and 6.58, respectively, and was statistically significant at 1%. This shows that the control groups had a relatively large livestock size than the treatment groups. This leads to the asset depletion of local communities, and there is ample evidence that rural households keep livestock across various levels of income and that livestock are capital assets, produced in the past and contributing to future product output. In this regard, the LSAI has not relatively contributed to livestock capital improvement among the treatment households. In light of this study, many NGOs (non-governmental organizations) [67] have taken a strong position against LSAI development in Ethiopia based on its negative livelihood impacts [68]. The mean natural, human, and financial capitals of the treatment households were 0.05; 0.13, and 0.00, respectively. All of the mean values of the above variables were smaller than those compared to the control households. It is fascinating to note that there was a decline in the mean values of the variables concerning the treatment households due to the LSAI intervention. The complete livelihood impacts on rural communities involved in LSAI are well-understood [69,70]. The decline in the mean values of overall livelihood assets of treatment groups in this study indicates that the LSAI considerably reduced the livelihood capital and wealth status of the treatment households. The current landholding system in the rural Shashamane and Shala districts of Oromia regional state evolved through land distribution, land allocation, inheritance, and gifts. A study by Speller et al. (2017) on the impact of large-scale agricultural investments on local communities updated voices from the field and confirmed that LSAI aggravates mass displacement. The most prominent negative impacts arising in the investments examined were disputes over access to land [71]. People’s lives in rural communities are intimately tied up with their access to land and other natural resources and the arrival of an investor can have significant implications. Interviewees had, on balance, negative perceptions of the impact of investments across a range of land-related issues including the previous use of the land; the terms of, and process for, land acquisition; resettlement procedures; access to and the use of the land by communities; the degree of land use practiced by the investor; and the rights of farmers and other customary land users [69]. In the study area, land is the scarcest natural capital, which could show future potential for land conflict. Our study also revealed that there were several sources of conflict between the LSAI and nearby communities. A similar study conducted by Nolte (2014) also revealed that LSAIs were causing conflict between investors and the local community. The average treatment on the treated (ATT/difference) of the propensity score estimation result of the natural, human, and financial capital was −0.91, −0.81, and −0.15, respectively, and lower than the control households, with sensitivity at a γ value of 2. This implies that the project harms the local people’s livelihood capital in large-scale agricultural investment areas, and the local people’s livelihoods were not improved as a result of the LSAI. Correspondingly, this rapid investment growth has caused rural chaos among the community, smallholder farmers, and landless youths as land is the most crucial, if not the only, means of livelihood in the study area. The statistical t-test values, t = −51.19, t = 35.50, t = 12.20, t = −50.04, and t = 54.78, showed that there was a significant difference at 1%. It is imperative to note that there was an overall reduction in natural, human, and financial capital. Conversely, the physical and social capital of the treatment households increased due to the LSAI intervention. These findings are consistent with the results of research that has been conducted in Africa that found the possible adverse impact of LSAI on the livelihoods of the investment hosting communities [72,73,74,75]. The findings are also in agreement with various studies that have testified about the prospective negative impacts of LSAIs on the livelihoods of the affected community in Ethiopia [12,17,63]. Furthermore, Porsani’s (2019) study in Mozambique revealed that large-scale land acquisitions aggravate poverty and worsen the livelihoods and poverty of local communities. Our study also revealed a reduction in the inclusive livelihood asset indices of the treatment group, showing that LSAI significantly increases the poverty of the affected Shashamane rural district kebeles. Likewise, the reduction in the natural livelihood asset index of the treatment group implies that LSAI substantially reduced the land size of the affected Shashamane rural district kebeles, which forces the local community to turn to domestic and international migration to seek greater opportunities. This is particularly important to consider as the livelihoods and agricultural commodity production issues are dependent on the land for a majority of the population of Ethiopia. According to Dessalegn (2011) and Shete et al. (2015), the LSAI operating in Ethiopia has caused rural land loss among youths in many parts of the country. Other studies that have been recently conducted also suggest that technology transfer from LSLI to the community did not occur in Ethiopia [76,77]. At the same time, this activity undermines the standard of living. If a household has secure access to land, they are also likely to be well-endowed with financial assets as they can use the land for productive purposes and to secure loans [38,78,79]. This indicates that a single asset can generate multiple benefits. Apart from risking losing access to and control over the land on which they depend, deprivation of land due to LSAI has historically been a major trigger to conflict and outright civil war [8,80]. To fulfill human rights and enjoyment such as the right to food, the right to a livelihood, the right to housing, the right to property, and the right to development, the land is a crucial factor [21,78,81,82,83,84]. The protection of land rights for smallholders and indigenous people has been recognized as part of the country’s domestic law and international human rights instruments (FDREHPR, 1995, Arts. 9(4), 13(2) [14]. Any activity or development initiatives that deteriorate the livelihoods of rural householders is prohibited by the FDRE Constitution [85]. A large amount of research has been conducted on the issues of the process of large-scale land acquisitions, and debate about the positive and negative impacts of LSAI at the global level remain [86]. However, looking and linking the LSAI and SLF have been limited. The advantage of using SLF as an analytical tool for addressing the impact of LSAI help us to see the micro- and macro-level institutions, and their impact at different scales such as the individual, household, group, village, region, or nation [32,34]. Considering SLF is a holistic approach, the present study adopted SLF to assess the impact of LSAI on the local people’s livelihood capital. Overall, our findings suggest that Elfora Agro-Industries P.L.C, which is engaged in the production and sales of agricultural products for domestic and foreign markets (such as countries in the Middle East, mainly, Saudi Arabia, United Arab Emirates, Yemen, and African countries such as Egypt, Congo, Brazzaville, and Cote- d’Ivoire), is not pro-sustainable livelihood and has not delivered its promises such pro-poor, pro-job, and pro-local development, since local communities living with LSAI are not benefiting from the LSAI. Hence, rural economic development and rural household livelihood need to improve and be supported through other rural livelihood improvement mechanisms in the region such as in the rural Shashamane district, where the LSAI is starting its operation.

6. Conclusions

Land has been given away to national and multinational foreign investors in low- and middle-income areas at a rate that had not been seen in decades, typically on long-term leases. Government pro-investment policies such as deregulation, incentives such as lower taxes and fewer obligations, and legitimacy via development, food, and fuel security and crises by food-importing and fuel-exporting nations, expanding business and market opportunity, and profit-seeking are the key stimuli and drivers of LSAI re-investment. Furthermore, the crises of 2007 and 2008 related to economy and energy, along with the food price hike in 2008, have paved the way for the so-called land acquisition and agricultural investment of farmland in different parts of the world. The same is also true in Sub-Saharan Africa (SSA) and Ethiopia [18,19]. This paper discussed the Ethiopian and Oromia regional state’s potential for LSAI, particularly in the Shashamane rural district. The Shashamane rural district has greater potential for LSAI and has attracted many LSAIs such as the Shallo-Melga farm project. In total, the MIDROC Ethiopia Investment Group and its affiliated Saudi Star companies have received 500,000 hectares of land in all parts of Ethiopia for different land investment projects. Elford Agro-Industries P.L.C.’s Shallo-Melga LSAI farm project, one of the MIDROC group of companies, is a multifaceted investment that started operation in 2008 on 10,000 hectares of fertile land in the Shashamane rural district in the Oromia region, Ethiopia. The Elford Agro-Industries P.L.C. Shallo-Melga LSAI farm project currently cultivates and grows commercial maize (BH661, BH546), wheat, haricot beans (Nassri, Awassa Dume), white beans, and soya beans for the domestic (such as Shortan Addis) and international market (such as Saudi Arabia, and the Middle East). In particular, the impact of most large-scale land investments on the local people and on livelihood improvement has not gained the attention it deserves in general in Ethiopia, particularly in the Oromia regional state because of a lack of reliable data. Many have argued that rapid investment growth has caused and negatively affected the local community’s livelihood capitals (human, natural such as land, financial, physical, and social capitals). Because land is the most crucial, if not the only, means of livelihood for rural farmers in Ethiopia, the backbone engine of growth for the Ethiopian economy is smallholder agriculture, with a 54% contribution to the gross domestic product, 80% employment opportunity for a population of 120 million, and almost 90% for exports [87]. Moreover, pro-smallholder farmers and a commercialization policy to increase agricultural productivity were initiated in 1991, with Ethiopia’s development strategy positioned for the overall economic development of the country. Hence, an absolute majority of the local community in the Shashamane district depends on small-scale and family agriculture for survival. Empirically, this investigative article explored the livelihood impacts of LSAIs using empirical data and observations in the Shashamane district of the Oromia region. The present study also applied and adopted PCA, PSM, and DFID’s livelihood framework to assess the impact of the LSAI on the local people’s livelihood capital. With the above method and framework in mind, our results from both the quantitative and qualitative parts showed that the LSAI has negatively impacted the local people’s livelihood capital and exacerbated the local poverty situation. The five main livelihood capitals we used in the DFID’s livelihood framework were natural, human, financial, physical, and social capitals. The assets are generally recognized within sustainable livelihoods theory. Hence, this not-well functional LSAI project has contributed below their economic potential in terms of the local people’s livelihood improvement through job creation, income, natural resources including land, water, basic infrastructure (water, sanitation, energy, transport, and communications), housing, and the means and equipment of production. Moreover human capital is the software and brain war of any nation and constitutes the most important form of capital. Infrastructure not only enhances socioeconomic growth, but it is also an important driver of sustainable development. Infrastructures comprise the stock of basic facilities and capital equipment required for society to be functional including roads, bridges, rail lines, air transport, schools, hospitals, and other public works. Social capital includes social and financial capital such as regular remittances or pensions, savings, and supplies of credit, and the service sector and the population of the region are large and growing. This is at odds with the main objective in which the LSAI is the engine of growth through the absorption of excess labor from the rural sector. Oromia regional state is rich in labor and could be better than any state including Afar or Somalia, if young children in the region can be better educated in the future so that they can transform the economy [87]. However, the LSAI’s contribution of human capital such as skills, knowledge, and technology transfer to the local people has been very minimal. Hence, the region needs to take advantage of its enormous natural, human, financial, physical, and social capital. We limited our analysis to the influence of the LSAI on local people’s livelihoods, but future research should focus on the relationship between the agricultural value chain and the LSAI, and the gender implications of the LSAI.

Author Contributions

Supervision, D.T.; Writing—original draft, Y.A. All authors have read and agreed to the published version of the manuscript.

Funding

The College of Development Studies (CDS), Center for Rural Development (CRD), Addis Ababa University (CDS) student fund supported this PhD research. This work was supported by the Addis Ababa University student fund 2018.

Institutional Review Board Statement

Not applicable.

Informed Consent Statement

Not applicable.

Data Availability Statement

Not applicable.

Acknowledgments

The authors thank the constructive feedback from four anonymous reviewers, academic editor and assistant editor greatly helped improve this paper.

Conflicts of Interest

The authors declare no conflict of interest.

Appendix A

Table A1. A sample of the treatment and control households with the LSAI and without LSAI.
DistrictKebelesTotal PopulationProportional to Size (PPS) Systematic Sampling Techniques %
Male Female Total Population/HD/Proportional to Size (PPS)
Shashamane adjacent
District (treatment)
B/Dannaba 9641321096(1096 × 134)/2446 = 6044.7%
Toga 630112742(742 × 134)/2446 = 40
D/Calalaqaa 486122608(608 × 134)/2446 = 34
Subtotal134
Shala District (control)Solicha8931371030(1030 × 166)/2252 = 7655.3%
Waka466116582(582 × 166)/2252 = 43
Bute 530110 640(640 × 166)/2252 = 47
Subtotal 166
Ground total 300100%
Table A2. The description of the explanatory variables.
Variable NameVariable TypeUnit of MeasurementExpected Sign
Sex of respondentsDummy1, if male, 0 if female+
Age of respondentsContinuousYears+
Education levelOrderedGrade level in formal schooling+
Total family sizeContinuousNumber+
Dependency ratioContinuousNumber
Farm Land sizeContinuousHectare+
Livestock amountContinuousTLU+
Perception on aid Dummy1, if take aid, 0 if not
Distance to potable water pointsContinuousWalking distance in minutes from home+
Availability of all-weather roadDummy1, if Yes, 0 if Otherwise+
Availability of health centerDummy1, if Yes, 0 if Otherwise+
Availability of nearest marketDummy1, if Yes, 0 if Otherwise+
Access to training on agricultural technologyDummy1, if Yes, 0 if Otherwise+
Access to creditDummy 1 if Yes, 0 if Otherwise +
+ Positive relationship. − Negative relationship.
Table A3. The performance criteria of the matching algorithms.
Matching AlgorismPerformance Criteria
Balancing Test * Pseudo-R2%VarMatched Sample
Nearest Neighbor
Nearest Neighbor 1110.139 38245
Nearest Neighbor 2110.087 25245
Nearest Neighbor 3120.084 25245
Nearest Neighbor 4120.094 25245
Nearest Neighbor 5130.08725245
Caliper
0.01120.13338181
0.1110.13938245
0.25110.13938245
0.5110.13938245
Radius
0.0190.28663245
0.190.28663245
0.2590.28663245
0.590.28663245
Kernel *
0.01140.07138181
0.1120.09038245
0.25140.05838245
0.5140.07050245
* Diagnostics designed for use with propensity score methods, a widely used non-experimental approach in the evaluation literature. Such tests provide useful information on whether plausible counterfactuals have been created. Figure in bold shows that selected matching algorism the higher balancing test, the lower Pseudo-R2, and matched sample. Source: Own survey result, 2020.
Table A4. The results of the sensitivity analysis using the Rosenbaum bounding approach.
Indicator e γ = 1   e γ = 1.25 e γ = 1.5 e γ = 1.75 e γ = 2
Impact on Natural Capital index.ATT00000
Impact on the Human Capital index 0 1.0 e 14 1.5 e 12 5.5 e 11 8.1 e 10
Impact on the Financial Capital index 00000
Impact on the Physical Capital index 3.5 e 13 6.8 e 11 2.3 e 06 2.9 e 08 1.9 e 07
Impact on the Social Capital index00 1.6 e 15 1.4 e 13 4.2 e 12
Source: Own computation (2020), γ stands for gamma value.

References

  1. OECD; FAO. OECD-FAO Agricultural Outlook; FAO-OECD: Lazio, Rome, Italy, 2019. [Google Scholar]
  2. Godfray, H.C.J.; Beddington, J.R.; Crute, I.R.; Haddad, L.; Lawrence, D.; Muir, J.F.; Pretty, J.; Robinson, S.; Thomas, S.M.; Toulmin, C. Food Security: The Challenge of Feeding 9 Billion People. Science 2010, 327, 812–818. [Google Scholar] [CrossRef] [PubMed] [Green Version]
  3. Wu, J.; Li, M. Land Use Change and Agricultural Intensification: Key Research Questions and Innovative Modeling Approaches; International Food Policy Research Institute: Washington, DC, USA, 2013. [Google Scholar]
  4. Cervantes-Godoy, D.; Dewbre, J.; Amegnaglo, C.J.; Soglo, Y.Y.; Akpa, A.F.; Bickel, M.; Sanyang, S.; Ly, S.; Kuiseu, J.; Ama, S.; et al. The Future of Food and Agriculture: Trends and Challenges. 2014. Available online: https://www.fao.org/3/i6583e/i6583e.pdf (accessed on 8 June 2022).
  5. Nolte, K. Large-scale agricultural investments under poor land governance in Zambia. Land Use Policy 2014, 38, 698–706. [Google Scholar] [CrossRef]
  6. Zerssa, G.; Feyssa, D.; Kim, D.-G.; Eichler-Löbermann, B. Challenges of Smallholder Farming in Ethiopia and Opportunities by Adopting Climate-Smart Agriculture. Agriculture 2021, 11, 192. [Google Scholar] [CrossRef]
  7. Welteji, D. A critical review of rural development policy of Ethiopia: Access, utilization and coverage. Agric. Food Secur. 2018, 7, 55. [Google Scholar] [CrossRef]
  8. Schoneveld, G.C. Host country governance and the African land rush: 7 reasons why large-scale farmland investments fail to contribute to sustainable development. Geoforum 2017, 83, 119–132. [Google Scholar] [CrossRef]
  9. UNDP. Assessing Global Land Use Balancing Consumption With Sustainable Supply. Available online: https://www.fao.org/faoterm/en/?defaultCollId=6 (accessed on 26 October 2021).
  10. Wiersinga, R.C.; De Jager, A. Business Opportunities in the Ethiopian Fruit and Vegetable Sector; Ministry of Agriculture, Nature and Food Quality: The Hague, The Netherlands, 2009.
  11. Vhugen, D. Large-Scale Commercial Investments In Land: Seeking To Secure Land Tenure and Improve Livelihoods. Haramaya Law Rev. 2012, 1, 1–30. [Google Scholar]
  12. Rahmato, D. Land to Investors: Large-Scale Land Transfers in Ethiopia; African Books Collective: Oxford, UK, 2011. [Google Scholar]
  13. Cochrane, L.; Legault, D. The Rush for Land and Agricultural Investment in Ethiopia: What We Know and What We Are Missing. Land 2020, 9, 167. [Google Scholar] [CrossRef]
  14. Proclamation No. 1/1995—Proclamation of the Constitution of the FDRE. A Proclamation to Pronounce the Coming into Effect of The Constitution of the Federal Democratic Republic of Ethiopia. Available online: https://www.abyssinialaw.com/quick-links/item/1783-en-constitution (accessed on 8 June 2022).
  15. MoARD (Ministry of Agriculture and Rural Development). Federal Democratic Republic of Ethiopia Ministry of Agriculture and Rural Development. 2010; pp. 2009–2012. Available online: https://www.gafspfund.org/sites/default/files/inline-files/7a.%20Ethiopia_CAADP%20Post%20Compact%20Investment%20Plan.pdf (accessed on 8 June 2022).
  16. Baumgartner, P.; von Braun, J.; Abebaw, D.; Müller, M. Impacts of Large-scale Land Investments on Income, Prices, and Employment: Empirical Analyses in Ethiopia. World Dev. 2015, 72, 175–190. [Google Scholar] [CrossRef]
  17. Cotula, L.; Vermulen, S.; Leonard, R.; Keeley, J. Land Grab or Development Opportunity? Agricultural Investment and International Land Deals in Africa. Available online: https://www.iied.org/pubs/display.php?o=12561IIED%5Cnhttp://www.iied.org/pubs/pdfs/12561IIED.pdf (accessed on 8 June 2022).
  18. Deininger, K.; Byerlee, D. Rising Global Interest in Farmland. 2011. Available online: https://elibrary.worldbank.org/doi/abs/10.1596/978-0-8213-8591-3 (accessed on 8 June 2022).
  19. Breu, T.; Bader, C.; Messerli, P.; Heinimann, A.; Rist, S.; Eckert, S. Large-Scale Land Acquisition and Its Effects on the Water Balance in Investor and Host Countries. PLoS ONE 2016, 11, e0150901. [Google Scholar] [CrossRef] [Green Version]
  20. National Planning Commission. (GTP II) Growth and Transformation Plan II, National Planning Commission. 2016. Available online: http://www.npc.gov.et/web/guest/gtp/-/document_library_display/48Gh/view/58840 (accessed on 8 June 2022).
  21. Human Rights Watch, WHuman Rights Watchorld Report 2016: Ethiopia. 2016. Available online: https://www.hrw.org/world-report/2016/country-chapters/ethiopia# (accessed on 1 November 2021).
  22. Anseeuw, W.; Boche, M.; Breu, T. Transnational land deals for agriculture in the global South. In Proceedings of the Centre for Development and Environment (CDE), Bern, Switzerland, 3 October 2012. [Google Scholar]
  23. de Haan, L.; Zoomers, A. Exploring the Frontier of Livelihoods Research. Dev. Chang. 2005, 36, 27–47. [Google Scholar] [CrossRef]
  24. Bekele, A.E.; Dries, L.; Heijman, W.; Drabik, D. Large scale land investments and food security in agropastoral areas of Ethiopia. Food Secur. 2021, 13, 309–327. [Google Scholar] [CrossRef]
  25. Hebinck, P.; Bourdillon, M. Analysis of Livelihood, Women, Men Work. Rural Livelihoods Cent. Zimbabwe. 2002; pp. 1–13. Available online: https://www.researchgate.net/profile/Paul_Hebinck/publication/40798693_Analysing_livelihoods/links/57bd645b08ae6918243019f1/Analysing-livelihoods.pdf (accessed on 8 June 2022).
  26. Small, L.-A. The Sustainable Rural Livelihoods Approach: A Critical Review. Can. J. Dev. Stud./Rev. Can. D’études Du Dév. 2007, 28, 27–38. [Google Scholar] [CrossRef]
  27. Lindenberg, M. Measuring Household Livelihood Security at the Family and Community Level in the Developing World. World Dev. 2002, 30, 301–318. [Google Scholar] [CrossRef]
  28. Scoones, I. Livelihoods perspectives and rural development. J. Peasant. Stud. 2009, 36, 171–196. [Google Scholar] [CrossRef]
  29. Thennakoon, T.M.S.P.K.; Kandambige, L.S.T.; Liyanage, C. Impact of Human—Elephant Conflict on Livelihood A Case Study from a Rural Setting of Sri Lanka. 2017. Available online: http://dr.lib.sjp.ac.lk/handle/123456789/7215 (accessed on 24 September 2021).
  30. Asfaw, W.; Tolossa, D.; Zeleke, G. Causes and impacts of seasonal migration on rural livelihoods: Case studies from Amhara Region in Ethiopia. Nor. Geogr. Tidsskr.-Nor. J. Geogr. 2010, 64, 58–70. [Google Scholar] [CrossRef]
  31. Degefa, T. Rural Livelihood, Poverty and Food Insecurity in Ethiopia. Ph.D. Thesis, Norwegian University of Science and Technology, NTNU, Trondheim, Norway, 2005. [Google Scholar]
  32. Ashley, C.; Carney, D. Sustainable Livelihoods Analysis: Lessons form early experience. Dep. Int. Dev. 1999, 7, 55. [Google Scholar]
  33. Serrat, O. The Sustainable Livelihoods Approach. In Knowledge Solutions: Tools, Methods, and Approaches to Drive Organizational Performance; Serrat, O., Ed.; Springer: Singapore, 2017; pp. 21–26. [Google Scholar] [CrossRef] [Green Version]
  34. Scoones, I. Sustainable Rural Livelihoods: A Framework for Analysis. Inst. Dev. Stud. 1998, 42, 57–63. [Google Scholar]
  35. DFID. Sustainable Livelihoods Guidance Sheets, section 2. Department for International Development (DFID). Dep. Int. Dev. 1999, 26. Available online: http://www.livelihoodscentre.org/documents/20720/100145/Sustainable+livelihoods+guidance+sheets/8f35b59f-8207-43fc-8b99-df75d3000e86 (accessed on 8 June 2022).
  36. Kébé, M.; Muir, J. The sustainable livelihoods approach: New directions in West and Central African small-scale fisheries. Achiev. Poverty Reduct. Responsible Fish. Lessons West Cent. Afr. FAO Fish. Aquac. Tech. Pape. 2008, 513, 5–22. [Google Scholar]
  37. Ellis, F. Rural Livelihood Diversity in Developing Countries: Evidence and Policy Implications; Overseas Development Institute: London, UK, 1999; Available online: http://hdl.handle.net/10535/4486 (accessed on 8 June 2022).
  38. Solesbury, W. Sustainable Livelihoods: A Case Study of the Evolution of DFID Policy; Overseas Development Institute: London, UK, 2005; pp. 133–154. [Google Scholar] [CrossRef]
  39. Saudi Star Agriculture and Irrigation Project in Ethiopia. 2012. Available online: https://www.business-humanrights.org/en/latest-news/saudi-star-agriculture-and-irrigation-project-in-ethiopia/ (accessed on 8 June 2022).
  40. WAZF&EDO. Shashamane woreda map. 2015; Unpublished Material. [Google Scholar]
  41. Israel, G.D. Determining Sample Size. The Level Of Precision. Biometrics. 1992, Volume 42. Available online: https://www.gjimt.ac.in/wp-content/uploads/2017/10/2_Glenn-D.-Israel_Determining-Sample-Size.pdf (accessed on 8 June 2022).
  42. Singh, H. Basics of Sample Size Determination. Int. J. Adv. Eng. Manag. 2021, 3, 147–149. [Google Scholar] [CrossRef]
  43. Cochran, W.G. Sampling Techniques. 1977. Available online: Cochran_1977_Sampling_Techniques__Third_Edition.pdf (accessed on 8 June 2022).
  44. Bartlett, J.E.; Kotrlik, J.W.; Higgins, C.C. Organizational Research: Determining Organizational Research: Determining Appropriate Sample Size in Survey Research Appropriate Sample Size in Survey Research. Inf. Technol. Learn. Perform. J. 2001, 19, 43. [Google Scholar]
  45. Taber, K.S. The Use of Cronbach’s Alpha When Developing and Reporting Research Instruments in Science Education. Res. Sci. Educ. 2018, 48, 1273–1296. [Google Scholar] [CrossRef]
  46. Heinrich, C.; Maffioli, A.; Vázquez, G. A Primer for Applying Propensity-Score Matching: Impact-Evaluation Guidelines. Tech. Notes 2010, 1–56, No. IDB-TN-(2010). Available online: http://www.iadb.org/document.cfm?id=35320229 (accessed on 8 June 2022).
  47. Liu, L.; Ripley, D. Propensity Score Matching in a Study on Technology-Integrated Science Learning. Int. J. Technol. Teach. Learn. 2014, 10, 88–104. Available online: http://search.ebscohost.com/login.aspx?direct=true&db=eric&AN=EJ1213483&site=ehost-live (accessed on 8 June 2022).
  48. Thavaneswaran, A.; Lix, L. Propensity Score Matching in Observational Studies; University of Manitoba: Winnipeg, MB, Canada, 2008. [Google Scholar]
  49. Rosenbaum, P.R.; Rubin, D.B. The central role of the propensity score in observational studies for causal effects. Biometrika 1983, 70, 41–55. [Google Scholar] [CrossRef]
  50. Khandker, S.; Gayatri, S.; Hussain, K. Handbook on Impact, 2010. Available online: https://documents1.worldbank.org/curated/en/650951468335456749/pdf/520990PUB0EPI1101Official0Use0Only1.pdf (accessed on 8 June 2022).
  51. FAO. The Livelihood Assessment Tool-kit: Analysing and Responding to the Impact of Disasters on the Livelihoods of People; FAO & ILO: Genève, Switzerland; Rome, Italy, 2009. [Google Scholar]
  52. Caliendo, M.; Kopeinig, S. Some Practical Guidance for the Implementation Of Propensity Score Matching. J. Econ. Surv. 2008, 22, 31–72. [Google Scholar] [CrossRef] [Green Version]
  53. Stewart Carloni, E. Crowley, Food and Agriculture Organization of the United Nations. Guide Rapide Pour les Missions: Analyse des Institutions Locales et des Moyens d’Existence; FAO: Rome, Italy, 2006; p. 37. [Google Scholar]
  54. FAO. Measuring Household Relisience to Food Insecurity, Foodsec.Org. 2009. Available online: http://www.foodsec.org/fileadmin/user_upload/eufao-fsi4dm/docs/resilience_wp.pdf%5Cnpapers3://publication/uuid/484EA881-EC20-47DC-89B4-4D5E4926429E (accessed on 8 June 2022).
  55. Fitawek, W.; Hendriks, S.L. Evaluating the Impact of Large-Scale Agricultural Investments on Household Food Security Using an Endogenous Switching Regression Model. Land 2021, 10, 323. [Google Scholar] [CrossRef]
  56. Wineman, A.; Liverpool-Tasie, L.S.O. Land Markets and Land Access Among Female-Headed Households in Northwestern Tanzania. World Dev. 2017, 100, 108–122. [Google Scholar] [CrossRef]
  57. United Nations Statistics Division. Multivariate methods for index construction, Househ. Sample Surv. Dev. Transit. Ctries. 2005, 367–387. Available online: http://unstats.un.org/unsd/hhsurveys/pdf/Chapter_18.pdf (accessed on 8 June 2022).
  58. Bartholomew, D.J. Principal Components Analysis. Int. Encycl. Educ. 2010, 374–377. [Google Scholar] [CrossRef]
  59. Kabudula, C.W.; Houle, B.; Collinson, M.A.; Kahn, K.; Tollman, S.; Clark, S. Assessing Changes in Household Socioeconomic Status in Rural South Africa, 2001–2013: A Distributional Analysis Using Household Asset Indicators. Soc. Indic. Res. 2016, 133, 1047–1073. [Google Scholar] [CrossRef] [PubMed] [Green Version]
  60. Teklemariam, D.; Azadi, H.; Nyssen, J.; Haile, M.; Witlox, F. How Sustainable Is Transnational Farmland Acquisition in Ethiopia? Lessons Learned from the Benishangul-Gumuz Region. Sustainability 2016, 8, 213. [Google Scholar] [CrossRef] [Green Version]
  61. Deininger, K.; Xia, F. Quantifying Spillover Effects from Large Land-based Investment: The Case of Mozambique. World Dev. 2016, 87, 227–241. [Google Scholar] [CrossRef] [Green Version]
  62. Hufe, P.; Heuermann, D.F. The local impacts of large-scale land acquisitions: A review of case study evidence from Sub-Saharan Africa. J. Contemp. Afr. Stud. 2017, 35, 168–189. [Google Scholar] [CrossRef]
  63. Aisbett, E.; Barbanente, G. Impacts of Large Scale Foreign Land Acquisitions on Rural Households: Evidence from Ethiopia. Crawford School Working Paper 1602 November 2016. 2016. Available online: https://crawford.anu.edu.au/sites/default/files/publication/crawford01_cap_anu_edu_au/2016-11/cswp1602.pdf (accessed on 8 June 2022).
  64. Hess, T.; Sumberg, J.; Biggs, T.; Georgescu, M.; Haro-Monteagudo, D.; Jewitt, G.; Ozdogan, M.; Marshall, M.; Thenkabail, P.; Daccache, A.; et al. A sweet deal? Sugarcane, water and agricultural transformation in Sub-Saharan Africa. Glob. Environ. Chang. 2016, 39, 181–194. [Google Scholar] [CrossRef] [Green Version]
  65. Collier, P.; Venables, A.J. Land Deals in Africa: Pioneers and Speculators. J. Glob. Dev. 2012, 3. [Google Scholar] [CrossRef]
  66. Phélinas, P.; Choumert, J. Is GM Soybean Cultivation in Argentina Sustainable? World Dev. 2017, 99, 452–462. [Google Scholar] [CrossRef] [Green Version]
  67. Zagema, B. Land and Power: The Growing Scandal Surrounding the New Wave of Investments in Land; Oxfam Briefing Paper: Nairobi, Kenya, 2011. [Google Scholar]
  68. Shete, M. Implications of land deals to livelihood security and natural resource management in Benshanguel Gumuz Regional State, Ethiopia. In Proceedings of the International Conference on Global Land Grabbing at the Institute of Development Studies, Brighton, UK, 6–8 April 2011. [Google Scholar]
  69. Mutea, E.; Bottazzi, P.; Jacobi, J.; Kiteme, B.; Speranza, C.I.; Rist, S. Livelihoods and Food Security Among Rural Households in the North-Western Mount Kenya Region. Front. Sustain. Food Syst. 2019, 3, 98. [Google Scholar] [CrossRef] [Green Version]
  70. Speller, W.R.; Mirza, H.; Giroud, A.; Huaman, J.S.; Dixie, G.; Okumura, A. The Impact of Larger-Scale Agricultural Investments on Local Communities; World Bank: Washington, DC, USA, 2017. [Google Scholar] [CrossRef]
  71. Buffett, H.G. Investment in Agriculture. Afr. Res. Bull. Econ. Financ. Tech. Ser. 2011, 48, 19282B. [Google Scholar] [CrossRef]
  72. Robertson, B.; Pinstrup-Andersen, P. Global land acquisition: Neo-colonialism or development opportunity? Food Secur. 2010, 2, 271–283. [Google Scholar] [CrossRef]
  73. Richards, M. Social and Environmental Impacts of Agricultural Large-Scale Land Acquisitions in Africa—With a Focus on West and Central Africa; Rights and Resources Initiative: Washington, DC, USA, 2013. [Google Scholar]
  74. Fernández, L.T.M.; Schwarze, J. John Rawls’s Theory of Justice and Large-Scale Land Acquisitions: A Law and Economics Analysis of Institutional Background Justice in Sub-Saharan Africa. J. Agric. Environ. Ethics 2013, 26, 1223–1240. [Google Scholar] [CrossRef]
  75. Dye, J. Food Security and Large-Scale Land Acquisitions: The Cases of Tanzania and Ethiopia, ProQuest Diss. Theses. 2014. Available online: http://search.proquest.com/docview/1729500853?accountid=10673%5Cnhttp://openurl.ac.uk/athens:_edu?url_ver=Z39.88-2004&rft_val_fmt=info:ofi/fmt:kev:mtx:dissertation&genre=dissertations+%26+theses&sid=ProQ:ProQuest+Dissertations+%26+Theses+Global&atitle=&ti (accessed on 8 June 2022).
  76. Moreda, T. The right to food in the context of large-scale land investment in Ethiopia. Third World Q. 2017, 39, 1326–1347. [Google Scholar] [CrossRef] [Green Version]
  77. Lay, J.; Nolte, K.; Sipangule, K. Large-Scale Farms and Smallholders: Evidence from Zambia; GIGA Working Papers: Hamburg, Germany, 2018. [Google Scholar]
  78. The Implications of Large Scale Land Acquisition on Small Landholder’s Food Security. Available online: https://www.ucl.ac.uk/bartlett/development/sites/bartlett/files/migrated-files/WP156_0.pdf (accessed on 8 June 2022).
  79. Cole, C. Livelihood, Sustainable Development and Indigenous Forestry in Dryland Nigeria; John Wiley: Hoboken, NJ, USA, 2012; Available online: https://agris.fao.org/agris-search/search.do?recordID=GB19960158499 (accessed on 29 October 2021).
  80. Alden-Wily, L. Nothing New Under the Sun or a New Battle Joined? African Land Dispossession in the Global Land Rush. In Proceedings of the International Conference on Global Land Grabbing, Brighton, UK, 6–8 April 2011. [Google Scholar]
  81. Lavers, T. ‘Land grab’ as development strategy? The political economy of agricultural investment in Ethiopia. J. Peasant. Stud. 2012, 39, 105–132. [Google Scholar] [CrossRef] [Green Version]
  82. Porsani, J.; Caretta, M.A.; Lehtilä, K. Large-scale land acquisitions aggravate the feminization of poverty: Findings from a case study in Mozambique. GeoJournal 2018, 84, 215–236. [Google Scholar] [CrossRef] [Green Version]
  83. Shete, M.; Rutten, M. Impacts of large-scale farming on local communities’ food security and income levels—Empirical evidence from Oromia Region, Ethiopia. Land Use Policy 2015, 47, 282–292. [Google Scholar] [CrossRef]
  84. De Schutter, O. The Emerging Human Right to Land. Int. Community Law Rev. 2010, 12, 303–334. [Google Scholar] [CrossRef]
  85. Tura, H.A. Linking Land Rights and the Right to Adequate Food in Ethiopia: Normative and Implementation Gaps. Nord. J. Hum. Rights 2017, 35, 85–105. [Google Scholar] [CrossRef]
  86. Depledge, J. Winds of change? Environ. Policy Law 2008, 38, 251–252. [Google Scholar]
  87. Kirchner, S. The World Bank Aids Smallholder Farmers in Ethiopia; World Bank: Washington, DC, USA, 2016. [Google Scholar] [CrossRef]
Figure 1. A conceptual framework for the study using SLF (modified and adapted from the Department of International Development of the United Kingdom [32,35].
Sustainability 14 09082 g001
Figure 2. Map of the Shashamane rural district and selected kebele in 2016 [40].
Sustainability 14 09082 g002
Figure 3. The propensity score distribution.
Sustainability 14 09082 g003
Figure 4. The score estimation of the common support for propensity.
Sustainability 14 09082 g004
Table 1. The descriptive and Chi-square statistics results of the treatment and control sample households.
Independent (Categorical Variable)Control (f)%Treatment (f)%Total (f)%Chi2 (1)
(p-Value)
Sex of respondent
Male16196.9912694.028795.61.5651
(0.211 NS)
Female53.0185.97134.33
Education Level
1 (None)106.023324.64314.381.5932
(0.000) ***
2 (Informal education)5533.13128.966722.3
3 (1–8 Grade)10060.245541.015551.6
4 (9 Grade and above)10.63425.33511.6
Access to market
No3118.674634.337725.679.5229
(0.000) ***
Yes13581.33 8865.6722374.33
Perception on aid
No11669.888261.1919866.002.4926
(0.114 NS)
Yes5030.125238.8110234.00
Availability of all-weather roads
No6438.555944.0312341.000.9190
(0.338 NS)
Yes10261.457555.9717759.00
Availability of water point *
No11569.2812492.5423979.6724.7647
(0.000) ***
Yes5130.72107.466120.33
Access to the nearest health center
No5331.933929.109230.670.2780
(0.598 NS)
Yes11368.079570.9020869.33
Training in agricultural technology
No7042.173324.6310334.3310.1200
(0.000) ***
Yes9657.8310175.3719765.67
Access to credit
No8551.203828.3612341.0015.9992
(0.000) ***
Yes8148.80 9671.6417759.00
* Source of clean drinking water within 10 km of the dwelling, and at least 20 liters of water per person per day from a source, and during the normal period. *** p < 0.01.
Table 2. The descriptive and t-value results of the treatment and control sample households.
Continuous Variable Treatment N = 134 Control N = 166t-Valuep-Value
MeanMean
Age of respondents4245−2.520.012 **
Total family size4.885.83−4.42460.000 ***
Dependency ratio94.89125.63−4.33460.000 ***
Farm Land size1.192.06−11.21870.000 ***
Livestock amount *5.126.589.28580.000 ***
Distance to potable water points2.302.075.17810.000 ***
* p < 0.10, ** p < 0.05, *** p < 0.01. Source: Own survey result, 2020.
Table 3. The descriptive statistics of the livelihood impact indicator variables.
Variable Sample Mean Std. Err. Std. Dev. t-Value p-Value
Natural capital Control (Obs = 166)0.97 0078.42200.000 ***
Treatment (Obs = 134)0.05 0.010.15
Human capitalControl (Obs = 166)0.95 0.000.06 56.60200.000 ***
Treatment (Obs = 134)0.13 0.010.17
Financial capital Control (Obs = 166)0.15 0018.14140.000 ***
Treatment (Obs = 134)0.00 0.00 0.10
Physical capital Control (Obs = 166)0.04 00−76.68030.000 ***
Treatment (Obs = 134)0.98 0.01 0.15
Social capital Control (Obs = 166)0.00 00−83.86770.000 ***
Treatment (Obs = 134)0.810.01 0.12
*** p < 0.01. Source: Own survey result, 2020.
Table 4. The logistic regression model estimates of participation in the LSAI.
DeptV (Pro. Intervention)dy/dxCoefficientStd. Errzp > |z|
Age0.271.112 0.78 1.41 0.157
Sex 0.000.0248 0.01 1.83 0.068 *
Education 0.0720.292 0.21 1.39 0.163
Total family size0.0720.293 0.10 2.93 0.003 ***
Dependency ratio0.000.007 0.00 2.36 0.018 **
Farm land size0.291.187 0.24 4.80 0.000 ***
Total Livestock amount0.120.496 0.12 3.88 0.000 ***
Perception on aid0.030.135 0.350.38 0.706
Distance to potable water points−0.18−0.742 0.45 −1.64 0.101
Availability of all-weather road−0.06−0.277 0.33 −0.83 0.409
Availability of nearest health center−0.00−0.023 0.38 −0.06 0.952
Availability of nearest market−0.31−1.299 0.41 −3.15 0.002 ***
Training in agricultural technology0.180.774 0.37 2.05 0.040 **
Access to credit0.17−8.534 2.08 −4.10 0.000 ***
Note: *** p < 0.01,** p < 0.05, * p < 0.10. Logistic regression number of obs = 300. LR chi2(14) = 173.52; Prob > chi2 = 0.0000. Log likelihood = −119.47504 Pseudo R2 = 0.4207. Source: Own survey result, 2020.
Table 5. Results of the Average Treatment effect on Treated (ATT) household using the five livelihood capital or assets.
VariableSampleTreatedControlsDifferenceMean S.E.T-Stat
Natural CapitalUnmatched0.050.97−0.92 ***0.011−78.42
ATT0.060.97−0.91 ***0.017−51.19
ATU0.97 0.14 −0.83
ATE −0.86
Human CapitalUnmatched0.13 0.95 −0.82 *** 0.01456.60
ATT0.13 0.94 −0.81 *** 0.022 −35.50
ATU0.84 0.13−0.71
ATE −0.75
Financial CapitalUnmatched0.00 0.15 −0.14 ***0.008 18.14
ATT0.00 0.15 −0.15 *** 0.012 −12.20
ATU0.00 0.18 −0.18
ATE −0.17
Physical CapitalUnmatched0.98 0.04 0.93 *** 0.012 −76.68
ATT0.98 0.05 0.92 *** 0.018 50.04
ATU0.13 0.98 0.84
ATE 0.88
Social CapitalUnmatched0.81 0.000.80 *** 0.009 83.87
ATT0.80 0.00 0.79 *** 0.014 54.78
ATU0.00 0.76 0.75
ATE 0.77
*** p < 0.01.
Publisher’s Note: MDPI stays neutral with regard to jurisdictional claims in published maps and institutional affiliations.

