Article

Mapping Urban Green and Its Ecosystem Services at Microscale—A Methodological Approach for Climate Adaptation and Biodiversity

1
Division 4—Natural and Built Environment, Karlsruhe Institute of Technology, 76344 Eggenstein-Leopoldshafen, Germany
2
Institute of Environmental Science and Geography, University Potsdam, 14476 Potsdam, Germany
3
Institute of Sustainable Management of Housing and Real Estate, Karlsruhe Institute of Technology, 76131 Karlsruhe, Germany
4
Institute for Industrial Production, Karlsruhe Institute of Technology, 76187 Karlsruhe, Germany
5
Institute of Geography and Geoecology, Karlsruhe Institute of Technology, 76131 Karlsruhe, Germany
*
Author to whom correspondence should be addressed.
Sustainability 2022, 14(15), 9029; https://doi.org/10.3390/su14159029
Submission received: 1 June 2022 / Revised: 19 July 2022 / Accepted: 20 July 2022 / Published: 23 July 2022

Abstract

:
The current awareness of the high importance of urban green leads to a stronger need for tools to comprehensively represent urban green and its benefits. A common scientific approach is the development of urban ecosystem services (UES) based on remote sensing methods at the city or district level. Urban planning, however, requires fine-grained data that match local management practices. Hence, this study linked local biotope and tree mapping methods to the concept of ecosystem services. The methodology was tested in an inner-city district in SW Germany, comparing publicly accessible areas and non-accessible courtyards. The results provide area-specific [m2] information on the green inventory at the microscale, whereas derived stock and UES indicators form the basis for comparative analyses regarding climate adaptation and biodiversity. In the case study, there are ten times more micro-scale green spaces in private courtyards than in the public space, as well as twice as many trees. The approach transfers a scientific concept into municipal planning practice, enables the quantitative assessment of urban green at the microscale and illustrates the importance for green stock data in private areas to enhance decision support in urban development. Different aspects concerning data collection and data availability are critically discussed.

1. Introduction

Cities are places of direct and indirect use of natural resources, including land and space. Likewise, citizens benefit from ecosystem services generated in their surrounding area. The provision of ecosystem services in cities interact closely and compete with the issues of, e.g., land use, land use change and aspects of water management. It is therefore necessary to take these interrelationships into account when recording, evaluating and influencing the use of resources in the context of urban and district development. In this context, ecosystem services and biodiversity should be considered as independent resources that must be considered in addition to land, water and primary raw materials, among others.

1.1. Cities: The Value and Endangerment of Blue-Green Infrastructure and Open Spaces

Worldwide, most people live in cities, and the trend is upward [1]. Meeting the needs of the urban population requires a high direct and indirect use of natural resources [2]. In particular, the consumption of renewable resources is tied to ecosystems capable of providing them. These ecosystems are usually located outside the city, e.g., filter drinking water and air, produce raw materials and provide food [3]. All these natural ecosystem services are based in their quantity, amongst others, on the size of a suitable area and are closely intertwined in their quality with the issues of soil and water [4,5,6].
Within cities, the pressure on land as a resource is particularly high due to the strong and varied demands on its use [7,8,9]. The land is mainly used by buildings, gray infrastructure (streets, paths, squares) and the blue or green infrastructure, such as parks, green spaces and gardens, sports fields and water bodies [10]. In terms of sustainability and the reduction in urban sprawl, the compact city is one of the most important guiding principles for urban planning worldwide [7,11,12]. This principle demands that construction activities be relocated to the city as much as possible [13]. Since hardly any buildings are demolished and less and less unused land is available, this is often accompanied by the irretrievable loss of public or private open space and related green spaces, courtyard greenery and unsealed areas [14,15].
In contrast, science provides more and more evidence of the high value of urban greenery for health of residents and from an urban ecosystem perspective, e.g., for climate adaptation [10,16,17]. The issue of more intensive urban greening or sponge cities is also now taking on a higher priority in politics in various regions [18,19]. A larger proportion of green space in and a lesser compactness of the city correlates with a less pronounced urban heat island-which will become increasingly important due to climate change [20,21]. In addition, most urban adaptation measures to climate change require green elements and open spaces., i.e., nature-based solutions [10,22]. The cooling effect of urban green infrastructure is described in various studies on the basis of the reduction in air temperature, which is, for example, in urban parks on average from 1.5 °C to 3.5 °C [21]. The main difficulty of this communication is that it is not so much the reduction in air temperature, which seems rather low, but the reduction in the mean radiant temperature (i.e., reducing radiation, via shading) has a high effect on the outdoor thermal comfort of people [23]. Therefore, results on the reduction in radiation fluxes by trees seem more meaningful, e.g., that trees in the close vicinity reduce 58% of direct and thermal radiance [24]. To conclude, instead of less green and open spaces, cities will need much more of them in the future. However, research shows that in many cities, the amount of green is dwindling [15]. Therefore, increased efforts are required to make the high value of green spaces more tangible and measurable in politics and administration.

1.2. Adapting the Ecosystem Service Approach for Urban Environments

An important question is how the importance of green and open spaces can be better integrated into future urban development. Quantifications of urban ecosystem services are an increasingly used approach for this purpose, which can put the services or benefits of green spaces in the city into a measurable value [25,26,27]. Tangible values are an important basis for argumentation in many planning processes, such as urban land use planning, or can be used to protect specific green areas.
If the whole city is considered as an urban ecosystem, the original definition encompasses all green and blue areas in a city, i.e., roadside trees, lawns/parks, urban forest, cultivated land, wetlands, lakes/ponds, and streams [26,28,29]. There is some disagreement among experts as to whether the technical elements of built-up space (industry, houses, sealed surfaces such as streets) should be considered as elements of this ecosystem [30]. In order to consider the city from a system’s perspective, the investigation of both constructional–technical and ecological-living elements seems to be necessary. This is especially true if a section of the city is considered, such as a district or a block of buildings, and, for example, the effects of their environment on the human health burden caused by heat, noise or air pollutants. Accordingly, it lends itself to include negative effects (urban disservices) of the technical elements in order to ultimately be able to draw an overall balance.
In order not to conflict with the original concept, we will refer to urban ecosystem services (UES) and disservices (UEDS) in the following in line with, e.g., [31]. Typical UES can be classified into four broad categories [4,31]:
  • Supporting–e.g., water cycling, air filtration and biodiversity;
  • Provisioning–e.g., supply of food and fiber;
  • Regulating–e.g., regulation of global (carbon storage) and microclimate (coo-ling via shading);
  • Cultural–e.g., promoting human well-being.
A review published in 2020 confirms increasing academic interest in UES and shows that studies on UES mostly captured the above-mentioned large green units via spatial proxy, model or remote sensing methods and calls for more research on small-scale structures [32]. In many cities, there are large areas without urban forests, or any larger public green spaces. Instead, these areas are characterized by a small-scale mosaic of public and private greenery, consisting, e.g., of roadside trees or greenery, individual trees, hedges, flower beds, gardens, lawns. These can only be captured via local mapping and remain largely or completely unconsidered in all other, currently common methods such as remote sensing or modeling.
These small green spaces also make a significant contribution to local UES and the well-being of inhabitants. For example, the soothing effect of the sight of greenery in the midst of built structures, the improvement of the microclimate through shading, evaporation or the retention of rainwater, and the contribution to the preservation of biodiversity and connectivity of larger green spaces [33,34].

1.3. Assessment of Urban Green on the Micro-Scale

Currently, a major problem in considering small-scale green areas and private trees is data availability. If city governments have a tree or green space cadaster within their city limits, these data can be used to develop certain state or ecosystem service indicators [24]. These data are generally only available for public areas since this is maintained by gardening departments, but are largely lacking for private property, to the best of our knowledge. In addition, it is not certain that available data sets include the necessary parameters to calculate the desired indicators.
The approach chosen in this study assumes, that certain UES and UEDS can be assigned to certain types of urban surfaces. With regard to climate adaptation, the surface types relevant for the system ‘city’ were roughly differentiated primarily according to their degree of soil sealing. In addition, individual functions that form the basis for UES and UEDS [29] were identified via a literature review; their functions were compiled within the city system. Various ecosystem services are therefore indirectly captured via the quantitative recording of surface types. In the case of green spaces, these are various regulating services and few providing and cultural UES [35]. In order to ensure the usability of the approach in administrations and planning offices, this approach must be linked to the planning routines in a sensible way.

1.4. Research Question and Approach

This contribution aims therefore (a) to develop a micro-scale methodology to systematically quantify small-scale green spaces and to represent them via indicators, (b) to link this methodology to the ecosystem service concept, especially with regard to climate adaptation and biodiversity, and (c) to exemplarily apply it to an urban district and to comparatively evaluate the green spaces of the public and private areas.
Thus, a qualitative evaluation concept was developed, which assigns different types of areas (biological-physical) and trees their functions with regard to climate adaptation and biodiversity by means of literature research. These inherent functions of each area and the trees represent the basis of any ecosystem services or disservices emanating from the area. Complete information about the biotope types and tree stock of a densely populated inner-city area, characterized by diverse parameters, allows for a detailed descriptive and comparative analysis of the data via UES indicators. From this, strategies can be derived to maintain or improve the urbane green stock.
The distinctive criterion regarding the green infrastructure is its user accessibility, distinguishing between areas that are easily accessible to the public (public) and areas that are difficult to reach or not publicly useable (private, i.e., backyards of block buildings). Note that the distinction in private and public in this case therefore does not necessarily correspond to the ownership, as is the case in other studies [36,37]. The results are also discussed from a practical usability point of view in administration and planning. A peculiarity of the contribution is its comprehensive insights into the small-scale green infrastructure of an urban district, subdivided into public and private space, which has been reported rarely so far.

2. Materials and Methods

The overall aim was to develop a practical method to map and evaluate local urban greenery using the ecosystem service approach. This method should be quantitative, area based, and applied at the microscale (local). It should be applicable not only for large green infrastructure (parks, green areas, forests) but also for small-scale greenery. Additionally, the resulting data and evaluating indicators should be of practical use for local municipalities.
To meet the above requirements, the ecosystem service approach had to be applied to typical surface types of urban space (Section 2.1). For each surface type, urban ecosystem services and disservices described in the literature were identified. This overview allows a first qualitative assessment of the individual surface types regarding their UES and UEDS. The focus was on regulating UES with a significance for climate adaptation (heat and heavy rainfall) and on providing UES regarding biodiversity.
The next requirement was to guarantee that local municipalities are familiar with the type of data and can actually use it in urban planning practice and spatial management. Therefore, an applied method to map and evaluate biotopes outside cities-which is normally used in landscape planning as well as to meet the needs of the building and nature conservation law–was developed further for the purpose of mapping small-scale urban greenery (biotopes [m2] and trees). In addition, status indicators as well as specific ecosystem service indicators were developed for the area biotopes and trees (Section 2.2).
This method was then applied to a structurally dense inner-city district in south-west-Germany, which contains no large blue or green infrastructure but is characterized only by small-scale greenery (Section 2.3). The area was further subdivided into publicly accessible areas (streets, paths, squares) and private areas (courtyards of block developments). For the vast majority of areas, this subdivision is also consistent with ownership (public versus private). In total, an area of 342.695 m2 was mapped and analyzed.

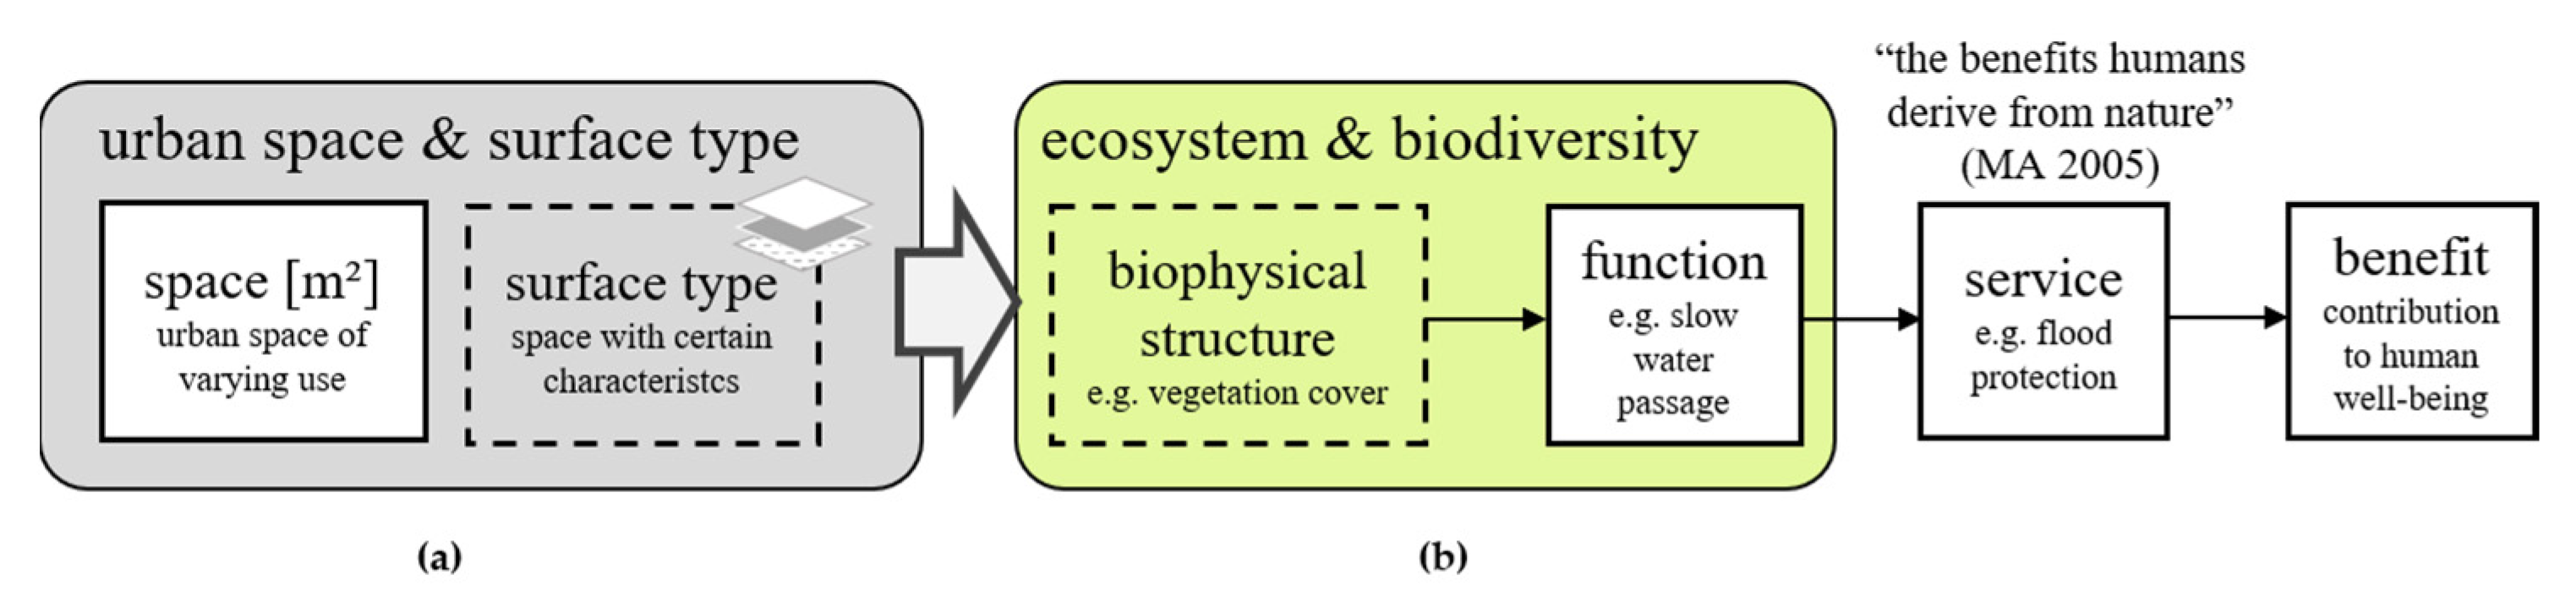
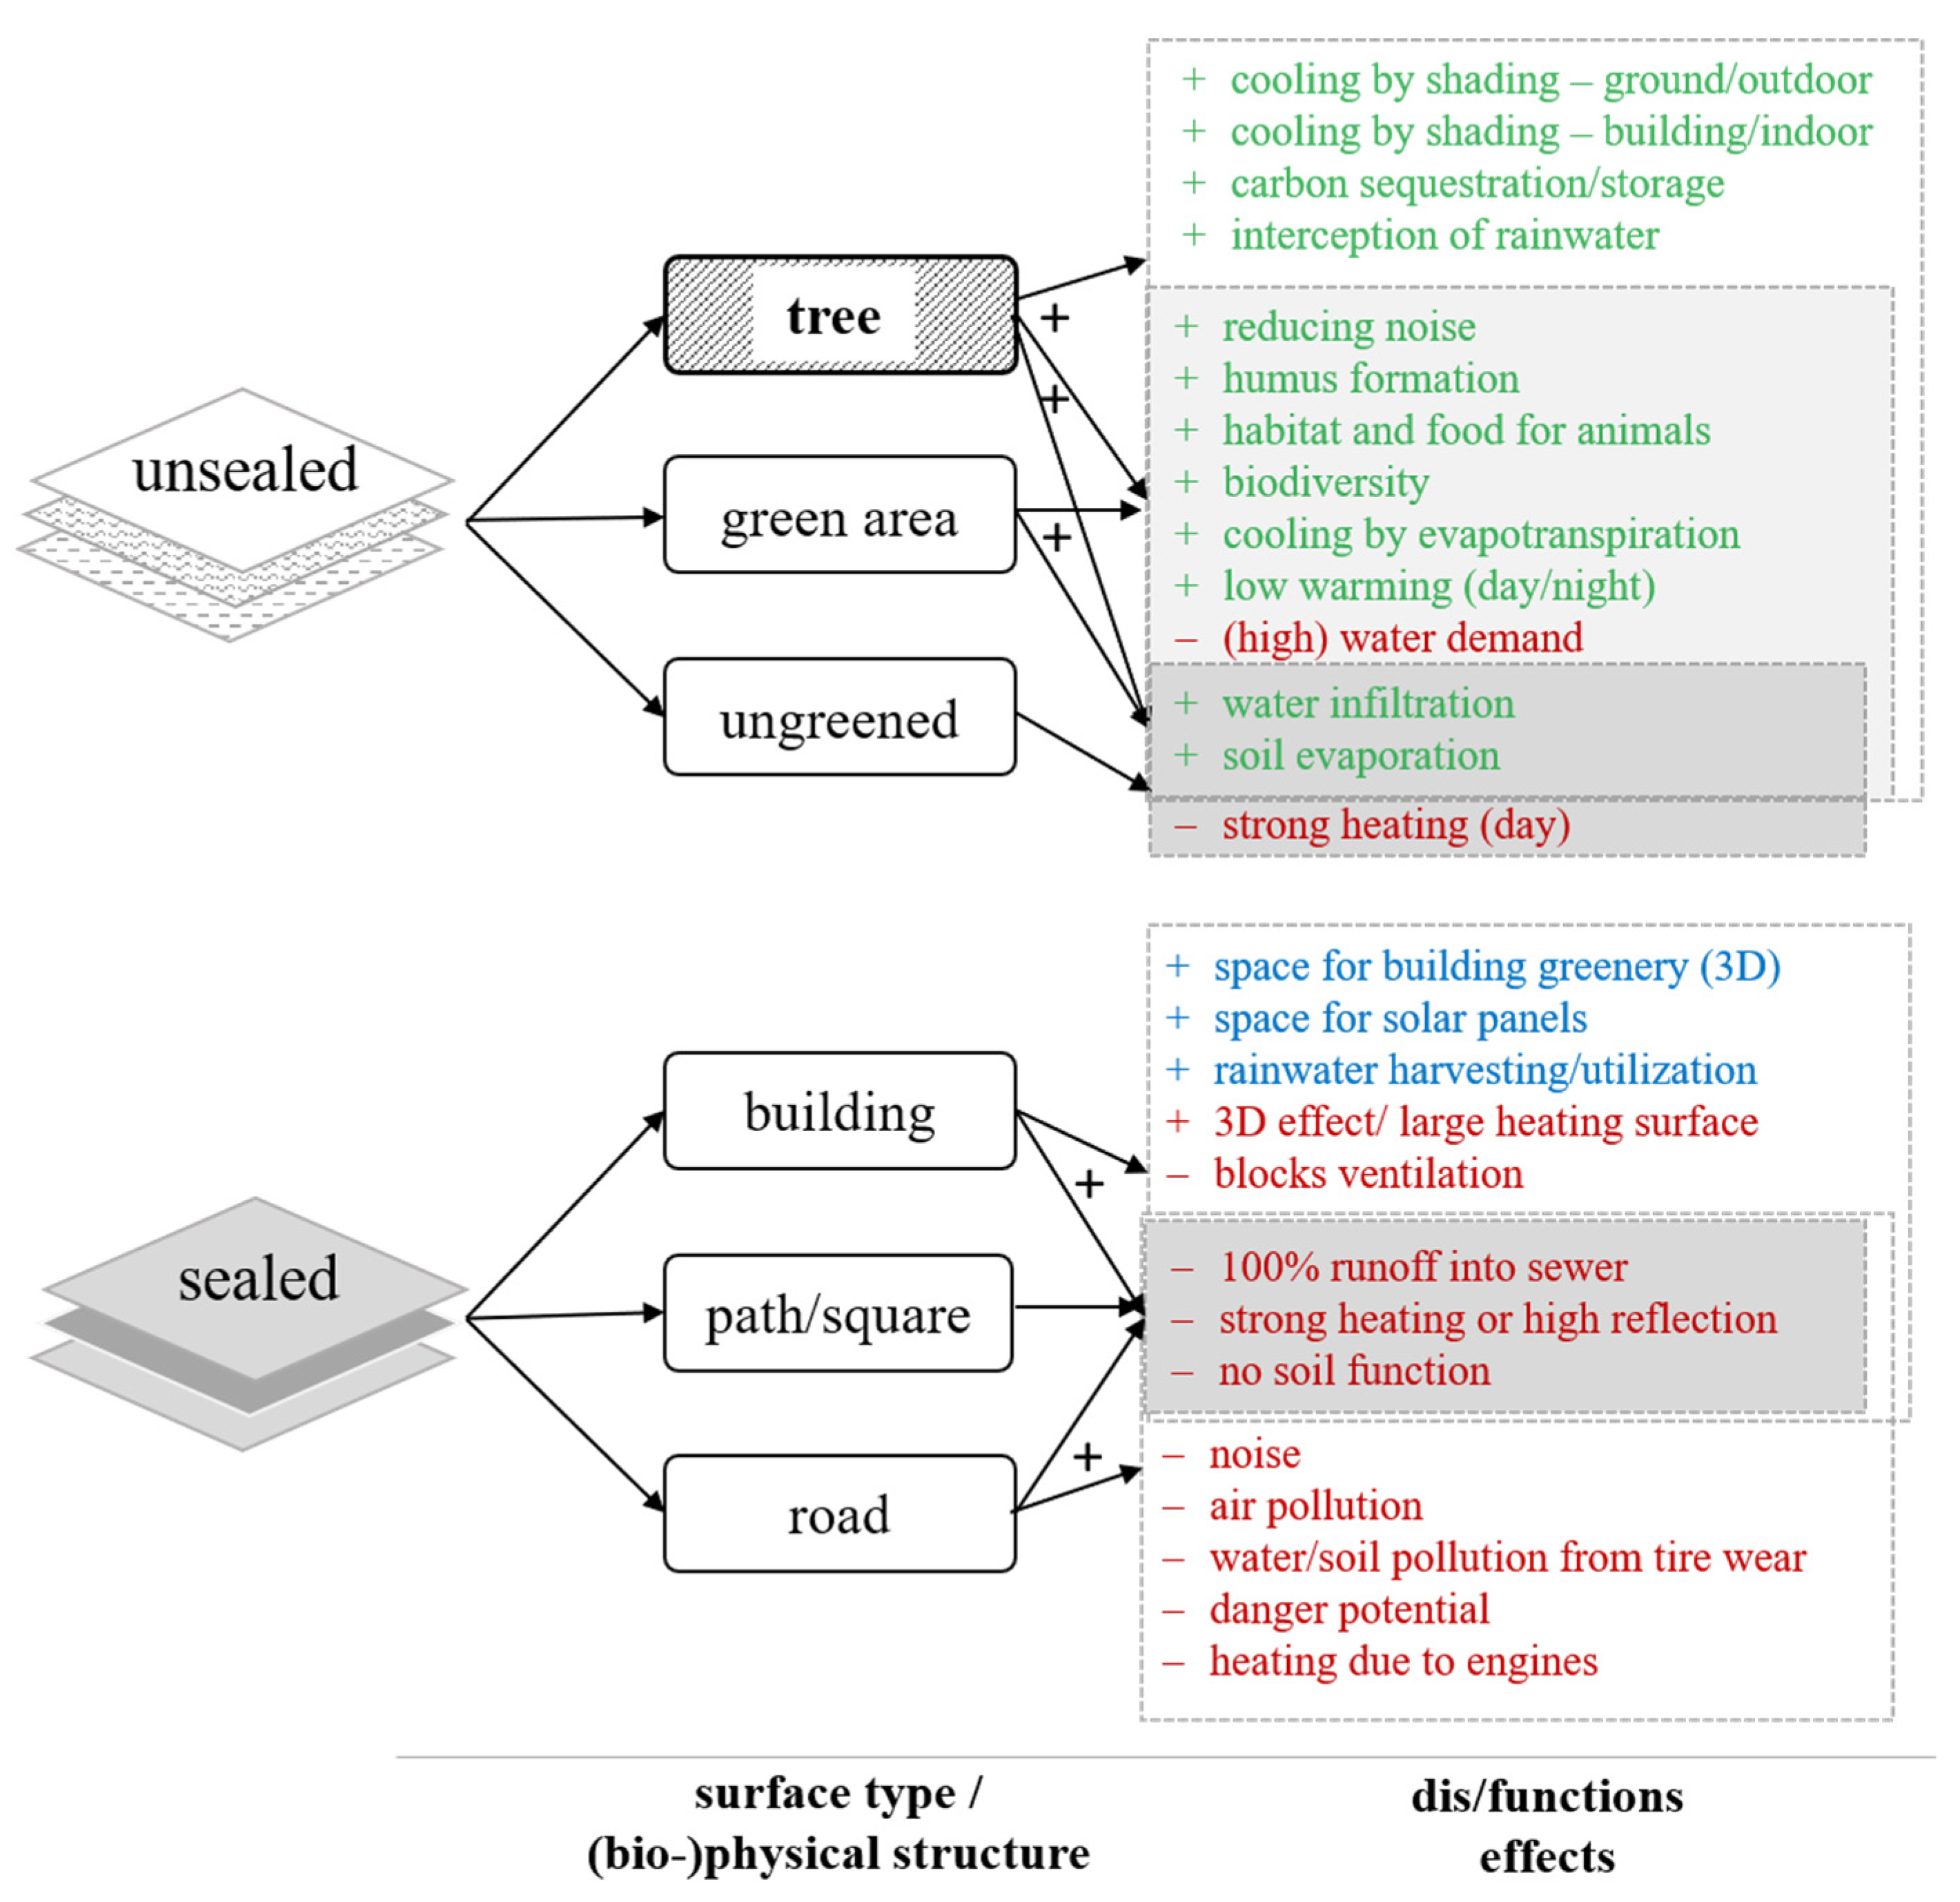
2.1. A General Approach to Link Urban Space and Greenery with Ecosystem Services Regarding Climate Adaptation

Each form of urban green possesses particular functions, which they provide through their natural properties or metabolic processes. From these functions, so-called ecosystem services or disservices can be derived, i.e., the consequences resulting from these functions are evaluated with regard to their benefit potential (UES) or harmful potential (UEDS) for humans.
These relationships have been systematized as “pathway from ecosystem structure and processes to human well-being” by De Groot et al. (2010) [38], respectively, under the term “service cascade” by Potschin and Haines-Young (2011) [39] for the purposes of the UES concept and allow a concise representation of the logic underlying the ecosystem service paradigm. Figure 1 shows the methodology chosen in this study (grey and green boxes) in relation to the original concept (Figure 1b), which derives specific UES and benefits for human health from biophysical structures and their functions.
The relationship between functions and service will be briefly described from the perspective of climate adaptation to summer heat. The metabolism of trees, for example, binds CO2 (function → ESS climate protection) as well as part of the incoming solar radiation, which thus does not contribute to local warming. The water evaporating through the leaves cools the surrounding air, and the shade provided by the leaves cools both the ground beneath the tree, i.e., the living space for people outside and-if the tree shades a building–also the building inside (function → ESS climate adaptation) [40,41,42,43]. All in all, the described functions lead to the UES “microclimate regulation” or, more specifically, “local cooling”, which in turn contributes to the maintenance of human well-being in the urban environment during summer heat (right side of the cascade: contribution to human well-being, “benefits”).
A specific tree’s contribution in this respect depends on many factors, including the size and density of the crown, leaf area index (LAI), the availability of water in the root zone, the tree species, but also on local meteorological environmental conditions such as temperature, wind, solar radiation patterns and relative humidity [40]. A quantitative estimation of the UES regarding certain tree characteristics therefore always needs to be understood as a rough approximation, which is particularly useful for comparative considerations in planning and, depending on the question, sufficiently accurate for assessing the UES and UEDS.
Similarly, any space that represents either certain forms of urban green or built infrastructure performs such functions and is therefore inherently linked to certain UES or UEDS. Mapping surface types therefore already allows for a qualitative assessment of existing UES and UEDS of an area and thus provides qualitative indicators. Mapping creates an inventory of the surfaces, through which both quantitative state and ecosystem service indicators can be derived. A comparable concept was presented by Wurster and Artmann in 2014 [44], which divided different surface types into Service Providing Units and Service Reducing Units.
Figure 2 provides an overview of the different functions that can be assigned to individual surface types. Since the focus of this study is on the climate adaptation issues of heat and heavy rainfall, the surface types were first differentiated according to the degree of soil sealing, which has a great significance for both heat and heavy rainfall. From a natural science point of view, the urban microclimate is ultimately the result of the ground-level radiation budget and the ability to exchange air. The high heat storage capacity of building materials compared to trees and green spaces leads to the overheating of cities at night compared to the surrounding countryside. Due to this characteristic, buildings and sealed surfaces cause high UEDS in summer. This overheating causes negative consequences for the health of city dwellers, which is reduced by the cooling effects of green spaces and trees. At the same time, the natural water balance in urban areas is disturbed; sealed surfaces can lead to local flooding during heavy rainfall (compared to green areas) [45,46].
It is precisely this accumulation of UEDS and the associated burdens that gives rise to the high value of the reducing UES of trees and the urban green. Therefore, large individual trees in cities are valued differently than the same tree in a village or even in a forest. In addition, the high pressure on space in the city means that even greater efforts—and thus monetary valuations—are required to preserve green spaces and trees in order to provide an adequate counterpart to the high pressure.

Using Indicators to Quantify Ecosystem Services Directly and Indirectly

The evaluation is based on indicators. Indicators are measurable (proxy) facts that serve to reduce the complexity of an observation as well as—if necessary—the estimation of not directly measurable circumstances. Indicators can therefore be interpreted as measured variables, proxy variables, characteristic variables or key variables. Among other things, they are suitable as a basis for planning decisions, for recording conditions and changes in conditions (monitoring), early warning signs for a need for action, as a basis for comparisons (benchmarking) and for informing and sensitizing selected groups of actors.
There are several sources from which indicators may be derived: local authorities, urban planners or district managers could create customized indicators as a response to local circumstances and possible problems, in a bottom-up process preferably including residents, local initiatives and organizations. On the other hand, viable indicators might come top-down from experts’ opinions, literature research and especially already existing indicator systems of higher organizational levels. For example, this might be the UN’s SDG indicators [50], the European Commission’s indicator set [51] or–for example in Germany–national, sub-national, municipal or (public) authorities’ indicators [52,53].
Indicators should be standardized, based on existing or available data or at least easily collectible to improve their applicability. Moreover, they need to be designed to be applicable to the issues they’re targeted at. At the same time, they must be easy to understand and apply, for planners, managers and other professionals, as well as for the general public.
The indicators in the aforementioned sets are sufficiently sophisticated, but mostly not too complex and usually centered around easily available data. Likewise, the indicators used in this paper try to strike this balance, too and capture the underlying states and circumstances to allow for comparisons between districts, cities, and over time, whilst maintaining some straightforwardness. Where possible, the indicators use existing data, similar to the tree cadaster, but complement them where necessary. If new data need to be collected, the standardized approach is described, too.

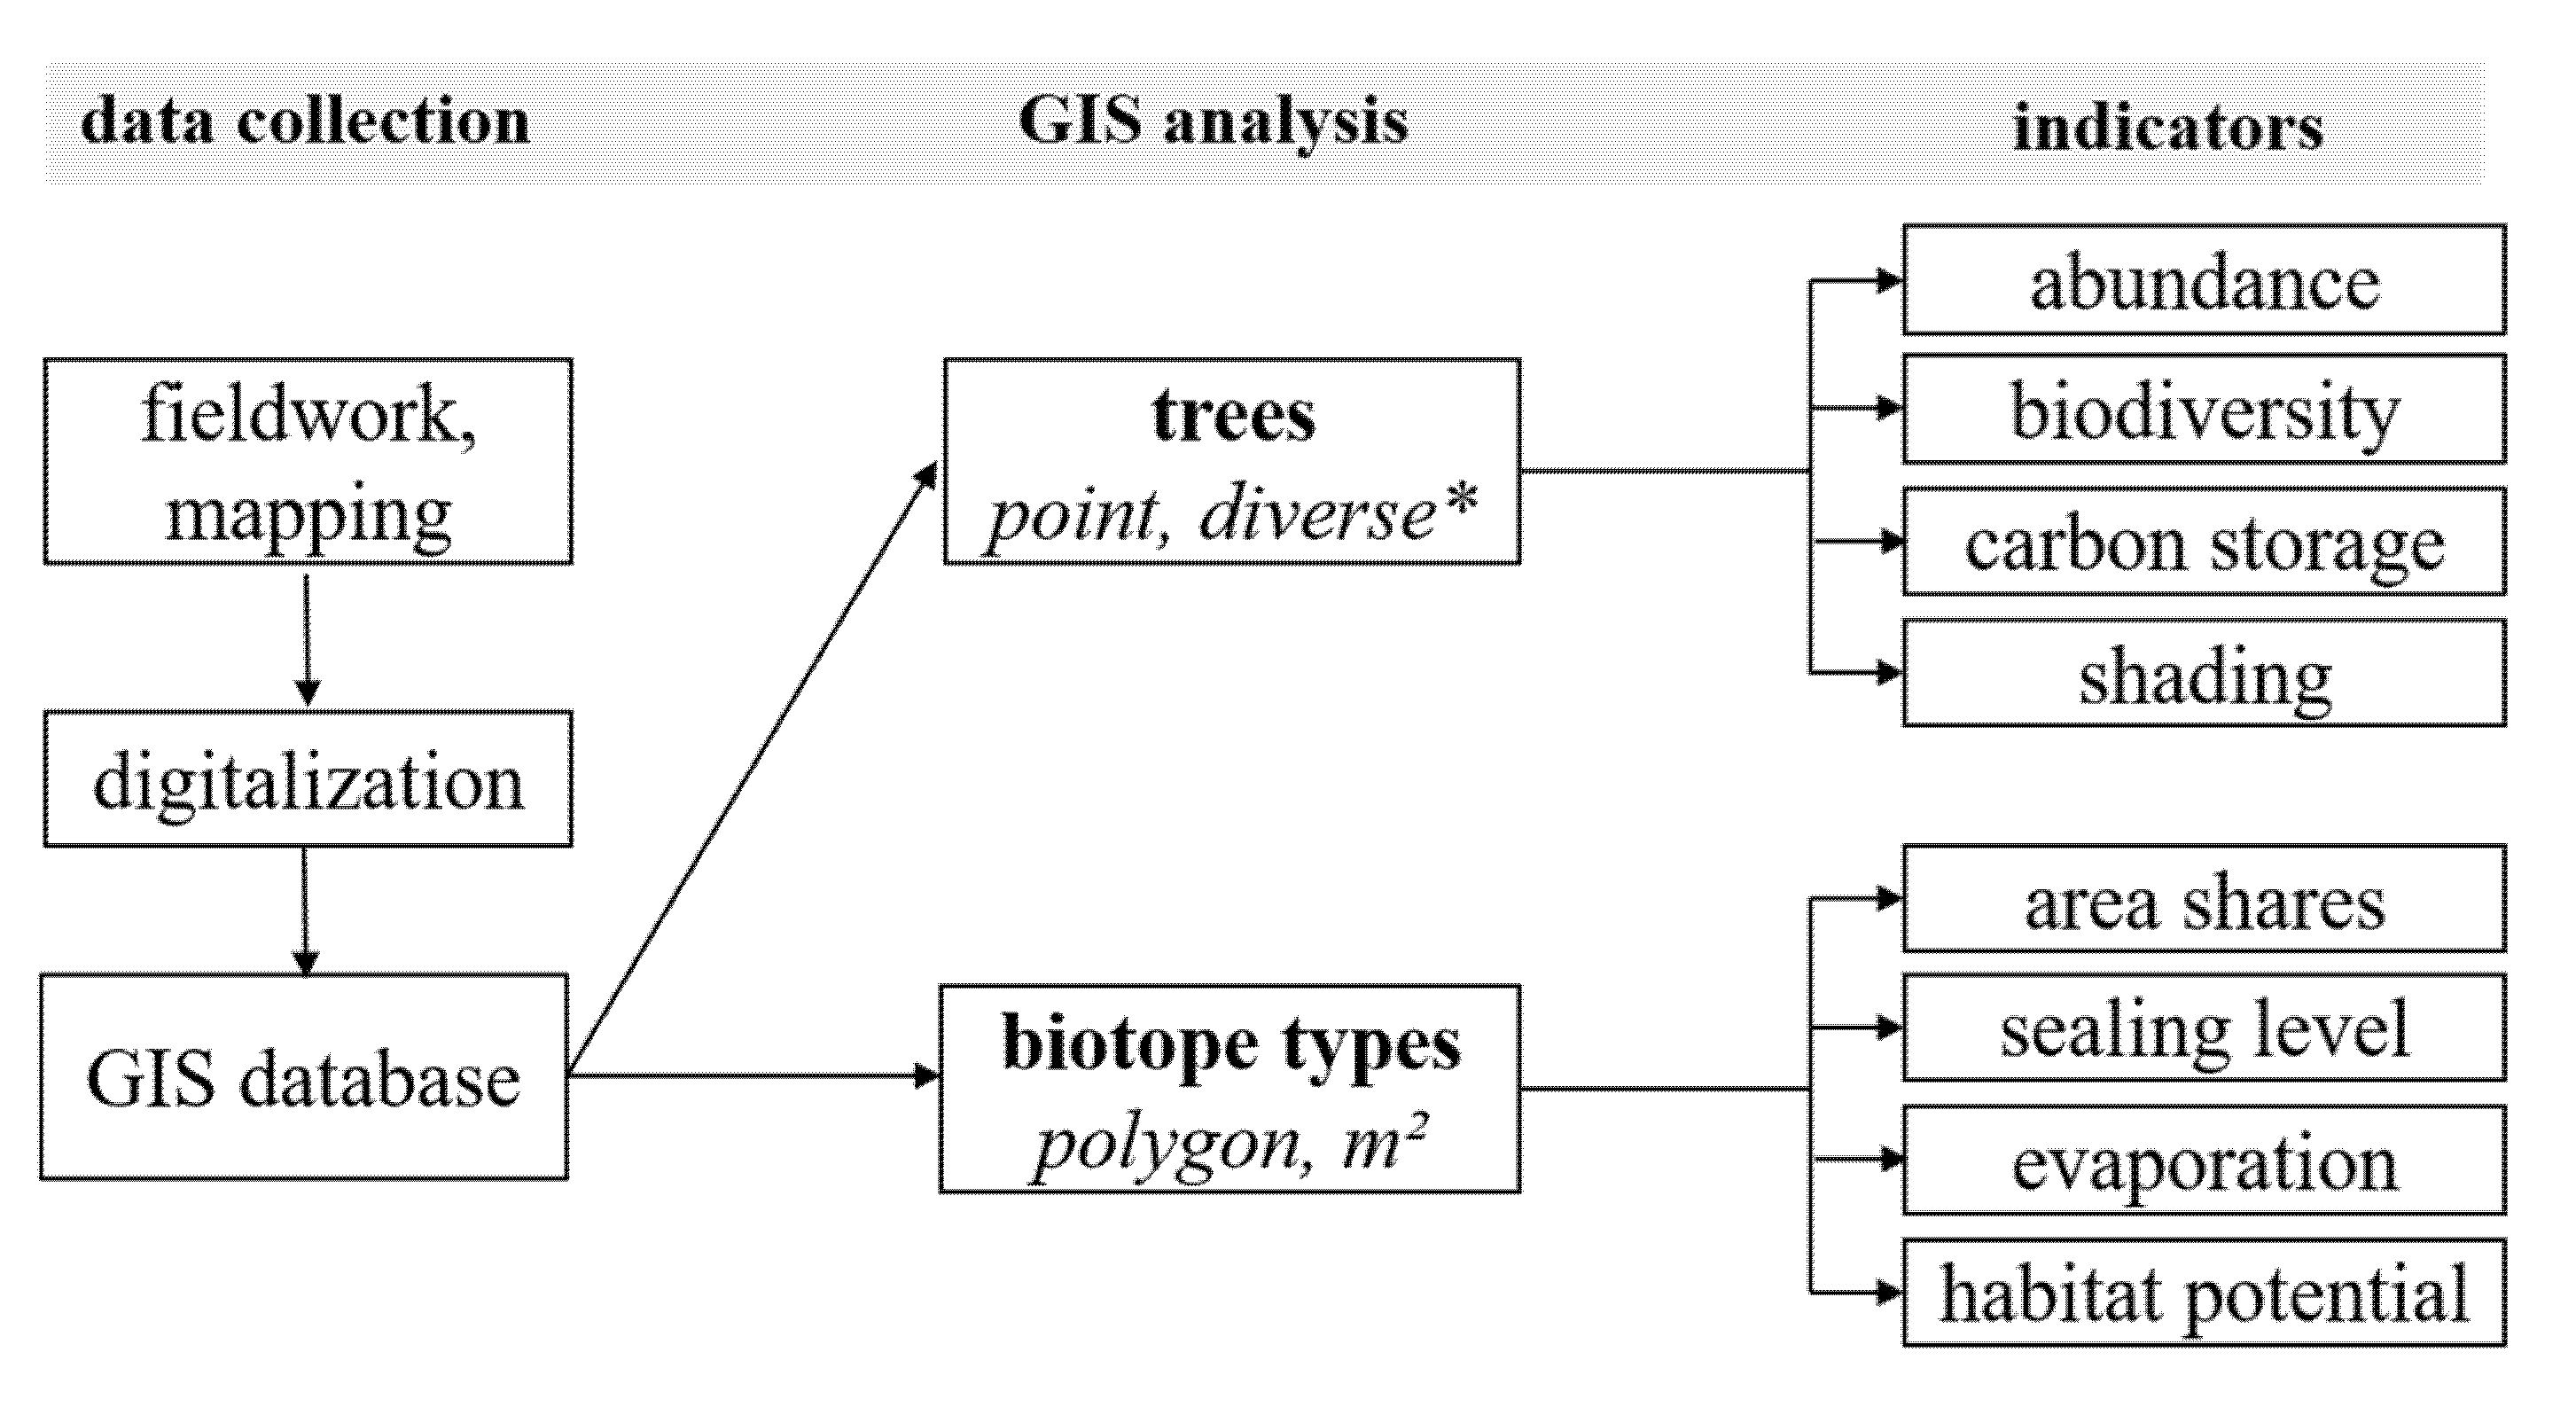
2.2. Evaluating Urban Greenery at the Microscale

Cities usually have digitized data sets of public green spaces, at least at the scale level of land use plans. In land use plans, green areas such as parks, permanent allotments and forests are recorded, but not small-scale biotopes. Public small green spaces were partly digitized as a working basis for the parks departments, but under different aspects. The city squares represented in the study area with a green share of 2 to 15% and a degree of soil sealing of 69–91% [54] were designated as green spaces in the administrative data, which was not suitable for an actual evaluation of green structures.
In addition, comprehensive data of non-public areas are rarely available for both area biotopes and trees. For a small-scale and comparative assessment of the existing green stock of an urban district, data collection via on-site inspections in both public and private areas was therefore essential.
The data obtained in this way can then be used to derive various indicators or ecosystem services. Figure 3 gives an overview of the methodology used in this study from data collection via digitization to the GIS database and the indicators derived therefrom.

2.2.1. Field Survey and Evaluation of Urban Trees

Since the city administration or the parks department are directly responsible for the tree populations in the public areas (maintenance, traffic safety, etc.), there is usually a municipal tree cadaster, which contains inventories of trees in public areas of this city. This cadaster contains various information, which should include tree species, tree height, tree crown diameter and trunk circumference in addition to location coordinates [24,55].
However, such data do not usually exist for private tree populations, for example in backyards, gardens, etc. It is therefore neither known how many trees occur there, which species they belong to, nor how large they are. For an overall assessment of the UES and UEDS of an urban district, they therefore must be recorded individually. Although tree inventories can also be obtained from satellite images or airplane/drone footage and derived data, these methods do not approach the reliability of the data obtained from field surveys [56]. Another advantage of field survey is that data can be collected specifically according to the question or desired (UES) indicator. In addition to the recording of lo-cation and tree species, further parameters to be recorded result from the desired indicators or UES.
In this study, a total of four different UES indicators were examined, for which the following tree characteristics were recorded:
  • Geographical coordinates;
  • Species;
  • Height;
  • Breast height diameter (BHD);
  • Crown diameter.
The tree species were determined by botanically trained students and an expert botanist and partially verified using a plant identification book [57] or Pl@ntNet app. Breast height diameter is defined as the diameter of the tree at a height of 1.30 m above the ground and was recorded using a tape measure. Tree height was recorded using the Vertex IV and Transponder T3 (Haglöf Sweden AB) according to the instruction manual. Crown diameter was recorded by walking on the ground in two directions (vertically or as a cross, midpoint trunk) to reduce estimation uncertainties due to directional differences in crown extent. Crown diameter was obtained from the mean of two individual data.
Abundance
This condition indicator describes the number of trees-expressed, for example, per area or per unit area. As shown in Figure 2, trees in cities provide the most UES–the more trees, the more benefits. The number of trees allows, e.g., comparative analyses over time or of urban areas and the identification of areas of need.
Biodiversity/species diversity
Based on the parameter tree species, several status indicators can be derived, e.g.,:
  • Number of species per area [m2, hectare] or study site;
  • The abundance of individual species per area/site;
  • A ranking of tree species in given areas.
Carbon storage
An important UES of trees is the ability to absorb carbon dioxide by photosynthesis and to sequester it in the long term. The amount of carbon stored by a tree depends on many parameters and can be estimated approximately by different methods (e.g., [58,59]). In this paper, the focus was on a rough estimate of the stored amount of CO2 per tree using parameters that are easy collectable. This was achieved by means of estimation tables of carbon storage for the tree species beech, oak, pine and spruce, which were published by the Bayrische Landesanstalt für Wald und Forstwirtschaft (LWF: Bavarian State Institute for Forests and Forestry). Other tree species were assigned to the individual tree codes by means of a literature search. The necessary input parameters are tree species, tree height and breast height diameter.
Shading
Urban trees significantly mitigate the heating of the ground (and building surfaces) in summer due to shading of the canopy [43,54,60,61]. The canopy diameter provides a quantitative estimate of the tree cover and its minimum shading potential (“crown footprint”) [60]. More detailed analyses of the shading effect require special input parameters and complex simulation tools, such as ENVI-met [62].

2.2.2. Mapping and Evaluating Biotopes/Green Spatial Elements

The mapping of areas in the open land was based on the regionally common mapping method for open land biotopes in planning. This type of mapping is usually used in Germany in the open countryside (outside area, according to §35 of the German Building Code (BauGB) as soon as this is to be converted to building land in order to compensate for interventions in the natural balance within the meaning of the Nature Conservation and Building Act. The selection and differentiation of biotope types is therefore familiar to both specialized administrative departments and planning offices.
The area-precise mapping of the biotopes was carried out with the help of DIN A 3 map templates, which contained both an orthophoto of the area (City of Karlsruhe, 2017) and the property and building boundaries (Civil Engineering Office Karlsruhe). In the field, biotopes were surveyed and these as well as tree locations were drawn in based on the boundaries and the aerial photo comparison. Roof overhangs of the orthoimage cover the underlying biotope areas, so GIS shapefiles for building and property boundaries were necessary for area-accurate mapping or digitization.
Of the many natural biotope types (>100) found in this mapping key, only some are found in the city. These were then categorized according to their degree of sealing and according to their UES as shown in Figure 1 in different types of areas. First, sealed/partially sealed areas (buildings, paths/squares, roads, elements such as walls or fountains) are distinguished from completely unsealed areas (greened area, un-greened area). A certain type of area can include different types of biotopes. Green areas comprise the largest number of different biotope types (12), whereby mainly low vegetation up to shrubs are summarized here, and trees form a separate category. In addition to the classification of the biotope type, other characteristics of the green space were noted: the presence of native species, of non-planted species, the amount of understory for shrubs and hedges, particular species poverty or richness.
The digitization of the dataset was carried out in QGIS version 3.6 Noosa and was based on an aerial photograph and other basic GIS data of the city of Karlsruhe. The building and road boundaries were particularly relevant, so that the resulting dataset can be used directly as part of the city’s GIS geometry. The resulting dataset is therefore part of the work routine of both the city administration and planning offices. This is to ensure that the resulting data basis and analyses can be used and transferred directly in practice.
With regard to the biotope types, Figure 2 and Table 1 unite thematically. The most basic distinguishing feature for an urban area here is the degree of sealing, i.e., sealed or unsealed. From here, a rough distinction follows according to surface types or biophysical structures. This serves for the rough assignment of first UES and UEDS, which mainly depend on sealing, use (e.g., car traffic) and structure (3D structure of buildings). The finest granular level are the biotope types. The sealed areas are differentiated here once again according to the degree of sealing. The surface type green area, on the other hand, is divided into 13 different types of green infrastructure, reflecting the diversity and importance of this group for the UES. The mapping of the biotope types for the entire study area provides a data basis from which, in principle, indicators can be developed for all UES or UEDS, as shown in Figure 2. This study uses two indicators, which are already used in planning practice (degree of soil sealing and evaporation), and developed two new indicators, as briefly described below.
Area shares
With the help of the quantitative area data, a wide variety of questions can be addressed, e.g., the frequency distribution or the proportion of different biotope types in the overall district. The area distribution can be used to assign study areas to specific development types. In this way, separate urban districts of a city or of different cities can be characterized on the basis of the development type and thus be compared better. Ultimately, approximate values for UES can be determined from a set of individual surveys, which can be used for modeling, simulations, etc. [63].
Degree of soil sealing
This indicator reflects a basic valuation basis-sealed or unsealed, with slight gradations for different types of sealing. A fully sealed area causes many of the UEDS shown in Figure 2, e.g., high runoff, strong heating and no soil function. Thus, the degree of soil sealing is an important indicator from which various aspects can be evaluated. For example, it can be used by authorities or municipalities to estimate urban heat island (UHI) effects or for urban runoff management [46,64]. The high resolution of the data presented here also allows for a parcel-specific estimation of the potential for unsealing [65], which, together with greening, represents a valuable climate adaptation measure.
Evaporation
Potentials for their local evapotranspiration contribution can be assigned to the individual biotope types. Such a qualitative assessment includes the soil/surface and its ability to absorb, store and evaporate rainwater (unsealed and ungreened) or to make it available to plants (unsealed and greened) (compare Figure 2). The evaporation potential of sealed surfaces is generally limited to the short period of wetting after a rainfall and is therefore considered to be very low. The actual evapotranspiration depends on many factors, which include the soil aspects, but also plant type, meteorological conditions, as well as the irrigation situation (natural or technical) and thus the amount of evaporable water in the system [66]. To strengthen the link to practice, this study used a guideline from the city of Karlsruhe for qualitative estimation of evapotranspiration potential by biotope type [67].
Potential for species diversity and habitat
Cities can host a variety of plants, and this urban plant biodiversity in turn provides the habitat for diverse animal species. Therefore, for each of the 20 biotope types, a literature review was conducted with the aim of assessing its potential in terms of plant species diversity, as well as its potential as habitat for insects and small animals such as birds and rodents. The resulting evaluation is listed in Table 1.
Table 1. Classification of main surface types, subclassification of biotopes and categories of connected UES indicators. Note that poor to very good (poor to v.g.) indicates a wider range of the habitat potential depending on specific characteristics of the garden, e.g., the level of sealing or biological gardening, plant species composition. * Sealing and evaporation were initially presented in [68].
Area TypeNo.Biotope TypeHabitat PotentialSealing *Evaporation *
un-
sealed
green area1group of treesvery goodunsealedmedium
2bushes; shrubberygoodunsealedmedium
3hedges; row of shrubsmediumunsealedmedium
4blackberry scrub goodunsealedmedium
5ruderal vegetationgoodunsealedpoor
6flower bed; bordergoodunsealedmedium
7ground cover plantingmediumunsealedmedium
8lawnmediumunsealedmedium
9patchy treat vegetationmediumunsealedpoor
10ornamental lawnpoorunsealedmedium
11kitchen gardenmedium (poor to v.g.)partially sealedmedium
12ornamental gardenmedium (poor to v.g.)partially sealedmedium
13mixed garden typemedium (poor to v.g.)partially sealedmedium
ungreened14unpaved road or squarepoorunsealednone to poor
sealedbuilding15buildings sealednone to medium
path/square16cobbled road or squarenonepartially sealednone
17path/square with gravel, crushed stonepoorpartially sealednone to poor
road/square18completely sealed street or squarenonesealednone
element19small water bodies (well/pond)none/goodsealedhigh
element20grouted wall; natural stone wallpoor/goodsealednone

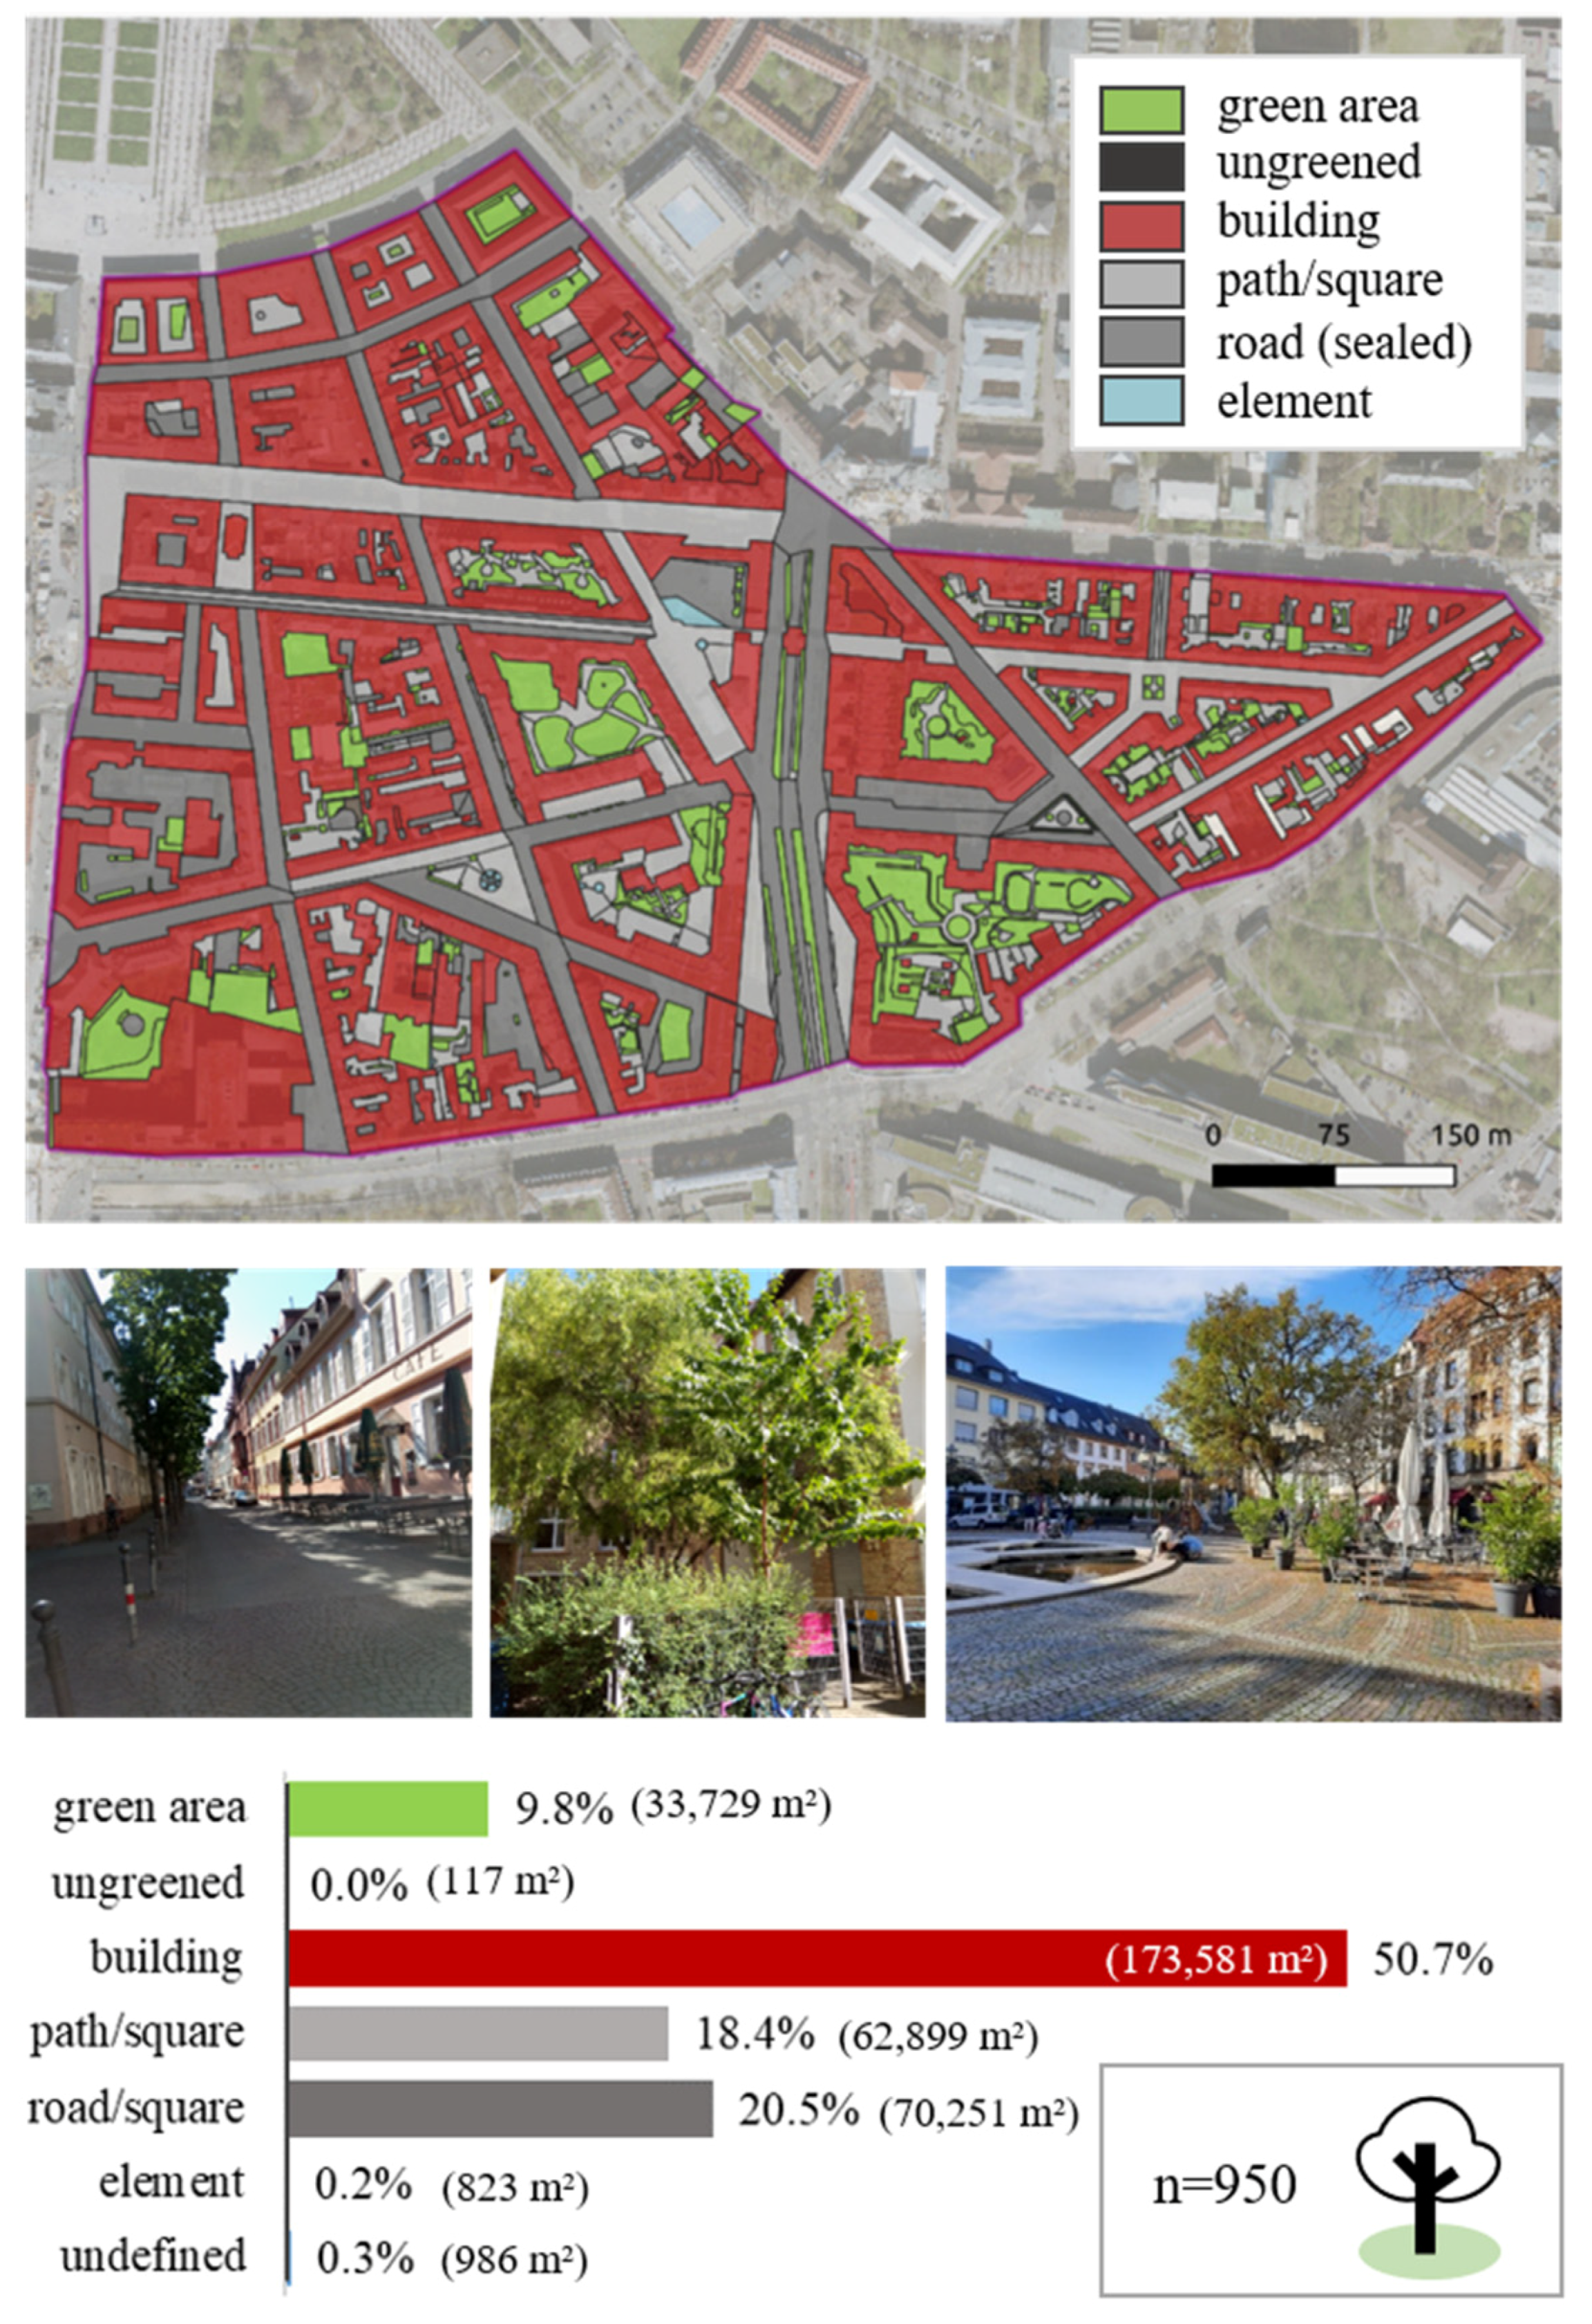
2.3. Case Studies: UES in a City District in Karlsruhe and Mannheim

The study area of the inner-city east of Karlsruhe has an area of 342,695 m2, of which about half (49.5%) are buildings. The dominant building structure is perimeter block development. The area includes a total of 28 blocks with over 100 courtyards, some of which vary greatly in shape, orientation and size (total block: 2060 m2 to 21,900 m2). The courtyards (mostly private and publicly inaccessible) cover about 24.2% of the total study area, 26.4% are public open spaces (streets, squares, paths). The courtyards vary in their characteristics from largely (>50%) unsealed and greened (4 out of 28) to completely sealed or heavily re-densified (at least 11 out of 28) [68]. In 2019, approximately 6450 people lived in the study area.
In this study, the mapping key valid for the state of Baden-Wurttemberg was used [69][, as well as the somewhat refined extension of the city of Karlsruhe with regard to urban biotopes (not publicly accessible). The mapping work was carried out during a student internship from June to August 2020. Since the study area does not contain any larger green spaces (parks, sports fields, etc.) and therefore mainly small-scale biotopes were to be expected, a mapping scale of 1:100 was chosen. The size of the biotopes [m2] was estimated by walking and drawn in aerial photographs, which contained building and path boundaries for better orientation (data of the civil engineering office of the city of Karlsruhe). At the same time, existing trees were recorded. The mapping of the entire area took place under difficult conditions, since the mapping persons had to gain access to the mostly inaccessible backyards by ringing bells and asking for permission.
The city of Karlsruhe has a GIS-based tree cadaster that contains information about the trees in the public areas. This was used for the analyses of the trees in the public area (n = 340), whereas in the private area (n = 610) the trees were mapped over the course of the study. Few trees (n = 11) of the public area were also included in the mapping process. In total, this resulted in a total data set of 950 trees in the study area.
Working with the cadastral data, it was found that the city’s dataset only included the tree species for all trees in the public domain. The parameters height and BHD were only recorded for a part of the tree population, the crown diameter not at all. From the total data set of 950 trees, there were available for calculation:
  • Carbon storage (parameter: height and BHD): 597 (63%), of which 416 were private (=private share: 68%) and 181 public (=public share: 53%).
  • Shading (parameter: crown diameter): 605 (64%), of which 594 private (=share private: 99%) and 11 public (=share public: 3%)
The subsequent digitization of the biotopes (polygon) and trees (points) was performed with the open software QGIS version. The evaluation of the data was also carried out with QGIS and Excel.

3. Results

In the following section, the results of the mapping and the evaluation of area-related indicators (area reference: hectares) are presented. The study area comprises 28 different perimeter block developments, which incorporate more than 100 backyards. There was seldom free access to the backyards. Usually, entry had to be requested by ringing the bell at private households (blocks in private hands) or via a permit (blocks in public hands). However, only 0.3% or 986 m2 of the total area could not been mapped due to limited access to the backyards.

3.1. Presentation of Urban Green Stock Via Official Data Bases and Public Maps

The land-use map (Landsat 2010) of the State Office for the Environment (LUBW) dominantly identifies the class “settlement-dense” for the study area, although some misinterpreted pixels (scattered fruit, arable land, vineyard/orchard) already indicate existing greenery.
Beyond that, the geoportal of the city of Karlsruhe does not offer a more detailed land use map. The basic map of the geoportal marks areas with a green color, which according to the biotope mapping partly contain flower beds, but are otherwise largely sealed. In comparison, the map for green spaces marks other areas, mostly city squares, which can all be described as largely to completely sealed as a result of a preliminary field survey [54]. This is most likely due to public green areas being defined here according to the German building code as “local facilities withdrawn from private use and thus from the outset neither buildable nor subject to contributions (§ 9 para. 1 No. 15 BauGB).
Concluding, neither the land use maps nor the special maps of the public geoportal provide information on the actual stock of urban greenery at the microscale.

3.2. Area-Specific Analyses Using Field Mapped Data

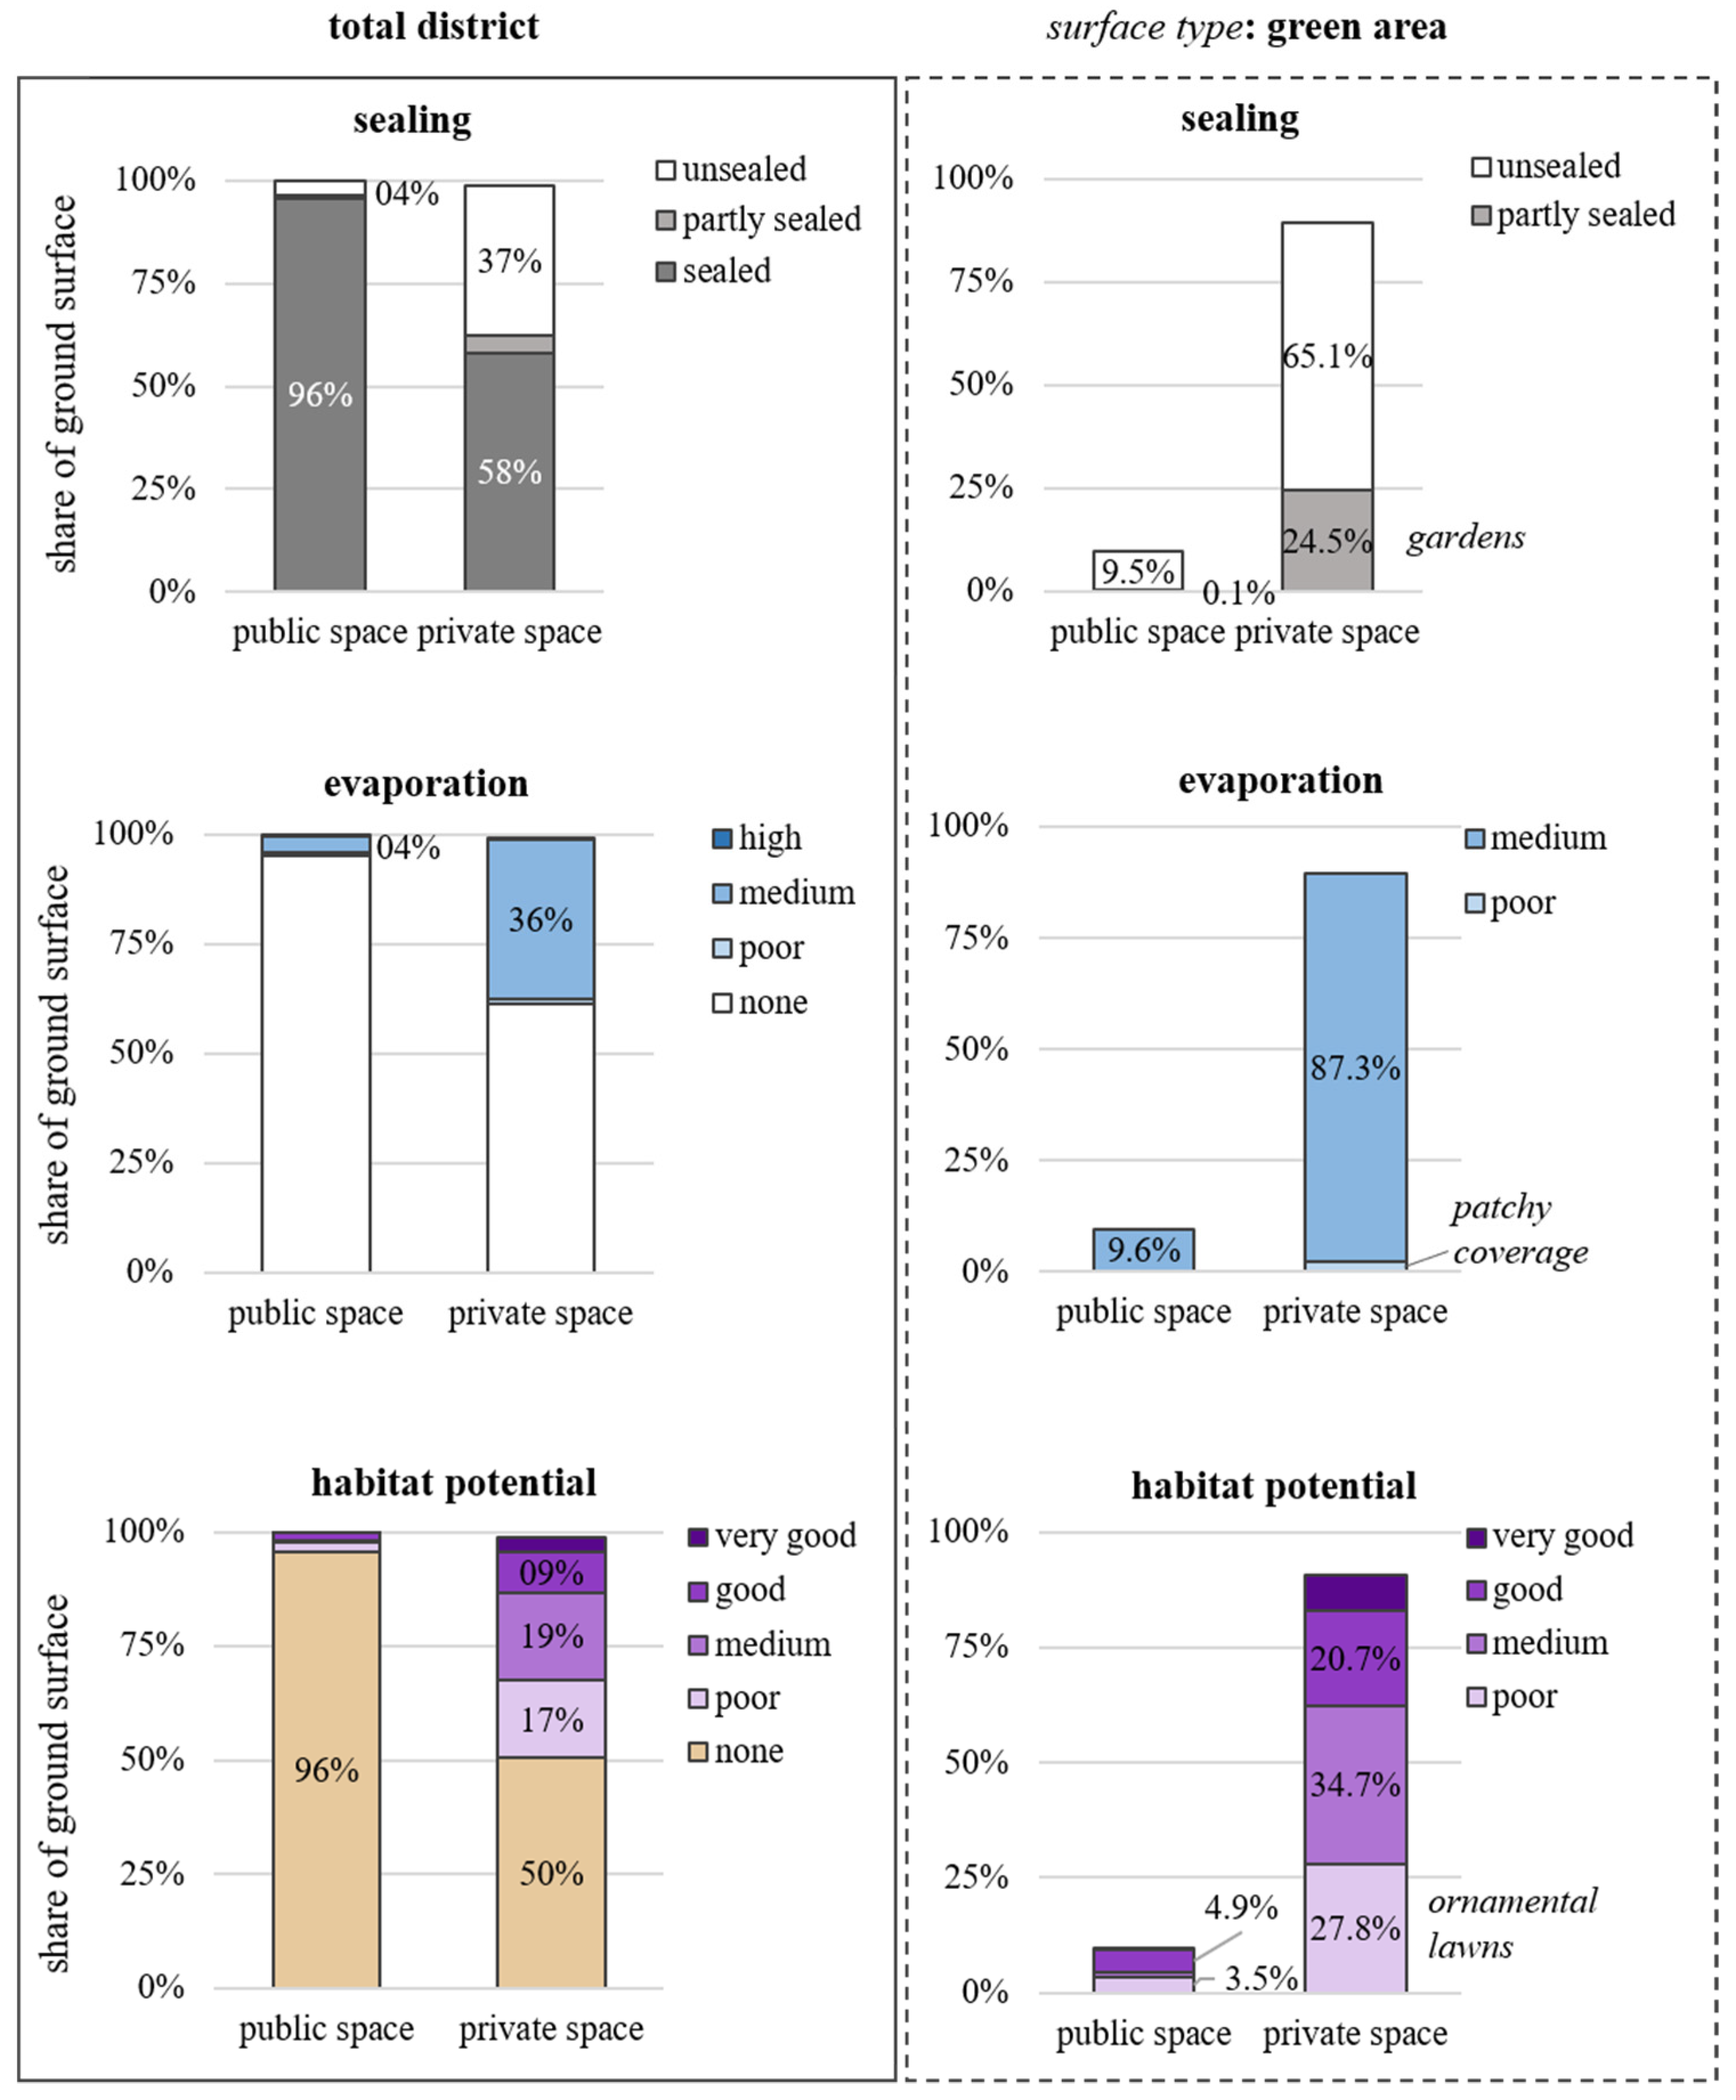
3.2.1. Area Shares of Surface Types and Biotope Types

In total, 20 different biotope types were identified within the city district under investigation, of which 14 belong to the unsealed and 6 to the sealed area type. The resulting GIS geodatabase comprises 928 polygon shapes. A list of area shares per biotope type is provided in Appendix A.
Although it is a high-density inner-city district with 89.7% sealed area, the results of the microscale mapping show that valuable green spaces are present at 10.0% of the total area. The building structure is mainly block structure, which is categorized as the building structure with the worst effects on warming and heat stress, e.g., in the Karlsruhe framework plan concerning adaptation to heat.
Block buildings occupy 49.5% of the total area, with an additional 1.2% of small buildings and garages within these blocks. As illustrated in Figure 4, the negative effects of the buildings due to sealing and building mass can be mitigated by certain measures such as green roofs (water retention, cooling effect especially with intensive greening) or shading via photovoltaic systems. An estimation of the roofs made by means of the ortho aerial photograph shows that 87% of the roof areas are not yet used, about 10% are greened (of which about 60% extensive, 20% roof garden/potted plants, 20% intensive) and photovoltaics are installed on 2% of the roof areas. Therefore, there is a clear potential to mitigate heat and heavy rain events locally through green roofs and retention on the one hand, and to contribute to climate protection through more PV systems on the other hand.
Besides the buildings, another 39.1% of the total area belongs to the sealed category. Of this, 20.5% of the area is completely sealed and mostly used as a road, with the corresponding negative side effects. The remaining 18.6% are (partially) sealed paths and squares with different surface conditions and elements such as fountains and single (stone) walls.
The remaining 10% of the area is unsealed and includes areal green spaces and unpaved areas and paths as well as groups of trees. Single and row trees are treated separately in the next chapter. Figure 4 gives an overview of the distribution of surface types for the study area. Most of the green stands are located in the private areas. The authors refrain from showing the higher-resolution biotope types here to protect the privacy of the owners.
The following considerations refer only to the ground level areas (173,231 m2). The areas of the perimeter buildings (169,463 m2) were excluded from the calculation.

3.2.2. Surface and Biotope Type Coverage and Their Comparison within Public and Private Space at the Microscale

If the study area is analyzed separately according to the accessibility of the areas or in public and private space, significant differences between the two areas become evident. While the public sector includes a large part of the streets or fully sealed areas and only 3.6% of unsealed areas, 37.2% of the areas in the private sector can be assigned to the green area and unsealed area type. An overview of the division of the area into private and public space, as well as their shares of surface types and biotope types, is given in Figure 5.
The green space comprises seven different biotope types on 3261 m2 in the public space and 13 different biotope types on 30,469 m2 in the private backyards.
Some results of this and the following section have already been published in a similar way [68] and are listed and supplemented here for consistency.

3.2.3. Stock and UES Indicators of Urban Greenery at the Microscale

In addition to the area shares, the stock indicator sealing and the UES indicators evaporation and habitat/biodiversity potential provide further possibilities to observe and evaluate the development of the city district with regard to its UES (Figure 6).
As expected from the examination of the area shares (Section 3.2.2), the private space has the highest shares of UES. Due to its share of green areas, the positive impact on the microclimate (evaporation) or biodiversity (habitat potential) is higher than in the publicly accessible area. Overall, however, the proportion of green areas of the private space compared to the total private rea, adding the buildings (and their UEDS), amounts to only 9.0%.

3.3. Tree Stocks in Private Versus Public Areas

3.3.1. Data Situation

The biotope types had to be mapped for the entire study area, as no applicable data was available. The tree inventory for the public space could be based on the tree cadaster of the city administration. In the private areas, trees and their parameters species, height, breast height diameter and crown diameter were mapped. Correspondingly, the tree population of 985 m2 backyard area is missing, to which the mappers did not have access.
The tree cadaster contains information on location, species, height and BHD. According to the green space office Karlsruhe, this information is recorded per tree when it is planted and later updated when the individual tree is visited for maintenance measures. The degree of updating of the data is therefore inhomogeneous. Data on height and BHD, which increase over time due to tree growth, are therefore not always up to date. It can be thus assumed that the latter parameters are underestimated for several trees within the cadaster compared with their actual state. No information is available on the crown diameter of the individual trees, which is why the indicator shading could only be calculated for the private space.

3.3.2. Distribution, Abundance and Species Diversity

Figure 7 shows the location of the trees, with a separate view on the 5 most common tree species, as well as the number of trees and the number of species for the entire district as well as the public and private space. Boxplots show the distribution of growth parameters.
In the high-density downtown area, there are almost twice as many trees in the private courtyards (n = 610) as there are in the public area (n = 340). Expressed as an indicator of the number of trees per hectare, this translates to:
  • Total area (surface and buildings): 27.7 trees/hectare;
  • Public space: 37.6 trees/hectare;
  • Private space: 73.7 trees/hectare.
In addition, there are 3.5 times as many tree species in the courtyards as along the streets, paths and squares. However, young trees < 5 cm BHD are also found in the courtyards (BHD 1–4 cm: n = 22 or 4% of private trees), whereas the smallest tree of the public area had a BHD of 5 cm. The young trees < 5 cm were either emerging wild growth mainly from Ailanthus altissima, which is strongly self-propagating here, or young trees that were bought and planted small by private individuals for cost reasons (statement of a resident). The trees with the largest BHD were found in the private area, whereas, on average, the height of the trees as well as the maximum height was smaller there than in the public area.
An overview about the number of tree species as well as the most frequent 6 tree species in both subareas is given in Table 2. In total, 95 different tree species grow in the study area. The most abundant species is Acer campestre with a total of 91 individuals or nearly 10% of the total trees. The species diversity in the private area is greater than in the public area, both in terms of the actual number of species and in relation to the number of existing trees. This is expressed as an indicator of the number of species per hectare:
  • Total area (surface and buildings): 2.8 species/hectare;
  • Public space: 2.2 species/hectare;
  • Private space: 9.1 species/hectare.
It is clearly evident that in the public area, few tree species make up the majority of individuals. Here, the six most abundant species comprise 88% of the total tree population, whereas in the private sector the six most abundant species represent only 40% of the number of trees. In conclusion, the species diversity in the private arear is considerably higher and more balanced than in the public area. This relationship is visualized in Figure 8.

3.3.3. UES Carbon Storage and Shading

The amount of stored carbon could be determined for 338 trees (99.4%) of the public domain and 602 trees (98.7%) of the private domain.
Dividing the total stored carbon of each subarea by its number of trees yields remarkably similar values (public: 758.3 kg; private: 756.2 kg)-despite the different size distribution of the trees (see Figure 7). If this value can be confirmed over further urban areas, this value could be an alternative to more elaborate methods as a rough but very simple approximation.
The area-based indicator yields values that are generally comparable between city districts:
  • Total area (surface and buildings): 20,763 kg carbon storage/hectare;
  • Public space: 28,339 kg carbon storage/hectare;
  • Private space: 54,984 kg carbon storage/hectare.
The highly simplified shading by trees (as canopy footprint) is calculated to 20,788 m2. Accordingly, 25% of the total area of the backyards is shaded by trees (simplified). The actual sun shadow volume differs due to solar altitude, also the shading of buildings is not considered. This indicator also describes the receiving surface for precipitation.
The analysis of the distribution of the shading area shows that 59% of the considered trees in the private sector shade an area of 1 to 25 m2, and 80% shade 1 to 50 m2 (Figure 9). The maximum value of a single tree was 491 m2, a total of 9 trees (1%) have shading capacities greater than 300 m2 per single tree.

4. Discussion

The results of this study show, that it is possible to assign differentiated qualitative and quantitative indicators for ecosystem services and disservices (UES/UEDS) to biotope types and urban trees. By means of field surveys, every type of urban green space (i.e., biotope types), both public and private, was recorded for an inner-city district. Using these data, district-wide indicators were developed. With the help of this data set, issues of different scales can be addressed: from single biotopes to the comparison of entire city districts.

4.1. Methodological Considerations from a Scientific and Data Acquisition Perspective

From a scientific perspective, there are three advantages of the survey method presented. First, an area-accurate database, allowing quantitative assessments and calculation of indicators as well as comparative analysis. Second, actual information about the type of greenery and other specifics. These allow further evaluation with regard to its potential importance as a habitat or in terms of biodiversity/species richness. Additionally, third, the approach allows to add an important dimension to pure area considerations: of the urban green quality and the associated UES.
This approach was piloted in a long-established urban district that does not have any large public green spaces, but is characterized by small-scale greenery. Due to the low spatial resolution, these small-scale green spaces would only be partially or not at all captured by scientific methods commonly used to collect citywide ecosystem service indicators. For example, by assessments based on grids/raster data or land cover data [48]. The advantage of the latter, city-wide studies lies in the comparatively simple and rapid data collection, which allows continuous observations for monitoring [70]. In addition, most of the studies on urban greening focus on large green spaces, parks or urban forests. For these applications, a low resolution is sufficient, depending of course on the specific research question However, individual trees or biotopes are not covered.
Methodologically more advanced approaches extract green cover using remote sensing data [71,72]. Resulting data have a higher resolution, areal accuracy and differentiation than raster data, but lower than onsite mapping. For automatic classification, a problem that has not yet been fully solved in the use of aerial photography is the shadow cast by buildings [73]. This, together with the obscuring effect of trees, has also proved to be an obstacle to purely aerial photo-based analysis for the classic identification of biotopes. In addition to the area and type (biotopes) or species (trees) accuracy, another advantage of mapping is the possibility of targeted recording of the required parameters for further analysis.
The simplest way to perform analyses of urban greening would be to use area-precise data from the city government. The difficulty with this is the availability of data. In the 1970s, urban biotope maps were considered important information for urban planning and mapping was carried out in 228 cities throughout Germany until the end of the decade (about 10% of the total no. of cities in Germany) [74,75]. Back then, the problem of steadily growing cities was already recognized. However, the special nature of the city as a “new type of environment” is characterized by a particularly high species richness compared with the surrounding environment [76]. However, due to the high cost of comprehensive biotope mapping, it was not pursued further, and many old maps are no longer updated [75]. It is therefore unclear how many German cities have a sufficient data basis today for the consideration of urban green spaces. This must be considered alarming in view of the high importance attached to urban greening, climate adaptation and biodiversity issues.
The limitations of field mapping have just been mentioned: it is a time-consuming and therefore costly method that requires species and biotope knowledge as well as the subsequent digitization of the data. In this study, this was solved by making the mapping part of a student internship. Due to the lack of routine, minor errors in data acquisition are to be expected here, which also depend on the respective skills of the mappers. It would be conceivable for cities to require biotope mapping of the planned area as well as surrounding areas for planned post-densification or major redevelopment projects. However, sufficient data is essential to allow green stocks to be considered in administrative and planning processes in the future, regardless of the size of the greenery and the efforts needed to map them. A key question is therefore how the time-consuming process of field mapping could be shortened or automated.
A recently published review provides an overview of the current status of various methods “for Quantifying and Estimating Urban Trees and Biomass” [77]. Characteristics of individual trees can be automatically captured by, e.g., urban forest models (e.g., i-tree ECO), machine learning techniques or street view images. Individual characteristics of the data collected in this study could also be automated. The UES-indicator shading (Figure 9) can be automatically derived from aerial images or using laser techniques. For example, the city of Zurich’s urban tree planning, legally enacted in 2022, uses LiDAR derived data to estimate the canopy cover over the entire city. One goal of the directive is to increase the city’s shading from the current 17% to 25% by 2050 [78]. More advanced laser techniques, such as full wave form laser scanners, could even be used to map certain biotope characteristics–accepting a higher inaccuracy of the resulting data. These scanners can penetrate the canopy of trees and measure the roughness of the surface beneath. Using the roughness, one can infer different types of surfaces (low roughness for sealed surfaces) and vegetation types (meadows/flowery beds from bushes with higher roughness) or manmade objects [79].
However, it must be kept in mind that in order to use each of these highly specialized techniques, appropriate equipment and expertise must be available for collection and analysis. In addition, the resulting data which are stored in different formats must ultimately be merged. In conclusion, a comprehensive methodology that can automatically capture all of the parameters collected in this work with sufficient accuracy is not yet known to the authors. Alternatively, the categorization of surface types can be conducted indirectly, e.g., by using administrative data on wastewater charges (no charges for unsealed areas) as has been carried out in a parallel study [37]. As in this study, an advantage of the indirect data-use over remote sensing data is a classification with exact area size and allocation. A disadvantage, compared to the method presented here, is a loss of information on the biotope type level that cannot yet be quantified.
As shown in Figure 2, trees provide the most and diverse UES. The four quantified indicators represent these UES as follows. Abundance includes all UES that are directly linked to the trees themselves, without quantifying them in more detail (i.e., low warming, cooling by shading or evaporation, biodiversity, habitat and food for animals, reducing noise, interception of rainwater, carbon storage). The indicator biodiversity/species diversity quantifies the UES “biodiversity” and indirectly also “habitat and food for animals” (both for the species specialized on specific species, as well as for ubiquists). The carbon storage indicator specifically quantifies this parameter, relevant for climate protection. The fourth indicator shading tackles the UES cooling by shading, where only the minimum shading is recorded due to the indicator. Other UES such as reducing noise, cooling by evapotranspiration, or interception of rainwater were not further quantified.
In this context, it should be noted that only in their totality or in their summation, the individual indicators reflect the true overall value of the trees. This means that the previously unquantified values must first be converted into indicators in order to be able to estimate the total value. Descriptions of the value of trees must therefore be regarded as gross underestimations of the true value if they include only individual aspects. The same is true, of course, for biotope types.

4.2. Methodological Considerations from an Administrative and Implementation-Oriented Perspective

From an administrative perspective, a major advantage of the selected data collection proved to be the use of a mapping standard used in local planning practice. This enables the use of standardized assessments, e.g., with a locally used eco score, and their further development, e.g., for use in models [37,68]. In addition, using the City’s basic GIS data allowed for the resulting biotope data to be directly integrated into the administrative GIS structure for land resource management. The indicator area shares, but also sealing level–which is based on the local classification of the civil engineering office-can therefore be directly integrated. In consultation with the local green space office, the following potential practical implementation fields of the developed indicators could be identified: Before-after observations for area developments, setting up target values and (worst-case) scenarios for the entire area, identification of suitable areas in development areas (e.g., for unsealing) or of green spaces worthy of protection (old trees, specific biotope types). Moreover, these results can be used as input information for formal as well as informal planning instruments, such as urban land use planning, master plans or green regulations. In combination with an assessment model, they have the potential to assist in supporting operational and tactical decision making within administrative and planning processes [37].
However, there are also clear limitations to the usability of the presented indicators in planning practice. First, even if the indicators are in principle consistent with local norms, they must first be accepted by all relevant departments and then embedded in the planning process. Second, indicators can only be used if they or their classification is standardized. Otherwise, the indicators will be considered as practical additional information, but they cannot be used directly in planning practice without further effort. Moreover, targeted usage would require further development of the indicators. For example, by developing an index integrating UES and UEDS or a decision support tool to show and evaluate interdependencies between UES, UEDS and other resources such as water, energy or material flows [80]. An example is provided by the GRID data-based multi-indicator approach of Grunewald et al. 2019. The latter allows the classification of cities according to their provision of green spaces. However, studies on the implementation of scientific results, either in terms of ecosystem services or climate adaptation, show that many obstacles still hinder or even prevent actual use in practice [35,46,81]. Nevertheless, there are also positive practical examples to be mentioned. Cities such as Zurich, which have a clear target for improved greening, are now using such indicators (tree canopy cover, here UES tree shade) to track compliance with their tree cover targets [78].

4.3. The Importance of Small-Scale Urban Greenery from an Environmental Perspective

Why biotope mapping in urban areas? This question was posed as early as 1999 by a pioneer of ecological urban research, but is now more relevant than ever. First, scientists are noticing a collapse in insect populations worldwide, closely linked to habitat loss and conversion to agricultural and forestry land [82,83]. Thus, should not green spaces and green elements in cities also be considered as potential refuges for insects in particular and biodiversity in general? The results of our study indicate that in terms of biodiversity, as well as the potential to serve as (stepping-stone) habitat for spontaneously emerging plants, insects and other animals, the backyards of the densified inner-city area are considered to be very valuable.
Moreover, both small, vegetated areas and trees have a positive effect on the local microclimate and are seen as important climate adaptation measures. There is a growing need for unsealed to multifunctional areas, for the retention of rainfall exceeding the sewer system’s limits due to increasing heavy rainfall events caused by climate change [84]. Additionally, there is a growing need for green infrastructure providing cooler sites at summer days and helping mitigate the overheating at night. Another very important aspect is the positive effect of seeing and experiencing urban greenery on the psyche and well-being of residents. Green backyards or city squares are an important part of the living environment of many city dwellers and visitors [16,33,85].
Biotope mapping can also be used for other concerns, provided that the underlying methodology is adapted to the concerns studied. For example, a study from Antalya mapped citywide largely natural biotopes on a large scale and evaluated them according to their sensitivity-as a basis for their protection in future urban management [86]. Using Salzburg as an example, a method was presented in 2014 for distinguishing between green and gray infrastructure at the site level and subsequently describing larger study areas using normative assessments [44]. This study is similar in principle to the logic of the study presented here, and offers the possibility to evaluate the supply and demand of UES of an area. In addition, methodological approaches exist that create (structure types) or use (tree cadaster) basic data in order to evaluate them with existing model software such as Envimet [87] or i-Tree eco [24].

4.4. Final Considerations

In contrast to the latter studies, the study presented here is (a) based on on-site mapping of biotopes, trees and relevant parameters and thus achieves a very high accuracy of the data (except for the tree data in the public area), (b) examines an entire urban area and combines both data of individual trees and area biotopes to develop stock and UES indicators and (c) distinguishes in the analysis between private and public areas to describe the situation of green and grey infrastructure for a dense urban district characterized by block developments. Local planning requires local, fine-grained data. Simultaneously, the situation of an entire district or even city and not just a single block should be assessed in pursuit of a holistic planning approach. However, due to the high effort of mapping, the type of data collection should also be selected with regard to the necessary granularity.
The comparison of private and public space here refers to accessibility, i.e., the user’s perspective. Alternatively, comparisons could also be made from an administrative viewpoint. For this, the private and public areas would only have to be examined separately according to ownership [65]. This investigation would reflect the potential for action by the city administration with regard to existing green infrastructure. Direct planning is only valid for public areas; in the case of private ownership, only indirect instruments such as subsidies or citizen information can be used to achieve intended changes.

5. Conclusions

Comprehensive biotope mapping is by no means a new method. The added value of this work clearly lies in the connection of the mapping with the common concept of ecosystem services, the development of simple descriptive indicators and the comparative assessment of an urban area. The detailed and comprehensive results illustrate some of the possibilities inherent in these data and are intended to demonstrate and emphasize the added value from an ecological planning perspective. The approach of conducting the time-consuming mapping through student internships would be a cost-effective approach that could be followed in other cities as well.
This study focused on a specific type of building structure. With the help of this method, building structure types of different cities could be examined, compared and characteristic values derived. It is also an open question how the building blocks differ from each other with regard to their green stock and which lessons can be learned from this. From the consideration of different degrees of sealing depending on the size of the building block, target values could be derived as to how much sealed area and of which quality is actually required. A relevant or agreed target value in urban planning and communication has not yet been determined.

Author Contributions

Conceptualization, D.B., T.L. and S.N.; Data curation, D.B. and A.K.; Formal analysis, D.B. and A.K.; Funding acquisition, S.N. and R.V.; Investigation, A.K.; Methodology, D.B., S.N., T.L. and R.B.; Project administration, R.V.; Supervision, S.N.; Visualization, D.B. and A.K.; Writing—original draft, D.B. and K.M.; Writing—review & editing, D.B., K.M., R.V., T.L. and E.N. All authors have read and agreed to the published version of the manuscript.

Funding

This research was funded by the German Federal Ministry of Education and Research (Bundesministerium für Bildung und Forschung—BMBF) grant number 033W111A and research project ’Namares’ in the funding program ’RES:Z—Ressourceneffiziente Stadtquartiere’. The BMBF is not responsible for results or recommendations stated by the authors.

Institutional Review Board Statement

Not applicable.

Informed Consent Statement

Not applicable.

Data Availability Statement

Not applicable.

Acknowledgments

We thank the City of Karlsruhe, especially the Environmental Protection and Occupational Safety Department, the Urban Planning Office, the Civil Engineering Office, and the Parks Office for supporting the research project ’Namares’. We would also like to thank the students of the Urban Ecology Internship 2020 for their high level of motivation and diligence, despite the comparatively high amount of work involved.

Conflicts of Interest

The authors declare no conflict of interest.

Appendix A

Table A1. Linking surface types and biotope types and depiction of the area shares per biotope type for the total area, the public and private space. * Block buildings as 3D objects are not counted as public or private areas. However, small buildings located in private backyards, such as sheds or garages, form a separate category within private areas (2.4% of total private area).
Surface TypeNo.Biotope TypeTotal AreaPublic Private
[m2]Area [m2]of Ground LevelArea [m2]of Ground Level
unsealedgreen area1group of trees2980-2980.2%
2bushes; shrubbery2364810.0%22841.3%
3hedges; row of shrubs21881500.1%20391.2%
4blackberry scrub 450-450.0%
5ruderal vegetation2500-2500.1%
6flower bed; border38381560.1%36822.1%
7ground cover planting10591450.1%9140.5%
8lawn455915050.9%30541.8%
9patchy treat vegetation5280-5280.3%
10ornamental lawn10,55612020.7%93545.4%
11kitchen garden24860-24861.4%
12ornamental garden5044220.0%50222.9%
13mixed garden type8120-8120.5%
ungreened14unpaved road or square1170-1170.1%
sealedbuilding15buildings *169,463 41192.4%
path/square16cobbled road or square57,64730,86417.8%26,78315.5%
17path/square with gravel, crushed stone52535870.3%46662.7%
road/square18completely sealed street or square70,25155,23831.9%15,0138.7%
element19small water bodies (well/pond)5254900.3%350.0%
element20grouted wall; natural stone wall3070-3070.2%
-21undefined986 9860.6%
342,69490,439 82,793

References

  1. United Nations. World Urbanization Prospects: The 2018 Revision; United Nations: New York, NY, USA, 2019. [Google Scholar]
  2. Rees, W.; Wackernagel, M. Urban Ecological Footprints: Why Cities Cannot be Sustainable—And Why They are a Key to Sustainability. In Urban Ecology: An International Perspective on the Interaction between Humans and Nature; Marzluff, J.M., Ed.; Springer: New York, NY, USA, 2008; pp. 537–555. ISBN 978-0-387-73411-8. [Google Scholar]
  3. Costanza, R.; d’Arge, R.; De Groot, R.; Farber, S.; Grasso, M.; Hannon, B.; Limburg, K.; Naeem, S.; O’Neill, R.V.; Paruelo, J.; et al. The value of the world’s ecosystem services and natural capital. Nature 1997, 387, 253–260. [Google Scholar] [CrossRef]
  4. Millennium Ecosystem Assessment. Ecosystems and Human Well-Being; Island Press: Washington, DC, USA, 2005; ISBN 1597260401. [Google Scholar]
  5. Dominati, E.; Patterson, M.; Mackay, A. A framework for classifying and quantifying the natural capital and ecosystem services of soils. Ecol. Econ. 2010, 69, 1858–1868. [Google Scholar] [CrossRef]
  6. Bastian, O.; Grunewald, K.; Syrbe, R.-U. Space and time aspects of ecosystem services, using the example of the EU Water Framework Directive. Int. J. Biodivers. Sci. Ecosyst. Serv. Manag. 2012, 8, 5–16. [Google Scholar] [CrossRef] [Green Version]
  7. Artmann, M.; Bastian, O.; Grunewald, K. Using the Concepts of Green Infrastructure and Ecosystem Services to Specify Leitbilder for Compact and Green Cities—The Example of the Landscape Plan of Dresden (Germany). Sustainability 2017, 9, 198. [Google Scholar] [CrossRef] [Green Version]
  8. Gerber, J.-D.; Hartmann, T.; Hengstermann, A. Instruments of Land Policy: Dealing with Scarcity of Land; Routledge: London, UK, 2018; ISBN 9781315511634. [Google Scholar]
  9. Jehling, M.; Schorcht, M.; Hartmann, T. Densification in suburban Germany: Approaching policy and space through concepts of justice. Town Plan. Rev. 2020, 91, 217–237. [Google Scholar] [CrossRef]
  10. Gaffin, S.R.; Rosenzweig, C.; Kong, A.Y.Y. Adapting to climate change through urban green infrastructure. Nat. Clim. Chang. 2012, 2, 704. [Google Scholar] [CrossRef]
  11. Bibri, S.E.; Krogstie, J.; Kärrholm, M. Compact city planning and development: Emerging practices and strategies for achieving the goals of sustainability. Dev. Built Environ. 2020, 4, 100021. [Google Scholar] [CrossRef]
  12. Artmann, M.; Inostroza, L.; Fan, P. Urban sprawl, compact urban development and green cities. How much do we know, how much do we agree? Ecol. Indic. 2019, 96, 3–9. [Google Scholar] [CrossRef]
  13. Goetzke, R.; Schlump, C.; Hoymann, J.; Beckmann, G.; Dosch, F. Flächenverbrauch, Flächenpotenziale und Trends 2030: Beiträge zum Siedlungsflächenmonitoring im Bundesgebiet; BBSR-Analysen Kompakt: Bonn, Germany, 2014; Available online: http://nbn-resolving.de/urn:nbn:de:101:1-2014093012519 (accessed on 15 June 2020).
  14. Brunner, J.; Cozens, P. ‘Where Have All the Trees Gone?’ Urban Consolidation and the Demise of Urban Vegetation: A Case Study from Western Australia. Plan. Pract. Res. 2013, 28, 231–255. [Google Scholar] [CrossRef]
  15. Dallimer, M.; Tang, Z.; Bibby, P.R.; Brindley, P.; Gaston, K.J.; Davies, Z.G. Temporal changes in greenspace in a highly urbanized region. Biol. Lett. 2011, 7, 763–766. [Google Scholar] [CrossRef]
  16. Reyes-Riveros, R.; Altamirano, A.; De la Barrera, F.; Rozas-Vásquez, D.; Vieli, L.; Meli, P. Linking public urban green spaces and human well-being: A systematic review. Urban For. Urban Green. 2021, 61, 127105. [Google Scholar] [CrossRef]
  17. Semeraro, T.; Scarano, A.; Buccolieri, R.; Santino, A.; Aarrevaara, E. Planning of Urban Green Spaces: An Ecological Perspective on Human Benefits. Land 2021, 10, 105. [Google Scholar] [CrossRef]
  18. Wolch, J.R.; Byrne, J.; Newell, J.P. Urban green space, public health, and environmental justice: The challenge of making cities ‘just green enough’. Landsc. Urban Plan. 2014, 125, 234–244. [Google Scholar] [CrossRef] [Green Version]
  19. Jiang, Y.; Zevenbergen, C.; Ma, Y. Urban pluvial flooding and stormwater management: A contemporary review of China’s challenges and “sponge cities” strategy. Environ. Sci. Policy 2018, 80, 132–143. [Google Scholar] [CrossRef]
  20. Zhou, B.; Rybski, D.; Kropp, J.P. The role of city size and urban form in the surface urban heat island. Sci. Rep. 2017, 7, 4791. [Google Scholar] [CrossRef]
  21. Saaroni, H.; Amorim, J.H.; Hiemstra, J.A.; Pearlmutter, D. Urban Green Infrastructure as a tool for urban heat mitigation: Survey of research methodologies and findings across different climatic regions. Urban Clim. 2018, 24, 94–110. [Google Scholar] [CrossRef]
  22. Gill, S.; Handley, J.; Ennos, A.; Pauleit, S. Adapting Cities for Climate Change: The Role of the Green Infrastructure. Built Environ. 2007, 33, 115–133. [Google Scholar] [CrossRef] [Green Version]
  23. Gulyás, Á.; Unger, J.; Matzarakis, A. Assessment of the microclimatic and human comfort conditions in a complex urban environment: Modelling and measurements. Build. Environ. 2006, 41, 1713–1722. [Google Scholar] [CrossRef]
  24. Scholz, T.; Hof, A.; Schmitt, T. Cooling Effects and Regulating Ecosystem Services Provided by Urban Trees—Novel Analysis Approaches Using Urban Tree Cadastre Data. Sustainability 2018, 10, 712. [Google Scholar] [CrossRef] [Green Version]
  25. Gómez-Baggethun, E.; Barton, D.N. Classifying and valuing ecosystem services for urban planning. Ecol. Econ. 2013, 86, 235–245. [Google Scholar] [CrossRef]
  26. Haase, D.; Larondelle, N.; Andersson, E.; Artmann, M.; Borgström, S.; Breuste, J.; Gomez-Baggethun, E.; Gren, Å.; Hamstead, Z.; Hansen, R.; et al. A quantitative review of urban ecosystem service assessments: Concepts, models, and implementation. Ambio 2014, 43, 413–433. [Google Scholar] [CrossRef] [Green Version]
  27. Kiese, N.; Mager, C. Urban Green and Open Spaces under Pressure: The Potential of Ecosystem Services Supply and Demand Analysis for Mediating Planning Processes in the Context of Climate Change. In Expanding Cities—Diminishing Space: Proceedings of the 23rd International Conference on Urban Planning, Regional Development and Information Society; Schrenk, M., Popovich, V.V., Zeile, P., Elisei, P., Beyer, C., Navratil, G., Eds.; CORP—Competence Center of Urban and Regional Planning: Schwechat, Austria, 2018; ISBN 978-3-9504173-5-7. [Google Scholar]
  28. Bolund, P.; Hunhammar, S. Ecosystem services in urban areas. Ecol. Econ. 1999, 29, 293–301. [Google Scholar] [CrossRef]
  29. Andersson-Sköld, Y.; Klingberg, J.; Gunnarsson, B.; Cullinane, K.; Gustafsson, I.; Hedblom, M.; Knez, I.; Lindberg, F.; Ode Sang, Å.; Pleijel, H.; et al. A framework for assessing urban greenery’s effects and valuing its ecosystem services. J. Environ. Manag. 2018, 205, 274–285. [Google Scholar] [CrossRef]
  30. Beichler, S.A.; Bastian, O.; Haase, D.; Heiland, S.; Kabisch, N.; Müller, F. Does the Ecosystem Service Concept Reach its Limits in Urban Environments? Landsc. Online 2017, 51, 1–21. [Google Scholar] [CrossRef] [Green Version]
  31. Luederitz, C.; Brink, E.; Gralla, F.; Hermelingmeier, V.; Meyer, M.; Niven, L.; Panzer, L.; Partelow, S.; Rau, A.-L.; Sasaki, R.; et al. A review of urban ecosystem services: Six key challenges for future research. Ecosyst. Serv. 2015, 14, 98–112. [Google Scholar] [CrossRef] [Green Version]
  32. Brzoska, P.; Spāģe, A. From City- to Site-Dimension: Assessing the Urban Ecosystem Services of Different Types of Green Infrastructure. Land 2020, 9, 150. [Google Scholar] [CrossRef]
  33. Park, J.; Kim, J.-H.; Lee, D.K.; Park, C.Y.; Jeong, S.G. The influence of small green space type and structure at the street level on urban heat island mitigation. Urban For. Urban Green. 2017, 21, 203–212. [Google Scholar] [CrossRef]
  34. Grunewald, K.; Richter, B.; Behnisch, M. Multi-Indicator Approach for Characterising Urban Green Space Provision at City and City-District Level in Germany. Int. J. Environ. Res. Public Health 2019, 16, 2300. [Google Scholar] [CrossRef] [Green Version]
  35. Niemelä, J.; Saarela, S.-R.; Söderman, T.; Kopperoinen, L.; Yli-Pelkonen, V.; Väre, S.; Kotze, D.J. Using the ecosystem services approach for better planning and conservation of urban green spaces: A Finland case study. Biodivers. Conserv. 2010, 19, 3225–3243. [Google Scholar] [CrossRef]
  36. Pristeri, G.; Peroni, F.; Pappalardo, S.E.; Codato, D.; Masi, A.; de Marchi, M. Whose Urban Green? Mapping and Classifying Public and Private Green Spaces in Padua for Spatial Planning Policies. IJGI 2021, 10, 538. [Google Scholar] [CrossRef]
  37. Naber, E.; Volk, R.; Mörmann, K.; Boehnke, D.; Lützkendorf, T.; Schultmann, F. Namares—A surface inventory and intervention assessment model for urban resource management. Sustainability 2022, 14, 8485. [Google Scholar] [CrossRef]
  38. De Groot, R.S.; Fisher, B.; Christie, M.; Aronson, J.; Braat, L.; Haines-Young, R.; Gowdy, J.; Maltby, E.; Neuville, A.; Polasky, S.; et al. Integrating the ecological and economic dimensions in biodiversity and ecosystem service valuation. In The Economics of Ecosystems and Biodiversity (TEEB): Ecological and Economic Foundations; Kumar, P., Ed.; Earthscan, Routledge: London, UK, 2010; pp. 9–40. ISBN 9781849712125. [Google Scholar]
  39. Potschin, M.B.; Haines-Young, R.H. Ecosystem services. Prog. Phys. Geogr. Earth Environ. 2011, 35, 575–594. [Google Scholar] [CrossRef]
  40. Gillner, S.; Vogt, J.; Tharang, A.; Dettmann, S.; Roloff, A. Role of street trees in mitigating effects of heat and drought at highly sealed urban sites. Landsc. Urban Plan. 2015, 143, 33–42. [Google Scholar] [CrossRef]
  41. Norton, B.A.; Coutts, A.M.; Livesley, S.J.; Harris, R.J.; Hunter, A.M.; Williams, N.S. Planning for cooler cities: A framework to prioritise green infrastructure to mitigate high temperatures in urban landscapes. Landsc. Urban Plan. 2015, 134, 127–138. [Google Scholar] [CrossRef]
  42. Konarska, J.; Uddling, J.; Holmer, B.; Lutz, M.; Lindberg, F.; Pleijel, H.; Thorsson, S. Transpiration of urban trees and its cooling effect in a high latitude city. Int. J. Biometeorol. 2016, 60, 159–172. [Google Scholar] [CrossRef]
  43. Boehnke, D. Exploring the Thermal Microcosms at the Forest Floor—A Case Study of a Temperate Forest. Atmosphere 2021, 12, 503. [Google Scholar] [CrossRef]
  44. Wurster, D.; Artmann, M. Development of a concept for non-monetary assessment of urban ecosystem services at the site level. Ambio 2014, 43, 454–465. [Google Scholar] [CrossRef] [Green Version]
  45. Kuttler, W. Climate change in urban areas. Part 2, Measures. Environ. Sci. Eur. 2011, 23, 1–15. [Google Scholar] [CrossRef] [Green Version]
  46. Vogt, J.; Boehnke, D.; Norra, S. Umsetzung der Kommunalen Klimaanpassung in die Bauleitplanung im Pilotprojekt der Entwicklung des Geländes der Spinelli Barracks/Grünzug Nordost in Mannheim: KomKlim; KLIMOPASS-reports 4500493328/23; State Institute for the Environment, Measurements and Nature Conservation Baden-Württemberg (LUBW): Karlsruhe, Germany, 2018. [Google Scholar]
  47. Cortinovis, C.; Geneletti, D. A framework to explore the effects of urban planning decisions on regulating ecosystem services in cities. Ecosyst. Serv. 2019, 38, 100946. [Google Scholar] [CrossRef]
  48. Derkzen, M.L.; van Teeffelen, A.J.A.; Verburg, P.H. Review: Quantifying urban ecosystem services based on high-resolution data of urban green space: An assessment for Rotterdam, the Netherlands. J. Appl. Ecol. 2015, 52, 1020–1032. [Google Scholar] [CrossRef]
  49. Ziter, C. The biodiversity–ecosystem service relationship in urban areas: A quantitative review. Oikos 2016, 125, 761–768. [Google Scholar] [CrossRef]
  50. United Nations. SDG Indicators: Global Indicator Framework for the Sustainable Development Goals and Targets of the 2030 Agenda for Sustainable Development. Available online: https://unstats.un.org/sdgs/indicators/indicators-list/ (accessed on 30 March 2022).
  51. European Commission. EU SDG Indicator Set 2021: Result of the Review in Preparation of the 2021 Edition of the EU SDG Monitoring Report. 2021. Available online: https://ec.europa.eu/eurostat/documents/276524/12239692/SDG_indicator_set_2021.pdf (accessed on 30 March 2022).
  52. Destatis. Nachhaltigkeitsstrategien der Bundesländer: Nachhaltigkeitsindikatoren; Statistisches Bundesamt: Bonn, Germany, 2022.
  53. Bundesamt für Bauwesen und Raumordnung. INKAR—Indikatoren und Karten zur Raum- und Stadtentwicklung. Available online: https://www.bbsr.bund.de/BBSR/DE/forschung/raumbeobachtung/InteraktiveAnwendungen/INKAR/inkar_online.html (accessed on 3 December 2019).
  54. Boehnke, D.; Jerutka, K. Stadtplätze: Zur Bewertung der Aufenthaltsqualität von urbanen Räumen/City squares: On the evaluation of the quality of stay in urban spaces. STADT Und RAUM 2020, 6, 330–335. [Google Scholar]
  55. FMBW. Leitfaden zur Verkehrssicherheit—Baumkontrolle; Ministerium für Finanzen Baden-Württemberg: Stuttgart, Germany, 2018.
  56. Nielsen, A.B.; Östberg, J.; Delshammar, T. Review of Urban Tree Inventory Methods Used to Collect Data at Single-Tree Level. Arboric. Urban For. 2014, 40, 96–111. [Google Scholar] [CrossRef]
  57. Bosch, M. Bäume—Am Blatt Erkennen: 64 Laub- und Nadelbäume; Kosmos: Stuttgart, Germany, 2017; ISBN 3-440-15264-2. [Google Scholar]
  58. McPhearson, T.; Kremer, P.; Hamstead, Z.A. Mapping ecosystem services in New York City: Applying a social–ecological approach in urban vacant land. Ecosyst. Serv. 2013, 5, 11–26. [Google Scholar] [CrossRef]
  59. De Valck, J.; Beames, A.; Liekens, I.; Bettens, M.; Seuntjens, P.; Broekx, S. Valuing urban ecosystem services in sustainable brownfield redevelopment. Ecosyst. Serv. 2019, 35, 139–149. [Google Scholar] [CrossRef]
  60. Takács, Á.; Kiss, M.; Hof, A.; Tanács, E.; Gulyás, Á.; Kántor, N. Microclimate Modification by Urban Shade Trees—An Integrated Approach to Aid Ecosystem Service Based Decision-making. Procedia Environ. Sci. 2016, 32, 97–109. [Google Scholar] [CrossRef] [Green Version]
  61. Marando, F.; Salvatori, E.; Sebastiani, A.; Fusaro, L.; Manes, F. Regulating Ecosystem Services and Green Infrastructure: Assessment of Urban Heat Island effect mitigation in the municipality of Rome, Italy. Ecol. Model. 2019, 392, 92–102. [Google Scholar] [CrossRef]
  62. Laureti, F.; Martinelli, L.; Battisti, A. Assessment and Mitigation Strategies to Counteract Overheating in Urban Historical Areas in Rome. Climate 2018, 6, 18. [Google Scholar] [CrossRef] [Green Version]
  63. Müller, N.; Hecht, R.; Buchholz, S. Bebauungsstrukturklassifikation NRW –Grundlage für Klimamodellsimulationen. In Flächennutzungsmonitoring IX: Nachhaltigkeit der Siedlungs- und Verkehrsentwicklung? 9. Dresdner Flächennutzungssymposium (DFNS) am 3. und 4. Mai 2017; Meinel, G., Schumacher, U., Schwarz, S., Richter, B., Eds.; Rhombos-Verlag: Berlin, Germany, 2017; ISBN 978-3-944101-73-6. [Google Scholar]
  64. Klimprax Stadtklima. Anforderungen an die Berücksichtigung Klimarelevanter Belange in Kommunalen Planungsprozessen: Leitfaden für Kommunen; Hessisches Landesamt für Naturschutz, Umwelt und Geologie: Darmstadt, Germany, 2016. [Google Scholar]
  65. Volk, R.; Naber, E.; Lützkendorf, T.; Boehnke, D.; Mörmann, K.; Schultmann, F.; Norra, S. Identifikation und Bewertung von Entsiegelungspotenzialen als Beitrag zur nachhaltigen Quartiersentwicklung—Zwischenergebnisse aus NaMaRes. In Flächennutzungsmonitoring XIII; Leibniz-Institut für ökologische Raumentwicklung: Dresden, Germany, 2021. [Google Scholar]
  66. DiGiovanni, K.; Montalto, F.; Gaffin, S. A comparative analysis of micrometeorological determinants of evapotranspiration rates within a heterogeneous urban environment. J. Hydrol. 2018, 562, 223–243. [Google Scholar] [CrossRef]
  67. Breunig, T. Verfeinertes Biotopbewertungsverfahren der Stadt Karlsruhe; Stadt Karlsruhe: Karlsruhe, Germany, 2017. [Google Scholar]
  68. Böhnke, D.; Volk, R.; Lützkendorf, T.; Naber, E.; Krehl, A.; Becker, R.; Norra, S. Grünbestände in privaten Innenhöfen und deren Ökosystemleistungen im Stadtquartier: Erkenntnisse einer quartiersweiten Erhebung in Karlsruhe. In Flächennutzungsmonitoring XIII; Behnisch, M., Krüger, T., Ehrhardt, D., Meinel, G., Eds.; Rhombos Verlag: Berlin, Germany, 2021. [Google Scholar]
  69. LUBW. Arten, Biotope, Landschaft: Schlüssel zum Erfassen, Beschreiben, Bewerten; LUBW Landesanstalt für Umwelt Baden-Württemberg: Karlsruhe, Germany, 2018. [Google Scholar]
  70. Ayanu, Y.Z.; Conrad, C.; Nauss, T.; Wegmann, M.; Koellner, T. Quantifying and mapping ecosystem services supplies and demands: A review of remote sensing applications. Environ. Sci. Technol. 2012, 46, 8529–8541. [Google Scholar] [CrossRef]
  71. Frick, A.; Tervooren, S. A Framework for the Long-term Monitoring of Urban Green Volume Based on Multi-temporal and Multi-sensoral Remote Sensing Data. J. Geovisualization Spat. Anal. 2019, 3, 1–11. [Google Scholar] [CrossRef]
  72. Chen, Y.; Weng, Q.; Tang, L.; Liu, Q.; Zhang, X.; Bilal, M. Automatic mapping of urban green spaces using a geospatial neural network. GIScience Remote Sens. 2021, 58, 624–642. [Google Scholar] [CrossRef]
  73. Dare, P.M. Shadow Analysis in High-Resolution Satellite Imagery of Urban Areas. Photogramm. Eng. Remote Sens. 2005, 71, 169–177. [Google Scholar] [CrossRef] [Green Version]
  74. Werner, P. Why biotope mapping in populated areas. In Biotope Mapping in the Urban Environment; Reumer, J., Epe, M.J., Eds.; DEINSEA: Rotterdam, The Netherlands, 1999. [Google Scholar]
  75. Bochow, M.; Peisker, T.; Roessner, S.; Segl, K.; Kaufmann, H. Towards an Automated Update of Urban Biotope Maps Using Remote Sensing Data: What is Possible. In Urban Biodiversity and Design; Müller, N., Werner, P., Kelcey, J.G., Eds.; Wiley-Blackwell: Hoboken, NJ, USA, 2010; pp. 255–273. ISBN 1444332678. [Google Scholar]
  76. Sukopp, H. Urban Ecology—Scientific and Practical Aspects. In Urban Ecology; Feldmann, H., Uhlmann, O., Eds.; Springer: Berlin/Heidelberg, Germany; New York, NY, USA, 1998; pp. 3–16. ISBN 978-3-642-88585-3. [Google Scholar]
  77. Yang, M.; Zhou, X.; Liu, Z.; Li, P.; Tang, J.; Xie, B.; Peng, C. A Review of General Methods for Quantifying and Estimating Urban Trees and Biomass. Forests 2022, 13, 616. [Google Scholar] [CrossRef]
  78. City of Zurich, Civil Engineering and Waste Disposal Department. More Trees for the City of Zurich (Press Release). Available online: https://www.stadt-zuerich.ch/ted/de/index/departement/medien/medienmitteilungen/2022/januar/220120a.html (accessed on 3 July 2022).
  79. Weinmann, M.; Weinmann, M.; Mallet, C.; Brédif, M. A Classification-Segmentation Framework for the Detection of Individual Trees in Dense MMS Point Cloud Data Acquired in Urban Areas. Remote Sens. 2017, 9, 277. [Google Scholar] [CrossRef] [Green Version]
  80. Bennett, E.M.; Peterson, G.D.; Gordon, L.J. Understanding relationships among multiple ecosystem services. Ecol. Lett. 2009, 12, 1394–1404. [Google Scholar] [CrossRef]
  81. Eisenack, K.; Moser, S.C.; Hoffmann, E.; Klein, R.J.T.; Oberlack, C.; Pechan, A.; Rotter, M.; Termeer, C.J.A.M. Explaining and overcoming barriers to climate change adaptation. Nat. Clim. Chang. 2014, 4, 867–872. [Google Scholar] [CrossRef]
  82. Hallmann, C.A.; Sorg, M.; Jongejans, E.; Siepel, H.; Hofland, N.; Schwan, H.; Stenmans, W.; Müller, A.; Sumser, H.; Hörren, T.; et al. More than 75 percent decline over 27 years in total flying insect biomass in protected areas. PLoS ONE 2017, 12, e0185809. [Google Scholar] [CrossRef] [Green Version]
  83. Goulson, D. The insect apocalypse, and why it matters. Curr. Biol. 2019, 29, R967–R971. [Google Scholar] [CrossRef]
  84. Hansen, R.; Olafsson, A.S.; van der Jagt, A.P.; Rall, E.; Pauleit, S. Planning multifunctional green infrastructure for compact cities: What is the state of practice? Ecol. Indic. 2019, 96, 99–110. [Google Scholar] [CrossRef]
  85. Breuste, J.; Schnellinger, J.; Qureshi, S.; Faggi, A. Urban Ecosystem services on the local level: Urban green spaces as providers. Ekologia 2013, 32, 283. [Google Scholar] [CrossRef] [Green Version]
  86. Mansuroglu, S.; Ortacesme, V.; Karaguzel, O. Biotope mapping in an urban environment and its implications for urban management in Turkey. J. Environ. Manage. 2006, 81, 175–187. [Google Scholar] [CrossRef] [PubMed]
  87. Lehmann, I.; Mathey, J.; Rößler, S.; Bräuer, A.; Goldberg, V. Urban vegetation structure types as a methodological approach for identifying ecosystem services—Application to the analysis of micro-climatic effects. Ecol. Indic. 2014, 42, 58–72. [Google Scholar] [CrossRef]
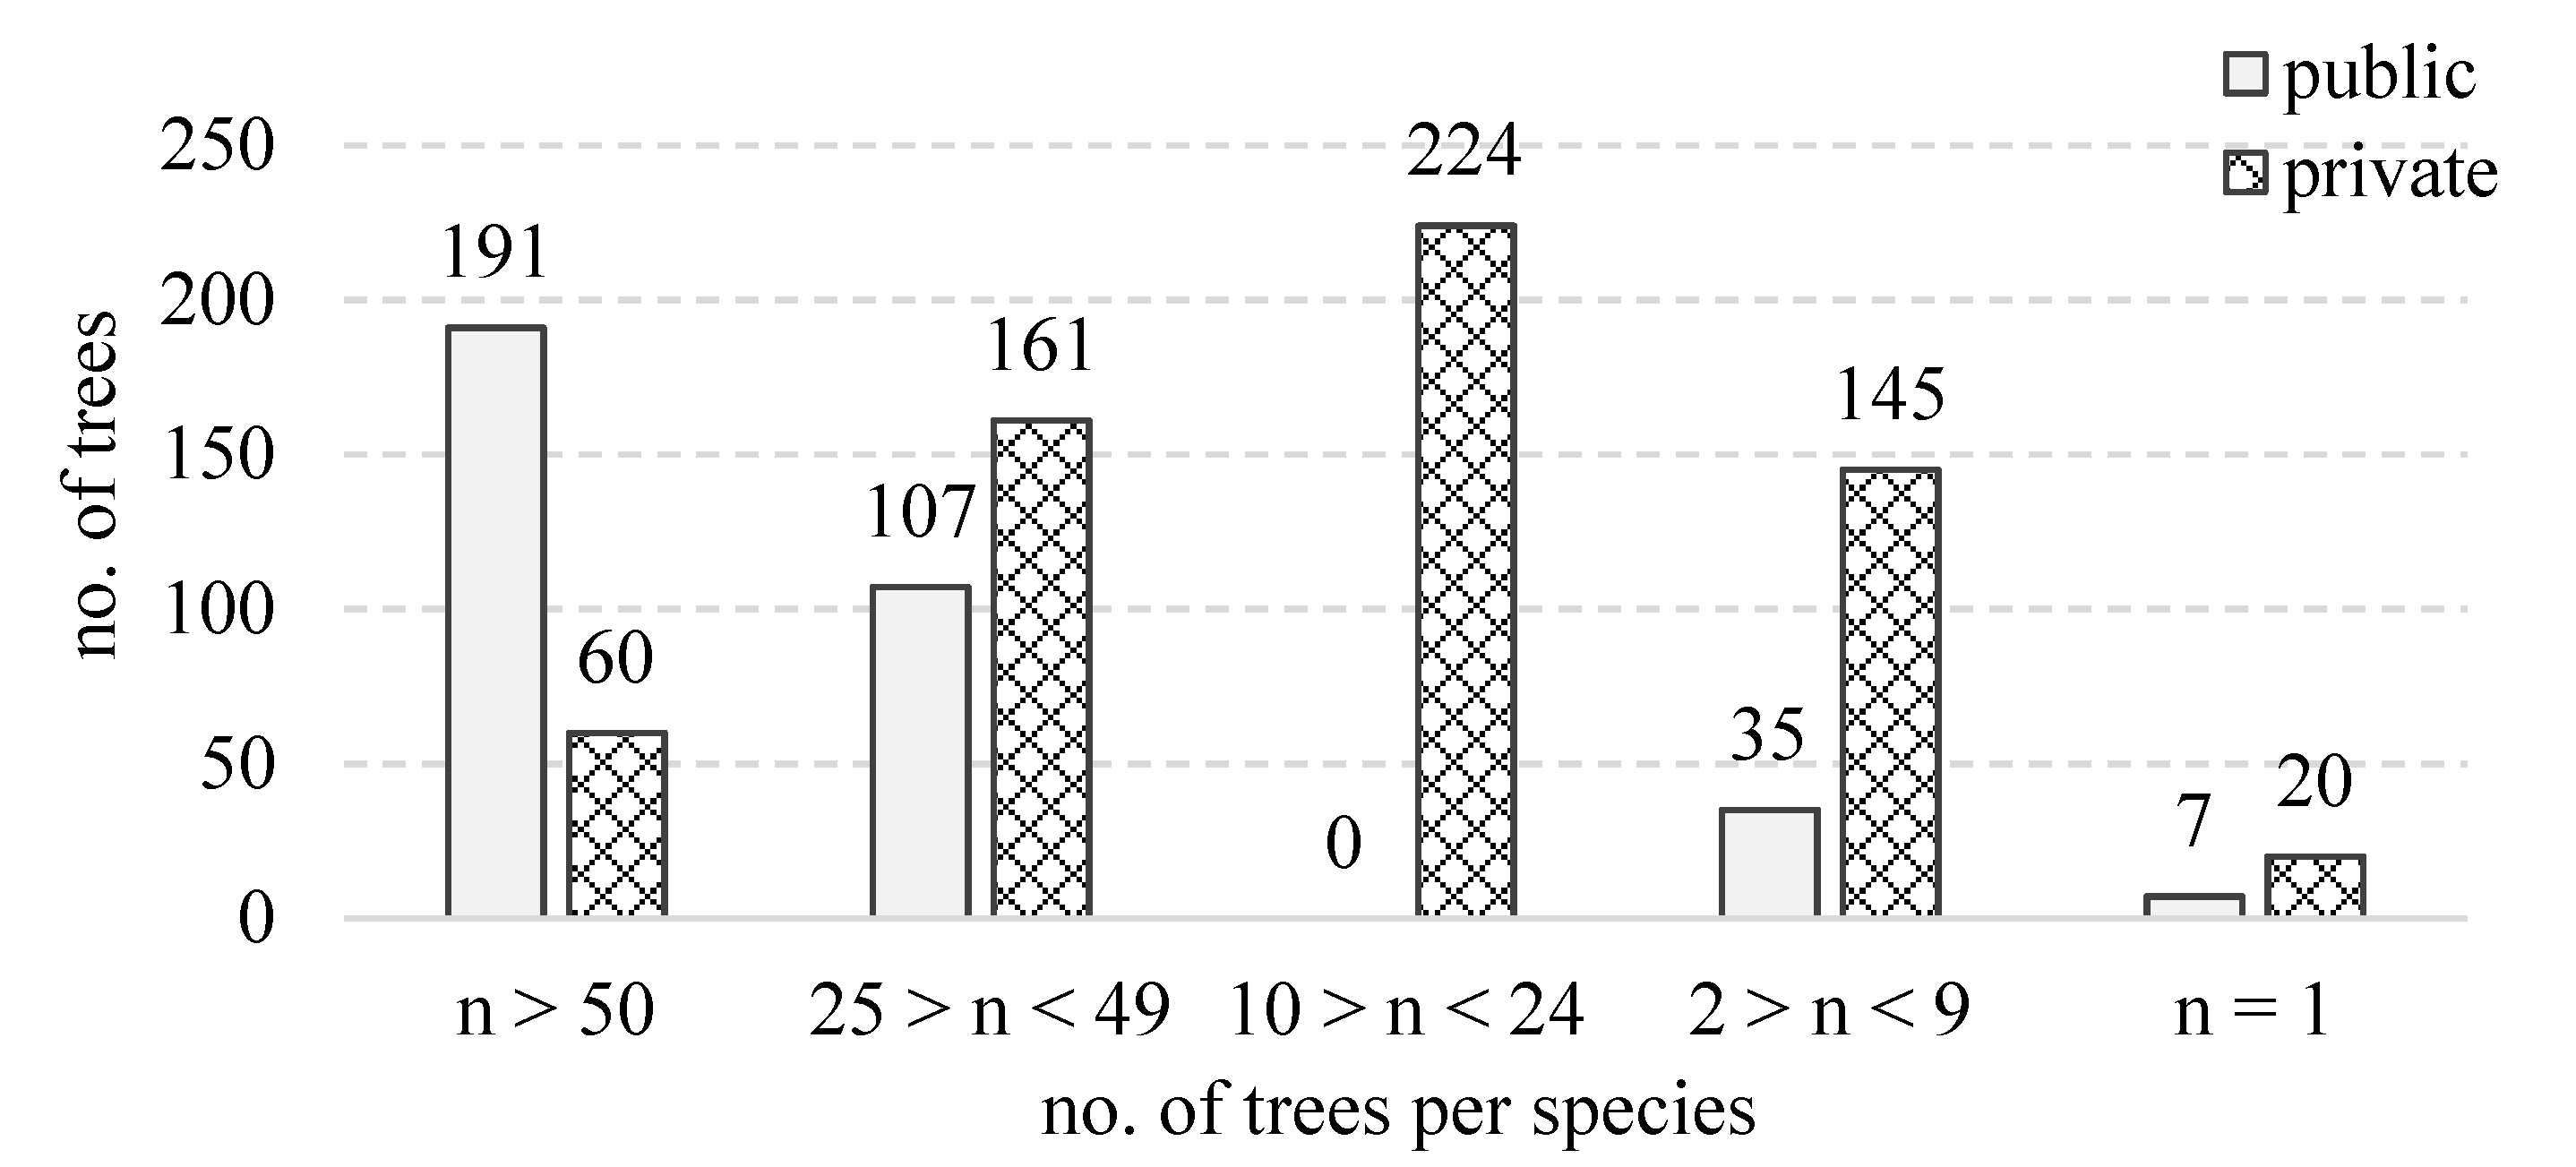
Figure 1. The methodology used in this study combines (a) an area approach with the classification of urban space into surface types (gray box) with (b) the ecosystem service cascade model (green box) which was initially proposed by De Groot et al. 2010 [38] and Potschin and Haynes-Young 2011 [39].
Sustainability 14 09029 g001
Figure 2. From a surface-based approach to ecosystem services. The graphic illustrates the concept of connecting urban surface types and trees with their functions/effects (+ green), potential for functions/effects (+ blue) and malfunctions/negative effects (− red). These functions form the basis for all UES (compare Figure 1), i.e., the more positive functions a surface type fulfills, the greater its benefit for climate adaptation or biodiversity or, on contrary, the more malfunctions the greater its negative effects. The term “function” goes back to the cascade model of UES and describes (ecological) processes that originate from the biophysical structures (here: surface types) [31,38,39]. Functions listed are taken from current literature [28,47,48,49].
Sustainability 14 09029 g002
Figure 3. Methodological framework of this study, showing data collection, the resulting GIS-based dataset and the indicators developed from this. Indicators are specifically described in Section 2.2.1 and Section 2.2.2. * parameters: tree species, height, size, breast height diameter and crown diameter.
Sustainability 14 09029 g003
Figure 4. Overview of the inner-city district studied, and the types of areas identified.
Sustainability 14 09029 g004
Figure 5. Examination of the surface types and biotope types of the ground level surface differentiated into public and private space.
Sustainability 14 09029 g005
Figure 6. Depiction of the stock indicator sealing and the UES indicators evapotranspiration and habitat potential, considered over all surface types (left side) and only for the surface type “green area” (right side).
Sustainability 14 09029 g006
Figure 7. Overview of the locations (map) and number (map and column chart) of urban trees in the study area. In addition, the distribution of the growth parameters crown diameter, BHD and height are shown, separated by the location of the tree in the public or private area (boxplots). Purple line = boundary of the study area; x in boxplot = medium value; ° in boxplot = statistical outliers.
Sustainability 14 09029 g007
Figure 8. Visualization of the distribution of the number of trees per species, differentiated according to public and private area.
Sustainability 14 09029 g008
Figure 9. Overview of the canopy footprint of trees located in private areas across the city district (map) and the categorization of these trees according to the size of their minimum shading (column chart). Purple line = boundary of the study area.
Sustainability 14 09029 g009
Table 2. Characteristics of tree species distribution in the public and private area.
Tree StockPublic AreaPrivate Area
number of species2075
species with 1 individual only7 (35%)20 (27%)
no. of 6 most abundant species289 (88%)243 (40%)
rank 1Platanus spec. (n = 76)Ailanthus altissima (n = 60)
rank 2Acer campestre (n = 64)Taxus spec. (n = 48)
rank 3Acer platanoides (n = 51)Prunus serrulata (n = 45)
rank 4Corylus colurna (n = 49)Carpinus betulus (n = 41)
rank 5Robinia pseudoacacia (n = 31)Acer campestre (n = 27)
rank 6Castanea sativa (n = 27)Aesculus rubicunda (n = 22)
Publisher’s Note: MDPI stays neutral with regard to jurisdictional claims in published maps and institutional affiliations.

