Article

China’s Low-Carbon Cities Pilot Promotes Sustainable Carbon Emission Reduction: Evidence from Quasi-Natural Experiments

1
Comprehensive Service Branch, State Grid Zhejiang Electric Power Co., Ltd., Hangzhou 310000, China
2
School of Management, China University of Mining and Technology, Xuzhou 221116, China
3
School of Management and Economics, Beijing Institute of Technology, Beijing 100081, China
*
Author to whom correspondence should be addressed.
Sustainability 2022, 14(15), 8996; https://doi.org/10.3390/su14158996
Submission received: 1 June 2022 / Revised: 30 June 2022 / Accepted: 20 July 2022 / Published: 22 July 2022
(This article belongs to the Special Issue Environmental Impact Assessment and Green Energy Economy)

Abstract

:
Cities are critical agents to promote carbon emission reduction, and are also a key part of China achieving carbon peaking by 2030 and carbon neutrality by 2060. This study used a time-varying difference-in-difference (DID) method to provide quasi-natural experimental evidence based on the data of 284 prefecture-level cities in China. We robustly found that the low-carbon city pilot (LCCP) policy has a significant effect on carbon emissions’ reduction. The carbon emissions of pilot cities were reduced by about 1.63 percentage points compared to non-pilot cities. In addition, this study generates several intriguing findings: (1) The carbon emission reduction effect of the LCCP is more significant for cities in the eastern areas and cities with high economic development. (2) The LCCP policy is sustainable and has a lagging effect. The carbon emissions of pilot areas with one lag period and two lag periods were reduced by 1.76% and 1.90%, respectively, which means that the LCCP led to greater carbon reductions over time. (3) We prove the existence of the mediating effect of electricity consumption. The LCCP policy reduced carbon emissions by 3.72% by affecting per capita electricity consumption. (4) Cities in a state of negative decoupling between carbon emissions and economic growth gradually transformed into a state of enhanced decoupling, which shows that the carbon emissions of low-carbon pilot cities were effectively controlled with the economic growth. The conclusion of this study evaluates the current achievements of the LCCP policy and provides an empirical reference for the further formulation of environmental policies.

1. Introduction

Humanity faces the challenge of climate change, and the resulting increasing concentrations of greenhouse gases have forced humans to be simultaneously exposed to multiple risks, such as retarded economic development, climate anomalies, rising sea levels, retreating glaciers, thawing permafrost, and unstable food supplies [1,2]. In 2019, China accounted for 29.5% of global carbon emissions, making it the largest emitter. China has formulated future development plans to incorporate carbon emission reduction targets [3,4], and proposed that carbon emissions will peak by 2030 and become carbon neutral by 2060. In the early years, China launched the low-carbon city pilot (LCCP) policy to actively face climate change. The Chinese government announced three batches of low-carbon pilot regions in 2010, 2012, and 2017 respectively, and aims to advocate a sustainable energy ecosystem for low-carbon production and consumption, build a resource-saving and environmentally-friendly society, and reduce carbon emission intensity. We observe that environmental pollution and economic development restrict the sustainable development of humanity, so it is necessary to pay attention to the relationship between cities’ activities and carbon emissions together. Thus, it is critical to accurately assess the effect of LCCP policies on carbon emission reductions, especially the heterogeneous effects among cities with different geographic locations and economic development.
Cities are the core of human survival and social development, and are also major sources of carbon emissions [5,6], accounting for about 70% of total carbon emissions [7]. The efforts of cities on carbon emission reduction will affect the realization of China’s sustainable development goals [8]. With the development of China’s urbanization, infrastructure construction, industrial activities, transportation, and residents’ lives consume a lot of energy, and cities will become one of the most important areas of carbon emission growth [9]. Scholars have shown great interest and attention to this field. Increasing studies have established diverse evaluation indicators of LCCP and evaluated the construction results of the low-carbon city pilot policy from different dimensions. Du et al. (2011) constructed a low-carbon city evaluation index system, including transportation, industry, consumption, energy, policy, and technology [10]. The indicators include per capita carbon emissions, the proportion of zero-carbon energy in primary energy, proportion of coal in total energy consumption, and unit emissions [11,12]. However, there is no unified definition of the evaluation system. The environmental governance in different cities is analyzed according to different evaluation indicators, and the conclusions are quite different.
While reducing carbon emissions is gaining popularity in China, accurately assessing the contribution of the LCCP policy to environmental governance has been widely studied by scholars. Yang et al. (2013) summarized the driving forces of low-carbon city development in China and discussed the environmental regulatory policy tools aimed at improving energy efficiency, utilizing renewable energy, adjusting industrial structure, and improving carbon sequestration capacity [13]. Wang et al. (2015) summed up the practical experience of Zhenjiang city, Jiangsu province, in achieving low-carbon goals through LCCP based on low-carbon development plans and government reports [14]. Cheng et al. (2019) used green total factor productivity to evaluate the policy effects of low-carbon pilot policy in China [15]. Cities located in different regions, with different population sizes, economic development, and industrial structure characteristics have adopted different low-carbon development paths. For example, Yang et al. (2018) analyzed the implementation of the LCCP policy in cities such as Beijing, Jincheng, Chizhou, and Guangyuan [16]. Su et al. (2016) summarized the government’s efforts for low-carbon city construction from the aspects of strategic planning, energy structure, industrial structure, ecological environment, transportation, and buildings [17]. Shen et al. (2018) [18] and Feng et al. (2019) [19] took Beijing and Guangdong province as examples to analyze the key elements, patterns, and paths of urban carbon emissions. They found that population size, the industry ratio, and new energy ratio are key factors affecting carbon emissions, but the contribution of these factors to carbon emissions varies by geographic location and level of economic development.
Many scholars estimated the effects of the LCCP policy through synthetic control methods [20,21], the spatial Durbin model [22], data envelopment analysis [23], or the difference-in-difference method [24,25]. The comprehensive control method is often used as a case study, limited by the small subject size. In addition, assigning weights to potential pilot cities may lead to errors [26], and related issues also generally face the endogeneity problem of environmental regulation [21,27,28]. Another common approach, named difference-in-difference (DID), mitigates possible endogeneity problems and guarantees accuracy in identifying real policy effects by treating the policy as an exogenous shock variable, which is independent of the outcome variable [29]. Most studies concluded that China’s LCCP policy has achieved remarkable results, which can not only effectively improve urban ecological efficiency, but also promote the green economic growth. Song et al. (2019) found that the construction of low-carbon cities can significantly reduce PM10 and air pollution index (API), and improve urban air quality [30]. Cheng et al. (2019) found that low-carbon city construction significantly improves green total factor productivity [15]. Different from the above literature focusing on environmental quality indicators, Gong et al. (2019) took foreign direct investment as the object and found that LCCP significantly drives foreign direct investment [31]. We summarize the above literature and categorize them in Table 1.
To sum up, recent studies have mainly focused on the impact of the LCCP policy on environmental indicators, while ignoring the per capita carbon emissions indicator that relates to the size of the city. Furthermore, in-depth studies of heterogeneity between cities are lacking in previous research. Most studies provide static results rather than the possible dynamic effects of the LCCP policy. Considering the above gaps will help us to clarify the relationship between the LCCP policy and carbon emissions, and to re-evaluate the environmental regulation effect of the LCCP policy. There are three possible contributions of this study. First, from a research perspective, this study focuses on evaluating the effects of the LCCP policy on carbon emission reductions. In addition, this study enriches and complements the literature on the heterogeneous effects of the LCCP policy across cities with different geographic locations and economic development. In particular, we provide evidence that the LCCP policy has sustainable effects, with lag and cumulative effects over time. Second, from the methodological perspective, the pervasive difficulty in estimating the impact of policy implementation on goals is endogeneity problems. Considering the phased rollout of China’s LCCP policy, we used the time-varying DID method to analyze policy effects by mitigating the adverse effects of measurement errors and omitted variables on empirical findings. Third, we further analyzed the impact mechanism of the LCCP policy on carbon emissions. We used the Tapio model to estimate decoupling elasticity coefficients for pilot cities and provide evidence that carbon emissions are effectively controlled as economies grow. In addition, the mechanism analysis proves the existence of the mediating effect of electricity consumption. The results illustrate the necessity of reducing electricity consumption or decarbonizing electricity.

2. Study Design

2.1. Policy Background

In order to mitigate climate change and reduce carbon dioxide emissions effectively, in 2010, the NDRC of China issued the low-carbon pilot cities policy. The first batch of pilots covered 5 provinces and 8 cities. In 2012, the second batch of pilots conducted in 1 province and 29 cities. The third batch of pilots in 2017 covered 45 cities. According to the list of pilot cities and the available data samples, we found that there are the 284 prefecture-level city samples, marked by 123 pilot cities, accounting for 43.3% (including 67 provincial-level pilot cities). There are 161 non-pilot cities, accounting for 56.7%. It is worth noting that there is overlap between the pilot lists of the first and second batches; that is, although some cities are in the second batch of pilot cities, the provinces where they are located have been announced in the first batch of pilot lists. This article refers to Song et al. (2019): if a province and its municipalities are in the LCCP policy list, the implementation time is determined as the earlier one [30]. In addition, the second batch of pilot cities was issued on 26 November 2012. Envisioning that there may have been a lag in government action to respond to policy, this study defines the implementation time as 2013.
Figure 1 plots the trend of the annual average carbon emissions and the logarithm of carbon emissions from 2000 to 2016 for pilot and non-pilot cities. Since 2000, the overall carbon emission level of almost all cities has shown an upward state, which illustrates that carbon emissions are still increasing. In addition, the carbon emissions of pilot cities are higher than those of non-pilot cities. After the LCCP was released, the rising trend of carbon emissions in the first round flattened, and the carbon emissions in the second round showed a downward trend. This provides visual evidence of the effectiveness of LCCP in reducing carbon emissions.

2.2. Variable Selection

This paper used panel data composed of 285 cities in China from 2000 to 2016 to estimate the impact of LCCP policies on carbon emissions. The data used are from China City Statistical Yearbook, China Urban Construction Statistical Yearbook, and China Statistical Yearbook.
Carbon emission. The carbon emission data were obtained from the calculation results of Shan et al. [32,33], which includes the carbon emission data of 353 cities from 1997 to 2017.
Low-carbon city pilot. This core variable is defined as 1 when a city is on the pilot list, and 0 for otherwise. Due to the limitation of carbon emission data, the sample in this study is up to 2016.
Other variables. This study controls the following variables referring to related studies [27,34,35,36,37,38,39], such as Gross Domestic Product (GDP) and its squared term, industrial structure, population density, financial development, electricity consumption, comprehensive utilization rate of general industrial solid waste, park green space, etc. The definitions and descriptive statistics of variables are shown in Table 2.
We calculated the correlation matrix between variables, as shown in Table 3. The results shows that carbon emission indicators have strong correlations with GDP, electricity consumption, and industrial structure, which illustrates the necessity to control for these variables to identify the net effect of LCCP.

2.3. Benchmark Model Setting

We adopted a difference-in-difference (DID) method to identify the impact of LCCP policies on carbon emissions. We compared the differences in carbon emissions between pilot and non-pilot areas before and after the LCCP, and effectively separated the differences from cities and years by controlling for individual fixed effects and time fixed effects. This paper sets the following measurement model
Y i t = β 0 + β 1 L C a r b o n i t + γ X i t + λ i + ν t + δ P r o v i n c e p t + ε i t
Among them, Y i t represents the carbon emission of city i in year t , which is expressed by the logarithm of carbon dioxide emissions ( lnCO 2 ) and the per capita carbon dioxide emissions ( lnCO 2 _ p ), respectively. LCarbon it indicates the LCCP cities, reflecting the value of 1 for cities that started the policy in year t , and 0 for otherwise. λ i represents city fixed effect and ν t represents year fixed effect. P r o v i n c e p t indicates the time trend of the province to control the time trend of different provinces. ε i t represents the random error term and is clustered at the city level. β 1 is the most interest difference-in-difference statistical parameter in this study, which captures the impact of LCCP policy on carbon emissions. If β 1 < 0 and significant, it means that the LCCP significantly promotes carbon emissions’ reduction, highlighting the effectiveness of the policy.

3. Empirical Analysis

3.1. Benchmark Regression

Table 4 provides the benchmark regression results of the model (1). We used the logarithm of carbon emissions and the logarithm of carbon emissions per capita as dependent variables, respectively. Among them, columns (1) and (4), (2) and (5), and (3) and (6) are the estimation results of all cities, municipalities, and prefecture-level cities excluding municipalities, respectively. The results found that the estimated coefficient of the LCCP was significantly negative (Coef. = −0.0163, p = 0.008) after controlling for the city fixed effect, time fixed effect, and provincial time trend, indicating that the LCCP policy was generally helpful to reduce carbon emissions. The carbon emissions of pilot cities reduced by an average of 1.63% compared with non-pilot cities. This result is consistent with previous research conclusions [15,23,29]. LCCP policies have a greater impact on per capita carbon emissions. Compared with non-pilot cities, per capita carbon emissions in low-carbon pilot cities reduced by an average of 3.74%. It is important to note that the LCCP policy started in 2010, so the estimated coefficients of the baseline model collectively capture about seven years of average treatment effects. In addition, for the municipalities (Beijing, Shanghai, Tianjin, Chongqing), the LCCP policy had a more significant impact on carbon emissions’ reduction (Coef. = −0.1061, p = 0.007). This is consistent with the research in [10,30] that shows the significant effects of LCCP policy on carbon emissions’ reduction in economically developed regions.

3.2. Heterogeneity Analysis

Cities have large differences in their geographic environments, economic scale, and future strategies, which may lead to different responses to the LCCP policy in different cities. Therefore, this study further estimates the heterogeneity differences in the effect of the LCCP policy on carbon emissions. First, the sample cities were divided into four sub-samples, northeast, east, central, and west according to their geographic locations. Second, according to their per capita GDP, the bottom one-third cities were categorized as low economic development (LED), the next one-third were categorized as middle economic development (MED), and the top one-third were categorized as high economic development (HED).
Table 5 shows that the carbon emission reduction effect of the LCCP is more significant for cities in the eastern region (Coef. = −0.0175, p = 0.011) and cities with high economic development levels (Coef. = −0.0240, p = 0.008). The possible reasons may be related to China’s “West–East Power Transmission” policy; that is, the energy in the western region rich in coal and hydropower resources is converted into electricity resources and transmitted to the eastern region where electricity is scarce. This also makes western cities have a strong carbon emission dependence and carbon lock-in effect. In terms of economic development level, because of the high population density and rapid economic development in eastern cities, the energy consumption is also larger, and they have higher carbon emission levels. The rapid development and application of low-carbon technologies under the impetus of the carbon pilot policy has effectively reduced carbon emissions.

3.3. Regression Based on PSM-DID

Due to the heterogeneity among pilot cities, it is difficult to have a completely consistent time effect, so we need to select non-pilot cities with similar eigenvalues to the treatment group as the control group to eliminate sample selection bias. Propensity score matching (PSM) is a suitable method, but cannot avoid endogeneity problems due to omitted variables. The DID method can solve the endogeneity problem well by double differencing to identify the impact of policy shocks, but it cannot avoid the self-selection bias challenge caused by non-randomized experiments, such as the LCCP policy. Therefore, we used the PSM-DID approach for estimation to further improve the persuasiveness of the core conclusions. We used five matching methods, including nearest neighbor “one-to-one” matching (N-1), nearest neighbor “one-to-five” matching (N-5), caliper matching (Caliper), nearest neighbor “one-to-five” matching within calipers (Caliper N-5), and kernel function matching (Kernel). Figure 2 shows the kernel density distribution of the propensity score values of the pilot group and the non-pilot group before and after the nearest neighbor “one-to-five” matching. The result shows that the kernel density distribution of the propensity scores of the two groups after matching is closer to that before matching, which indicates that the characteristics of the samples are more similar. The results of standardized deviation (Figure 3a) show that the standardization gap of each variable is no more than 10%, and the common support domain of the pilot group and the non-pilot group is basically the same (Figure 3b), indicating that the model has a better matching effect.
The average treatment effect of the LCCP on carbon emissions was calculated according to the matched samples of the pilot group and the non-pilot group. We report the results in Table 6, and found that the estimated coefficient after propensity score matching is between −0.0277 and −0.0613, and that on per capita carbon emissions is between −0.1106 and −0.1812. Most of the estimated results pass at least the 10% significance level test, which proves that the LCCP policy has had a significant effect on carbon emission reduction.

3.4. Lagging Effects of the LCCP Policy

Considering that the impact of the LCCP policy may have a lag effect, we report the regression results of the explanatory variables with one lag period (L.LcarbonProv) and two lag periods (L2.LcarbonProv) in Table 7. The results show that the effect of the LCCP policy on carbon emissions’ reduction is still significant. Compared with non-pilot areas, the carbon emissions of low-carbon pilot areas with one lag period and two lag periods were reduced by 1.76% and 1.90%, respectively. LCCP policies had a greater impact on per capita carbon emissions. Compared with non-pilot areas, the per capita carbon emissions of low-carbon pilot areas with one lag period and two lag periods decreased by 4.05% and 4.37%, respectively, which is consistent with the conclusion of the benchmark regression.

4. Mechanism Analysis

4.1. Decoupling Model of Carbon Emissions in Low-Carbon Cities

The Environmental Kuznets Curve (EKC) is often used to analyze the inverted U-shaped relationship between economic growth and environmental quality, and the decoupling index is used to measure this changing relationship [40,41]. The decoupling elasticity coefficient constructed by Tapio is widely applied in the correlation analysis of carbon emissions in China [42], and can describe the relationship between the environment and economic growth in detail [43,44]. This study used the Tapio model to classify low-carbon pilot cities based on the definition of the decoupling elasticity coefficient and the characteristics of China’s urban carbon emissions. The equation for the elastic coefficient value of the Tapio model is as follows
e = Δ CO 2 / CO 2 Δ GDP / GDP
where e is the decoupling elasticity coefficient, and Δ CO 2 and Δ GDP represent the changes in carbon emissions and GDP from the base period to the end of the period, respectively.
We used the Tapio decoupling model to study the decoupling relationships of 56 low-carbon pilot cities (only prefecture-level cities excluding provincial pilots). Due to the limitation of data, we selected the base period and the final period for the calculation of the elasticity coefficient according to the year when the LCCP policy promulgated. Specifically, the time ranges for the first round of pilot areas were 2000–2010 and 2010–2014, respectively, and the time ranges for the second round of pilot areas were 2002–2012 and 2012–2016, respectively, and the time ranges for the third round of pilot areas were 2000–2016 and 2016–2017, respectively (Table 8).
We calculated the decoupling elasticity coefficients of the 56 pilot cities according to the Tapio model (Figure 4). We found that the carbon emissions and economic growth of cities were in a state of negative decoupling enhancement before the policy announcement, except for Wuzhong. After the policy was announced, 16 cities were in a decoupling-enhanced state (change rate of carbon dioxide <0, change rate of GDP >0), accounting for about 28.6%, indicating that the number of cities with economic growth but negative carbon emission growth increased significantly. There were 11 cities in the state of weakening negative decoupling, accounting for about 19.6%. In addition, the number of cities in a state of weakening decoupling was 13, accounting for 23.2%. Figure 4 shows that the carbon emissions of most cities (N = 28) changed from positive growth to negative growth, which was further upgraded to the decoupling-enhanced type. The gap between economic growth and carbon emission growth in other cities also gradually narrowed, transforming into a weakened negative decoupling type. These situations show that the carbon emissions of pilot cities were effectively controlled with the economic growth.

4.2. Analysis of the Mechanism of Electricity Consumption

Carbon emissions from urban activities mainly come from electricity production and energy consumption. In order to test the existence of the mechanism of the LCCP policy changing carbon emissions by affecting electricity consumption, this study established the following mediation effect model
Y i t = β 0 + c L C a r b o n i t + ξ X i t + λ i + ν t + δ P r o v i n c e p t + ε i t
M E i t = β 0 + a L C a r b o n i t + ξ X i t + λ i + ν t + δ P r o v i n c e p t + ε i t
Y i t = β 0 + c L C a r b o n i t + b M E i t + ξ X i t + λ i + ν t + δ P r o v i n c e p t + ε i t
Among them, M E i t represents the annual electricity consumption. We tested the effect of per capita electricity consumption ( l n T _ e l e c _ p e r ) and industrial electricity consumption ( l n T _ i _ e l e c ) as mediating variables in the model, and the rest of the variables are the same as the settings of the benchmark model.
The premise is that the mediating variable (electricity consumption in this study) is on the causal chain of independent and dependent variables. We first use model (3) to verify the total effect of the independent variable on the outcome variable, and then we use the mediator variable as the dependent variable to explore the effect of the independent variable LCCP policy on the mediator variable (model (4)). Finally, the independent and mediating variables are used as explanatory variables to explore their influence on the outcome variables (model (5)). In this study, if both parameters a and b are significant, it means that electricity consumption is a mediating variable for the LCCP policy to affect carbon emission reduction. On this basis, if c is not significant, it means that electricity consumption is the unique mediating variable. Otherwise, there are other unobserved mediating variables or other paths of influence.
If coefficient a is not significant, then the mediating variable has no significant effect, so the analysis is terminated. Otherwise, the variable is considered in model (5). If coefficient b is not significant, then the corresponding variable does not have a mediating effect. Otherwise, there is a mediating effect. After the introduction of the mediation variable, if c is not significant in model (5), it means that the mediation variable is the only confirmed mediation variable. In other words, the impact path of the LCCP policy on carbon emissions is unique and determined. Otherwise, there are other mediation variables or other paths of influence.
We report the regression results in Table 9. Columns (1)–(4) test the mediating effect of electricity consumption on carbon emissions and per capita carbon emissions, respectively. We found that low-carbon pilot cities can positively promote the carbon emissions’ reduction by reducing electricity consumption, and passed the 1% significance level test. The results of the Sobel test also proved the existence of the mediating effect of electricity consumption. The LCCP policy reduced carbon emissions by 3.72% (p < 0.000) and per capita carbon emissions by 2.84% (p < 0.000) by affecting per capita electricity consumption.

5. Robustness Check

5.1. Parallel Trend Test

Before using the DID method properly, we need to check whether the pilot and non-pilot cities met the common development trends before the policy [45,46]. This study constructs the following econometric model
Y i t = α + τ = M N β τ L C a r b o n i , t τ + γ X i t + λ i + ν t + δ P r o v i n c e p , t τ + ε i t
Among them, L C a r b o n i , t τ is a dummy variable. If city i is on the pilot list in year t τ , the value is 1, and 0 for others ( M indicates the number of periods before the policy and N indicates the number of periods after the policy). For example, when τ = 2 , the variable L C a r b o n i , t 2 indicates that city i entered the pilot list in year t 2 , which measures the effect in the second year after the policy. Therefore, β 0 measures the policy effect of the current LCCP policy. β M to β 1 measures the policy effects of the 1 M year before the policy. β 1 to β N measures the policy effects of the 1 N year after the policy. If β M to β 1 are significantly 0, it represents that there is no significant difference between the pilot and non-pilot group in the 1 M year before the policy; that is, the parallel trend assumption is satisfied.
Figure 5 shows the estimated values of the parameter β τ for carbon emissions and per capita carbon emissions and 95% confidence intervals. The horizontal axis represents the period of the current year minus the policy implementation year, and the vertical axis represents the difference in changes in dependent variable indicators. It can be seen from Figure 5 that there is no significant difference in carbon emission indicators between the pilot and non-pilot areas before the LCCP, which provides evidence that the DID method in our study meets the parallel trend assumption. In addition, we also found that the LCCP policy had a persistent impact on the reduction in carbon emissions, and the effect gradually increased. The effect began to decline slightly after the fifth year of implementation.

5.2. Placebo Test

We have used the DID method to identify the effect of the LCCP policy on reducing carbon emissions; however, there is a potential threat to the existing conclusion. Cities that implement policies have strong incentives to reduce carbon emissions. For example, they are subject to international public opinion and restrictions on export tariffs on green and low-carbon products in foreign trade. We randomly generated the timing of policy implementation to use a placebo test. We used two randomization schemes [30,47], the first was to randomly select the year as the time when the city implements the policy. The second was first to group by city, and then randomly select a year in each city group as the policy implementation time. Based on the settings of the benchmark model, we repeated 1000 times regressions according to these two schemes, respectively. Figure 6 plots the distribution of regression coefficients and p-values for the dummy policy treatment variables across four simulations. Results show that the randomly assigned estimated values are concentrated around the zero value, which means that the carbon emission reduction effect of the LCCP policy is not disturbed by omitted variables with a high probability.
In addition, considering whether the effect of the LCCP policy is caused by unobserved or random factors, we randomly selected the same number of cities as a virtual treatment group using the timing of real policy implementation, and the results are shown in Table 10 by re-running the benchmark model. We found that the LCCP had no significant promoting effect on randomly generated treatment groups, which supported the consistency of the conclusions to a certain extent.

6. Conclusions

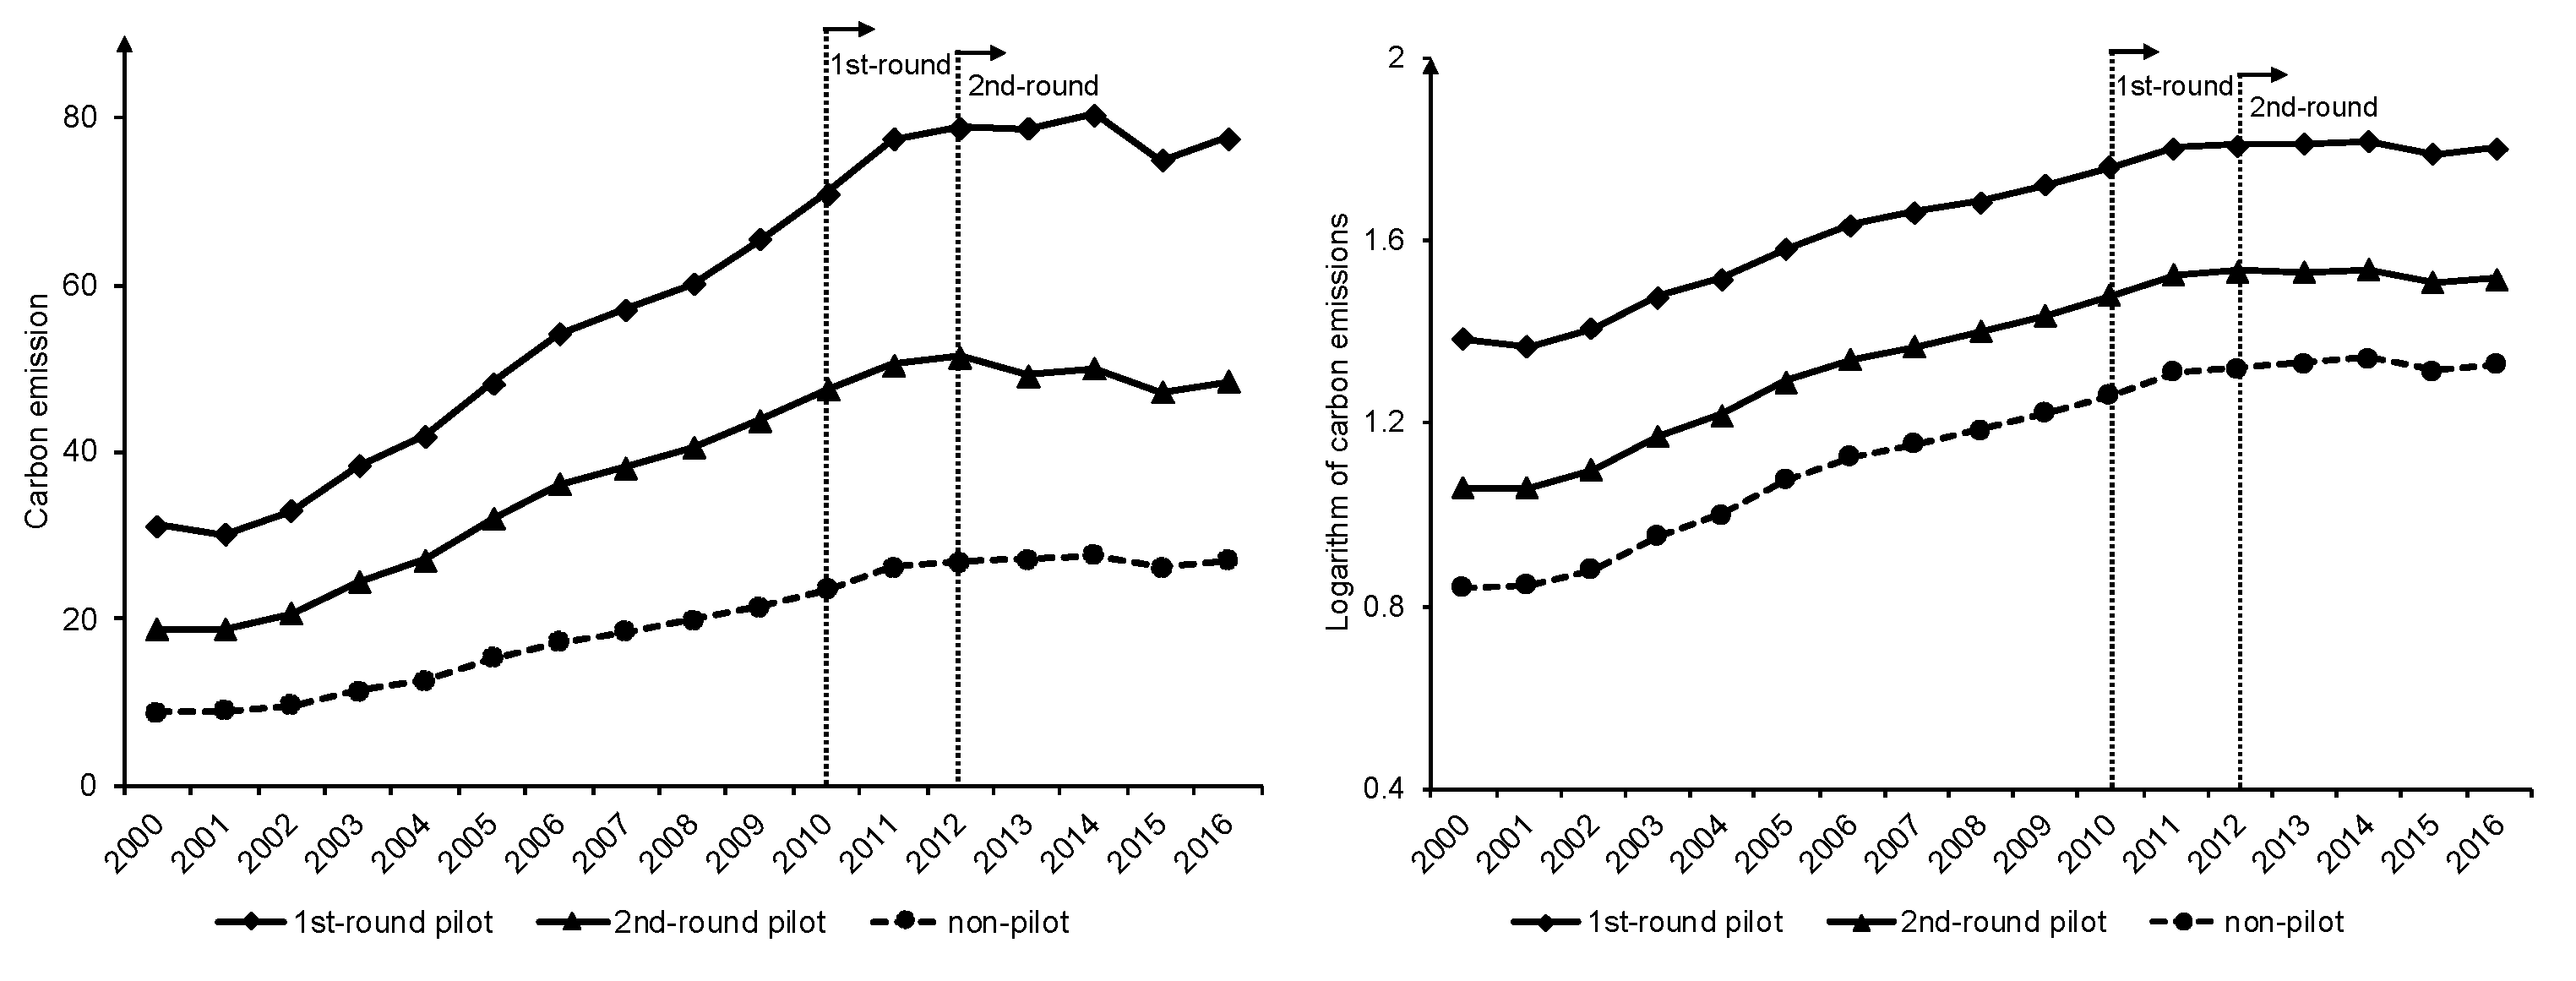
The purpose of this study is to analyze the causal effect of the LCCP policy on carbon emissions’ reduction. Overall, we used the time-varying DID method to provide quasi-natural experimental evidence based on the panel data of 284 cities in China from 2000 to 2016. We robustly found that the carbon emissions of pilot areas are reduced by about 1.63 percentage points compared to non-pilot areas. The concern is that the LCCP policy may further deepen the gap in carbon emission efficiency between municipalities, and eastern and western cities. Because of the limited financial resources and small policy levers of western and central governments, there are relatively few policy tools, especially incentive tools, to encourage the adjustment of industrial and energy structures, further widening the geographic–urban divide across the country. From the perspective of the economic development level, because of the higher economic production activities and population density in eastern cities, the energy consumption is also larger, and they have higher carbon emission levels. The LCCP policy has rapidly promoted the exploration and application of low-carbon technologies, effectively reducing carbon emissions. Therefore, more financial resources and policy discretion could be directed towards central and western areas with low economic development.
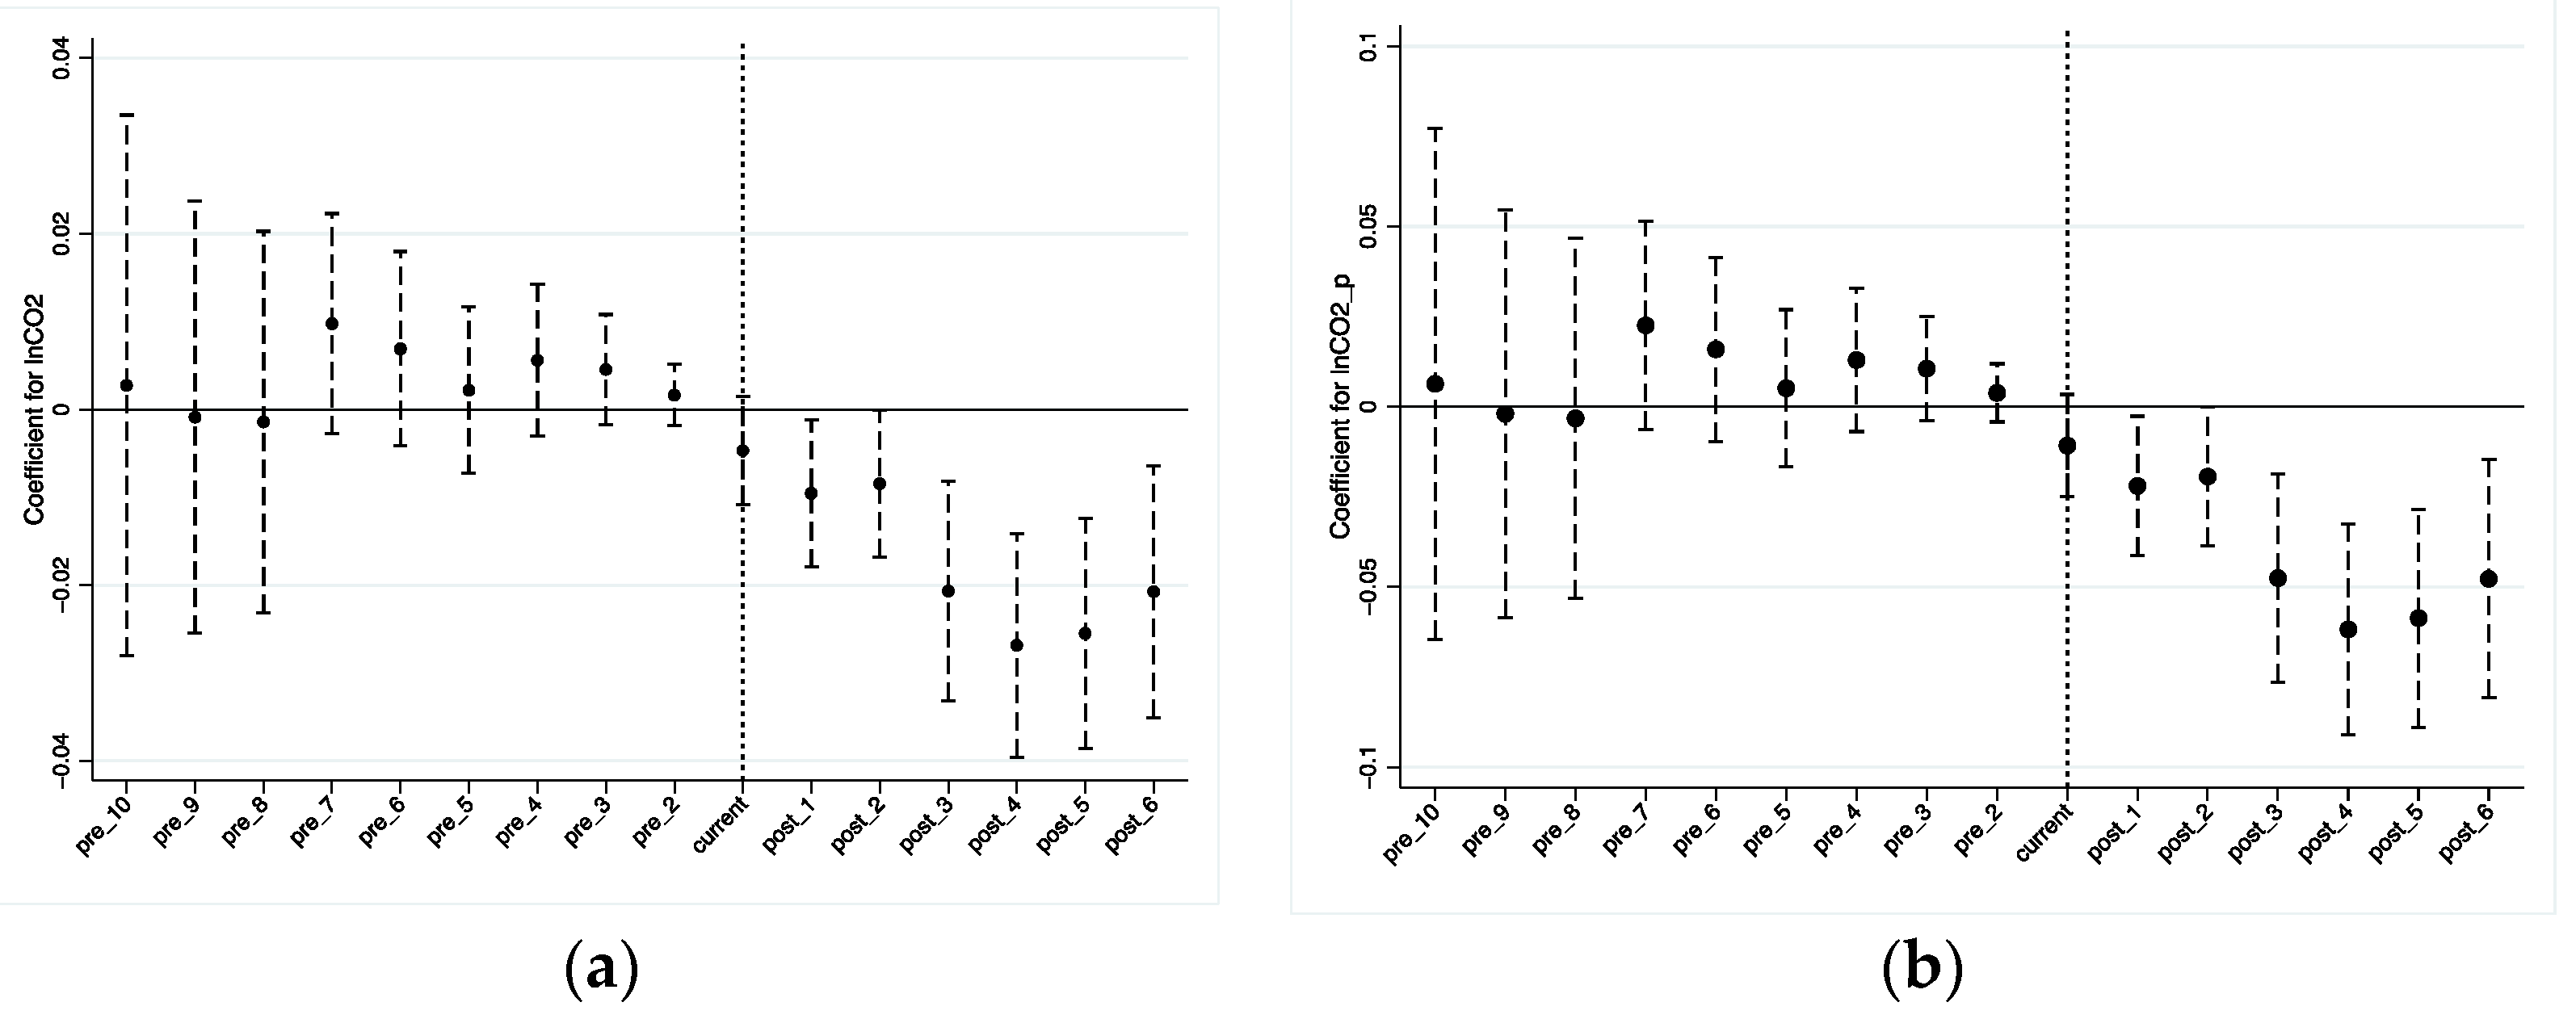
In addition, we found that there was a lagged effect of the LCCP policy. That is, the carbon emissions’ reduction did not reach the peak immediately when the LCCP policy was announced. The carbon emissions’ reduction caused by the policy reached a peak three years after the policy was announced, which is in line with the reality of the gradual development of low-carbon technologies, and a package of low-carbon policies may take several years to be effective. Therefore, the LCCP policy and other related policies should be evaluated over the long-term.
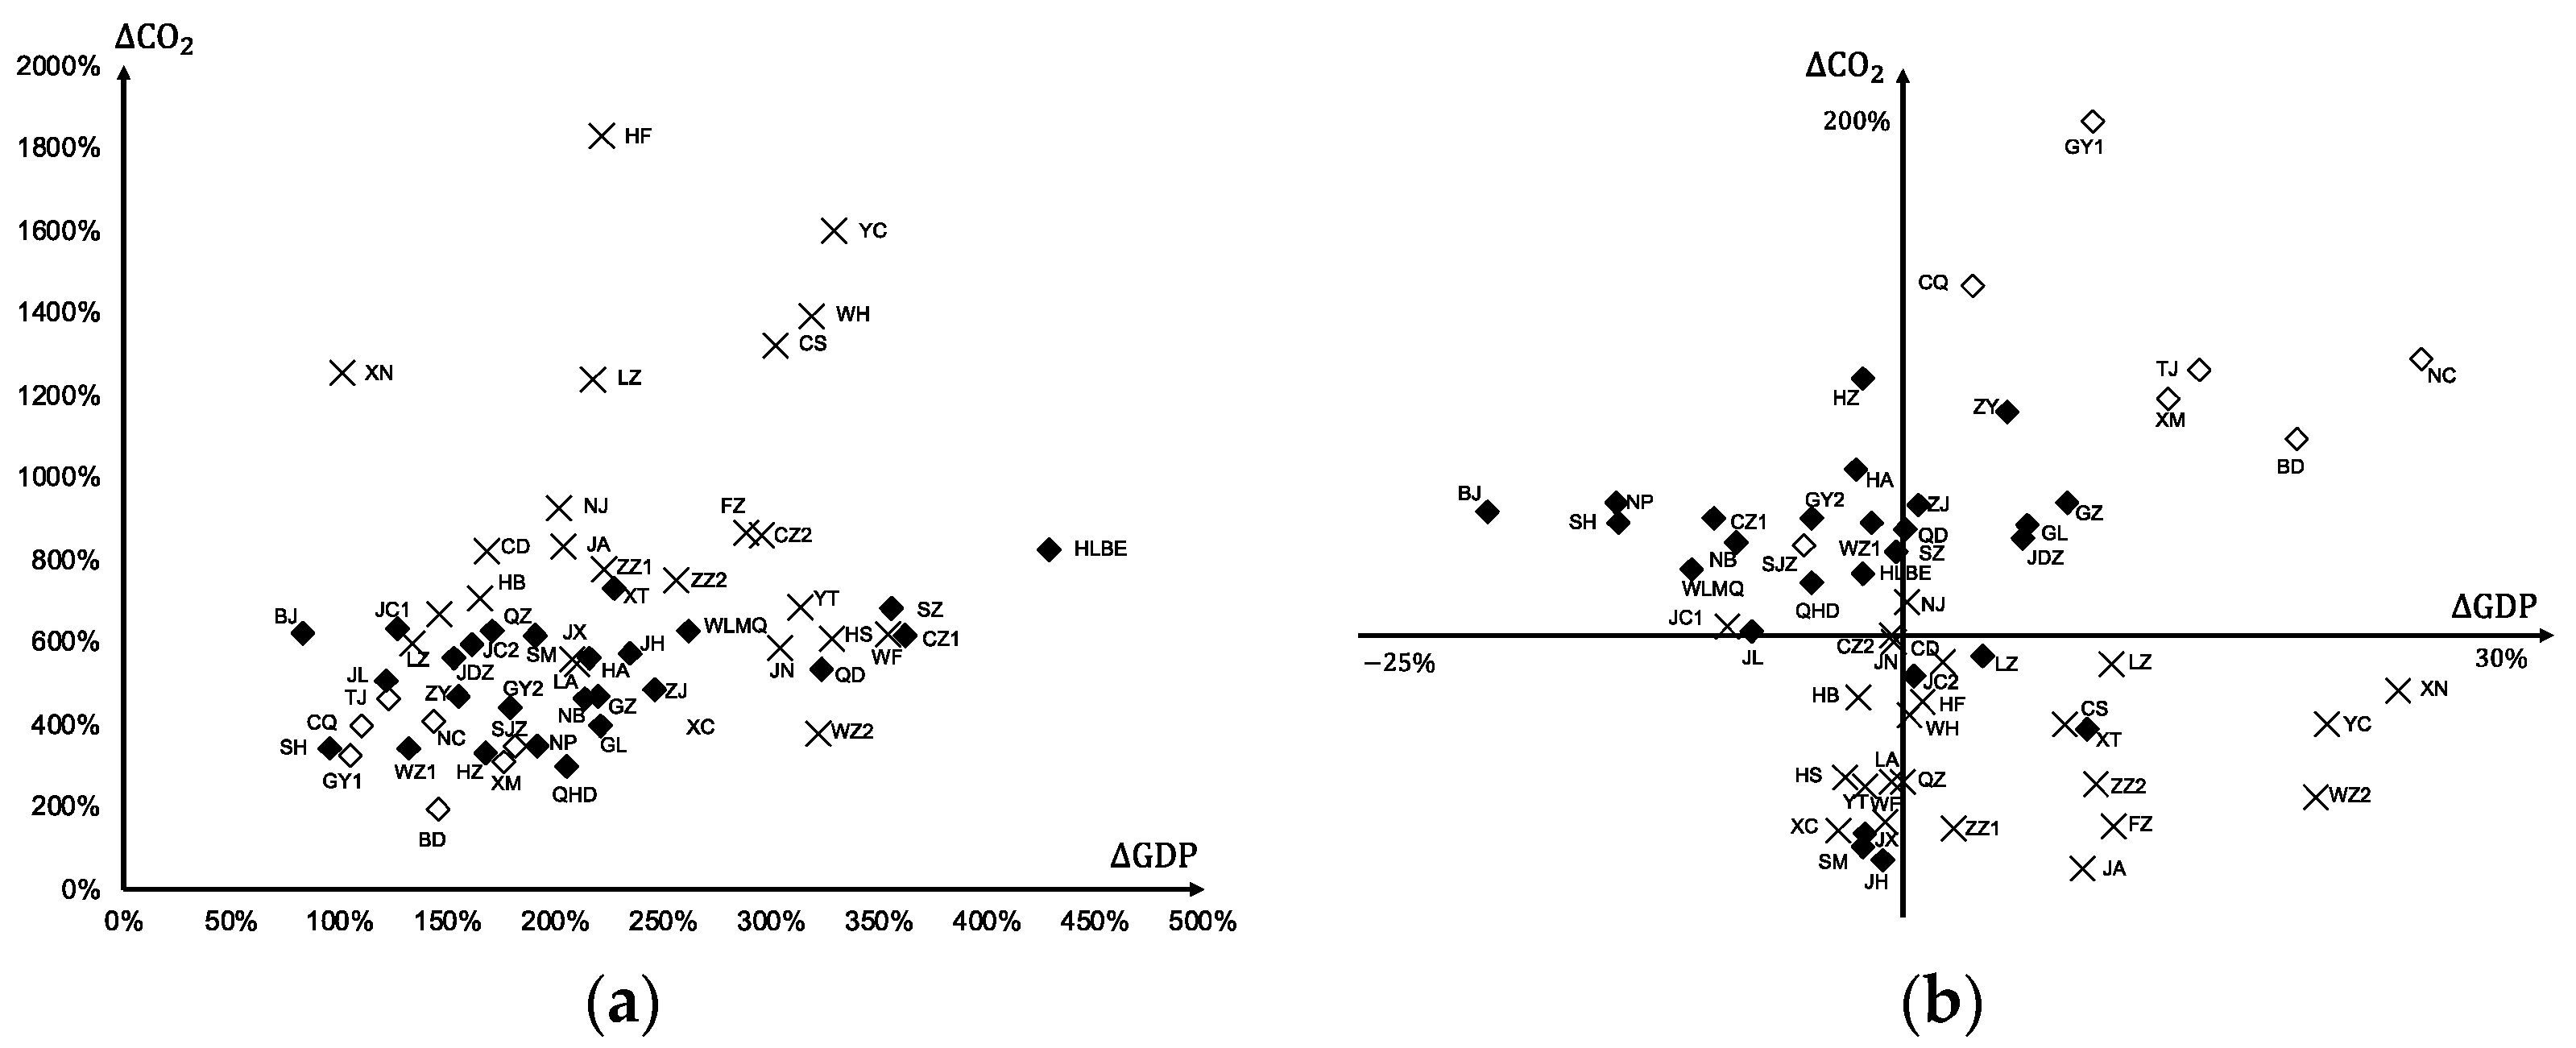
Finally, the mechanism analysis shows that cities in a state of negative decoupling between carbon emissions and economic growth are gradually transformed into a state of enhanced decoupling, a state of weakened negative decoupling, and a state of weakened decoupling, which shows that the carbon emissions of pilot areas are effectively controlled with the economic growth. In addition, we proved the existence of the mediating effect of electricity consumption. Low-carbon pilot cities could positively promote the carbon emissions’ reduction by reducing electricity consumption. Although empirical data provide this evidence, it does not mean that this is the only low-carbon development path. With the improvement in the level of electrification in the future, such as the adoption of new energy vehicles, the electricity consumption on the demand side will gradually increase. We should pay more attention to cleaning the power generation side of energy and the popularization of distributed power generation. For example, the development of low-carbon technologies and the encouragement of low-carbon lifestyles. Overall, the LCCP reduces the harsh effects of climate change and promotes benefits such as an improved environment, cleaner air and a better quality of life. The successful implementation of the LCCP policy could help to provide an empirical reference for further environmental policy formulation and to form a more standardized environmental supervision mechanism.
This study still has some limitations to consider in the further research due to the availability of data, such as the uncertainty of the global economic policy network not being considered. In addition, since the government continues to promote the LCCP, as more data become available, such policies could be analyzed and studied from multi-dimensions in the future.

Author Contributions

Conceptualization, Y.H.; Data curation, H.Z. and Y.H.; Formal analysis, B.J. and Z.H.; Methodology, B.J., C.Y. and B.L.; Project administration, Y.H. and B.L.; Resources, H.Z.; Visualization, W.X.; Writing—original draft, B.J., Y.H. and B.L. All authors have read and agreed to the published version of the manuscript.

Funding

This work was supported by the comprehensive service company double shield Faraday cage process research and development and application consulting project (SGZJZHODGCWT2100036).

Institutional Review Board Statement

Not applicable.

Informed Consent Statement

Not applicable.

Data Availability Statement

The datasets used or analyzed during the study are available from the corresponding author on reasonable request.

Conflicts of Interest

The authors declare no conflict of interest.

References

  1. Duan, H.; Wang, S. China’s challenge: Strategic adjustment of global temperature control goals from 2 °C to 1.5 °C. J. Manag. World 2019, 10, 50–63. [Google Scholar]
  2. Dubey, R.; Gunasekaran, A.; Childe, S.; Papadopoulos, T.; Luo, Z.; Wamba, S.; Roubaud, D. Can big data and predictive analytics improve social and environmental sustainability. Technol. Forecast. Soc. 2019, 144, 534–545. [Google Scholar] [CrossRef]
  3. Khanna, N.; Fridley, D.; Hong, L. China’s pilot low-carbon city initiative: A comparative assessment of national goals and local plans. Sustain. Cities Soc. 2014, 12, 110–121. [Google Scholar] [CrossRef]
  4. Wang, Z.; Zhang, H.; Li, H.; Wang, B.; Cui, Q.; Zhang, B. Economic impact and energy transformation of different effort-sharing schemes to pursue 2 °C warming limit in China. Appl. Energy 2022, 320, 119304. [Google Scholar] [CrossRef]
  5. Ferreira, J.; Fernandes, C.; Ratten, V. The effects of technology transfers and institutional factors on economic growth: Evidence from Europe and Oceania. J. Technol. Transf. 2019, 44, 1505–1528. [Google Scholar] [CrossRef]
  6. Lee, C.; Erickson, P. How does local economic development in cities affect global GHG emissions? Sustain. Cities Soc. 2017, 35, 626–636. [Google Scholar] [CrossRef]
  7. Cai, B.; Cui, C.; Zhang, D. China city-level greenhouse gas emissions inventory in 2015 and uncertainty analysis. Appl. Energy 2019, 253, 113579. [Google Scholar] [CrossRef]
  8. Salvia, M.; Reckien, D.; Pietrapertosa, F.; Eckersley, P.; Heidrich, O. Will climate mitigation ambitions lead to carbon neutrality? An analysis of the local-level plans of 327 cities in the EU. Renew. Sust. Energy Rev. 2021, 135, 110253. [Google Scholar] [CrossRef]
  9. Shan, Y.; Guan, D.; Hubacek, K. City-level climate change mitigation in China. Sci. Adv. 2018, 4, eaaq0390. [Google Scholar] [CrossRef] [Green Version]
  10. Du, D.; Wang, T. Comprehensive evaluation and research on the improvement and development of low-carbon city evaluation index system. China Environ. Sci. 2011, 3, 8–11. (In Chinese) [Google Scholar]
  11. Du, X.; Shen, L.; Ren, Y.; Meng, C. A dimensional perspective-based analysis on the practice of low carbon city in China. Environ. Impact Assess. Rev. 2022, 95, 106768. [Google Scholar] [CrossRef]
  12. Shen, L.; Du, X.; Cheng, G.; Wei, X. Capability maturity model (CMM) method for assessing the performance of low-carbon city practice. Environ. Impact Assess. Rev. 2021, 87, 106549. [Google Scholar] [CrossRef]
  13. Yang, L.; Li, Y. Low-carbon city in China. Sustain. Cities Soc. 2013, 9, 62–66. [Google Scholar] [CrossRef]
  14. Wang, Y.; Ding, Q.; Zhuang, D. An eco-city evaluation method based on spatial analysis technology: A case study of Jiangsu province. China Ecol. Indic. 2015, 58, 37–46. [Google Scholar] [CrossRef]
  15. Cheng, J.; Yi, J.; Dai, S. Can low-carbon city construction facilitate green growth? evidence from China’s pilot low-carbon city initiative. J. Clean. Prod. 2019, 231, 1158–1170. [Google Scholar] [CrossRef]
  16. Yang, X.; Wang, X.; Zhou, Z. Development path of Chinese low-carbon cities based on index evaluation. Adv. Clim. Change Res. 2018, 2, 144–153. [Google Scholar] [CrossRef]
  17. Su, M.; Zheng, Y.; Yin, X.; Zhang, M.; Wei, X.; Chang, X.; Qin, Y. Practice of low-carbon city in China: The status quo and prospect. Energy Procedia 2016, 88, 44–51. [Google Scholar] [CrossRef] [Green Version]
  18. Shen, L.; Wu, Y.; Lou, Y. What drives the carbon emission in the Chinese cities? a case of pilot low carbon city of Beijing. J. Clean. Prod. 2018, 174, 343–354. [Google Scholar] [CrossRef]
  19. Feng, J.; Zeng, X.; Yu, Z. Status and driving forces of CO2 emission of the national low carbon pilot: Case study of Guangdong Province during 1995–2015. Energy Procedia. 2019, 158, 3602–3607. [Google Scholar] [CrossRef]
  20. Wen, H.; Chen, Z.; Nie, P. Environmental and economic performance of China’s ETS pilots: New evidence from an expanded synthetic control method. Energy Rep. 2021, 7, 2999–3010. [Google Scholar] [CrossRef]
  21. Wang, H.; Wei, W. Coordinating technological progress and environmental regulation in CO2 mitigation: The optimal levels for OECD countries and emerging economies. Energy Econ. 2020, 87, 1–11. [Google Scholar] [CrossRef]
  22. Chen, Y.; Shao, S.; Fang, M.; Tian, Z.; Yang, L. One man’s loss is another’s gain: Does clean energy development reduce CO2 emissions in China? Evidence based on the spatial Durbin model. Energy Econ. 2022, 107, 105852. [Google Scholar] [CrossRef]
  23. Yu, Y.; Zhang, N. Low-carbon city pilot and carbon emission efficiency: Quasi-experimental evidence from China. Energy Econ. 2021, 96, 105125. [Google Scholar] [CrossRef]
  24. Han, Y. Impact of environmental regulation policy on environmental regulation level: A quasi-natural experiment based on carbon emission trading pilot. Environ. Sci. Pollut. Res. 2020, 27, 23602–23615. [Google Scholar] [CrossRef]
  25. Han, F.; Xie, R.; Lu, Y.; Fang, J.; Liu, Y. The effects of urban agglomeration economies on carbon emissions: Evidence from Chinese cities. J. Clean. Prod. 2018, 172, 1096–1110. [Google Scholar] [CrossRef]
  26. Zang, J.; Wan, L.; Li, Z.; Wang, C.; Wang, S. Does emission trading scheme have spillover effect on industrial structure upgrading? Evidence from the EU based on a PSM-DID approach. Environ. Sci. Pollut. Res. 2020, 27, 12345–12357. [Google Scholar] [CrossRef]
  27. Zhang, K.; Zhang, Z.; Liang, Q. An empirical analysis of the green paradox in China: From the perspective of fiscal decentralization. Energy Policy 2017, 103, 203–211. [Google Scholar] [CrossRef]
  28. Pei, Y.; Zhu, Y.; Liu, S.; Wang, X.; Cao, J. Environmental regulation and carbon emission: The mediation effect of technical efficiency. J. Clean. Prod. 2019, 236, 1–13. [Google Scholar] [CrossRef]
  29. Song, M.; Zhao, X.; Shang, Y. The impact of low-carbon city construction on ecological efficiency: Empirical evidence from quasi-natural experiments. Resour. Conserv. Recycl. 2020, 157, 104777. [Google Scholar] [CrossRef]
  30. Song, H.; Sun, Y.; Chen, D. Evaluation of the effect of government air pollution control: An empirical study from the construction of “low carbon city” in China. J. Manag. World 2019, 6, 95–108. (In Chinese) [Google Scholar]
  31. Gong, M.; Liu, H.; Jiang, X. Research on the impact of China’s low-carbon pilot policies on foreign direct investment. China’s Popul. Resour. Environ. 2019, 6, 50–57. [Google Scholar]
  32. Shan, Y.; Huang, Q.; Guan, D.; Hubacek, K. China CO2 emission accounts 2016–2017. Sci. Data 2020, 7, 54. [Google Scholar] [CrossRef] [PubMed] [Green Version]
  33. Shan, Y.; Liu, J.; Liu, Z. New provincial CO2 emission inventories in China based on apparent energy consumption data and updated emission factors. Appl. Energy 2016, 184, 742–750. [Google Scholar] [CrossRef] [Green Version]
  34. Zhang, K.; Wang, J.; Cui, X. Fiscal decentralization and environmental pollution: The perspective of carbon emissions. China Ind. Econ. 2011, 10, 65–75. [Google Scholar]
  35. Auffhammer, M.; Sun, W.; Wu, J.; Zheng, S. The decomposition and dynamics of industrial carbon dioxide emissions for 287 Chinese cities in 1998–2009. J. Econ. Surv. 2016, 30, 460–481. [Google Scholar] [CrossRef]
  36. Yan, C.; Li, T.; Lan, W. Financial development, innovation and carbon dioxide emission. Financ. Res. 2016, 1, 14–30. (In Chinese) [Google Scholar]
  37. Han, F.; Xie, R. Has the agglomeration of producer services reduced carbon emissions? Spatial econometric analysis of panel data of cities at the prefecture level and above in my country. Quan. Econ. Tech. Econ. Res. 2017, 3, 40–58. (In Chinese) [Google Scholar]
  38. Chen, D.; Chen, S.; Jin, H. Industrial agglomeration and CO2 emissions: Evidence from 187 Chinese prefecture-level cities over 2005–2013. J. Clean. Prod. 2018, 172, 993–1003. [Google Scholar] [CrossRef]
  39. Shao, S.; Zhang, K.; Dou, J. Energy conservation and emission reduction effects of economic agglomeration: Theory and Chinese experience. J. Manag. World 2019, 1, 36–60. [Google Scholar]
  40. Ruffing, K. Indicators to measure decoupling of environmental pressure from economic growth. Sustain. Indic. 2007, 67, 211. [Google Scholar]
  41. Upta, S. Decoupling: A step toward sustainable development with reference to OECD countries. Int. J. Sust. Dev. World 2015, 22, 510–519. [Google Scholar]
  42. Tapio, P. Towards a theory of decoupling: Degrees of decoupling in the EU and the case of road traffic in Finland between 1970 and 2001. Transp. Policy 2005, 12, 137–151. [Google Scholar] [CrossRef] [Green Version]
  43. Wang, Q.; Su, M. Drivers of decoupling economic growth from carbon emission: An empirical analysis of 192 countries using decoupling model and decomposition method. Environ. Impact Assess. Rev. 2020, 81, 106356. [Google Scholar] [CrossRef]
  44. Jiang, R.; Zhou, Y.; Li, R. Moving to a low-carbon economy in China: Decoupling and decomposition analysis of emission and economy from a sector perspective. Sustainability 2018, 10, 978. [Google Scholar] [CrossRef] [Green Version]
  45. Gehrsitz, M. The effect of low emission zones on air pollution and infant health. J. Environ. Econ. Manag. 2017, 83, 121–144. [Google Scholar] [CrossRef] [Green Version]
  46. Arkhangelsky, D.; Athey, S.; Hirshberg, D.; Imbens, G.; Wager, S. Synthetic Difference-in-Differences. Am. Econ. Rev. 2021, 111, 4088–4118. [Google Scholar] [CrossRef]
  47. Li, P.; Lu, Y.; Wang, J. Does flattening government improve economic performance? evidence from China. J. Dev. Econ. 2016, 123, 18–37. [Google Scholar] [CrossRef]
Figure 1. Changes in carbon emissions in pilot and non-pilot cities from 2000 to 2016.
Sustainability 14 08996 g001
Figure 2. Kernel density distribution of propensity score values before and after the N-5 matching. (a) Before matching, (b) after matching.
Sustainability 14 08996 g002
Figure 3. Results of propensity score matching balance test. (a) Standardized deviation of variables, (b) common range of propensity scores.
Sustainability 14 08996 g003
Figure 4. Decoupling status distribution of pilot cities based on the Tapio decoupling model. (a) Before, (b) after.
Sustainability 14 08996 g004
Figure 5. The results of parallel trend test. (a) Carbon emissions before and after LCCP, (b) per capita carbon emissions before and after the LCCP.
Sustainability 14 08996 g005
Figure 6. Simulation results of random allocation of low-carbon city pilots. (a) Coefficient for lnCO2 by randomly select the year as the treatment time; (b) coefficient for lnCO2 by randomly select a year in each city group as the treatment time; (c) coefficient for lnCO2p by randomly select the year as the treatment time; (d) coefficient for lnCO2p by randomly select a year in each city group as the treatment time.
Sustainability 14 08996 g006
Table 1. Categories of existing LCCP pilot literature review.
CategoryLiteratureMain Content
Cities’ missionsFerreira et al. (2019); Lee et al. (2017); Cai et al. (2019); Salvia et al. (2021); Shan et al. (2018)
[5,6,7,8,9]
Cities are major sources of greenhouse gas emissions, accounting for about 70% of total carbon emissions
The evaluation indicators of LCCPDu et al. (2011) [10]Transportation, industry, consumption, energy, policy, and technology
Du et al. (2021); Shen et al. (2021) [11,12]Per capita carbon emissions, the proportion of zero-carbon energy in primary energy, proportion of coal in total energy consumption, and unit emissions
The effect of LCCP policyYang et al. (2013) [13]Summarized the driving forces of low-carbon city development in China
Wang et al. (2015) [14]Summed up the practical experience of Zhenjiang city
Cheng et al. (2019) [15]Evaluated the policy effects by using green total factor productivity
Yang et al. (2018); Su et al. (2016); Shen et al. (2018); Feng et al. (2019) [16,17,18,19]Cities adopted different low-carbon development paths
Assessment methodWen et al. (2021) [20]Synthetic control method
Han et al. (2020); Han et al. (2018); Zang et al. (2020) [24,25,26]Difference-in-difference method
Yu et al. (2021) [23]Data envelopment analysis
Chen et al. (2022); Zhang et al. (2017) [22,27]Spatial Durbin
Environmental quality indicatorsSong et al. (2020) [29]Carbon emissions
Song et al. (2019) [30]PM10 and API pollution indexes
Cheng et al. (2019) [15]Green total factor productivity
Gong et al. (2019) [31]Foreign direct investment
Table 2. Variable definitions and descriptive statistics.
Variable (Definition, Unit)Obs.Min.Max.Non-Pilot CityPilot City
MeanStd.MeanStd.
lnCO2 (logarithm of carbon emissions, 105 tons)48280.042.361.150.381.360.34
lnCO2p (logarithm of carbon emissions per capita, tons/person)4828−0.581.850.620.340.790.29
lnGDPp (logarithm of GDP per capita, yuan/person)48282.005.674.220.394.620.27
lnGDPp2 (square of the logarithm of GDP per capita, Yuan/person)48283.9832.1617.933.3021.422.53
Psec (The percentage of secondary industry in GDP, %)48019.0090.9747.4211.9348.149.21
Pop (log of the total population per unit area, people/km2)48274.462707410.50316.02460.63406.85
Fin (The percentage of financial institution loan balance in GDP, %)48280.00796.4498.7567.56164.7376.52
lnE (log of total electricity consumption, 10,000 kWh)44503.357.175.410.545.760.59
lnEp (log of electricity consumption per capita, kWh/person)4450−2.761.02−1.120.55−0.820.57
lnEi (log of total industrial electricity consumption, 10,000 kWh)39202.666.915.250.635.510.68
Ppri (The percentage of primary industry in GDP, %)48010.0351.816.699.9511.837.57
Pter (The percentage of tertiary industry in GDP, %)48018.5085.3435.898.2740.039.98
Rsw (Comprehensive utilization rate of general industrial solid waste, %)39060.4910077.1924.0479.1923.37
lnGco (Logarithm of the green coverage area in built-up area, hectares)3981−0.384.942.241.083.370.79
lnGpa (Logarithm of the green area of the park, hectares)47711.1810.475.901.696.941.50
Table 3. Correlation matrix for the variables.
lnCO2lnCO2plnGDPplnGDPp2PsecPopFinlnElnEplnEiPpriPterRswlnGcolnGpa
lnCO2 1.00
lnCO2p0.621.00
lnGDPp0.590.721.00
lnGDPp20.580.710.991.00
Psec0.240.440.440.431.00
Pop0.340.570.240.240.141.00
Fin0.290.250.360.36−0.190.161.00
lnE0.680.520.710.710.330.460.371.00
lnEp0.380.700.740.740.430.240.330.851.00
lnEi0.630.520.670.670.400.420.270.970.851.00
Ppri0.510.640.730.730.640.320.340.700.730.671.00
Pter0.230.110.200.21−0.600.160.600.310.220.20−0.231.00
Rsw0.18−0.010.200.20−0.020.370.100.180.060.16−0.060.091.00
lnGco0.320.280.540.540.070.120.320.370.320.32−0.290.220.101.00
lnGpa0.600.380.590.590.210.440.330.760.580.72−0.540.300.290.321.00
Table 4. Benchmark regression results of the impact of LCCP policy on carbon emissions.
VariablelnCO2lnCO2p
(1)(2)(3)(4)(5)(6)
AllMunicipalityNon-MunicipalityAllMunicipalityNon-Municipality
Lcarbon_Prov−0.0163 ***−0.1061 ***−0.0142 **−0.0374 ***−0.2442 ***−0.0327 **
(0.0061)(0.0386)(0.0060)(0.0141)(0.0889)(0.0139)
_cons1.4159 **4.13031.4852 ***17.0757 ***23.325817.2353 ***
(0.5776)(15.6072)(0.5690)(1.3301)(35.9370)(1.3101)
ControlYESYESYESYESYESYES
City FEYESYESYESYESYESYES
Year FEYESYESYESYESYESYES
Province FEYESYESYESYESYESYES
N346522313413346522313413
R square0.930.9290.930.930.9280.93
Notes: This table reports the estimated coefficients and cluster-robust standard errors (in parentheses). The standard errors are clustered at the city level. Significance is at *** p < 0.01, ** p < 0.05.
Table 5. Heterogeneous regression results of the effect of LCCP policy on carbon emissions.
(1)(2)(3)(4)(5)(6)(7)
Panel data A (lnCO2)
NortheastEastCentralWestLEDMEDHED
Lcarbon_Prov−0.0187 *−0.0175 **−0.02360.0191−0.0134−0.0083−0.0240 ***
(0.0083)(0.0066)(0.0143)(0.0145)(0.0116)(0.0091)(0.0088)
_cons0.4896−7.980133.2906*−3.1767−0.163810.5544 ***−1.0972
(1.3821)(17.6507)(18.2052)(2.3854)(0.9461)(0.8568)(19.6899)
ControlYESYESYESYESYESYESYES
City FEYESYESYESYESYESYESYES
Year FEYESYESYESYESYESYESYES
Province FEYESYESYESYESYESYESYES
N8848239511049120811691088
R square0.930.940.970.940.930.950.93
Panel data B (lnCO2p)
Lcarbon_Prov−0.0432 *−0.0403 **−0.05430.0439−0.0307−0.0190−0.0552 ***
(0.0192)(0.0153)(0.0329)(0.0334)(0.0267)(0.0209)(0.0202)
_cons14.9429 ***−4.559290.4700 **6.500913.4385 ***38.1179 ***11.2893
(3.1824)(40.6416)(41.9186)(5.4925)(2.1785)(1.9729)(45.3371)
ControlYESYESYESYESYESYESYES
City FEYESYESYESYESYESYESYES
Year FEYESYESYESYESYESYESYES
Province FEYESYESYESYESYESYESYES
N8848239511049120811691088
R square0.930.960.960.930.920.950.93
Notes: This table reports the estimated coefficients and cluster-robust standard errors (in parentheses). The standard errors are clustered at the city level. Significance is at *** p < 0.01, ** p < 0.05, * p < 0.1.
Table 6. PSM-DID regression results of the effect of LCCP policy on carbon emissions.
(1)(2)(3)(4)(5)(6)
Panel data A (lnCO2)
UnmatchedN-1N-5CaliperCaliper N-5Kernel
ATT −0.0613−0.0472−0.0277−0.0439−0.0288
Treated1.36431.361.361.361.361.3620
Controls1.20541.421.411.391.411.3908
S.E.0.01680.020.020.020.020.0183
T-stat9.48−2.48−2.39−1.52−2.21−1.58
Panel data B (lnCO2p)
ATT −0.1812−0.1477−0.1106−0.1463−0.1118
Treated1.831.831.831.831.831.83
Controls1.552.011.971.941.971.94
S.E.0.030.050.040.040.040.04
T-stat8.17−3.71−3.82−3.10−3.75−3.12
Table 7. The lagged effects of LCCP policy.
VariablelnCO2 lnCO2p
(1)(2)(3)(4)
L.LcarbonProv−0.0176 *** −0.0405 ***
(0.0059) (0.0135)
L2.LcarbonProv −0.0190 *** −0.0437 ***
(0.0055) (0.0127)
_cons2.0478 ***2.0478 ***2.0478 ***2.0478 ***
(0.4547)(0.4547)(0.4547)(0.4547)
ControlYESYESYESYES
City FEYESYESYESYES
Year FEYESYESYESYES
Province FEYESYESYESYES
N3459345334593453
R square0.930.930.930.93
Notes: This table reports the estimated coefficients and cluster-robust standard errors (in parentheses). The standard errors are clustered at the city level. Significance is at *** p < 0.01.
Table 8. Selection of the base and final period of the low-carbon pilot cities of the Tapio decoupling model.
The First BatchThe Second BatchThe Third Batch
BeforeAfterBeforeAfterBeforeAfter
Base period200020102000201220002016
Final period201020162012201620162017
Table 9. The mediating effect of electricity consumption on LCCP promoting carbon emission reduction.
VariablelnCO2 lnCO2p
(1)(2)(3)(4)
lnT_elec_perlnT_i_eleclnT_elec_perlnT_i_elec
c −0.0200 ***−0.0598 ***−0.1600 ***−0.1377 ***
(0.0134)(0.0098)(0.0235)(0.0225)
a −0.0495 ***−0.0313 ***−0.0495 ***−0.0312 ***
(0.0123)(0.0070)(0.0123)(0.0070)
b −0.7509 ***0.0855 ***0.5735 ***0.1969 ***
(0.0135)(0.0238)(0.0311)(0.0548)
c −0.0571 ***−0.0571 ***−0.1316 ***−0.1316 ***
(0.0098)(0.0098)(0.0225)(0.0225)
a b (Sobel test)−0.0372 ***−0.0027 ***−0.0284 ***−0.0062 ***
(0.0093)(0.0010)(0.0072)(0.0022)
N3465346534653465
Notes: This table reports the estimated coefficients and cluster-robust standard errors (in parentheses). Significance is at *** p < 0.01.
Table 10. Benchmark regression results of the effect of virtual LCCP policy on carbon emissions.
VariablelnCO2lnCO2p
(1)(2)(3)(4)(5)(6)
AllMunicipalityNon-municipalityAllMunicipalityNon-municipality
LcarbonProv0.00020.00390.00250.00040.00910.0057
(0.0067)(0.0081)(0.0065)(0.0154)(0.0187)(0.0150)
_cons1.4509 **7.39631.5073 ***17.1564 ***30.846017.2863 ***
(0.5665)(15.6460)(0.5606)(1.3043)(36.0264)(1.2907)
ControlYESYESYESYESYESYES
City FEYESYESYESYESYESYES
Year FEYESYESYESYESYESYES
Province FEYESYESYESYESYESYES
N382522313773382522313773
R square0.930.930.930.930.930.93
Notes: This table reports the estimated coefficients and cluster-robust standard errors (in parentheses). The standard errors are clustered at the city level. Significance is at *** p < 0.01, ** p < 0.05.
Publisher’s Note: MDPI stays neutral with regard to jurisdictional claims in published maps and institutional affiliations.

