Article

Corrosion Behavior of Different Types of Stainless Steel in PBS Solution

1
Faculty of Chemistry and Technology, University of Split, 21000 Split, Croatia
2
Faculty of Natural Science and Engineering, University of Ljubljana, 1000 Ljubljana, Slovenia
3
Faculty of Electrical Engineering, Mechanical Engineering and Naval Architecture, University of Split, 21000 Split, Croatia
*
Author to whom correspondence should be addressed.
Sustainability 2022, 14(14), 8935; https://doi.org/10.3390/su14148935
Submission received: 20 June 2022 / Revised: 18 July 2022 / Accepted: 19 July 2022 / Published: 21 July 2022
(This article belongs to the Special Issue Stainless Steel—the Choice for Ecosustainability)

Abstract

:
Anodic and spontaneous corrosion of different types of stainless steel (AISI 304L, AISI 316L and 2205 DSS) in phosphate-buffered saline solution (PBS, pH = 7.4) at 37 °C (i.e., in simulated physiological solution in the human body) were examined using open circuit potential measurements, linear and cyclic polarization, and electrochemical impedance spectroscopy methods. After the anodic and spontaneous corrosion, the surface of the tested samples was investigated by light and scanning electron microscopy (SEM) with EDS analysis. It has been established that the tendency of the examined steel materials towards local corrosion decreases in the order: AISI 304L < AISI 316L < 2205 DSS. Namely, the possibility of repassivation and the resistance to local corrosion increases in the same order. The corrosion resistance of steel samples at open circuit potential is a consequence of forming a natural oxide film with a bi-layer structure and consists of an inner barrier and an outer porous film. The inner barrier film has a small thickness and extremely high resistance, while the outer porous film is much thicker but also has significantly lower resistance. The inner barrier layer mainly prevents corrosion of examined steel samples in order: AISI 304L < AISI 316L < 2205 DSS. Light microscopy and SEM/EDS analysis after pitting and spontaneous corrosion showed damage on the AISI 304L and AISI 316L surface, while the surface of 2205 DSS was almost undamaged by corrosion.

1. Introduction

Stainless steel (SS), and more recently Ti and its alloys and cobalt–chromium alloys, have been used as materials for medical implants and prostheses for a relatively long period due to their low elasticity modulus, good biocompatibility, good strength, ductility, and high hardness [1,2,3]. The significant areas of use of these materials include bone fixations and implants, cardiovascular implants (stents), urologic, and dental implants. In orthodontic practice, stainless steel is used extensively for arch wires, brackets, bands, and hooks [4]. The first use of 18Cr–8Ni (wt.%) stainless steel as a material for implants was in 1926 [2,3]. The basic type 302 stainless steel was first used for this purpose. Later, the more corrosion-resistant types 304, 316, and 317 stainless steel were employed [2,3]. In the 1950s, 316L stainless steel was introduced. In the composition of AISI 316L, the carbon content was reduced to 0.03 wt.% in order to improve the corrosion resistance and weldability compared to 316 stainless steel [5]. The 18-8 grade stainless steel was the first stainless steel designed specifically to construct bone fracture plates and screws for human use [6]. Due to its lower cost compared to titanium and cobalt-based alloys and ease of manufacturing in combination with relatively high corrosion resistance, AISI 316L stainless steel soon became one of the most commercially available biomaterials for implant manufacturing [7,8]. However, its lower resistance to some forms of localized corrosion, such as pitting and crevice corrosion, led to its gradual replacement with higher corrosion-resistant materials including duplex steel [9,10,11,12].
Duplex stainless steel (DSS) has a structure consisting of approximately equal amounts of ferrite and austenite and is characterized by high mechanical strength, excellent corrosion resistance, and good weldability, which led to its widespread use in oil, chemistry, petrochemical, and food industries and occasionally in the medical industry [12]. These desired properties have enabled its usage in biomedical applications recently. Duplex stainless steel is defined as SS with a pitting resistance equivalent (PRE) value above 40. The DSS has high localized corrosion resistance which can be compared with the titanium alloys, due to its passive surface film, which is a consequence of the high percentage of chromium in the alloy, enhanced by the synergistic effect of alloying elements such as nitrogen and molybdenum. Results in several published papers have shown similar biocompatibility of austenitic and austenitic-ferritic steel. The replacement of austenitic stainless steel with austenitic-ferritic in orthodontic treatments reduces costs and nickel hypersensitivity in patients [9,10,11,12,13,14].
The corrosion resistance of austenitic stainless steels is proportional to their chemical composition, i.e., the content of alloying elements that enhance passive film stability and the absence of those that diminish it. The high corrosion resistance of austenitic stainless steels is due to the formation of 0.5 nm to 5 nm chromium oxide-hydroxide enriched passive layer in the presence of oxygen, which has self-healing properties [15,16,17,18,19]. Some authors suggested that the formed layer has a complex spinel-type passive structure which can be described as (Fe,Ni)O(Fe,Cr)2O3 [10,20]. Other authors claimed that the oxide film formed on stainless steel has a bi-layer type, with the inner layer mainly composed of chromium(III) oxide with a minor presence of oxidized iron, while the outer layer consists mainly of iron oxides and hydroxides [18,21,22]. The beneficial effect of molybdenum as an alloying element in stainless steel is visible through the improvement of the passivation properties of the formed oxide films and improved passivation behavior by deactivating pits growth [15,23,24]. Manganese acts as an austenite former and increases the solubility of nitrogen, but the presence of manganese usually leads to the reduction of pitting corrosion resistance which is associated with the formation of MnS inclusions which represent the weak spots for a pitting attack [15]. The primary function of the nickel is that this element acts as an austenite stabilizer but also has a beneficial effect in enhancing the corrosion resistance of stainless steel [15,25,26]. In previous studies, the presence of Ni in the form of NiO was determined in the outer part of the oxide film, but in significantly smaller quantities compared to its content in the alloy [27,28,29]. Recent research shows that initial dissolution rates of Ni, Mn, Mo, and Fe increased significantly during the initial anodic polarization of AM-316L and W-316L stainless steel in NaCl solution, which led to the depletion of these elements on the surface and the relative enrichment of Cr. After the active to a passive transaction, Ni and Mo enrichment of the surface begins, while relative depletion of Mn continues with increasing the anodic potential resulting from the enrichment of protective Cr2O3 in the surface oxide layer [30].
Body fluids represent a significantly aggressive media to the metallic materials, and interactions between the metallic implants and the surrounding tissue have high importance. The body-fluid chemical compositions are quite complex. However, the three most significant parameters regarding its corrosiveness are the presence of chloride ions, the concentration of the dissolved oxygen, and pH levels. Most body fluids have a pH of 7.4, a temperature around 37 °C, and a chloride concentration of around 0.9% NaCl. According to these parameters, body fluids appear to be slightly less aggressive than seawater [1]. As stainless steels have relatively high chromium and nickel concentration in their composition, dissolution of the implants and release of metallic ions in the tissue can cause adverse, toxic, or carcinogenic reactions and high biological risks for the patients. Performing the corrosion investigations of the metallic materials used in medicine, such as different types of stainless steel like in this manuscript, are very significant in searching for the optimal fields and improving existing solutions.
In this paper, the behavior of different types of stainless steel (AISI 304L, AISI 316L, and 2205 duplex steel) as biocompatible materials was studied by measuring the time change of the open circuit potential, using polarization methods (cyclic polarization and linear polarization) and electrochemical impedance spectroscopy at 37 °C, i.e., in simulated solution in the human body, i.e., phosphate-buffer saline solution (PBS). The measurements are divided into two main categories. At the very beginning, the corrosion behavior of the samples at high anode potentials (anodic corrosion) was considered, followed by the process of spontaneous corrosion at the open circuit potential, EOC.

2. Materials and Methods

Investigations were performed on AISI 304L and AISI 3016L austenitic stainless steels, as well as on 2205 duplex stainless steel (2205 DSS) with the chemical composition as given in Table 1.
Investigated materials were purchased from commercial sources (Ronsco, China) and were received in the form of 6 mm rods. Rods were cut into small cylindrical specimens using a metallographic cutting machine. The electrical contact was achieved by drilling samples and cutting M3 threads into which a copper M3 threaded rod was inserted. The stainless steel samples were then isolated with polyacrylate resin, leaving the opposite cylindrical base as a working surface that was in contact with the electrolyte when the electrode was immersed in the solution.
Prior to the electrochemical investigations, specimens were prepared by grinding the surface with the Metkon Forcipol 1 V grinder/polisher (Metkon Instruments Inc., Bursa, Turkey) from P180 up to P2500 grit. Final polishing was performed with the Metkon ALU-MIK 39-210 alumina suspension 0.3 µ, after which the electrode was ultrasonically washed with 70 % ethanol (5 min) and Millipore deionized water (5 min), and after that, transferred quickly to the electrolytic cell.
Measurements were conducted in phosphate-buffer saline solution (PBS), containing 8.0 g/L NaCl, 0.2 g/L KCl, 1.42 g/L Na2HPO4, and 0.24 g/L KH2PO4 (pH 7.4, T = 37 °C), with natural oxygen level.
Electrochemical measurements were performed with the EG&G Princeton Applied Research model 273A potentiostat-galvanostat paired with PAR M 5210 lock-in amplifier (Princeton, NJ, USA) for the electrochemical impedance measurements (EIS). The electrochemical cell was a conventional 200 mL double wall glass cell comprising of the working electrode, saturated calomel electrode as reference electrode, and Pt-sheet counter-electrode. The glass cell was connected to the refrigerated heating bath Huber Kiss K6 with the flexible silicone hose to ensure a constant temperature in the electrochemical cell.
Anodic corrosion of AISI 304L, AISI 316L, and 2205 DSS was investigated by cyclic polarization (CP) measurements. CP curves were recorded over a wide potential range (from −0.35 V vs. open circuit potential (EOC) to 0.6 V and back to −0.35 mV vs. EOC; in the case of 2205 DSS, the upper limit of polarization is extended to 1.2 V). CP measurements were performed with a scan rate of 1 mV s−1 after 60 min stabilization of tested samples in PBS solution at EOC.
During the spontaneous corrosion study, for each sample separately, the change in EOC, then the change in polarization resistance (Rp), as well as the impedance (Z) of the phase boundary of the (AISI 304L, AISI 316L, 2205 DSS)/PBS solution over a period of 10 days were monitored. Linear polarization measurements (for Rp determination), were recorded in a potential range ± 20 mV vs. EOC with a scan rate of 0.2 mV s−1. Electrochemical impedance spectroscopy (EIS) measurements were performed in the frequency range of 50 kHz to 30 mHz with 5 points per decade and an AC voltage amplitude of 10 mV. All electrochemical measurements were performed in triplicate to ensure reproducibility of results.
After the anodic corrosion (i.e., after reaching the upper limit of anodic polarization (for each sample) and after spontaneous corrosion, the surface of the tested samples was investigated using the light microscope MXFMS-BD, Ningbo Sunny Instruments co. with the magnification of 200 times. Finally, field emission scanning electron microscope (FEG SEM) Thermo Scientific Quattro S (FEG SEM, Hillsboro, OR, USA) with attached EDS SDD detector Ultim® Max, Oxford Instruments for semiquantitative analysis was used to observe the morphology of the corrosion product after the electrochemical tests, and to identify the elemental composition in some characteristic areas of the sample surfaces.

3. Results and Discussion

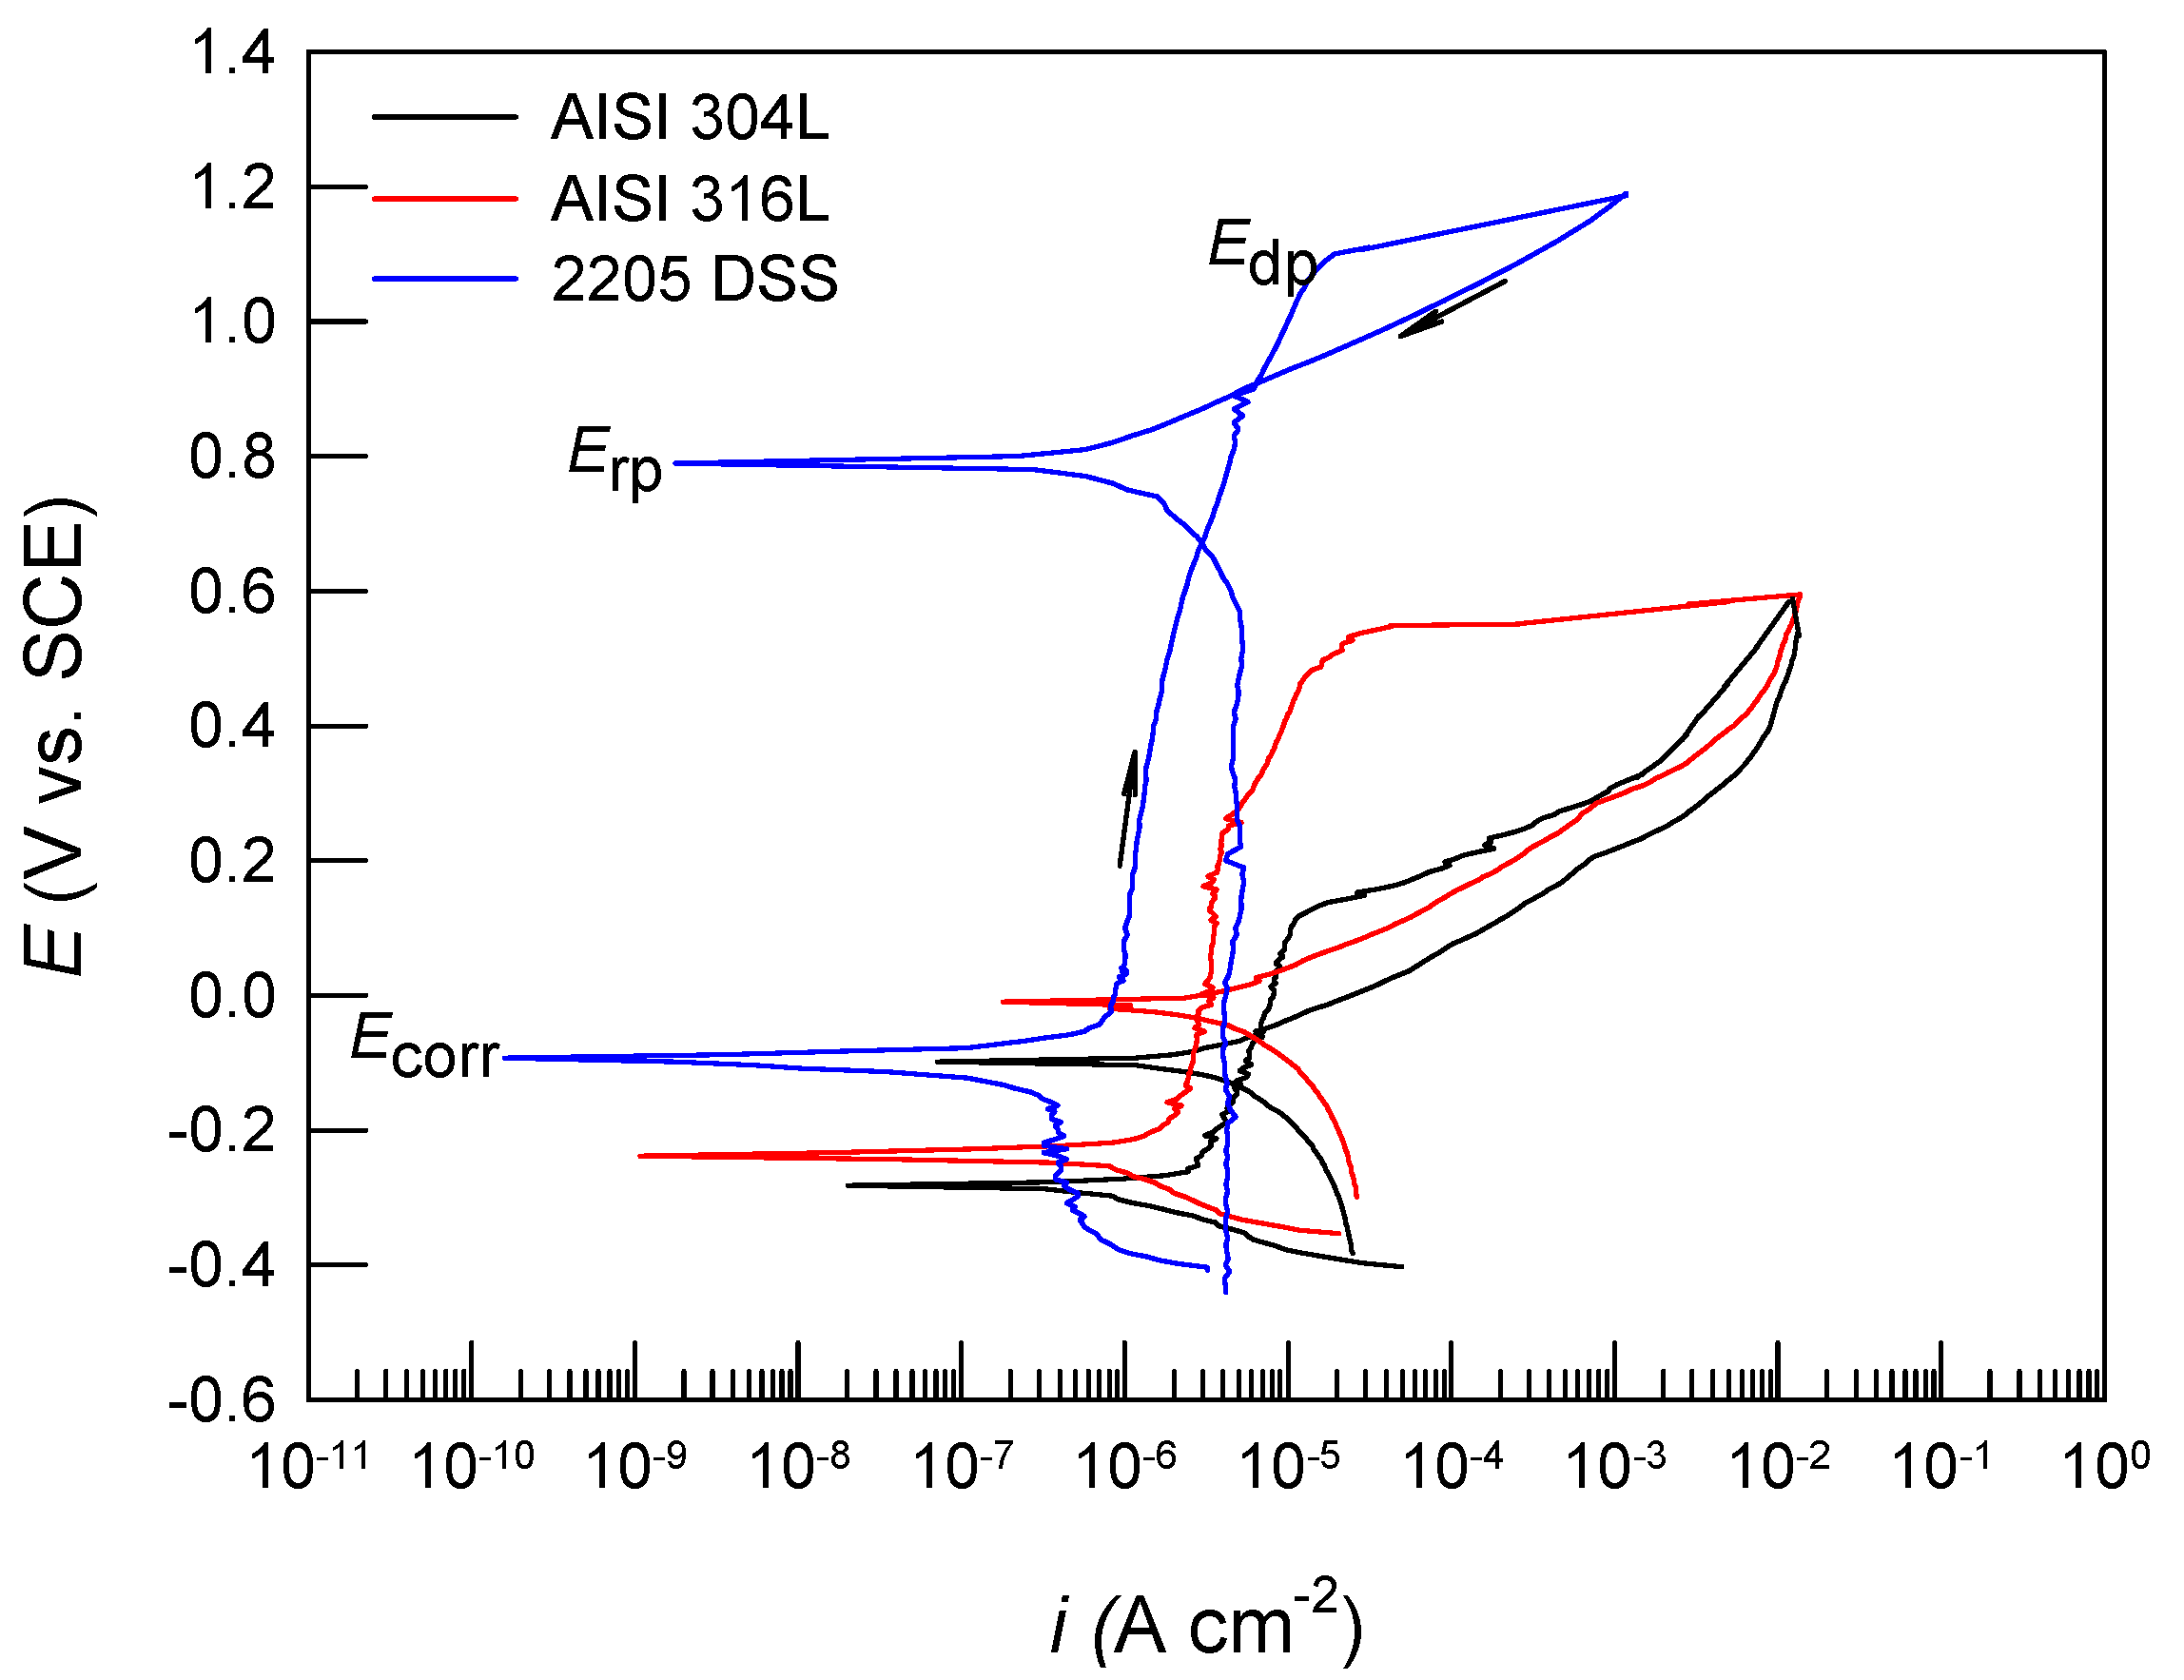
3.1. Anodic Behavior of AISI 304L, AISI 316L, and 2205 DSS in PBS Solution

Results of the cyclic polarization (CP) measurements are shown in Figure 1, where the arrows show the potential change direction. Characteristic potentials are also highlighted in Figure 1 and given in Table 2.
The purpose of these measurements was to determine the characteristic corrosion parameters and predict the anodic behavior of the tested samples, assessing their possibility of passivation and repassivation in PBS solution.
The starting point in CP curve analysis is the corrosion potential (Ecorr) which is −0.286 V for AISI 304L, −0.238 V for AISI 316L, and −0.108 for 2205 DSS (Table 2). Ecorr determines the energy required for the corrosion reaction [31]. So, the more positive the Ecorr, of a certain material, the slower the corrosion process should be because it requires more energy [31]. At potentials lower than Ecorr (cathode potentials), the polarization curve most likely reflects the hydrogen evolution reaction.
However, such measurements are more interesting for the purpose of examining the anode behavior of the corrosion system (potentials more positive than Ecorr). The potential of the sample changes slowly in the positive direction and acts as an anode, corroding or forming an oxide film on its surface.
Three potential regions are observed on the anodic branch of polarization curves (potentials more positive than corrosion potential, Ecorr): active, passive, and metal depassivation regions. In the active potential range, the steel samples dissolve, metal ions go into the solution, and the current increases exponentially with increasing potential (i.e., a linear increase in the logarithm scale of the anode current density with potential is observed on the polarization curve).
In an aqueous electrolyte solution, metal ions come into contact with OH ions (formed by water ionization) and form hydroxides that cover the metal surface, which further slows down the process of metal dissolving. In the process of dehydration, the metal hydroxide turns into the corresponding oxide.
During further anodic polarization at the passivation potential (Ep), the passivation limit current (ip) is reached, and the dissolution rate of the metal becomes equal to the rate of oxide film formation. By further increasing the potential, the metal dissolution rate significantly slows down the process of oxide film formation.
Eventually, the surface of the metal is completely covered with an oxide film, and the current becomes independent of the potential change. A more or less defined “current plateau” is established on the polarization curve. Namely, the “current plateau” (the independence of the current on potential in the potentiodynamic conditions of the experiment) is associated with the growth (thickening) of the oxide film by ionic conductivity involving some transport process driven by the electric field in the oxide layer [32].
Further anodic polarization achieves the depasivation potential or pitting potential (Edp), which is 0.208 V for AISI 304L, 0.559 V for AISI 316L, and even 1.120 V for 2205 DS (Table 2). At the depasivation potential, the oxide layer is destroyed, and local dissolution of the metal, with a sharp increase in current, is observed on the polarization curve. However, as the observed samples have different corrosion potentials, the range of passive potentials (of each individual sample) is more precisely determined by the potential difference indicated as ΔE = EdpEcorr, which increases in order: AISI 304L < AISI 316L < 2205 DSS).
After reaching the upper limit of anodic polarization, the potential of the electrode is returned to the initial value, after which all tested samples show a response with a negative current hysteresis. Generally, a negative hysteresis occurs when the current at the return potential change is less than at the initial, upward potential change. A positive hysteresis occurs when the current at the reverse potential change is higher than at the ascending potential change [33].
As already mentioned, when the potential changes to Edp, the current increases sharply due to oxide film destruction and local metal dissolution with the creation of minor damages or pits. When the potential changes back and the repassivation potential (Erp) is reached, there is a possibility that the oxide film is regenerated (i.e., small pits on the metal are repassivated) or that the oxide remains permanently destroyed. It is generally believed that pits will continue to grow spontaneously when Ecorr is greater than Edp and pits will not grow when Ecorr is less than Edp [33]. In accordance with this statement, it can be seen (Figure 1) that all samples are prone to repassivation (the damages of oxide film on all samples have a tendency of self-healing).
In addition to the above, a better insight into the susceptibility of materials to local corrosion can be obtained by an additional analysis of characteristic potentials in CP curves, Ecorr, Edp, and Erp [34,35,36].
  • The potential difference of EdpEcorr (in addition to the above marked as ΔE and represents the range of passive potentials) is an indication of the pitting initiation rate; the higher it is, the slower the pitting initiation rate occurs.
  • The potential difference of ErpEcorr describes how a metallic material can repassivate (pits no longer grow). The more positive this potential difference is, the easier a certain metallic material can repassivate.
  • The potential difference of EdpErp is the indication of the extent of crevice corrosion resistance (the lower the EdpErp, the higher the resistance towards crevice corrosion).
The complete analysis of CP curves determined: corrosion current, icorr, passivation current, ip, and characteristic potentials, Ecorr, Ep, Edp, Erp, as well as potential differences of EdpEcorr, ErpEcorr, EdpErp, and the obtained values are given in Table 2. It can be seen that 2205 DSS has the smallest icorr and more positive Ecorr value, which indicates good corrosion stability of this material. In addition, the widest passivation region, ΔE, was observed in this material, which indicates its excellent corrosion stability. According to the above data, icorr and ip are decreasing, while Ecorr, Ep, Edp, and Erp have more positive values in order: AISI 304L < AISI 316L < 2205 DSS. In the same order, the tendency of the material towards local corrosion decreases (higher EdpEcorr difference), the possibility of repassivation increases (more positive ErpEcorr difference), and the more resistance to local corrosion increases (smaller EdpErp difference).
After reaching the upper limit of anodic polarization (which for AISI 304L and AISI 316L steels was 0.6 V, and for 2205 DSS was 1.2 V), electrode surfaces were observed by light microscopy, and the results of investigations are shown in Figure 2. Images show clear differences in the corrosion damages depending on the tested alloy. On AISI 304L and AISI 316L, corrosion products appear uniformly distributed along the whole surface; on 316L alloy, surface damages are generally smaller than on 304L and probably shallower. The 2205 DSS surface is almost clear of any corrosion damage.
The surface morphologies (with higher magnification using SEM) of all samples are shown in Figure 3. As can be seen at the same level of magnification, the anodic polarization causes damage to the AISI 304L which covers a higher surface area than AISI 316L. Furthermore, with the highest magnification, the surface of the duplex steel is smooth and flat, with almost no signs of the corrosion process. On the surface of AISI 304L and AISI 316L, some pits are also observed, however they are mostly covered with corrosion products. It should be noted that the percentage of flat smooth surfaces for test specimens increases in order: AISI 304L < AISI 316L < 2205 DDS.

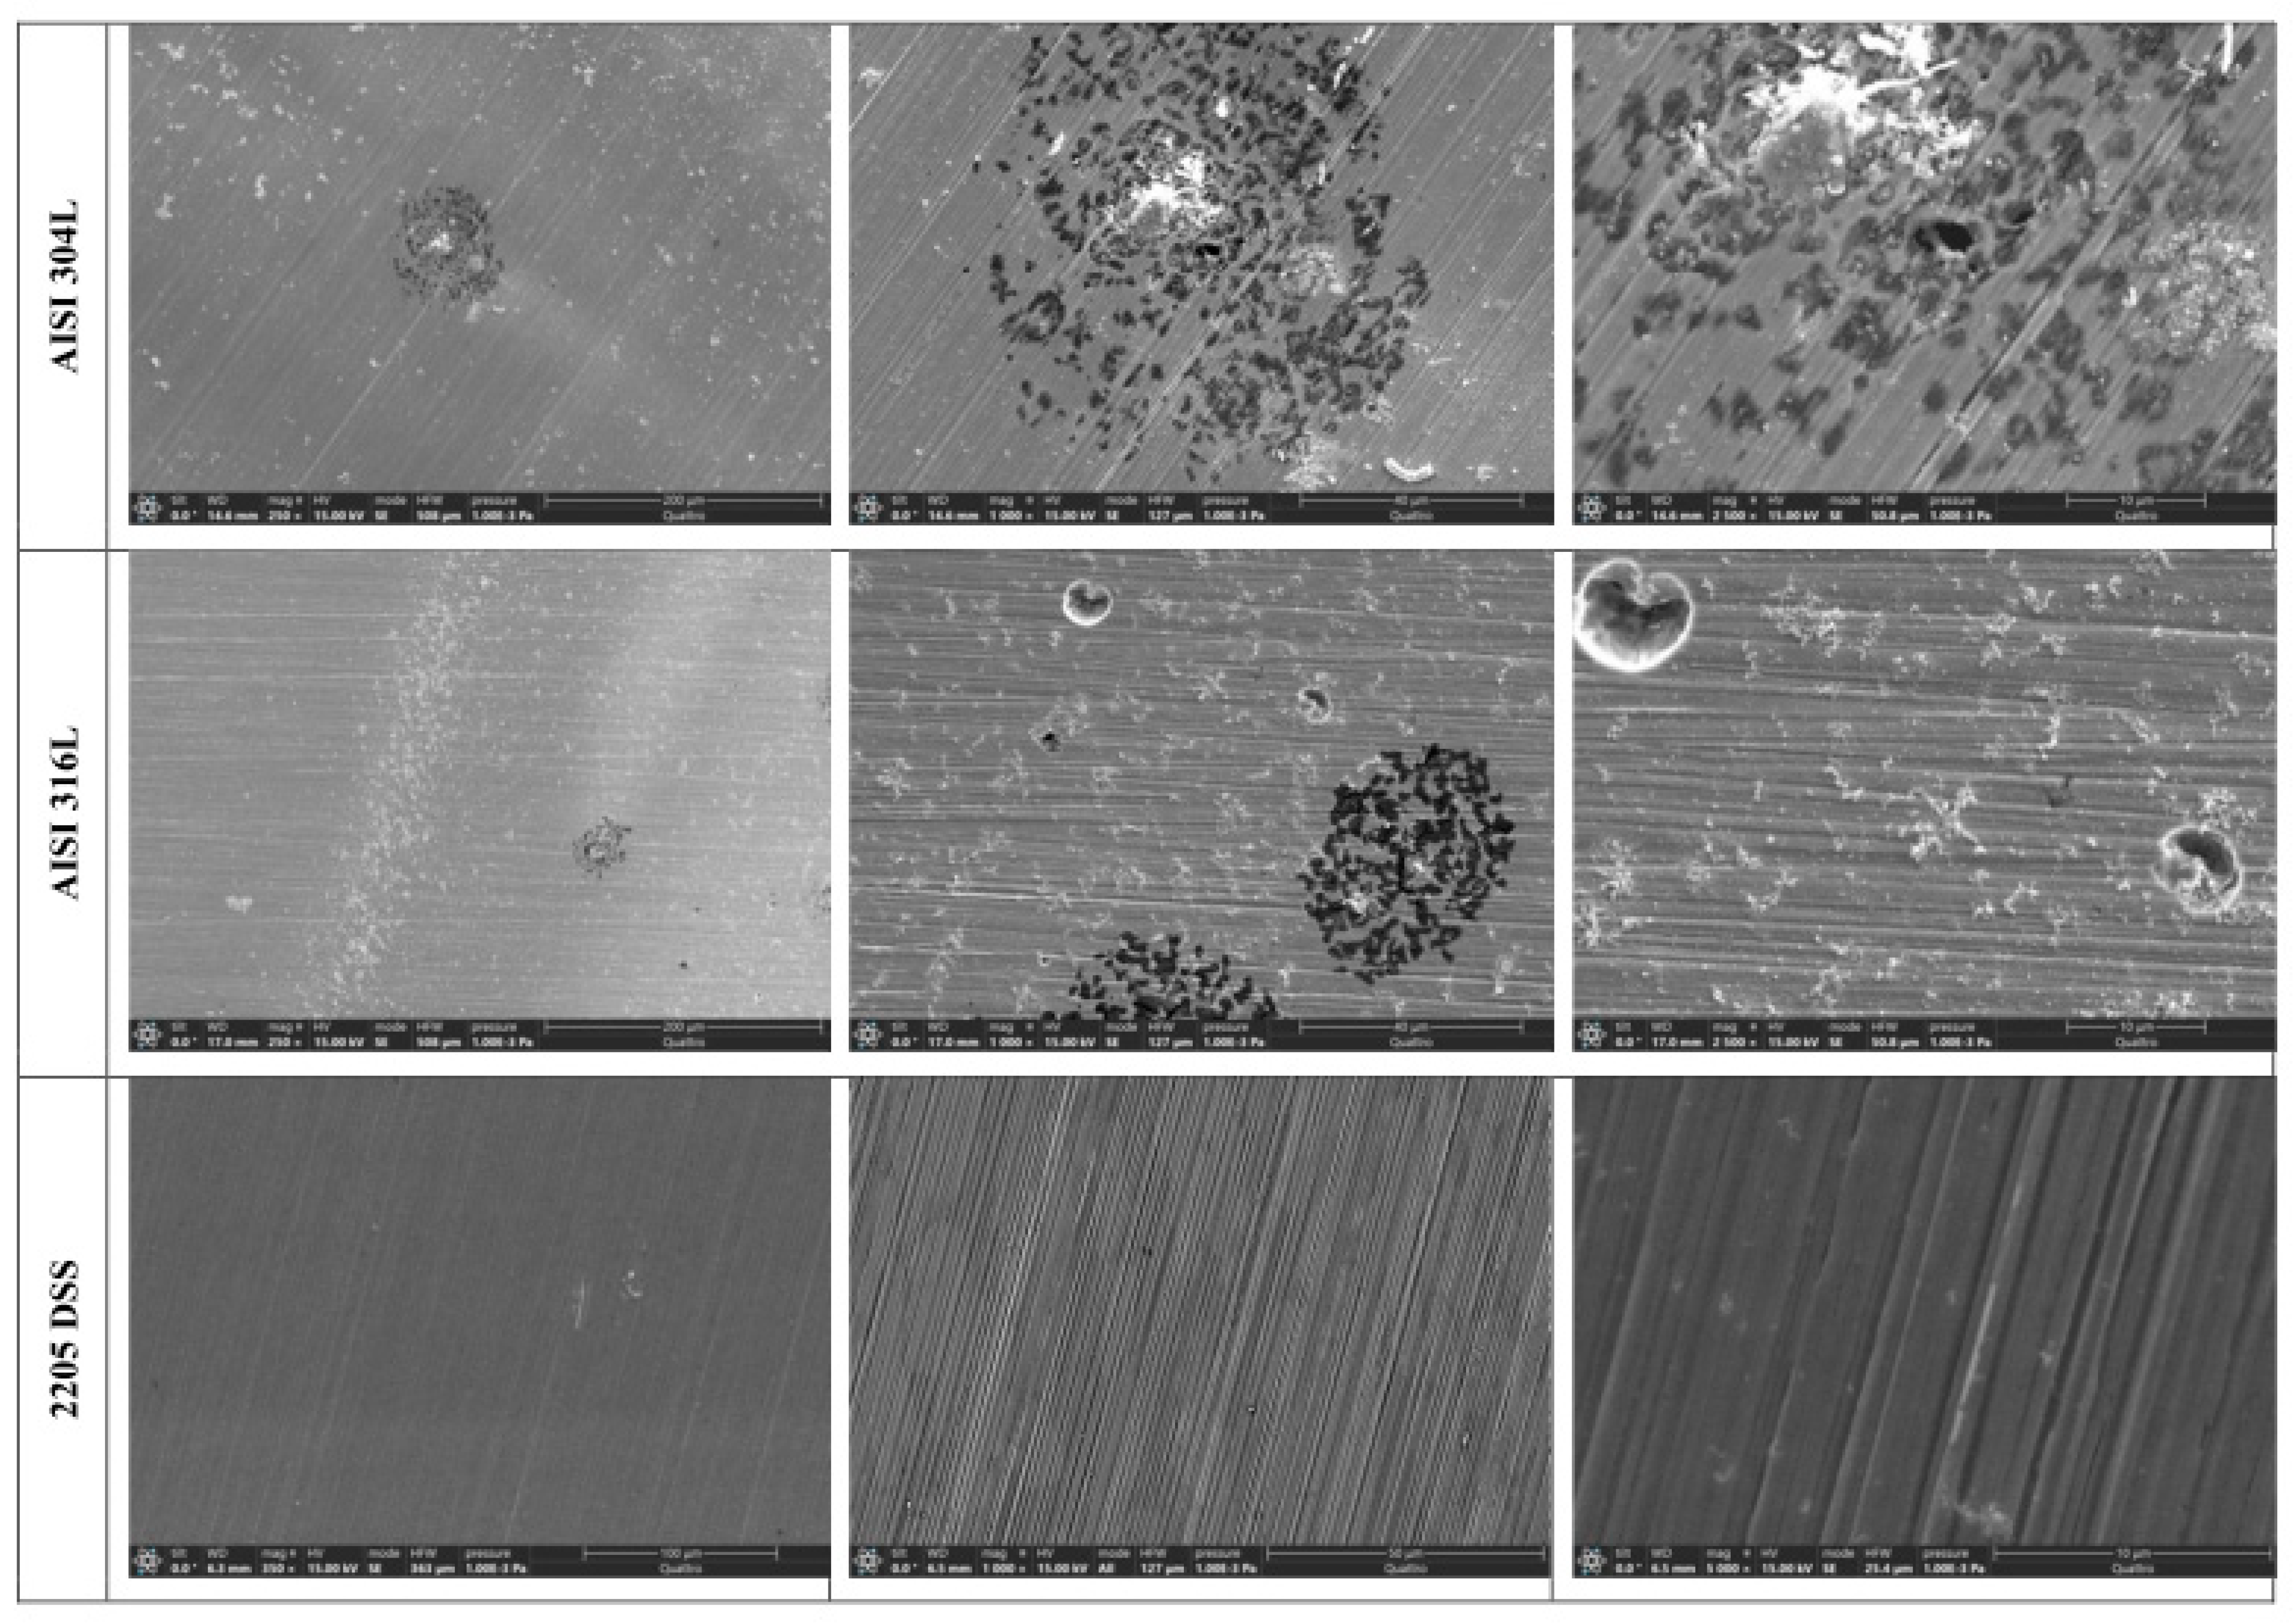
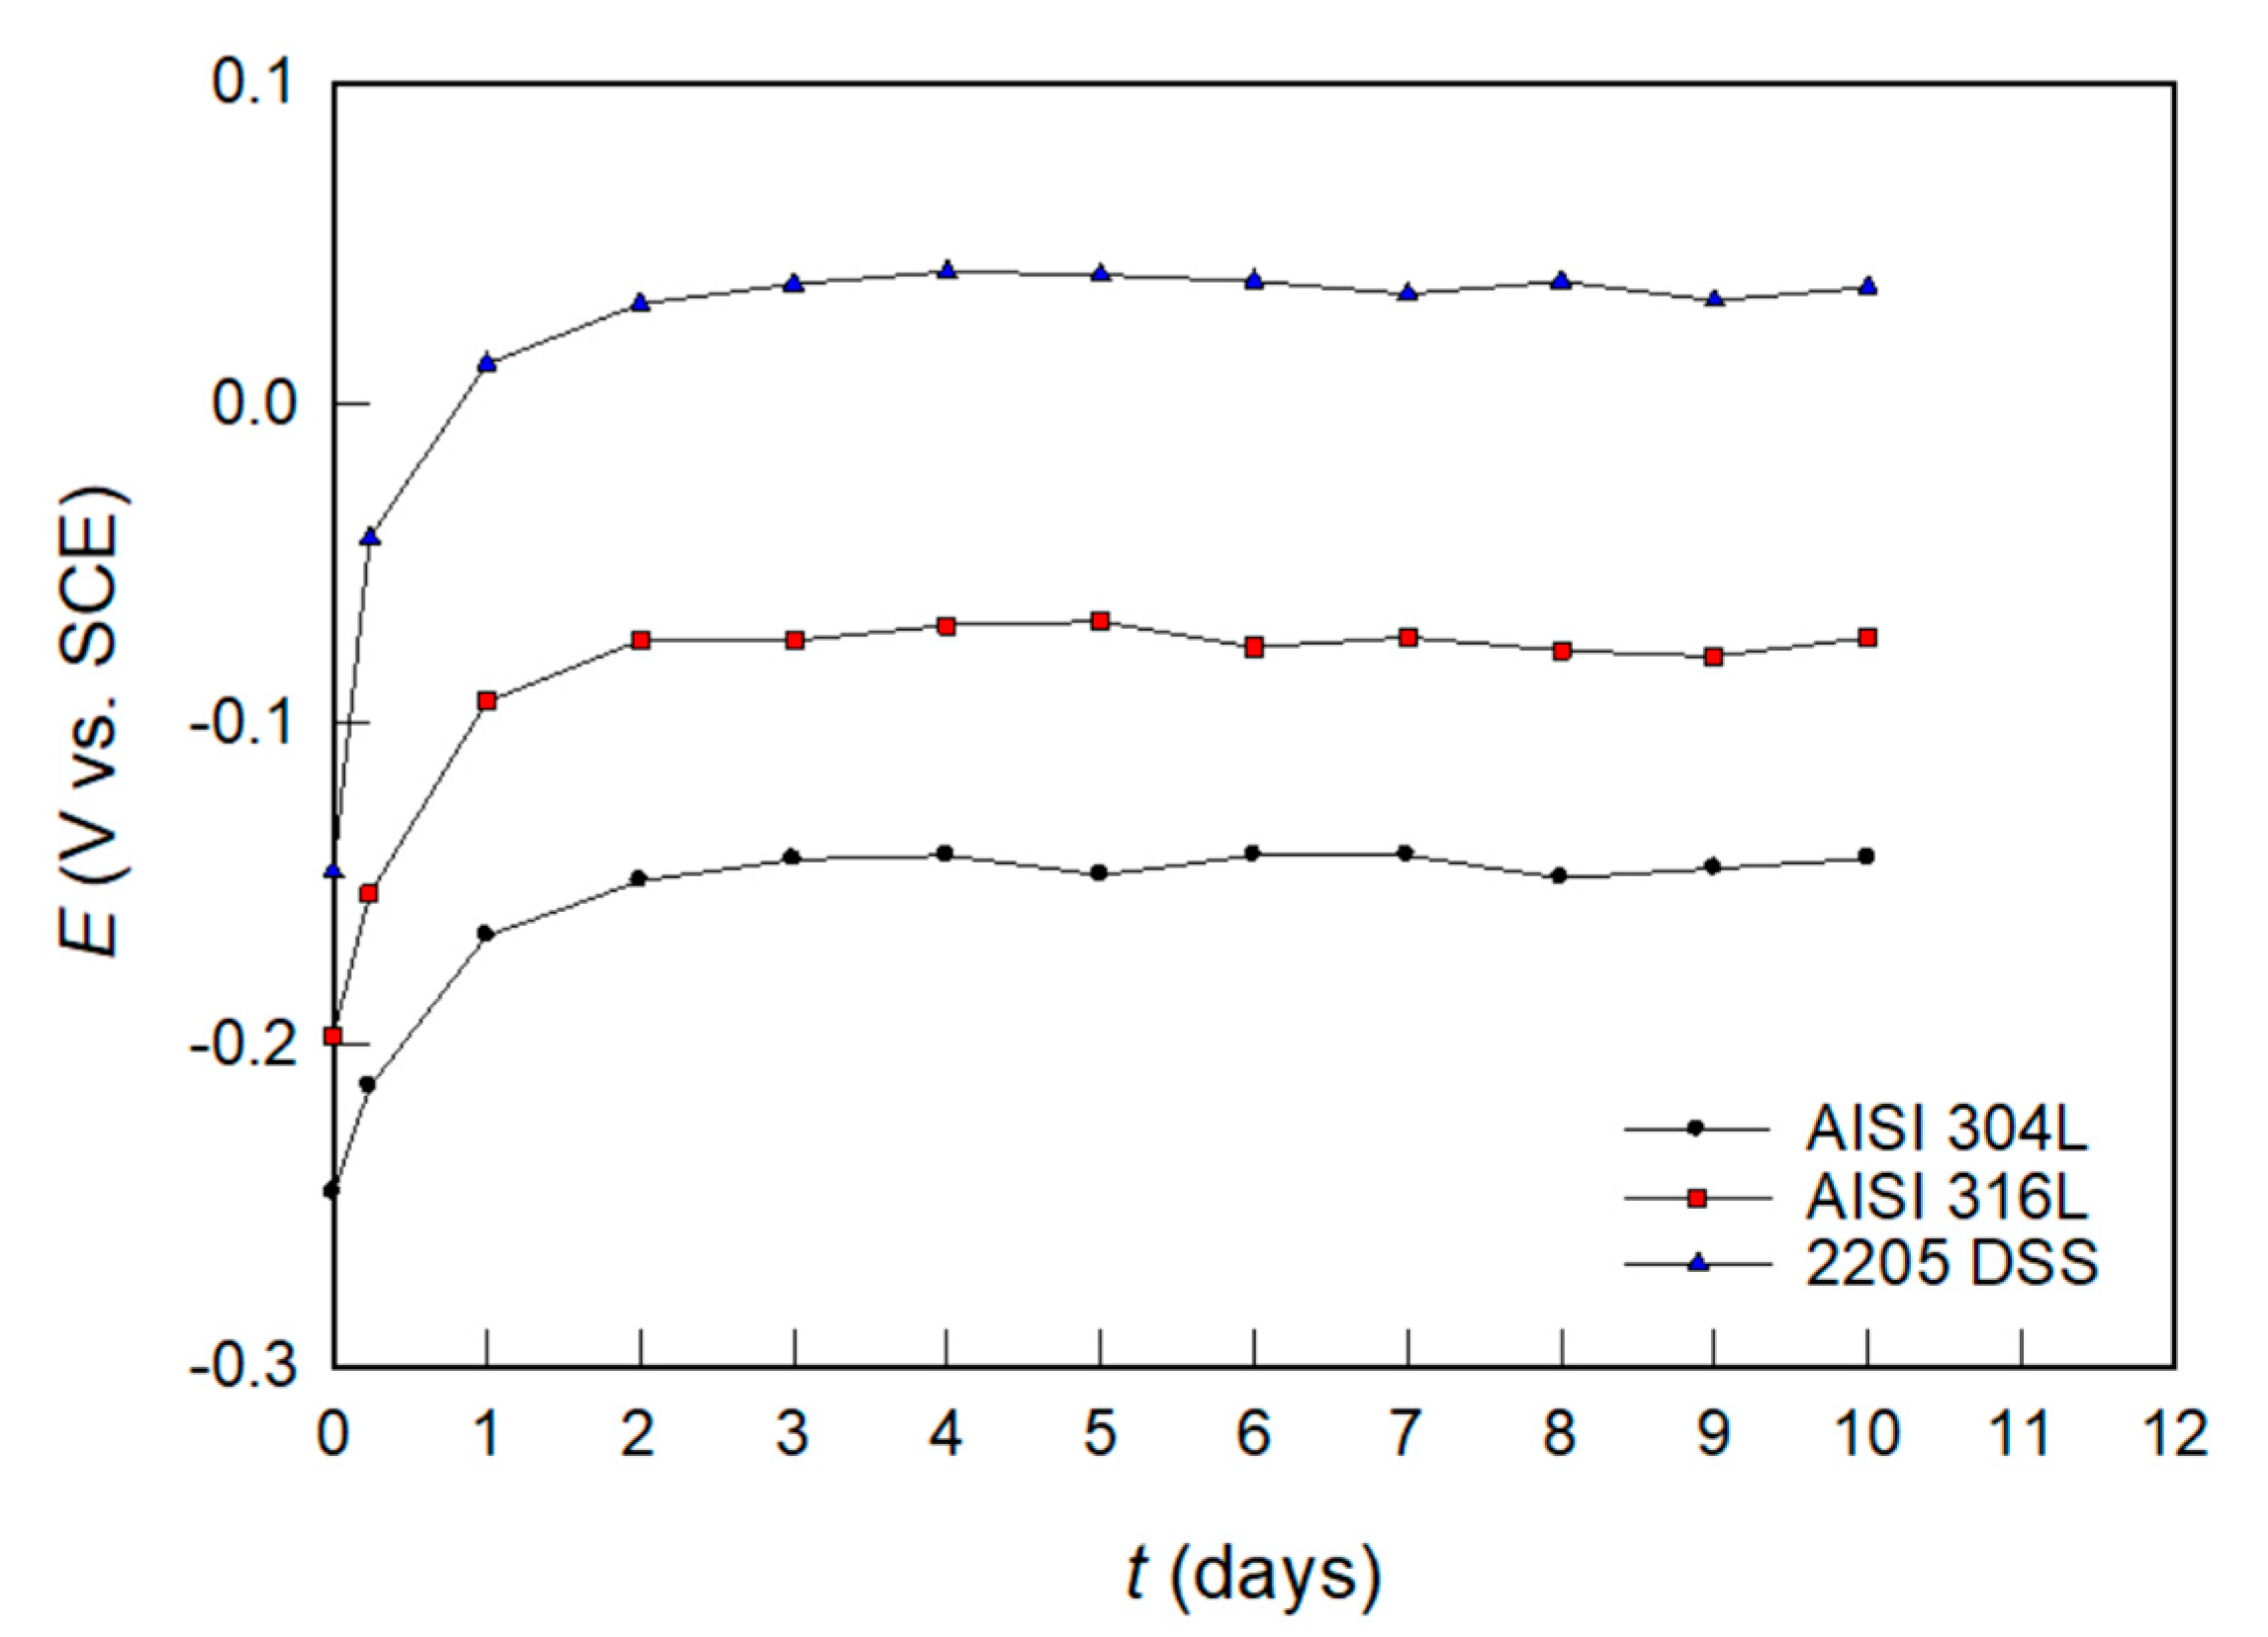
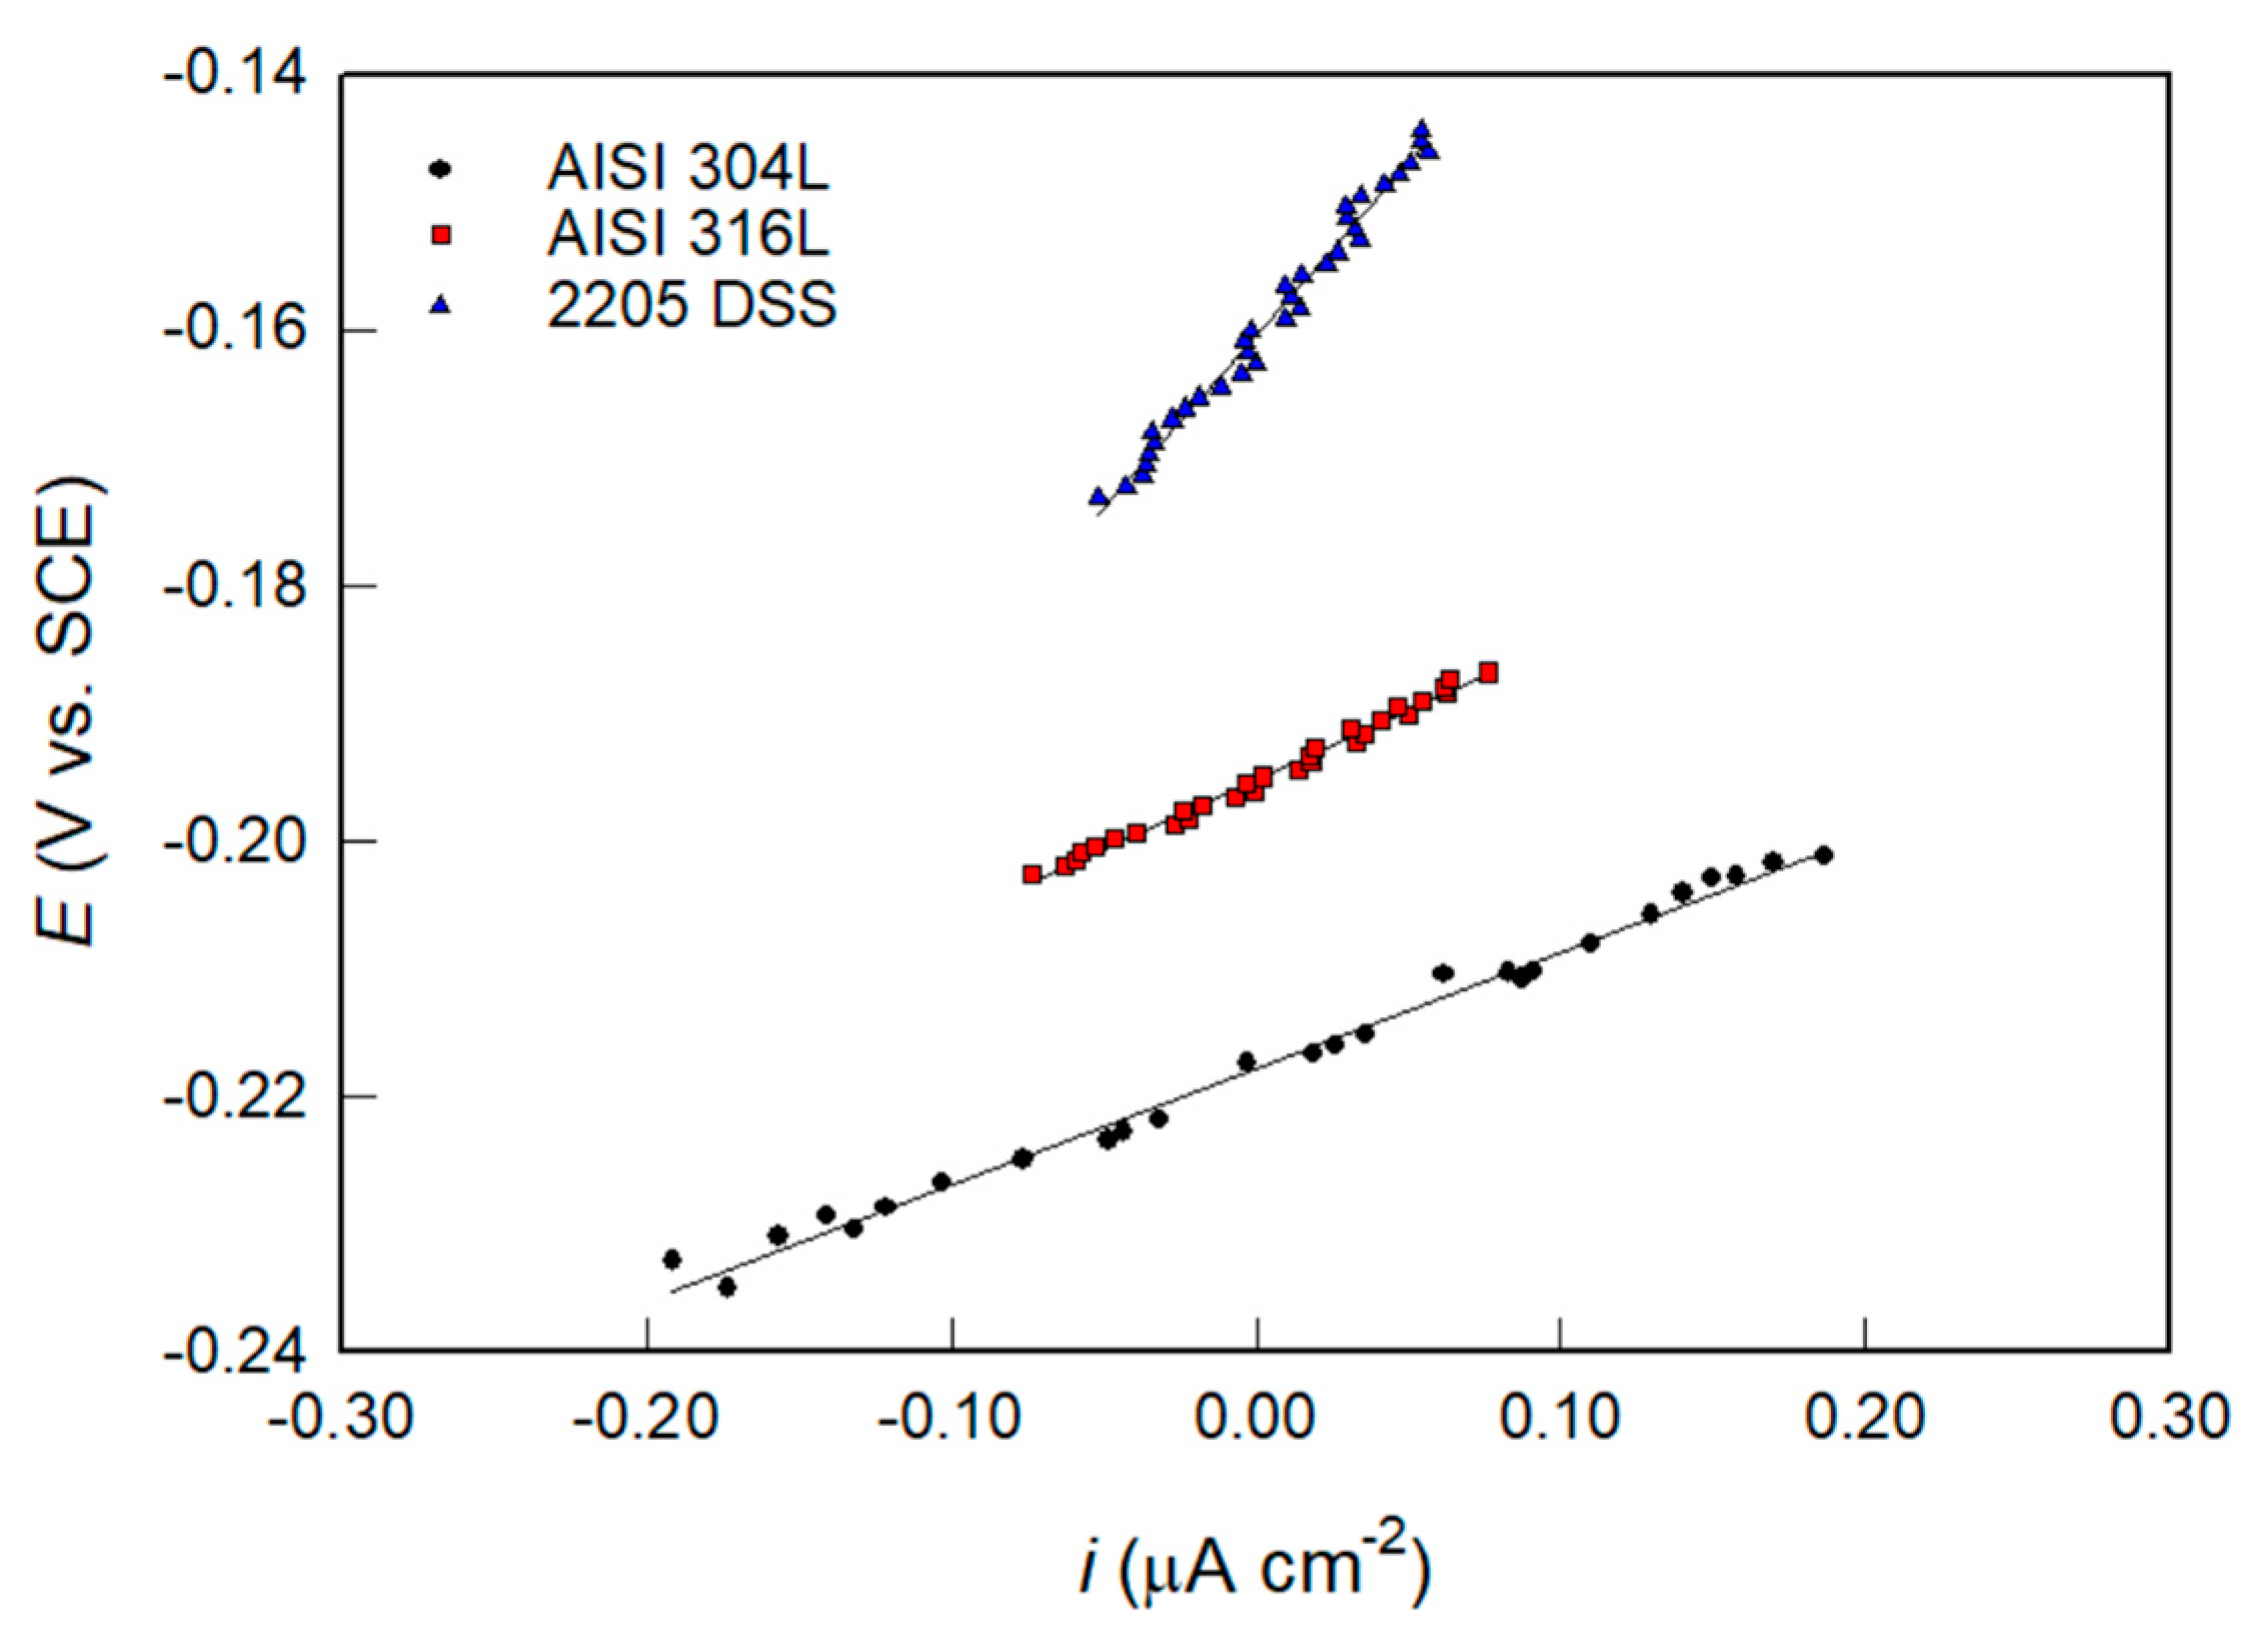
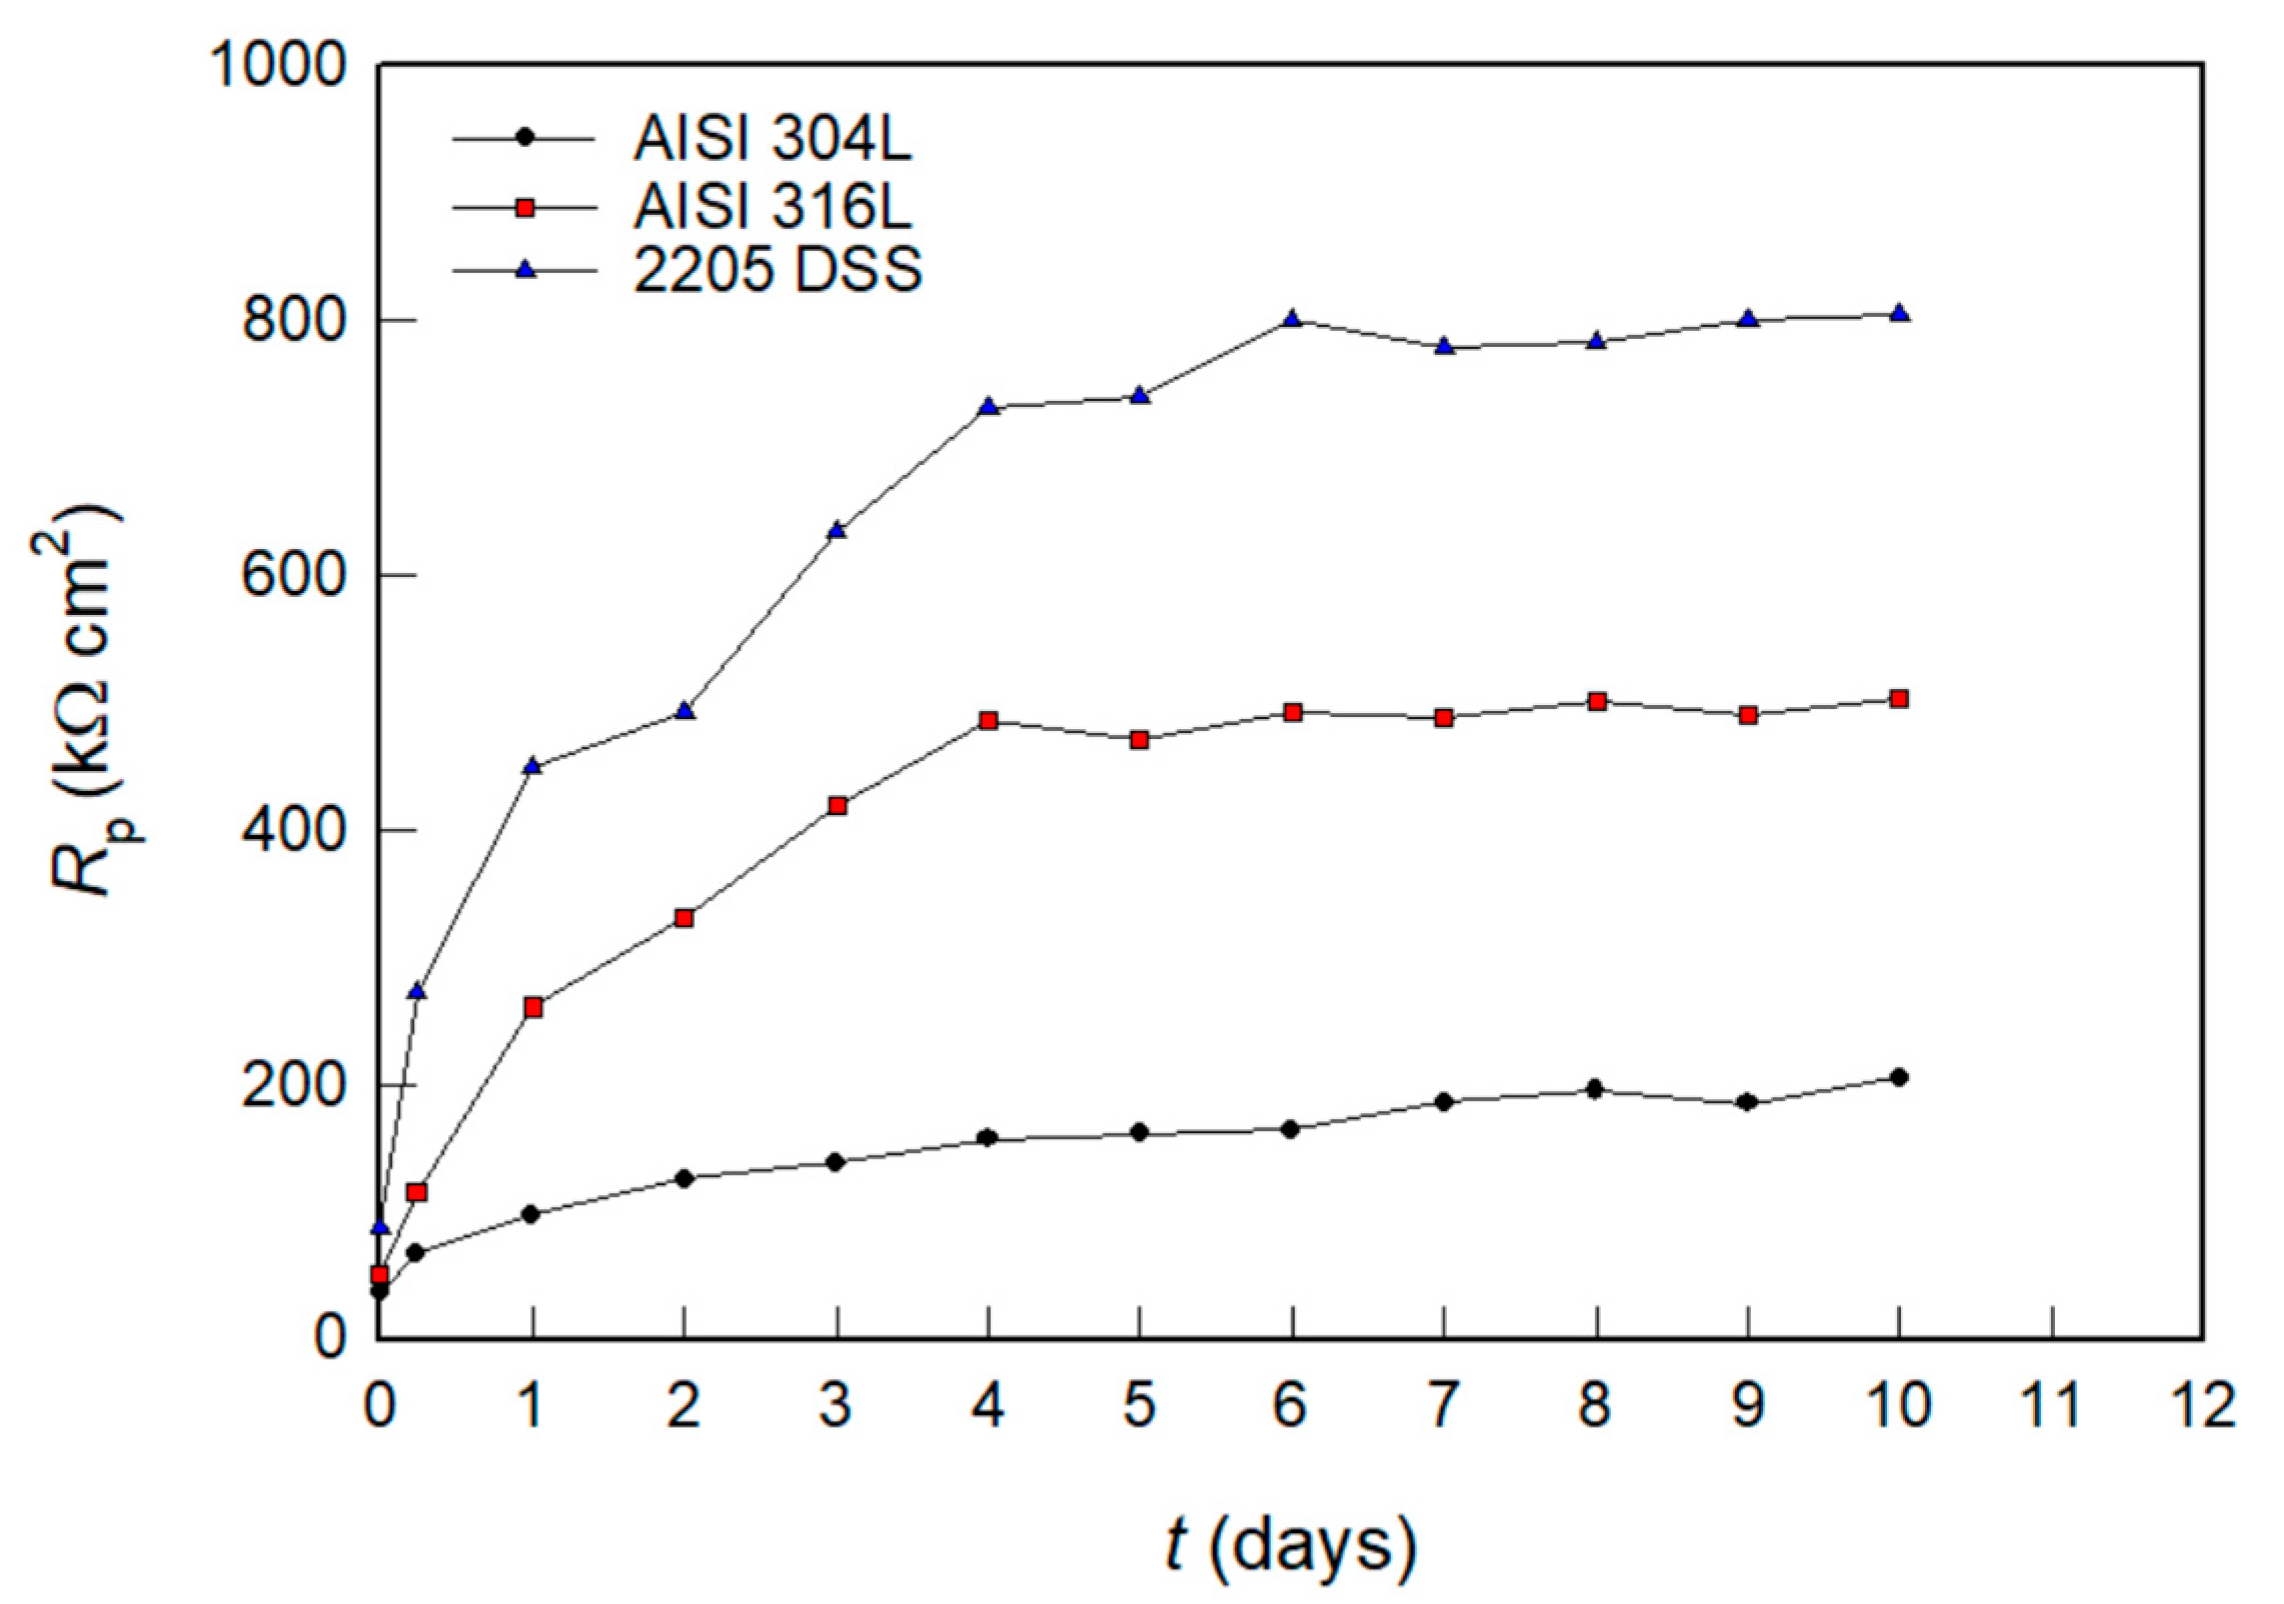
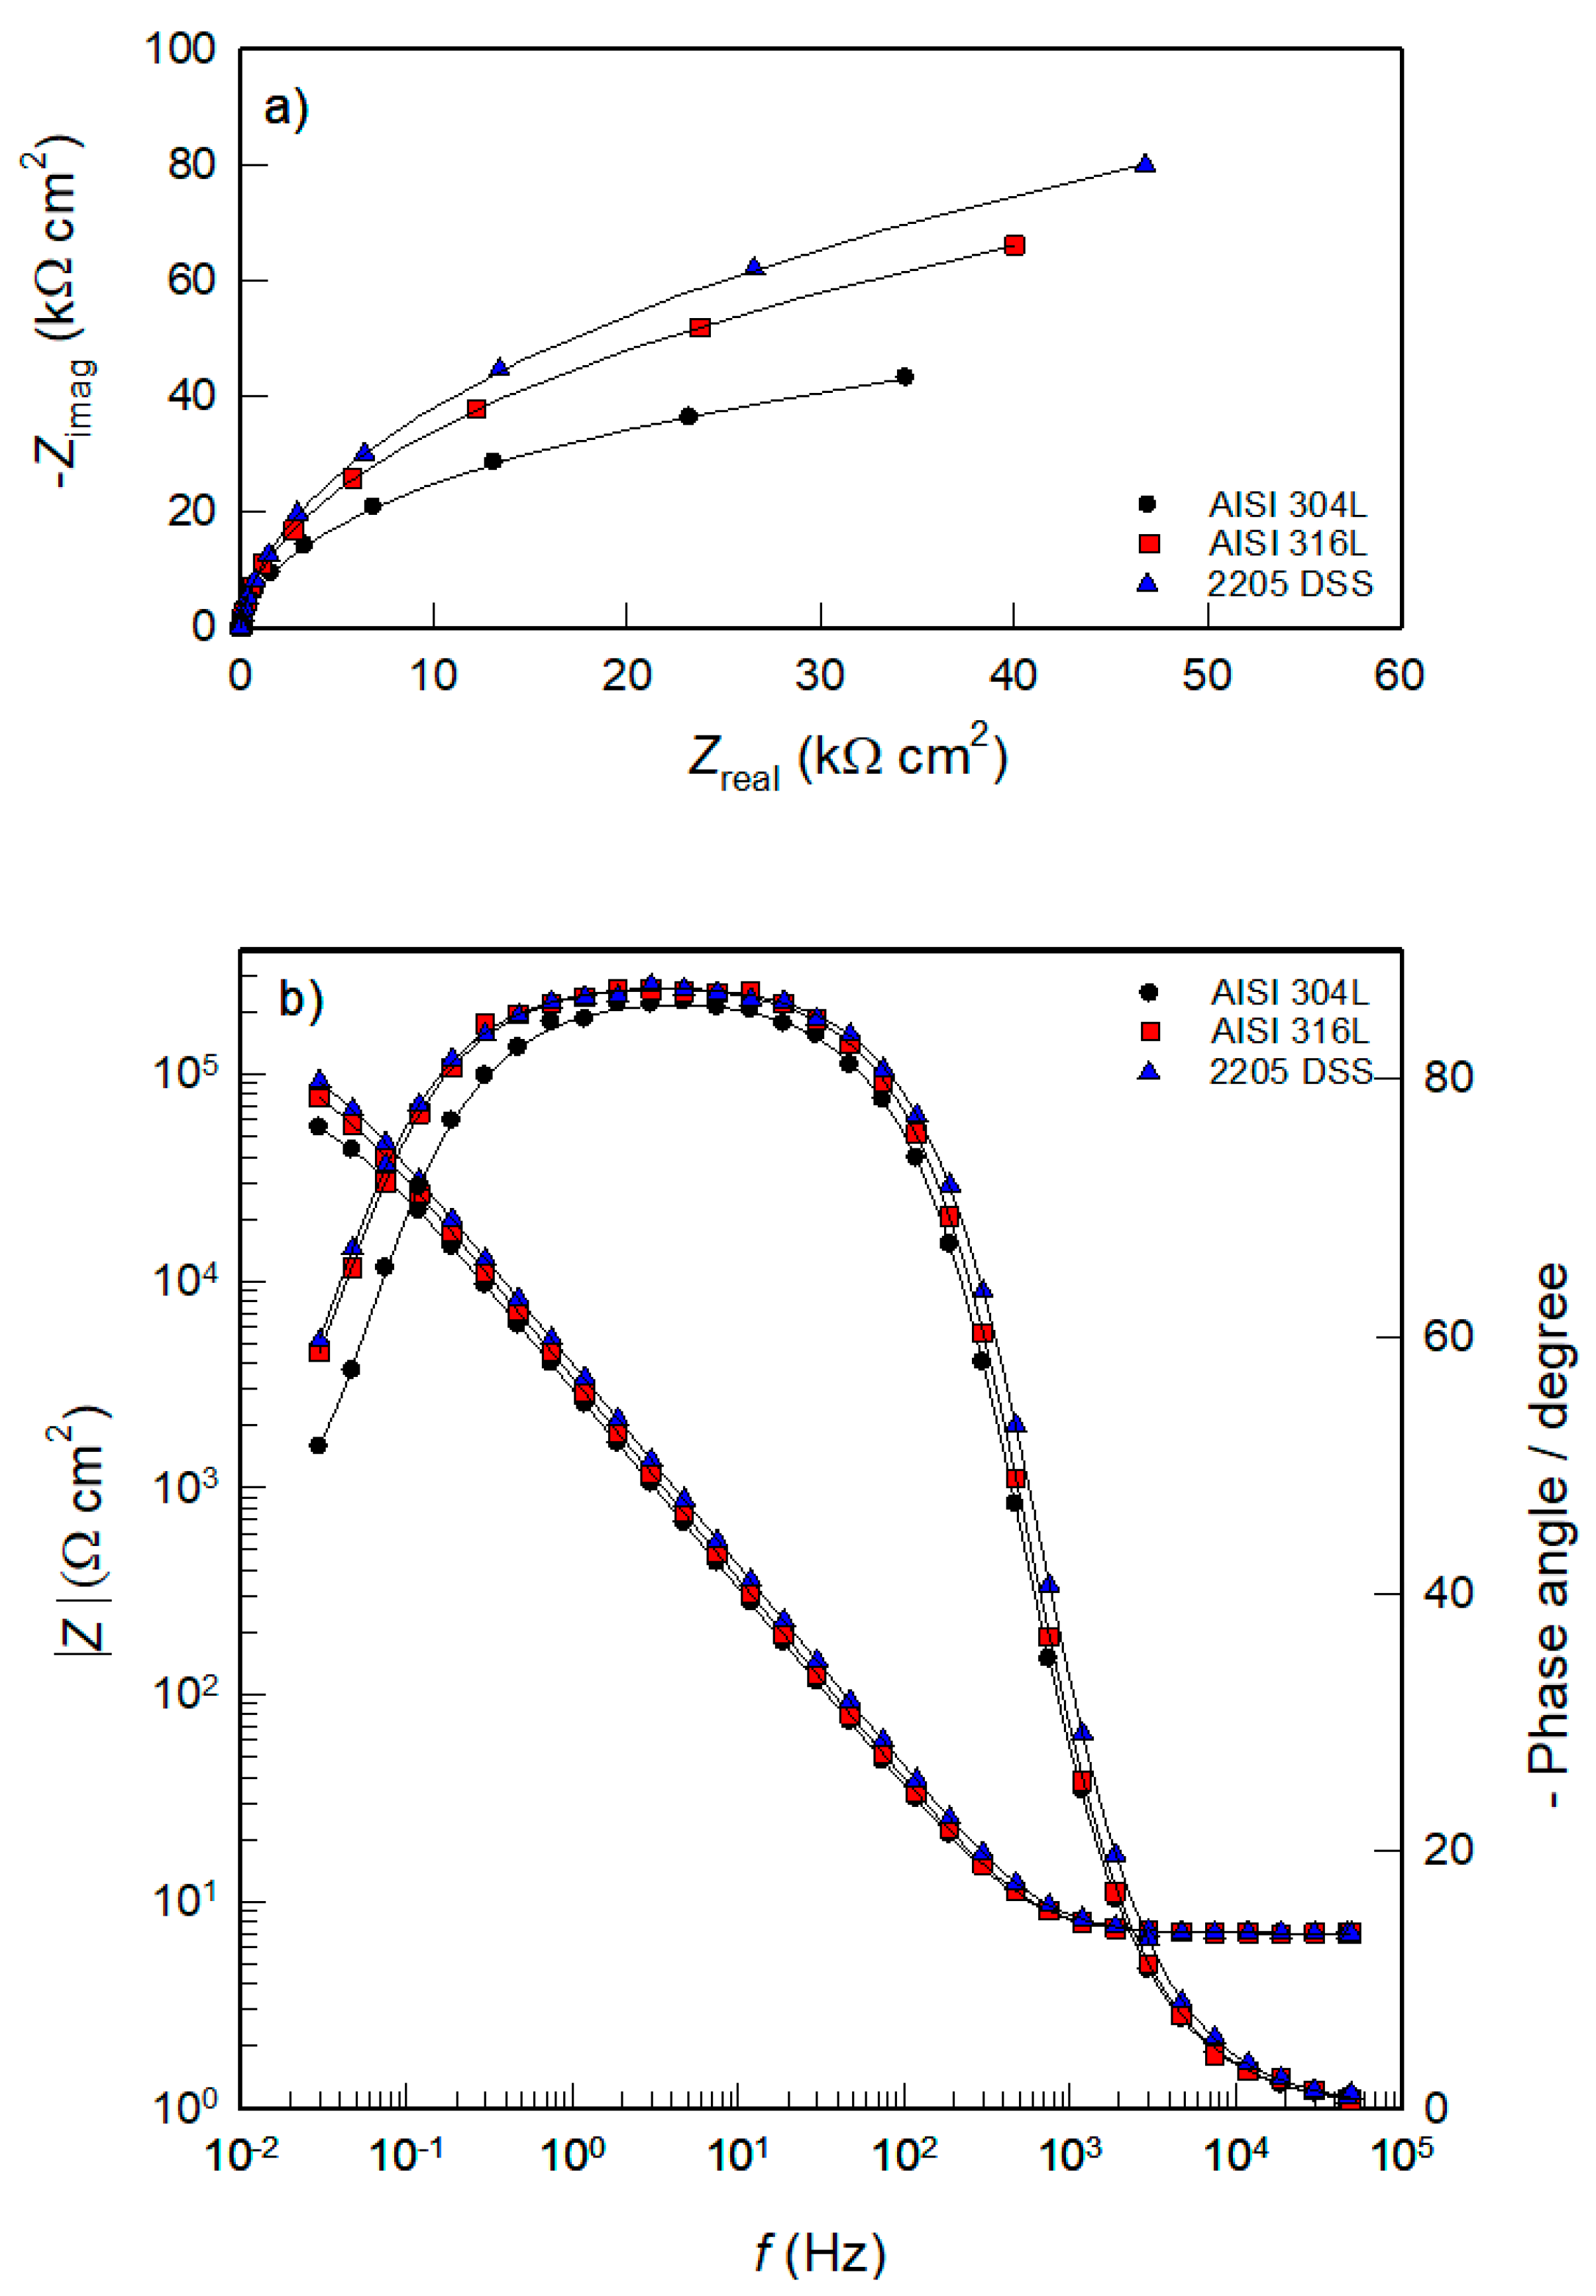
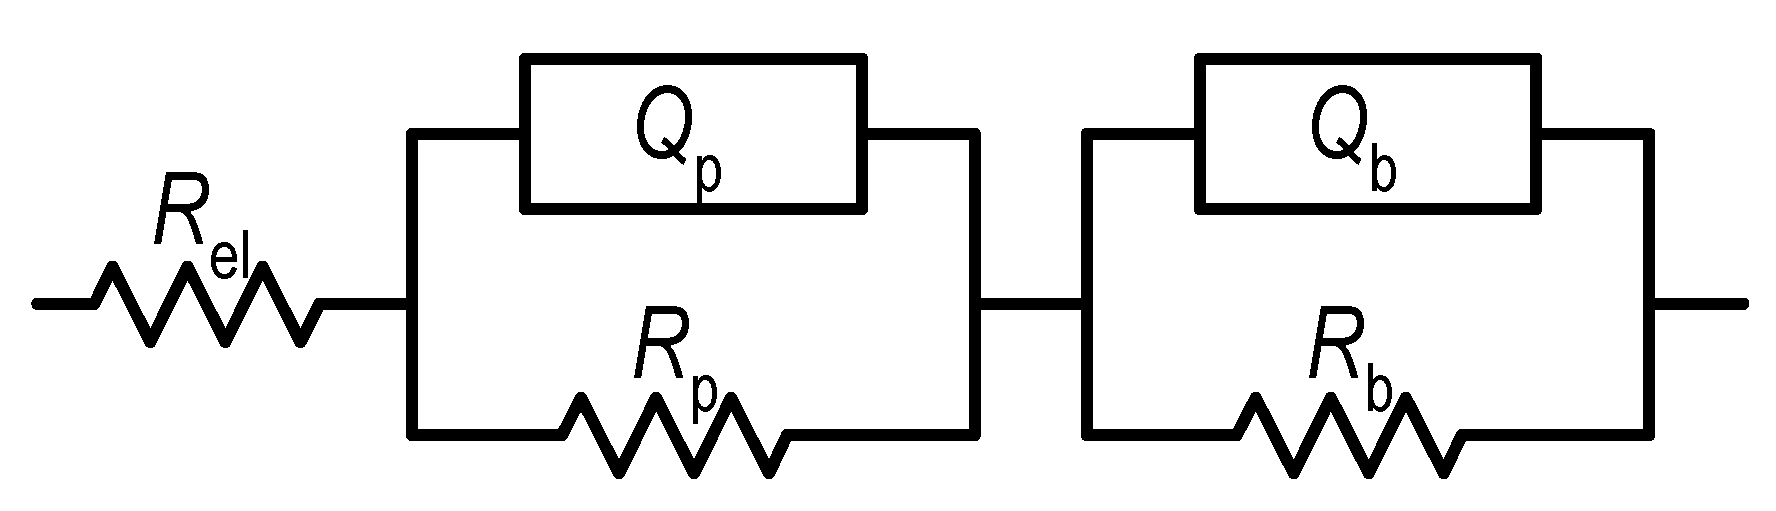
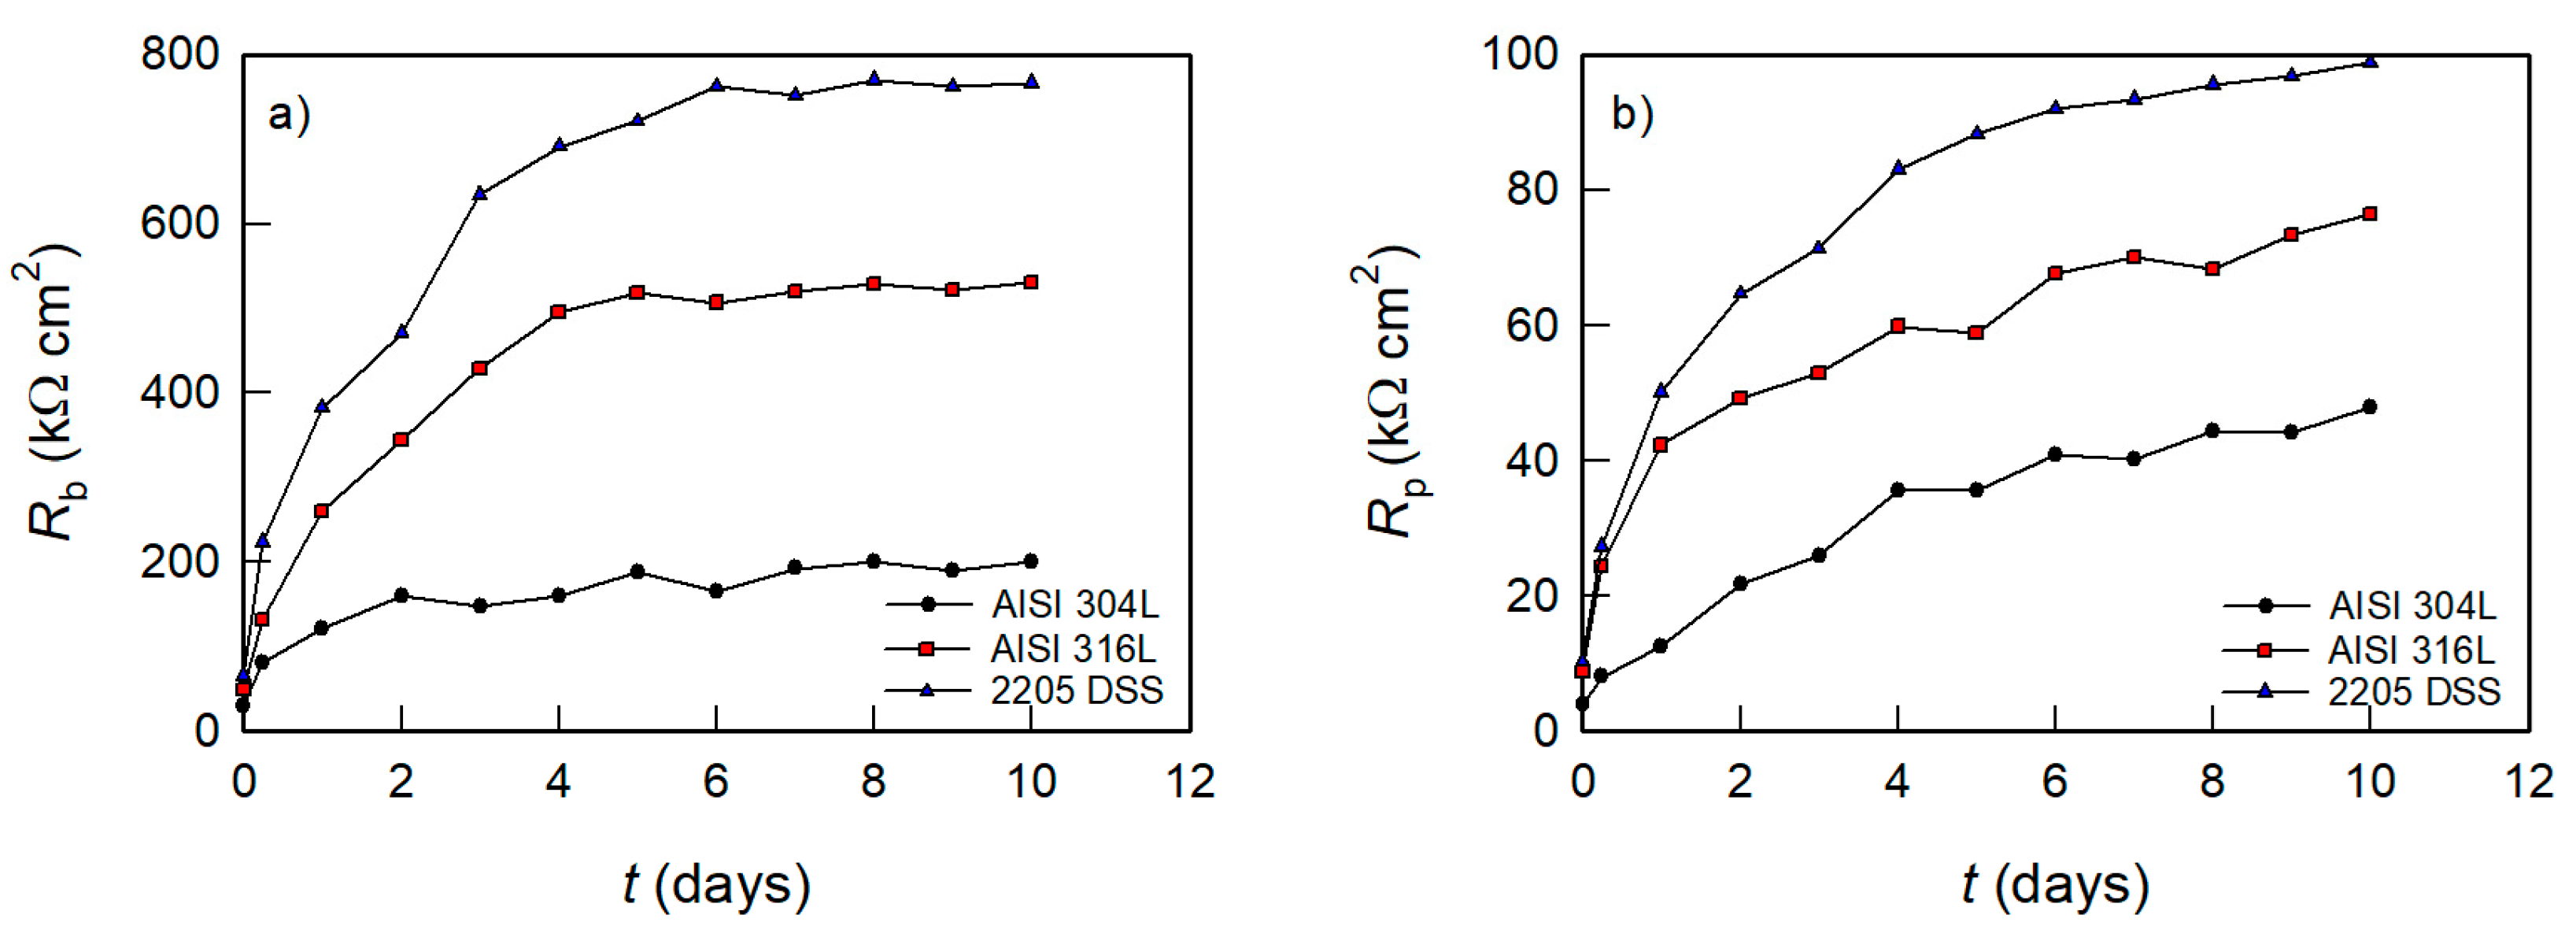
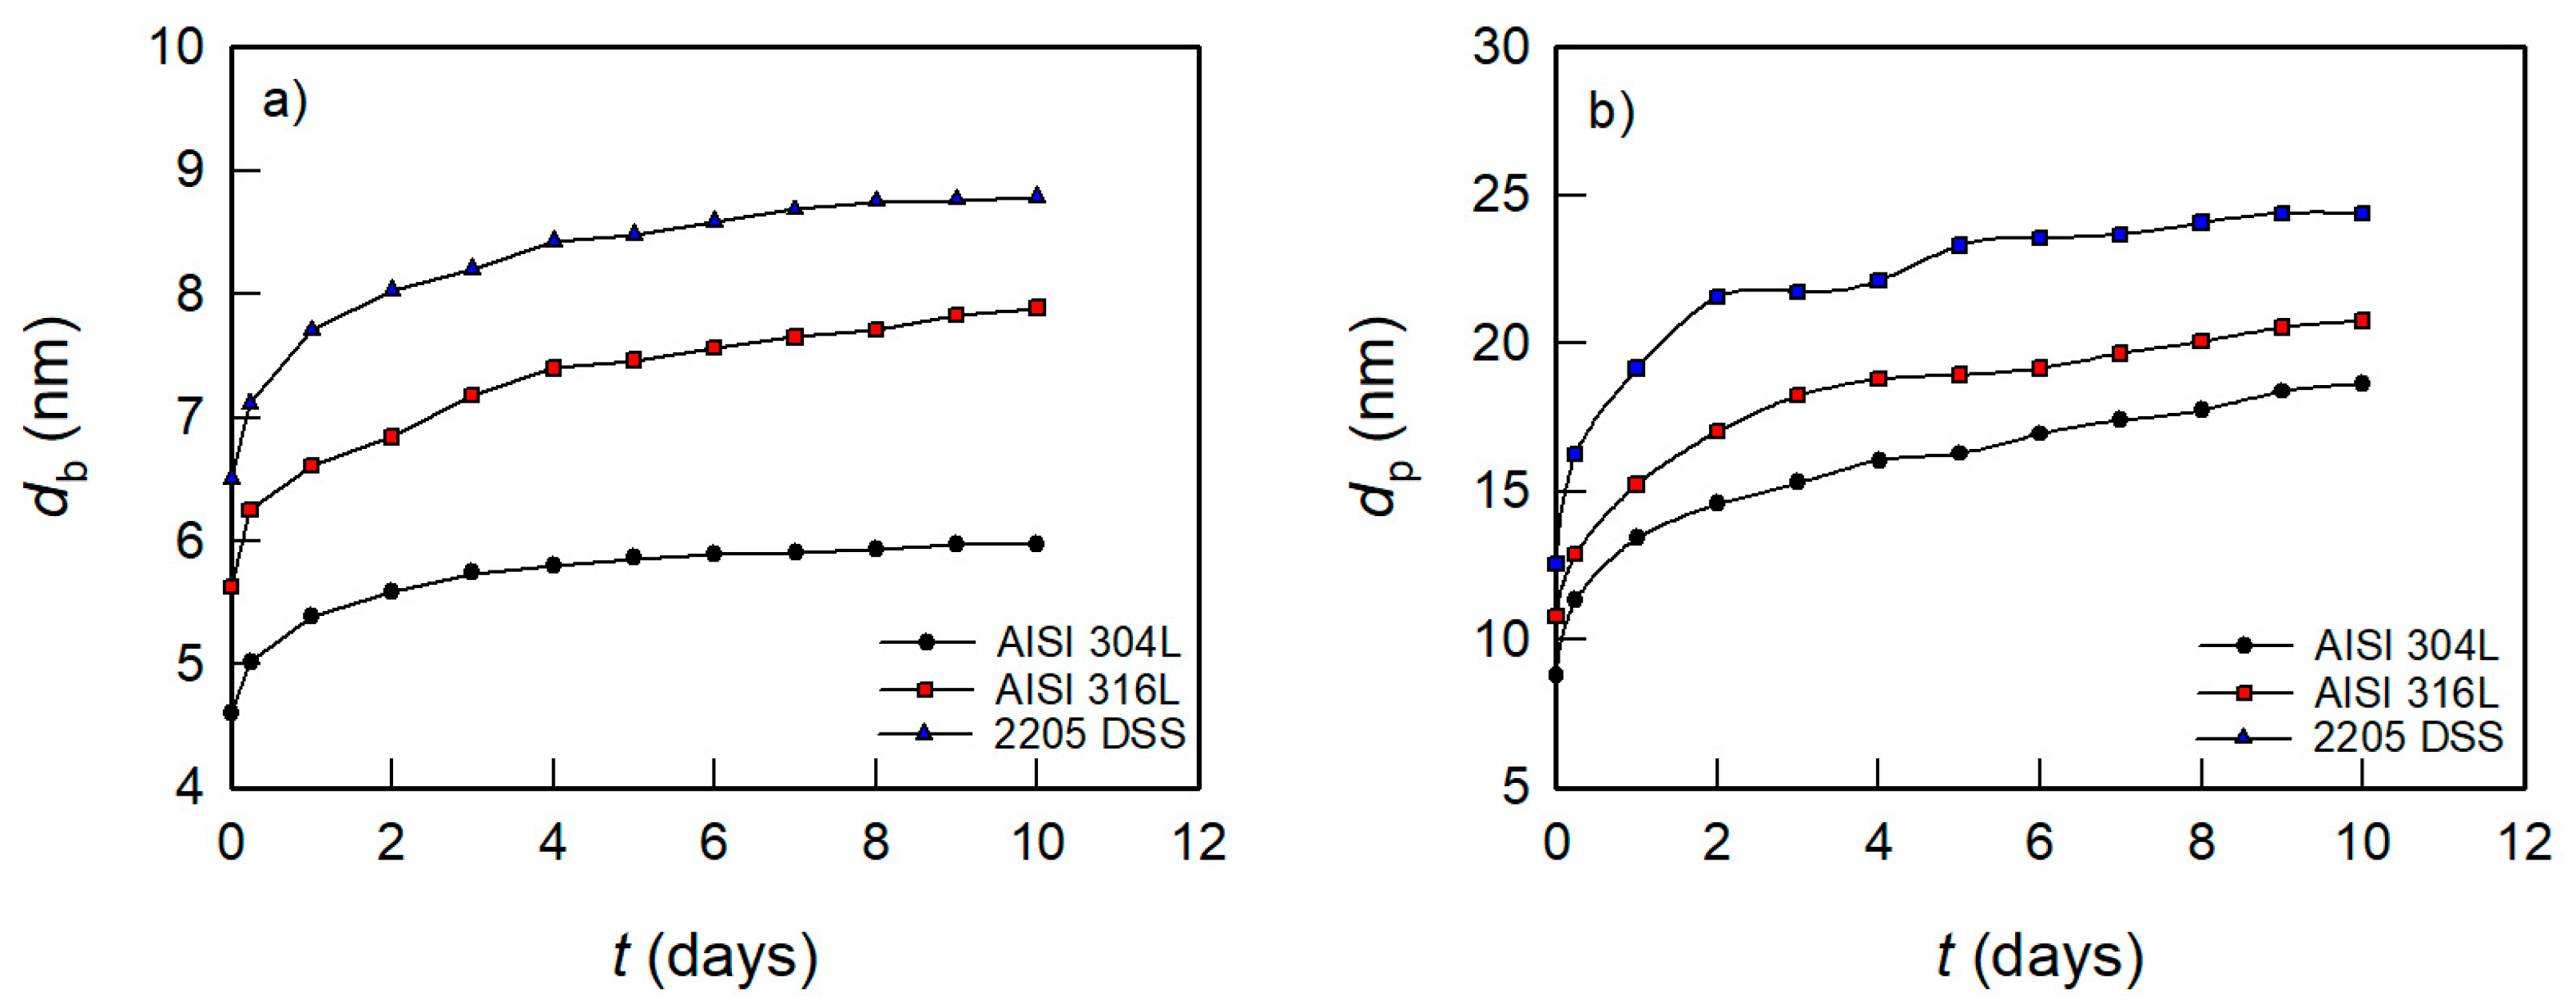
3.2. Spontaneous Corrosion of AISI 304L, AISI 316L, and 2205 DSS in PBS Solution
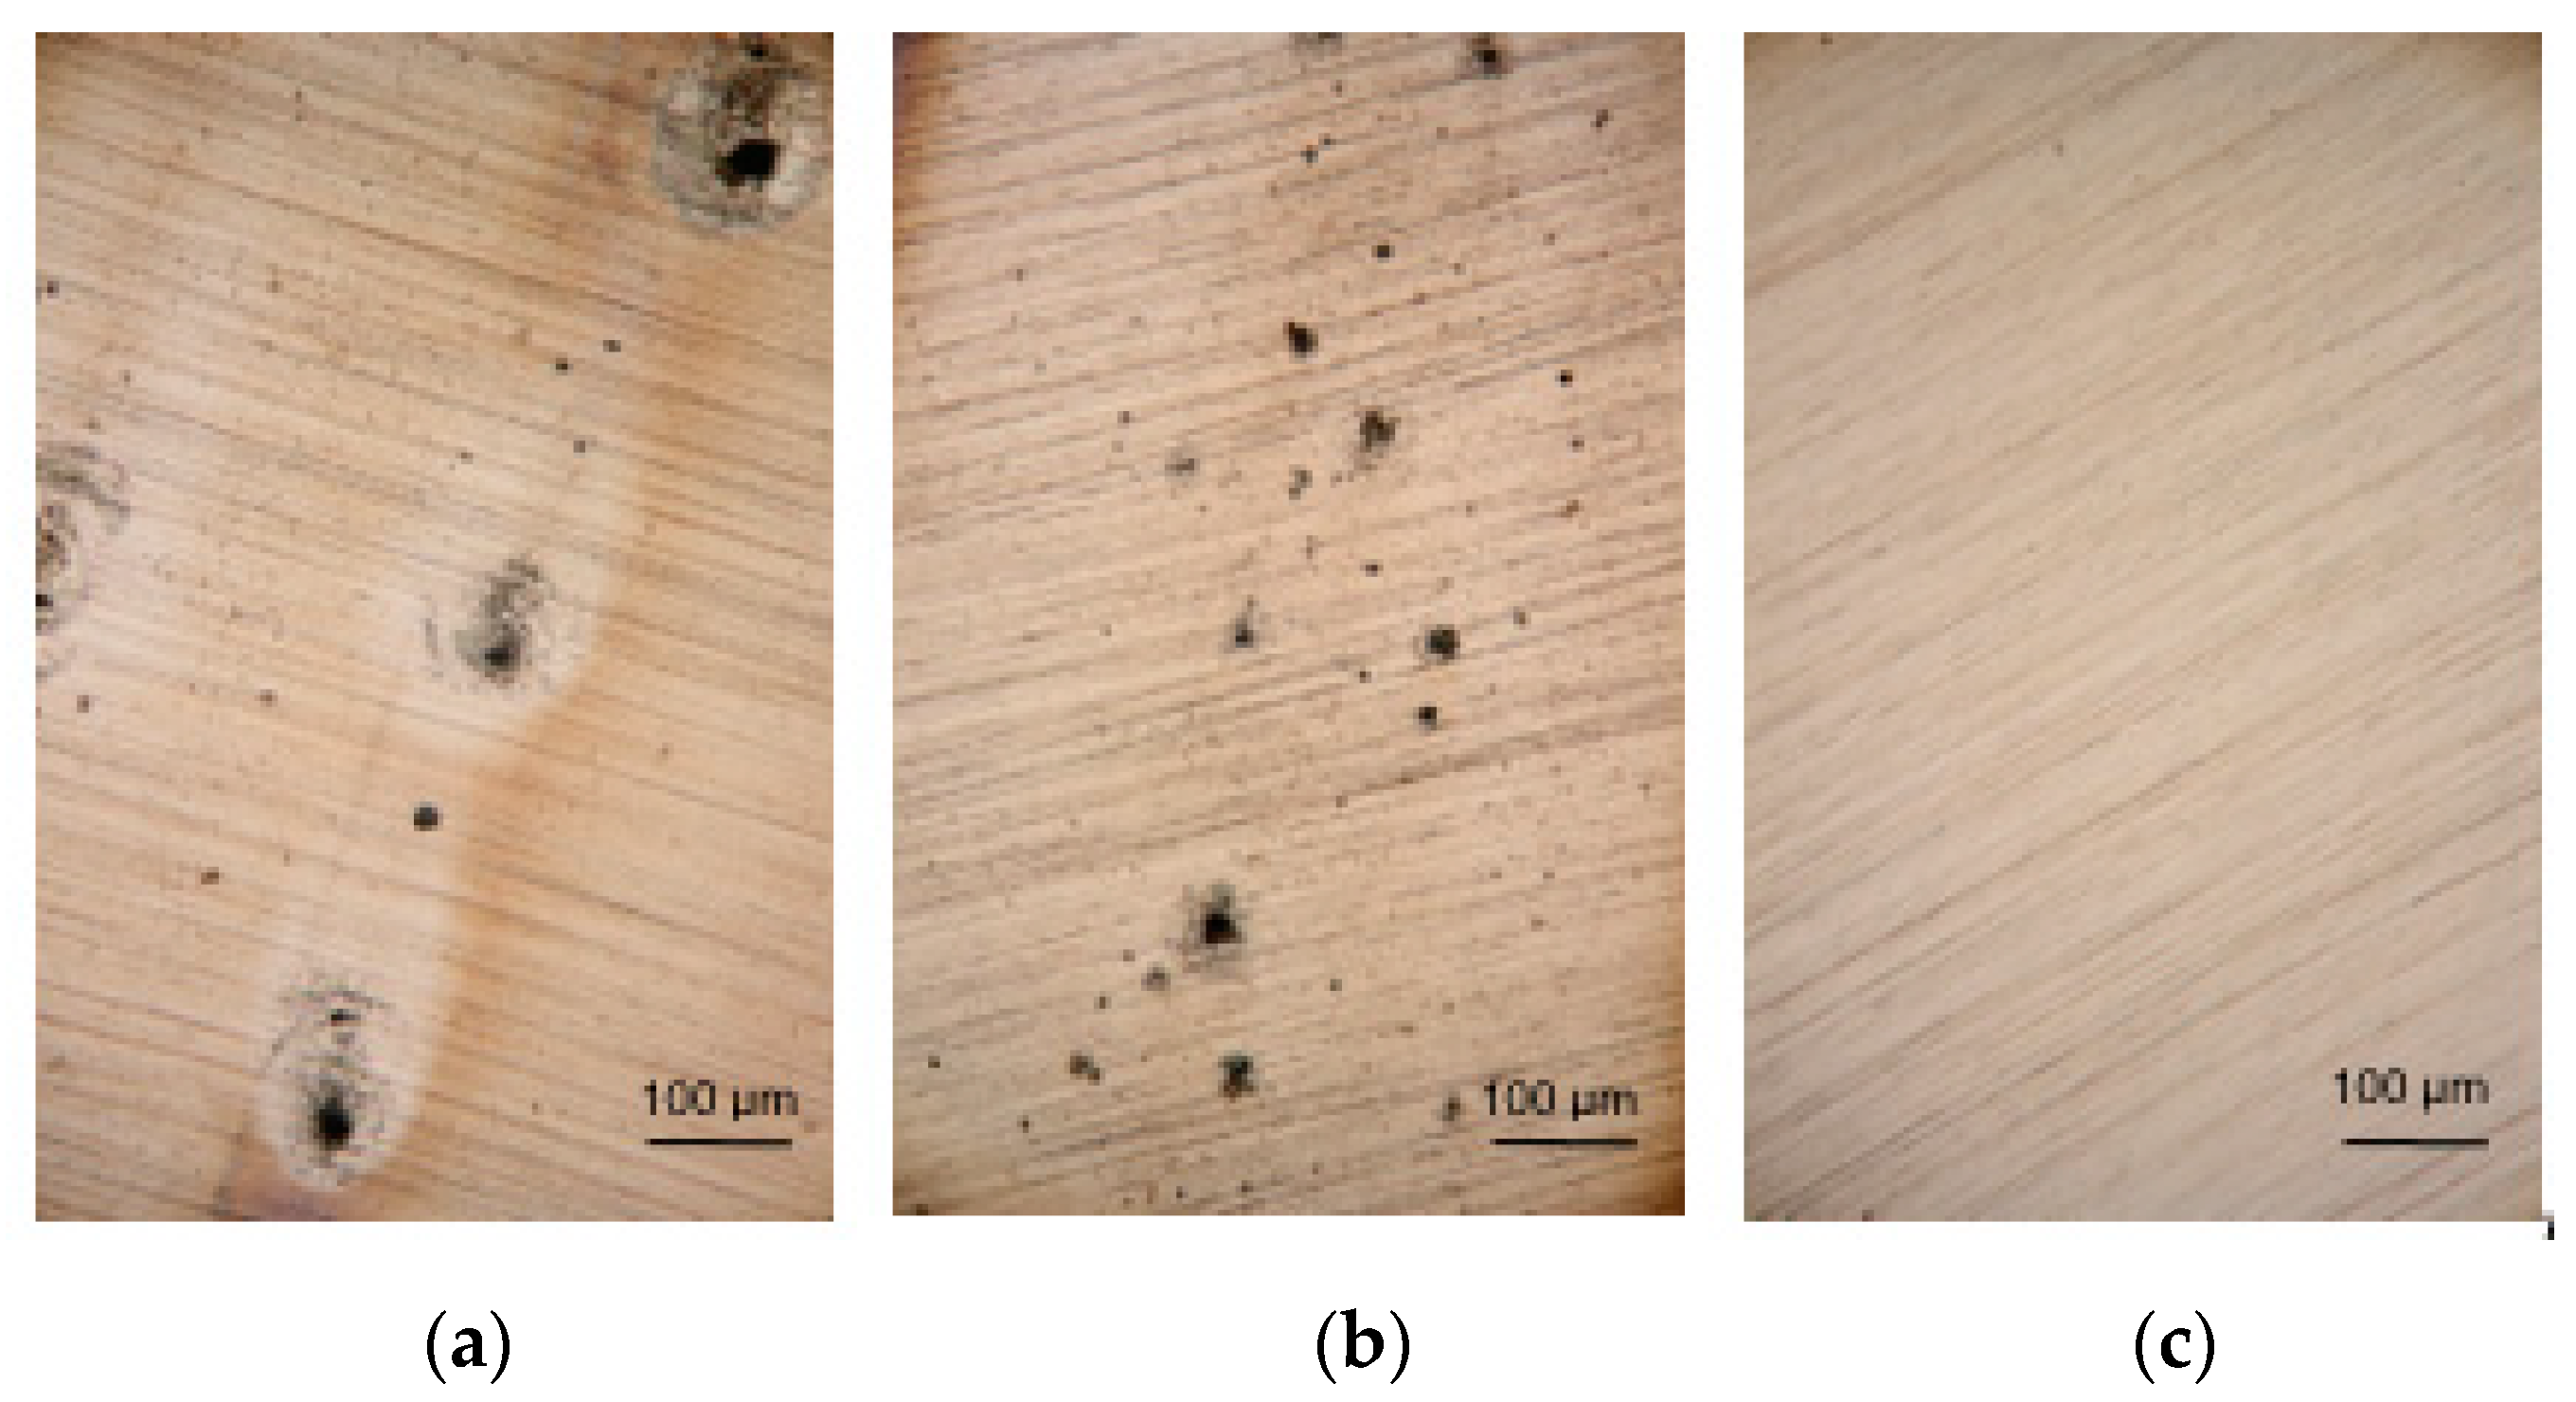
Biocompatible materials, implants (Ti, Ti alloys, and certain types of stainless steel), after incorporation into the human body, are subject to the process of spontaneous corrosion, which is determined by the corrosion rate and the established corrosion potential. Therefore, in this paper, special attention is given to the spontaneous corrosion of AISI 304L, AISI 316L, and 2205 DSS in PBS solution at 37 °C over an extended period of time. For this purpose, for each sample separately, the change in EOC, then the change in polarization resistance (Rp), as well as the impedance (Z) of the phase boundary of the tested sample/PBS solution over a period of 10 days, were monitored. The purpose of the study was to determine the physical and electrochemical properties of oxide films and their stability in the biological environment. Namely, the long-term stability of oxide films on biocompatible materials plays a decisive role in their use in the manufacture of various medical and dental implants.
Figure 4 presents the evolution of the EOC over 10 days immersion period in PBS for the test samples. The EOC is a characteristic value for each individual electrochemical system, and arises as a result of structural changes that occur due to the anodic and cathodic reactions at the electrode/solution phase boundary.
In general, the profile of all transients has nearly similar features in the PBS solution. In any case, the initial EOC value shifts continuously towards the positive direction of potential, first with a faster rate and then slowly until it reaches an almost quasi-stationary state.
The established EOC value depends on the chemical composition of the samples, and after several days of exposure to PBS solution is: −0.142 V for AISI 304L, −0.073 V for AISI 316L, and 0.036 V for 2205 DSS.
The established EOC value represents the balance between the formation and dissolution of the passive oxide film on the sample surface during the exposure time of the electrolyte solution [37]. Therefore, duplex steel with the highest EOC value is the most stable material under spontaneous corrosion conditions.
Similar behavior was observed for steel alloy both for PBS solution and in other corrosive environments of the human body [38].
The great advantage of the linear polarization method over classical potentiodynamic methods is that the measurement is performed in a narrow range (± 20 mV vs. EOC) so that it is an entirely non-destructive method. Figure 5 shows the results of linear polarization measurements for the tested alloys after 1 h of exposure to PBS solution. In all cases, a linear i-E dependence was observed.
Depending on the tested sample and the time of exposure to PBS solution, the slope of the i-E dependence changes, which defines the polarization resistance of the tested system, Rp:
R p = Δ E Δ i
Thus, an increase in the slope in the i-E diagram indicates an increase in the value of Rp. Measurements were also performed at longer exposures to PBS solution, and Figure 6 shows the time dependence of the Rp of the observed samples in PBS solution.
It can be observed that all samples show a similar time dependence. During the first 3 days, Rp grows sharply and reaches the maximum value that is mostly maintained during prolonged exposure to the solution. The values of Rp grow in order AISI 304L < AISI 316L < 2205 DSS.
The results of EIS seem to offer further confirmation for the extent of surface reactivity of steel samples under open circuit conditions in PBS media, and the measurement results for 2205 DSS are shown in Figure 7 in Nyquist and Bode complex planes.
The response in the Nyquist complex plane (Figure 7a) is an incomplete capacitive semicircle, which indicates that the surfaces of 2205 DSS have extremely high resistance (impedance). It was clearly found that the semicircle radius increases with immersion time. This implies a subsequent decrease in the corrosion rate of the material and suggests that the passivity of the surface film is gradually enhanced over time.
The Bode complex plane (Figure 7b) shows the dependence of the absolute impedance and the phase shift on the frequency (log |Z| − log f; phase shift − log f). In the range of high frequencies (f > 1 kHz) in the total impedance, only the influence of the electrolyte resistance, Rel, was observed, with a phase shift of ≈ 0°. The range of medium and low frequencies (f < 1 kHz) is determined by the capacitive behavior of 2205 alloy, i.e., the dielectric properties of the naturally formed oxide film on the alloy surface. Moreover, the large, broad peak of the phase angle of ≈ 85° on the Bode format could be indicative of an interaction of at least two-time constants. Furthermore, the Bode line has a slope of ≈ −1 that extends even to the lowest frequency values. It should be noted that the impedance of 2205 DSS is extremely high (of the order of MΩ cm2) and mainly increases with exposure time to PBS solution. As can be seen from Figure 8, similar results were obtained for other steel samples. The figure shows the impedance spectra recorded on the tested samples after a ten-day exposure to the PBS solution.
The obtained results are in agreement with the literature, where the prevailing opinion is that the oxide film on the surface of stainless steel is very thin (order of magnitude of several nm [15,16,17,18,19]). Furthermore, it is known that the oxide film has a two-layer structure and consists of an inner compact film, i.e., barrier film (mainly composed of chromium(III) oxide with a minor presence of the oxidized iron) and an outer porous film (mainly consists of iron oxides and hydroxides) [18,21,22]. Moreover, according to several references in the literature, passive films are slightly enriched in Mo(IV) or Mo(VI) species [39,40,41]. According to these findings, the oxide film assumes a mixed iron–chromium hydroxide outer layer and a mixed iron-chromium oxide inner layer. Molybdenum oxide is included in the outer layer and neglected in the inner layer [16,42]. The inner barrier film has an extremely high impedance, while the outer porous layer shows significantly lower impedance [16,18,21,22,42,43]. Substantial evidence is also reported confirming this structure for the surface films grown on stainless steel [16,38,39,40,41,42,43] substrates after prolonged immersion in different simulated body fluids.
The objective of the AC impedance technique is to model the corrosion process in terms of circuit elements to enable an accurate analysis of the obtained EIS data and make conclusions about the mechanism and properties of the corrosion process. Figure 9 shows the electric equivalent circuit (EEC), which was used for analyzing the impedance data.
This type of EEC is commonly proposed to mimic passive film with a duplex nature formed on stainless steel alloys [43,44,45] in simulated physiological environments. The model consists of the electrolyte resistance, Rel (≈ 7 Ω cm2), connected in series with two-time constants: Rel(QpRp)(QbRb). The first and second-time constants are determined by the parallel connection of the constant phase element and the resistance, the first with (QpRp) and the second with (QbRb).
It is worth noting that the dispersion behavior observed at rough electrodes can be described by a constant phase element (CPE) of the form [46,47,48]:
Z CPE = [ Q ( j ω ) n ] 1
where ω is the angular speed of ac signal (ω = 2πf), j = (−1)1/2, Q is a combination of properties related to the surface and electroactive species. The value of CPE exponent n can take on different values in the range of -1 to +1. Depending on n, CPE can represent resistance (n = 0), capacitance (n = 1), inductance (n = −1), or diffusion process (n = 0.5) [46].
In EEC, the CPEs, i.e., the quantities Qp and Qb, represent the capacitances Cp and Cb of the oxide film based on the simulation of a certain parameter np (≈ 0.95–0.97) and nb (≈ 0.97–0.99). In the high-frequency range the time constant, QpRp, describes the properties of the porous part of the oxide film. In this case, Rp and Qp are the resistance and capacitance of the porous film. The time constant in the low-frequency range describes the compact, inner barrier part of the oxide film, with Rb representing resistance and Qb the capacity of the inner barrier film. Values of the simulated electronic impedance parameters for tested samples as a function of the exposure time in PBS are listed in Table 3.
To better understand the situation, the time dependence of the parameters depicting the barrier and the porous layer of the surfaces of the investigated stainless steel are shown separately (Figure 10 and Figure 11). Generally, the results reveal that the layer resistances of the passive film Rp and Rb are always in the order of kΩ cm2. However, for all steel samples, the resistance of the inner barrier layer (Rb) is much higher than the resistance of the outer porous layer (Rp) at all immersion times (even for an entire order of magnitude).
For example (Figure 10a), barrier film resistance at 2205 DSS is extremely high and increases with exposure time, especially in the first 3–4 days, where an increase of ≈65 kΩ cm2 (immediately after immersion in the solution) to ≈700 kΩ cm2 (after 4 days). Further exposure of the sample to PBS solution shows a slight increase in the resistance of the barrier film and after 10 days its value is ≈750 kΩ cm2. On the other hand, the resistance of the porous layer on 2205 DSS (Figure 10b) is significantly lower and increases with the exposure time (roughly from 10 to 98 kΩ cm2), indicating that the oxide film pores are most likely filled with electrolyte solution [16,38].
In parallel with the above (Table 3), the capacitance of the inner barrier layer (nb ≈ 1; QbCb) in all investigated samples was higher than of the outer porous layer (np ≈ 1; QpCp). It was also observed that for all samples, the capacities of both films (barrier and porous) decreased slightly with the time of exposure to PBS solution (slightly faster in the first 3 days) and after 10 days reached an approximately stationary value.
According to the plate capacitor model, the capacity is inversely proportional to the thickness, d ( C = ε ε o / d where εo represents the dielectric constant of vacuum (8.85 × 10⁻¹² F m−1), a ε represents the dielectric constant of an oxide film.
In the literature [21,44,45], a value of 15.6 was found for the dielectric constant of the oxide film formed on austenitic stainless steels. This value is reasonable because the dielectric constants of oxides formed on stainless steels (Cr2O3, FeO, Fe3O4, and Fe2O3 are between 10 and 20 [49]. The values of passive film thickness (thickness of inner barrier layer, db, and outer porous layer, dp) for all samples during the PBS exposure were obtained using the plane capacitor formula (with the assumption Q = C and ε =15.6) and presented in Figure 11. Generally, the results reveal that the thickness of the inner barrier and outer porous layers is in the order of magnitude nm. However, for all steel samples, the thickness of the inner barrier layer is much thinner than the thickness of the outer porous layer at all immersion times. For example, the thickness of the barrier film at 2205 DSS after 10 days is ≈8 nm, while under the same conditions, the thickness of the porous film is ≈25 nm.
Therefore, the above trend for tested steel materials in PBS solution indicates that although the inner layer of the surface film is three times thinner, it is more passive (has higher resistance for the whole order of magnitude) than its thicker outer layer.
It is also clear from the figures that the resistance of the barrier and porous part of the oxide film increases in order: AISI 304L < AISI 316L < 2205 DSS. In the same order, the thickness of oxide films increases, i.e., the corresponding capacities decrease, which additionally indicates better protective properties of the surface film on 2205 DSS in relation to other alloys. Based on the above, the corrosion of the tested stainless steel is mainly prevented by a thin compact barrier layer of high resistance.
After impedance measurements, the surface condition of steel samples was also examined by light microscopy and SEM, while the elemental composition of the surface at individual positions was determined by EDS analysis. The obtained results are shown in Figure 12 and Table 4.
Light microscopy images (Figure 12) show clear differences in the scale of corrosion products on the tested alloy. On AISI 304L and AISI 316L corrosion products appear uniformly distributed along the whole surface, with the emphasis that on the AISI 316L alloy surface corrosion products are rarer and smaller. The surface of 2205 DSS is almost clear of any corrosion damages. These observations were confirmed by SEM/EDS analysis (Table 4). At significantly higher magnifications the surface of the duplex steel is still smooth and flat, with almost no signs of change.
As the thickness of the natural oxide film on stainless steels is very small, to the order of nm (Figure 11), while the X-rays used for EDS analysis are formed in a much deeper area, usually between 1 and 3 μm; however, it depends mainly on the accelerating voltage of primary electron beam and mean density of investigated material [50]. Therefore, the changes in the elemental composition of the alloy before (Table 1) and after exposure to PBS solution (Table 4) may indirectly indicate the local dissolution occurrence.
EDS analysis of the most damaged parts of the surface (positions 1 and 2 for AISI 304L and AISI 316L and position 1 for 2205 DSS) indicates significant changes in the elemental composition, especially in iron, the content of which was greatly lowered due to dissolution, while the composition on flat parts of each sample is approximately equal to the initial values which indicate that there was no local dissolution in these parts of the samples surface. Changes in the composition are highest for the AISI 304L. In fact, it was found that the percentage of surface damaged parts and changes in its elemental composition are growing in order: 2205 DSS < AISI 316L < AISI 304L.
As already stated, the alloying elements closely determine the chemical composition, stability, and thickness of the passive film which forms on the surface of stainless steel (Table 1). Elements that facilitate passivation of the steel will enhance the protective properties of the oxide film (higher resistance and thickness, more compact structure).
Marcus [51] explained the role of alloying elements on metal passivation and proposed the model which is based on two fundamental properties of metals, such as:
(a)
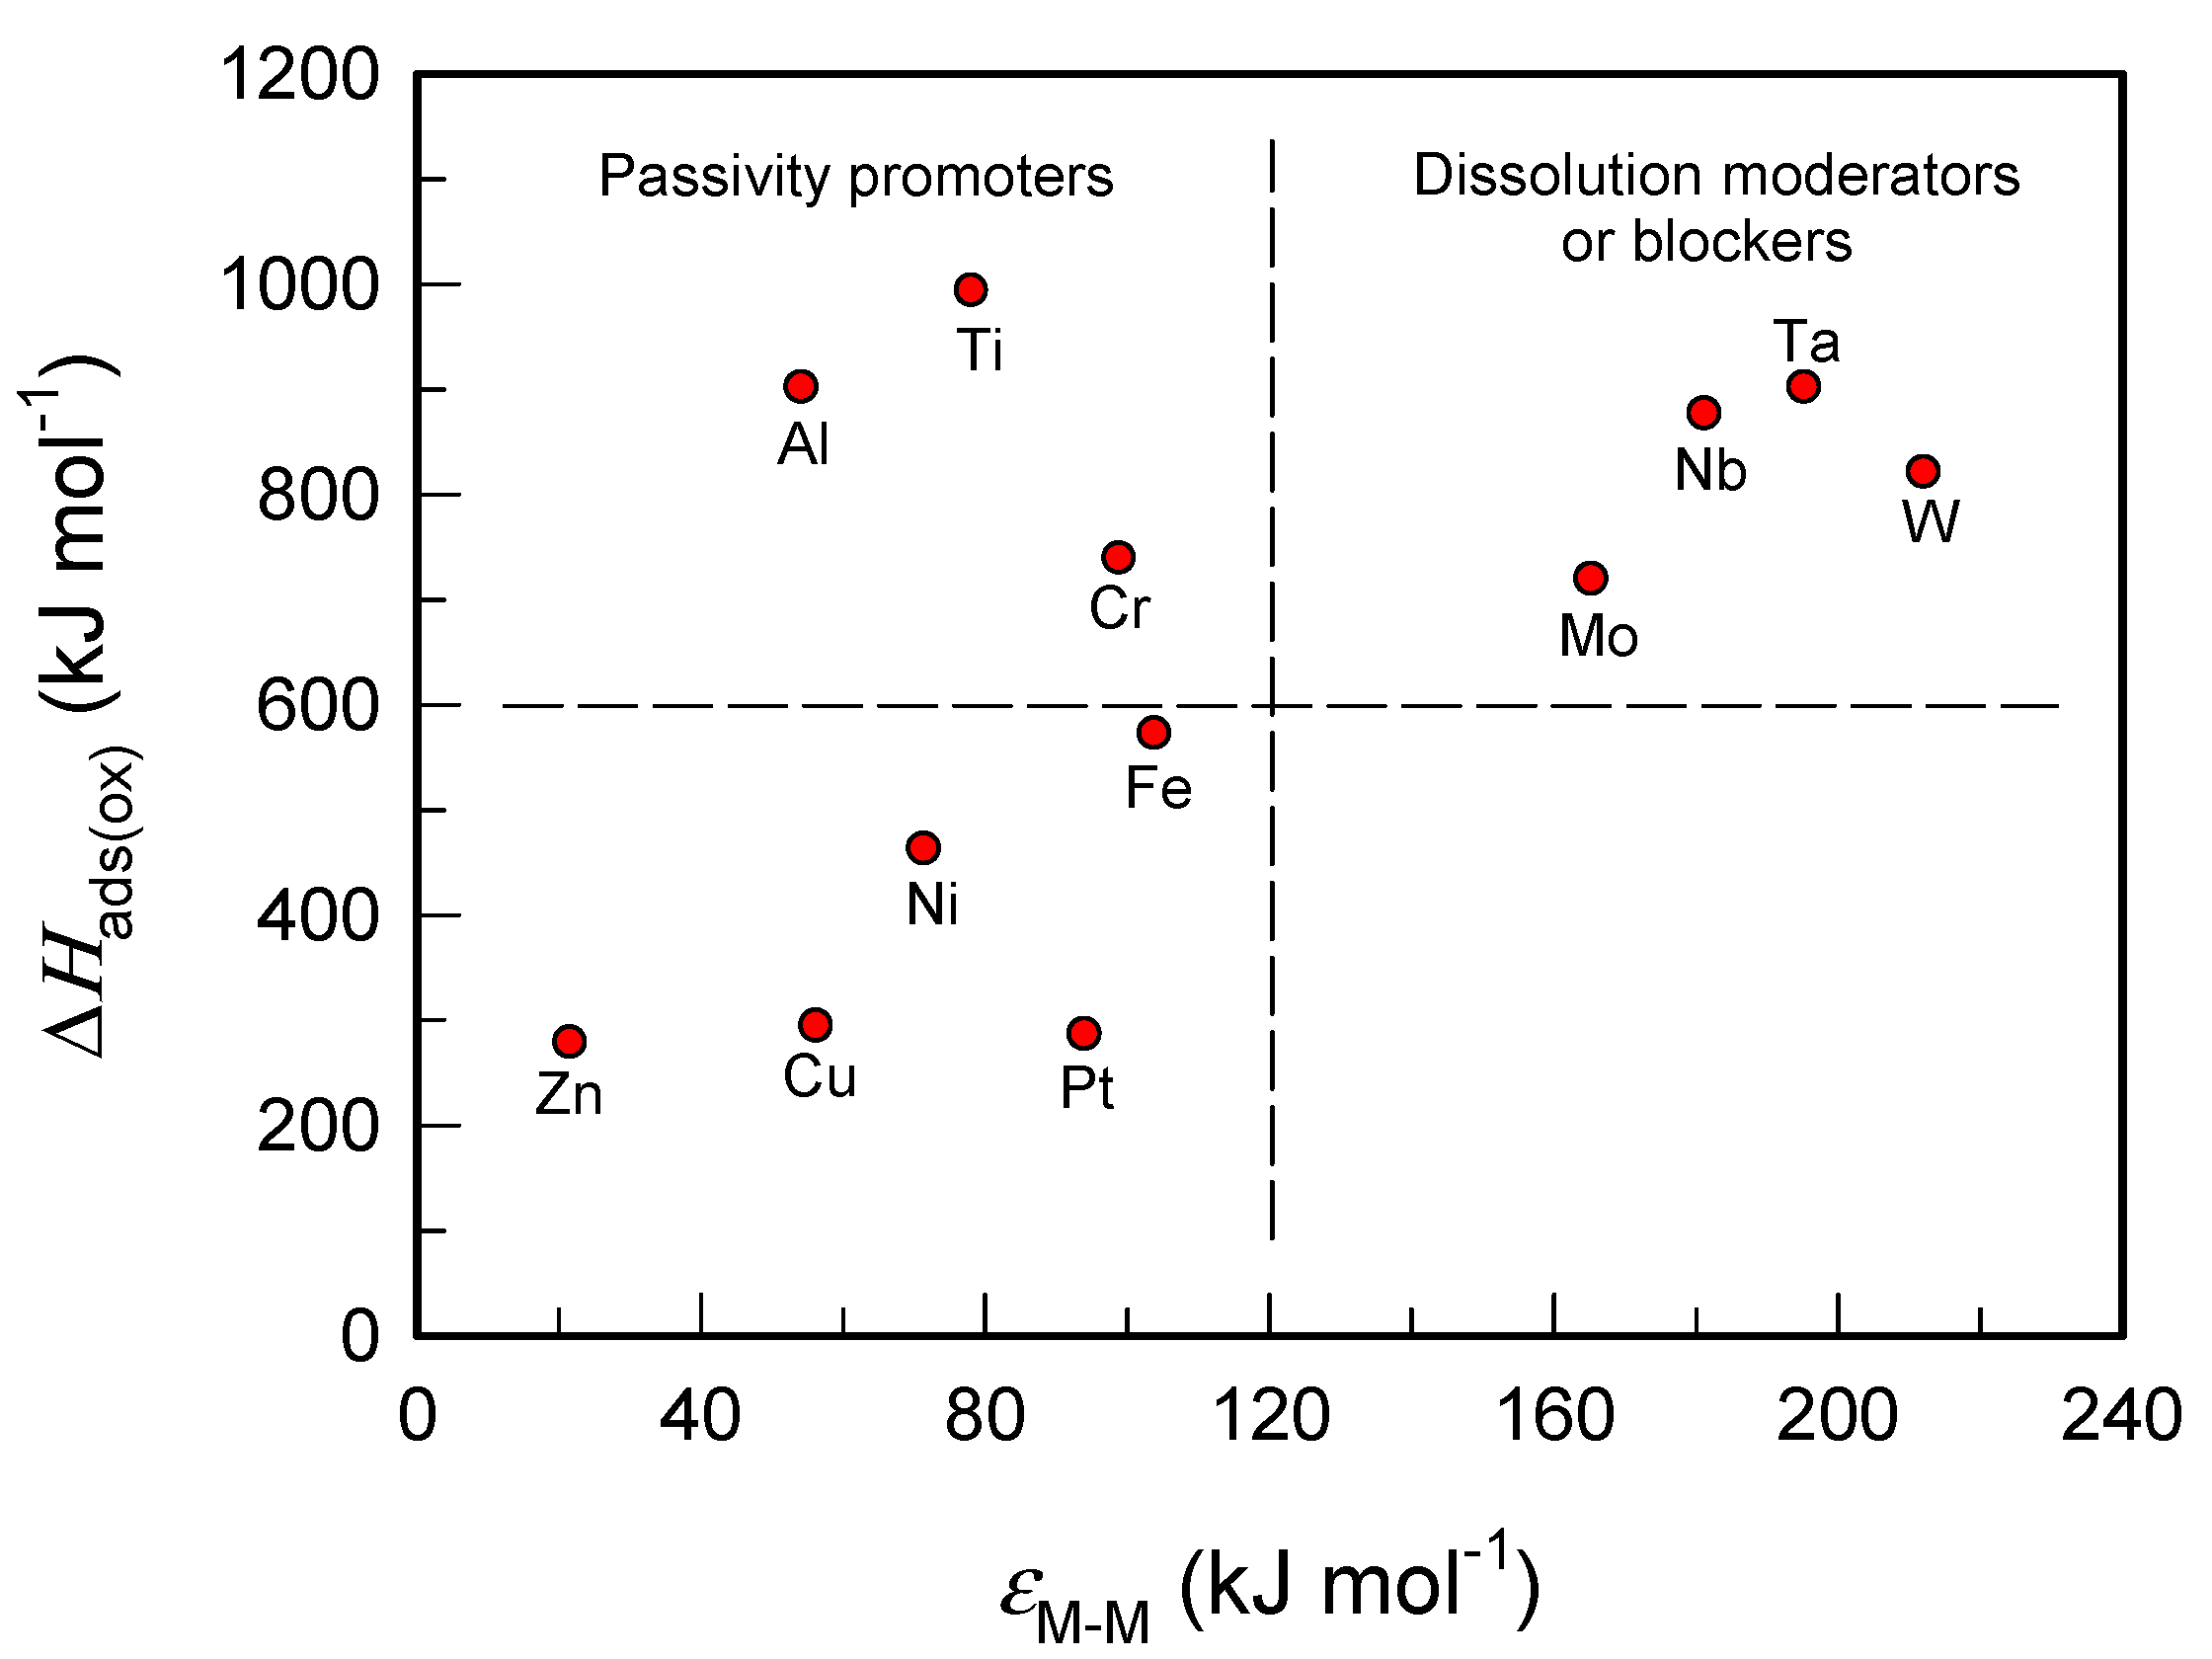
strength of the oxygen (or OH) chemisorption bond, εM-O, (reflected by the value of the heat of oxygen adsorption, ΔHads(ox)) and
(b)
the facility of conversion from the oxygen (or OH) monolayer to a 3D oxide in which a crucial factor is disruption of the metal–metal bonds (reflected by metal-metal bond energy, εM-M) [51].
Adsorption of oxygen or OH ions from the water solution usually represent the beginning of the passivation, followed by nucleation and oxide growth. Metals with a high heat of oxygen adsorption will be easily passivated. However, the passive film formation requires additional activation energy which is needed to convert the chemisorbed layer into 3D oxide. This process inevitably leads to a metal–metal interruption. Therefore, the lower the energy required to disrupt metal–metal bonds, the lower the activation energy barrier for the conversion into 3D oxide [51]. Thus, metals that are very suitable for the passive oxide film growth (reinforce the passivation) should strongly adsorb oxygen (or OH ions) and have a weak metal–metal bond that can be easily broken. However, a weak metal–metal bond causes the acceleration of metal dissolution. Therefore, fine balancing between the two mentioned effects is the crucial factor in the alloys passivation process.
Based on these Marcus considerations, the diagram ΔHads(ox)εM-M [51] is constructed (Figure 13). Alloying elements are divided into two main groups: passivity promoters and dissolution moderators or blockers.
In Figure 13, the upper left area is occupied by metals with high ΔHads(ox) values and relatively low εM-M (Cr, Al, Ti). These alloying elements facilitate passivation of the metal, i.e., there are passivity promoters.
Elements such as Mo, Nb, Ta, and W have a high εM-M and high ΔHads(ox) and are placed in the upper right-hand region of the diagram. These elements can be dissolution blockers or moderators due to the high value of εM-M, which indicates the difficulty of breaking metal–metal bonds. Passivation ability is preserved because these metals also have a high amount of ΔHads(ox). They participated in the passivation process and can be incorporated into surface oxide film. Based on the ideas presented, it is interesting to compare the influence of key alloying elements such as Cr, Mo, and Nb on the passivation of stainless steels, whose content in the tested samples mostly increases in order: AISI 304L < AISI 316L < 2205 DSS. The behavior of these elements in the initial stage of steel passivation is very different. Although the heat of oxygen adsorption on Cr, Mo, and Nb are similar, the Cr–Cr bond energy is much lower than that of Mo–Mo and Nb–Nb [51]. A large amount of energy released during the adsorption of oxygen can easily disrupt Cr–Cr bonds, thus causing oxide nucleation much before the completion of the adsorbed monolayer.
On the other hand, the Mo and Nb further improves the stainless steel’s corrosion resistance, especially in a solution containing Cl in which pitting is common. Namely, the high Mo–Mo and Nb–Nb bond strength cause a lowering of the dissolution rate by increasing the activation energy barrier for the disruption of metal–metal bonds on the surface [51]. This effect of alloying elements in the iron base ultimately results in the corrosion resistance of the tested samples growing in the same order, i.e., AISI 304L < AISI 316L < 2205 DSS. According to the sequence discussed, the content of the other elements in the individual samples also favours the increase of corrosion resistance.

4. Conclusions

The electrochemical behavior of AISI 304L, AISI 316L, and 2205 DSS as biocompatible materials in PBS solution at 37 °C was studied. The measurements are divided into two main categories. In the beginning, the corrosion behavior of the samples at high anodic potentials (anodic corrosion) was considered, followed by the process of spontaneous corrosion at the open circuit potential, EOC.
Anodic polarization of all samples in PBS solution results in the destruction of the natural oxide film and the occurrence of local activation of the surface with the creation of small pits. The damages of oxide film on all samples have a tendency of self-healing.
The tendency of the material toward local corrosion decreases in order: AISI 304L < AISI 316L < 2205 DSS. In the same order, the pitting initation rate occurs slower, the possibility of repassivation increases, and the resistance to local corrosion increases.
The corrosion resistance of steel samples at open circuit potential is a consequence of forming a natural oxide film that has a bi-layer structure and consists of an inner barrier and an outer porous film. The inner barrier film has an extremely high resistance, while the outer porous film shows significantly lower resistance.
The inner barrier layer prevents corrosion of examined steel samples, whose thickness and resistance increase sharply in the first few days of exposure to PBS solution. The film resistance is further increased by subsequent structure adjustment in the order AISI 304L < AISI 316L < 2205 DSS.

Author Contributions

Conceptualization, S.G. and L.V.; methodology, S.G.; software, S.G. and L.V.; validation, A.N., K.Š. and S.J.; formal analysis, S.G. and A.N.; investigation, K.Š.; resources, S.G. and L.V.; data curation, S.G. and L.V.; writing—original draft preparation, S.G. and L.V.; writing—review and editing, A.N. and S.J.; visualization, K.Š.; supervision, S.G.; project administration, L.V.; funding acquisition, S.J. All authors have read and agreed to the published version of the manuscript.

Funding

This research received no external funding.

Institutional Review Board Statement

Not Applicable.

Informed Consent Statement

Not Applicable.

Data Availability Statement

The data presented in this study are available on request from the corresponding author.

Conflicts of Interest

The authors declare no conflict of interest.

References

  1. Blackwood, D.J. Biomaterials: Past successes and future problems. Corros. Rev. 2003, 21, 97–124. [Google Scholar] [CrossRef]
  2. Hashemi, P.M.; Borhani, E.; Nourbakhsh, M.S. A review on nanostructured stainless steel implants for biomedical application. Nanomed J. 2016, 3, 202–216. [Google Scholar]
  3. Ossowska, A.; Ryl, J.; Sternicki, T. Production and properties of the porous layer obtained by the electrochemical method on the surface of austenitic steel. Materials 2022, 15, 949. [Google Scholar] [CrossRef] [PubMed]
  4. Oh, K.; Kim, Y.; Park, Y.; Kim, K. Properties of super stainless steels for orthodontic applications. J. Biomed. Mater. Res. B 2004, 69B, 183–194. [Google Scholar] [CrossRef] [PubMed]
  5. Eliaz, N. Corrosion of metallic biomaterials: A review. Materials 2019, 12, 407. [Google Scholar] [CrossRef] [PubMed] [Green Version]
  6. Gotman, I. Characteristics of metals used in implants. J. Endourol. 1997, 11, 383–389. [Google Scholar] [CrossRef]
  7. Ali, S.; Rani, A.M.A.; Mufti, R.A.; Azam, F.I.; Hastuty, S.; Baig, Z.; Hussain, M.; Shehzad, N. The influence of nitrogen absorption on microstructure, properties and cytotoxicity assessment of 316l stainless steel alloy reinforced with boron and niobium. Processes 2019, 7, 506. [Google Scholar] [CrossRef] [Green Version]
  8. Ali, S.; Irfan, M.; Niazi, U.M.; Rani, A.M.A.; Rashedi, A.; Rahman, S.; Khan, M.K.A.; Alsaiari, M.A.; Legutko, S.; Petru, J.; et al. Microstructure and mechanical properties of modified 316L stainless steel alloy for biomedical applications using powder metallurgy. Materials 2022, 15, 2822. [Google Scholar] [CrossRef]
  9. Beloti, M.M.; Rollo, J.M.D.A.; Itman Filho, A.; Rosa, A.L. In vitro biocompatibility of duplex stainless steel with and without 0.2% niobium. J. Appl. Biomater. Biomech. 2004, 2, 162–168. [Google Scholar]
  10. Kocijan, A.; Conradi, M. The corrosion behavior of austenitic and duplex stainless steel in artificial body fluids. Mater. Technol. 2010, 44, 21–24. [Google Scholar]
  11. Kocijan, A.; Conradi, M.; Schön, P.M. Austenitic and duplex stainless steels in simulated physiological solution characterized by electrochemical and X-ray photoelectron spectroscopy studies. J. Biomed. Mater. Res. Part B 2012, 100B, 799–807. [Google Scholar] [CrossRef] [PubMed]
  12. Köse, C.; Kaçar, R.; Zorba, A.P.; Bağirova, M.; Abamor, E.Ş.; Allahverdiyev, A.M. Interactions between fibroblast cells and laser beam welded AISI 2205 duplex stainless steel. Mater. Sci. Medzg. 2018, 24, 159–165. [Google Scholar] [CrossRef] [Green Version]
  13. Platt, J.A.; Guzman, A.; Zuccari, A.; Thornburg, D.W.; Rhodes, B.F.; Oshida, Y.; Moore, B.K. Corrosion behavior of 2205 duplex stainless steel. Am. J. Orthod. Dentofacial Orthop. 1997, 112, 69–79. [Google Scholar] [CrossRef]
  14. Hammood, A.S.; Noor, A.F.; Alkhafagy, M.T. Effect of heat treatment on corrosion behavior of duplex stainless steel in orthodontic applications. Mater. Res. Express 2017, 4, 126506. [Google Scholar] [CrossRef]
  15. Pardo, A.; Merino, M.C.; Coy, A.E.; Viejo, F.; Arrabal, R.; Matykina, E. Pitting corrosion behavior of austenitic stainless steels–combining effects of Mn and Mo additions. Corros. Sci. 2008, 50, 1796–1806. [Google Scholar] [CrossRef]
  16. Valero Vidal, C.; Igual Munoz, A. Electrochemical characterization of biomedical alloys for surgical implants in simulated body fluids. Corros. Sci. 2008, 50, 1954–1961. [Google Scholar] [CrossRef]
  17. Jafari, E.; Hadianfard, M.J. Influence of surface treatment on the corrosion resistance of stainless steel in simulated human body environment. J. Mater. Sci. Technol. 2009, 25, 611–614. [Google Scholar]
  18. Asaduzzaman, M.D.; Mohammad Mustafa, C.; Islam, M. Effect of concentration of sodium chloride solution on the pitting corrosion behavior of AISI 304L austenitic stainless steel. CICEQ 2011, 17, 477–483. [Google Scholar] [CrossRef]
  19. Brajković, T.; Juraga, I.; Šimunović, V. Influence of surface treatment on corrosion resistance of Cr-Ni steel. Eng. Rev. 2013, 33, 129–134. [Google Scholar]
  20. Kocijan, A.; Donik, Č.; Jenko, M. The electrochemical study of duplex stainless steel in chloride solutions. Mater. Technol. 2009, 43, 39–42. [Google Scholar]
  21. Hakiki, N.E.; Boudin, S.; Rondot, B.; Da Cunha Belo, M. The electronic structure of passive films formed on stainless steels. Corros. Sci. 1995, 37, 1809–1822. [Google Scholar] [CrossRef]
  22. Ramya, S.; Anita, T.; Shaikh, H.; Dayal, R.K. Laser Raman microscopic studies of passive films formed on type 316LN stainless steels during pitting in chloride solution. Corros. Sci. 2010, 52, 2114–2121. [Google Scholar] [CrossRef]
  23. Ihrzo, A.; Segui, Y.; Bui, N.; Dabosi, F. On the conduction mechanisms of passive films on molybdenum-containing stainless steel. Corrosion 1986, 42, 141–146. [Google Scholar]
  24. Wegrelius, L.; Falkenberg, F.; Olefjord, I. Passivation of stainless steels in hydrochloric acid. J. Electrochem. Soc. 1999, 146, 1397–1406. [Google Scholar] [CrossRef]
  25. Malik, A.U.; Siddiqi, N.A.; Ahmad, S.; Andijani, I.N. The effect of dominant alloy additions on the corrosion behavior of some conventional and high alloy stainless steels in seawater. Corros. Sci. 1995, 37, 1521–1535. [Google Scholar] [CrossRef]
  26. Potgieter, J.H.; Olubambi, P.A.; Cornish, L.; Machio, C.N.; El-Sayed Sherif, M. Influence of nickel additions on the corrosion behavior of low nitrogen 22% Cr series of duplex stainless steels. Corros. Sci. 2008, 50, 2572–2579. [Google Scholar] [CrossRef]
  27. Rossi, A.; Elsener, B. XPS study of passive films on stainless steels in neutral solutions. In Proceedings of the 12th International Corrosion Congress, Houston, TX, USA, 19–24 September 1993; pp. 2120–2130. [Google Scholar]
  28. Lorang, G.; Da Cunha Belo, M.; Sinoes, A.M.P.; Ferreira, M.G.S. Chemical composition of passive films on AISI 304 stainless steel. J. Electrochem. Soc. 1994, 141, 3347–3356. [Google Scholar] [CrossRef]
  29. Milošev, I.; Strehblow, H.H. The behavior of stainless steels in physiological solution containing complexing agent studied by X-ray photoelectron spectroscopy. J. Biomed. Res. 2000, 52, 404–412. [Google Scholar] [CrossRef]
  30. Choudhary, S.; Cruz, V.; Pandey, A.; Thomas, S.; Birbilis, N. Element-resolved electrochemical analysis of the passivity of additively manufactured stainless steel 316L. Corros. Sci. 2021, 189, 109576. [Google Scholar] [CrossRef]
  31. Chen, L.; Huang, J.; Lin, C.; Pan, C.; Chen, S.; Yang, T.; Lin, D.; Lin, H.; Jang, J. Anisotropic response of Ti-6Al-4V alloy fabricated by 3D printing selective laser melting. Mater. Sci. Eng. A 2017, 682, 389–395. [Google Scholar] [CrossRef]
  32. Williams, D.E.; Wright, G.A. Nucleation and growth of anodic oxide films on bismuth—I. Cyclic voltammetry. Electrochim. Acta 1976, 21, 1009–1019. [Google Scholar] [CrossRef]
  33. Tait, W.S. An Introduction to Electrochemical Corrosion Testing for Practicing Engineers and Scientists; Pair O Docks Publications: St. Clair. Racine, WI, USA, 1994; pp. 65–67. [Google Scholar]
  34. Pal, S.; Finšgar, M.; Bončina, T.; Lojen, G.; Brajlih, T.; Drstvenšek, I. Effect of surface powder particles and morphologies on corrosion of Ti-6Al-4V fabrocated with different energy densities in selective laser melting. Mater. Des. 2011, 211, 1–17. [Google Scholar] [CrossRef]
  35. Wilde, B.E. Critical appraisal of some popular laboratory electrochemical tests for predicting the localized corrosion resistance of stainless alloys in sea water. Corrosion 1972, 28, 283–291. [Google Scholar] [CrossRef]
  36. Silverman, D.C. Electrochemical techniques-simple tests for complex predictions in the chemical process industries. Corros. Rev. 1992, 10, 31–78. [Google Scholar] [CrossRef]
  37. Quin, P.; Lui, Y.; Sercombe, T.B.; Li, Y.; Zhang, C.; Cao, C.; Sun, H.; Zhang, L.C. Improved corrosion resistance on selective laser melting procedure Ti-5Cu alloy after heat treatment. ACS Biomater. Sci. Eng. 2018, 4, 2633–2642. [Google Scholar] [CrossRef]
  38. El-Taib Heakal, F.; Shehata, O.S.; Tantawy, N.S. Integrity of metallic medical implants in physiological solutions. Int. J. Electrochem. Sci. 2014, 9, 1986–2004. [Google Scholar]
  39. Ha, H.-Y.; Lee, T.-H.; Bae, J.-H.; Chun, D.W. Molybdenum effects on pitting corrosion resistance of FeCrMnMoNC austenitic stainless steel. Metals 2018, 8, 653. [Google Scholar] [CrossRef] [Green Version]
  40. Wang, Z.; Di-Franco, F.; Seyeux, A.; Zanna, S.; Maurice, V.; Marcus, P. Passivation-induced physicochemical alterations of the native surface oxide film on 316L austenitic stainless steel. J. Electrochem. Soc. 2019, 166, C3376–C3388. [Google Scholar] [CrossRef]
  41. Wang, Z.; Paschalidou, E.-M.; Seyeux, A.; Zanna, S.; Maurice, V.; Marcus, P. Mechanisms of Cr and Mo enrichments in the passive oxide film on 316L austenitic stainless steel. Front. Mater. 2019, 6, 232. [Google Scholar] [CrossRef] [Green Version]
  42. Antunes, A.; De Oliveira, M.C.L.; Costa, I. Study of the correlation between corrosion resistance and semi-conducting properties of the passive film of AISI 316L stainless steel in physiological solution. Mater. Corros. 2012, 63, 586–592. [Google Scholar] [CrossRef]
  43. Rondelli, G.; Torricelli, P.; Giardino, M. In vitro corrosion study by EIS of a nickel-free stainless steel for orthopaedic. Appl. Biomater. 2005, 26, 739–744. [Google Scholar] [CrossRef] [PubMed]
  44. Tudose, A.E.; Demetrescu, I.; Golgovici, F.; Fulger, M. Oxidation behavior of an austenitic steel (Fe, Cr and Ni), the 310 H, in a deaerated supercritical water static system. Metals 2021, 11, 571. [Google Scholar] [CrossRef]
  45. Li, D.G.; Wang, J.D.; Chen, D.R. Influence of pH value on the structure and electronic property of the passive film on 316L SS in the simulated cathodic environment of proton exchange membrane fuel cell (PEMFC). Int. J. Hydrog. Energy 2014, 39, 20105–20115. [Google Scholar] [CrossRef] [Green Version]
  46. Raistrick, I.D.; Macdonald, J.R.; Franceschetti, D.R. Impedance Spectroscopy; Macdonald, J.R., Ed.; John Wiley & Sons: New York, NY, USA, 1987. [Google Scholar]
  47. Rammelt, U.; Reinhard, G. On the applicability of a constant phase element (CPE) to the estimation of roughness of solid metal electrodes. Electrochim. Acta 1990, 35, 1045–1049. [Google Scholar] [CrossRef]
  48. Stoynov, Z. Impedance modelling and data processing: Structural and parametrical estimation. Electrochim. Acta 1990, 35, 1493–1499. [Google Scholar] [CrossRef]
  49. Boudalia, M.; Guenbour, A.; Bellaouchou, A.; Fernandez-Domene, R.M.; Garcia-Anton, J. Corrosion behaviour of a highly alloyed austenitic Alloy UB6 in contaminated phosphoric acid. Int. J. Corros. 2013, 2013, 363826. [Google Scholar] [CrossRef] [Green Version]
  50. Makhlouf, A.S.H.; Aliofkhazreaei, M. Handbook of Materials Failure Analysis with Case Studies from Oil and Gas Industry; Butterworth Heinemann: Oxford, UK, 2016; pp. 39–54. [Google Scholar]
  51. Marcus, P. On some fundamental factors in the effect of alloying elements on passivation of alloys. Coros. Sci. 1994, 36, 2155–2158. [Google Scholar] [CrossRef]
Figure 1. Cyclic polarization curves for investigated stainless steels in PBS solution.
Sustainability 14 08935 g001
Figure 2. Light microscopy images of the electrode surfaces after polarization measurements in PBS solution for (a) AISI 304L, (b) AISI 316L, and (c) 2205 DSS.
Sustainability 14 08935 g002
Figure 3. SEM image of AISI 304L, AISI 316L, and 2205 DSS alloy after potentiodynamic polarization measurements in PBS solution.
Sustainability 14 08935 g003
Figure 4. Evolution of open circuit potential over time for investigated samples in PBS solution.
Sustainability 14 08935 g004
Figure 5. Linear parts of polarization curves for investigated samples after 1 h immersion in PBS solution.
Sustainability 14 08935 g005
Figure 6. Time dependence of Rp for investigated samples in PBS solution.
Sustainability 14 08935 g006
Figure 7. (a) Nyquist and (b) Bode plots recorded on 2205 DSS in PBS solution at different stabilization times at EOC.
Sustainability 14 08935 g007
Figure 8. (a) Nyquist and (b) Bode plots recorded on investigated samples after 10 days immersion in PBS solution.
Sustainability 14 08935 g008
Figure 9. Electric equivalent circuit (EEC) model used for fitting EIS data.
Sustainability 14 08935 g009
Figure 10. Dependence of resistance of (a) barrier and (b) porous layer on stabilization time for investigated samples in PBS at 37 °C.
Sustainability 14 08935 g010
Figure 11. Dependence of thickness of (a) barrier and (b) porous layer on stabilization time for investigated samples in PBS at 37 °C.
Sustainability 14 08935 g011
Figure 12. Light microscopy images of the electrode surfaces after prolonged exposure in PBS solution; (a) AISI 304L, (b) AISI 316L, and (c) 2205 DSS.
Sustainability 14 08935 g012
Figure 13. Grouping of metals according to the Marcus model [51].
Sustainability 14 08935 g013
Table 1. Chemical composition of investigated stainless steels.
Chemical Composition (wt.%)
SampleCrNiMnMoSiNbCuVCFe
AISI 304L16.768.662.230.110.52-0.38-0.0371.58
AISI 316L16.4710.541.162.530.47-0.27-0.00268.55
2205 DSS22.215.471.523.140.330.0120.260.0350.01267.00
Table 2. Corrosion parameters for the AISI 304L, AISI 316L, and duplex steel in PBS solution.
SampleEcorr
(V)
icorr
(µA cm−2)
ip
(µA cm−2)
Edp
(V)
Erp
(V)
EdpEcorr
(V)
ErpEcorr
(V)
EdpErp
(V)
AISI 304L−0.286 ± 0.0141.31 ± 0.058.43 ± 0.440.208 ± 0.013−0.098 ± 0.0150.494 ± 0.0010.188 ± 0.0010.306 ± 0.002
AISI 316L−0.238 ± 0.0120.88 ± 0.042.61 ± 0.100.559 ± 0.029−0.011 ± 0.0100.797 ± 0.0170.227 ± 0.0020.570 ± 0.019
2205 DSS−0.108 ± 0.0080.33 ± 0.021.35 ± 0.041.120 ± 0.0410.790 ± 0.0201.228 ± 0.0330.898 ± 0.0120.330 ± 0.021
Table 3. Electrical parameters of equivalent circuit obtained by fitting the experimental results of EIS for AISI 304L, AISI 316L, and 2205 DSS in PBS solution at different stabilization times on EOC.
t
(Days)
Qp × 106
−1 sn cm−2)
npRp
(kΩ cm2)
Qb × 106
−1 sn cm−2)
nbRb
(kΩ cm2)
AISI 304L
0156.78 ± 4.230.93 ± 0.023.91 ± 0.21299.96 ± 4.670.94 ± 0.0229.51 ± 2.83
0.24121.99 ± 3.730.94 ± 0.018.05 ± 0.53275.14 ± 4.120.96 ± 0.0181.05 ± 4.05
1102.89 ± 3.440.94 ± 0.0112.57 ± 1.58256.52 ± 3.890.95 ± 0.02121.96 ± 10.11
294.74 ± 2.990.93 ± 0.0121.79 ± 1.44247.04 ± 4.010.95 ± 0.03160.92 ± 12.02
390.32 ± 2.780.94 ± 0.0325.96 ± 1.98240.59 ± 3.750.96 ± 0.01147.44 ± 10.11
486.05 ± 4.090.95 ± 0.0135.52 ± 2.36237.85 ± 3.390.97 ± 0.01160.92 ± 12.37
584.83 ± 3.370.95 ± 0.0135.64 ± 2.11235.64 ± 3.680. 98 ± 0.01188.72 ± 10.14
681.49 ± 3.400.96 ± 0.0140.80 ± 3.06234.34 ± 3.220.97 ± 0.01164.79 ± 14.83
779.41 ± 3.350.95 ± 0.0240.23 ± 3.17233.71 ± 4.120.96 ± 0.02192.48 ± 12.86
877.82 ± 2.650.96 ± 0.0144.31 ± 4.23232.87 ± 4.390.96 ± 0.01199.67 ±13.59
975.17 ± 2.770.96 ± 0.0144.06 ± 2.41231.38 ± 3.710.97 ± 0.01189.16 ± 12.36
1074.16 ± 3.160.96 ± 0.0147.83 ± 1.79231.17 ± 3.450.98 ± 0.01200.48 ± 13.02
AISI 316L
0128.14 ± 5.110.94± 0.03 8.74 ± 0.49245.48 ± 3.970.95 ± 0.0249.79 ± 3.82
0.24107.18 ± 3.720.94 ± 0.0224.40 ± 2.32220.88 ± 4.230.97 ± 0.01131.76 ± 9.17
190.61 ± 2.930.94 ± 0.0242.28 ± 2.95208.96 ± 3.54098 ± 0.01260.63 ± 12.35
281.01 ± 4.220.95 ± 0.0149.21 ± 2.93201.83 ± 3.600.97 ± 0.01344.34 ± 10.37
375.72 ± 2.850.95 ± 0.0152.87 ± 3.01192.28 ± 3.820.96 ± 0.02429.08 ± 12.13
473.49 ± 2.360.95 ± 0.0159.81 ± 3.23186.61 ± 3.670.98 ± 0.01494.77 ± 12.88
572.95 ± 3.150.95 ± 0.0158.86 ± 2.88184.99 ± 3.280. 98 ± 0.01517.67 ± 13.28
672.06 ± 3.660.94 ± 0.0367.66 ± 2.64182.62 ± 3.170.98 ± 0.01506.64 ± 12.95
770.25 ± 2.840.97 ± 0.0170.06 ± 2.01180.51 ± 3.590.98 ± 0.01520.32 ± 13.78
868.87 ± 3.650.95 ± 0.0268.26 ± 2.77179.25 ± 3.930.97 ± 0.01528.74 ± 14.79
967.24 ± 3.800.96 ± 0.0173.37 ± 1.98176.38 ± 4.050.97 ± 0.02521.42 ± 12.37
1066.57 ± 3.450.97 ± 0.0176.36 ± 3.09175.10 ± 3.480.99 ± 0.01530.14 ± 13.23
2205 DSS
0109.84 ± 3.890.95 ± 0.0210.30 ± 0.95212.38 ± 3.970.97 ± 0.0265.61 ± 5.19
0.2485.02 ± 2.710.96 ± 0.0127.27 ± 2.35194.09 ± 3.370.98 ± 0.01222.93 ± 10.07
172.04 ± 2.160.96 ± 0.0150.09 ± 2.94179.25 ± 3.060.98 ± 0.01381.95 ± 13.13
264.02 ± 3.280.96 ± 0.0164.65 ± 2.77172.03 ± 4.130.97 ± 0.01470.39 ± 11.84
363.53 ± 3.010.95 ± 0.0271.27 ± 3.29168.39 ± 3.540.99 ± 0.01634.18 ± 14.14
462.44 ± 3.050.96 ± 0.0183.01 ± 3.34163.86 ± 3.230.98 ± 0.01690.96 ± 15.23
559.24 ± 2.840.97 ± 0.0188.20 ± 3.17162.89 ± 3.760.99 ± 0.01721.51 ± 14.46
658.61 ± 3.710.97 ± 0.0191.88 ± 3.40160.81 ± 3.170.99 ± 0.01761.70 ± 15.43
758.32 ± 3.420.97 ± 0.0293.31 ± 3.37158.95 ± 4.200.98 ± 0.01751.10 ± 16.02
857.39 ± 2.640.97 ± 0.0195.51 ± 3.04157.84 ± 3.790.99 ± 0.01769.41 ± 13.52
956.64 ± 2.890.98 ± 0.0196.73 ± 2.92157.61 ± 3.550.98 ± 0.02761.70 ± 14.29
1056.62 ± 3.110.97 ± 0.0198.72 ± 3.52157.25 ± 3.220.99 ± 0.01765.47 ± 14.02
Table 4. SEM images and elemental composition (on marked spots) of AISI 304L, AISI 316L, and 2205 DSS surface after impedance measurements in PBS.
AISI 304LSpectrum
Element123456
Sustainability 14 08935 i001O10.267.151.462.762.770.64
Si0.180.230.310.370.370.35
P4.243.25 1.081.05
Cl0.910.67 0.290.73
Cr16.3716.9618.0516.8017.2518.54
Mn18.2814.351.891.601.891.82
Fe42.0646.7970.9765.7763.5570.73
Ni3.844.757.327.508.047.91
Cu3.866.00 3.834.34
Total100.00100.00100.00100.00100.00100.00
AISI 316LSpectrum
Element123456
Sustainability 14 08935 i002O11.621.070.684.410.820.68
Na4.84
Si1.240.330.420.530.440.43
P0.400.11 0.140.06
Cl2.680.150.050.65
Cr13.2317.2817.0117.3017.3217.68
Mn0.860.951.191.041.381.23
Fe56.0769.7468.4865.1767.3966.75
Ni7.048.5410.088.6210.2610.67
Mo2.021.822.082.142.332.55
Total100.00100.00100.00100.00100.00100.00
2205 DSSSpectrum
Element12345
Sustainability 14 08935 i003O4.901.861.800.660.74
Na1.410.931.08
Si0.530.420.360.250.28
P0.140.120.350.070.02
Cl0.40 0.07
Cr22.5523.6623.6324.3221.13
Mn1.011.261.571.371.56
Fe61.5163.8863.0066.0567.58
Ni3.693.883.833.416.22
Mo3.873.604.113.832.32
Total100.00100.00100.00100.00100.00
Publisher’s Note: MDPI stays neutral with regard to jurisdictional claims in published maps and institutional affiliations.

