Article

Corrosion Resistance of Open Die Forged Austenitic Stainless Steel Samples Prepared with Different Surfaces

Faculty of Mechanical Engineering and Naval Architecture, University of Zagreb, Ivana Lučića 5, 10000 Zagreb, Croatia
*
Author to whom correspondence should be addressed.
Sustainability 2021, 13(11), 5871; https://doi.org/10.3390/su13115871
Submission received: 2 April 2021 / Revised: 19 May 2021 / Accepted: 20 May 2021 / Published: 24 May 2021
(This article belongs to the Special Issue Stainless Steel—the Choice for Ecosustainability)

Abstract

:
The use of corrosion-resistant metal materials in highly aggressive environments contributes to the preservation of the environment because it reduces the use of protective agents and coatings. Most metal objects are produced by some metal-forming process. It is well-known that plastic deformation affects the corrosion resistance of different metal materials in different ways. As a rule, austenitic stainless steels show a positive impact of plastic deformation on corrosion resistance, especially when hot deformed with protective surface oxide layers. However, most research carried out on these metals involves a carefully prepared surface which is either finely ground or polished. This paper investigates the corrosion resistance of cold-formed (open die forged) austenitic stainless steel in three different surface states for three different degrees of deformation. In doing so, we simulate possible damage to the treated surface and evaluate the stability of the material with respect to corrosion. Good corrosion resistance is shown for all three stages of deformation and for all three surface states, with some differences in the obtained results. Although the polished surface shows the highest corrosion resistance, as expected, the other two surfaces also demonstrate good results when exposed to aggressive environments. All of the results were statistically processed and presented. The results demonstrate the high usability of such materials in corrosion-aggressive environments with minimal danger of corrosion and minimal need to include additional surface protection agents, even against possible surface damage.

1. Introduction

Metal products and semi-finished products are made mainly by metal forming technology. Today, more than 90% of smelted metal is processed by different procedures of metal forming. Plastic deformation of metal causes a change in the shape and size of the billet during the process of cold plastic working. There is also a change in the physical-mechanical and chemical properties of the metal. For this research paper, only two of the aforementioned characteristics are highlighted. The data are related to high-quality structural carbon steels (namely DC01, DC04, and DD13). An increase in the degree of deformation leads to an increase in the strength characteristics and a decrease in corrosion resistance [1]. Cold deformation increases the material’s strength, causing grain elongation and dislocation pile-ups in its microstructure. When severe cold deformation is combined with shear stress, it results in grain refinement. These structural changes (dislocation pile-ups and grain refinement) affect the corrosion resistance of the material. The influence on the material can be either positive or negative, depending on the type of material that undergoes plastic deformation. The influence is positive if it makes the system more stable with respect to corrosion, makes corrosion easier to avoid, or makes environmentally aggressive treatments of metal surfaces less frequent.
Several authors have described the negative effects of plastic deformation on the corrosion resistance of steels. Localized corrosion induced by plastic deformation has been reported for many alloys used in structural and functional applications. Hot deformation of high-strength low-alloy (HSLA) steel leads to a lowered corrosion resistance [2]. Pre-deformation affects the corrosion resistance of the 2205 duplex stainless steel. The corrosion resistance of the passive film formed on 2205 duplex stainless steel was decreased in stress–strain conditions when the material was pre-deformed by cold plastic deformation [3]. Samples of the stainless steel AISI 304 that suffered tensile plastic deformation—cold deformation to different levels—showed a decrease in the pitting resistance [4]. The influence of cold rolling and tensile deformation on the pitting corrosion resistance was investigated on AISI 304 and AISI 430 stainless steels. The results showed a maximum pitting occurrence after 20% of cold-rolling reduction or 10% of tensile deformation with respect to dislocation pile-ups [5]. The paper by Hsu et al. [6] suggested that plastic deformation increases the stress corrosion cracking tendency of AISI 304L stainless steel. Another paper, by Tung et al. [7], found that cold rolling increases the pitting resistance of 304L due to the formation of a passive film.
However, another research paper on cold rotary swaging of the same type of metal material provided opposite results. According to this paper, the material was subjected to the influence of compressive plastic deformation and shear stresses. This resulted in a refinement of the grain size. In this case, there was an increase in corrosion resistance of the material after plastic deformation [8]. Austenitic stainless steel 316LN was hot forged and annealed. The results of corrosion resistance testing indicate that the corrosion rate decreases after the annealing of forged samples [9].
The microstructure, containing different grain sizes of the metal material, influences the formation of the passive layer. The corrosion processes can therefore be accelerated or decelerated. Research has shown that a smaller grain size leads to a more stable passive layer [10]. However, a higher amount of lattice defects, such as dislocations, can also result in a faster corrosion rate under aggressive conditions. This is especially true in cases where the material is associated with small grains [11]. The grain size is not the only influential microstructural factor. Crystal structure can also have an impact on corrosion behavior. Martensite shows a higher level of electrochemical activity and, thus, a faster corrosion occurrence than austenite [12].
However, most of the corrosion resistance testing results in the open literature have been conducted on samples with carefully prepared surfaces which were mainly either finely ground to smooth or, in some cases, polished [13,14]. This paper investigates the corrosion resistance of cold formed (open die forged) austenitic stainless steel. The material was subjected to compressive stress, which causes plastic deformation. Three different deformation degrees were obtained, and the examined surfaces of deformed samples were prepared with three different surface treatments. The first surface treatment was a polished surface, the second one was a ground surface, and the third one was a cut surface without any finishing treatment. This paper uses different surface states with coarse-finished cut surfaces to try to simulate possible damage and scratches to the finely treated surface and to evaluate the stability of the coarse material surface with respect to corrosion.

2. Materials and Methods

Samples made of austenitic stainless steel 304 (X5 CrNi 18-10) were upset on a hydraulic press. Chemical compositions of the austenitic stainless steel 304 (X5 CrNi 18-10) are shown in Table 1.
Cylindrical hollow samples with an initial height of 40 mm, outer diameter of 20 mm, and inner diameter of 7 mm were compacted in three degrees of deformation. The sample height was 35 mm after the first stage of deformation, 30 mm after the second stage, and 25 mm after the third stage. Therefore, the true strains that were achieved are φ1 = 0.13, φ2 = 0.29, and φ3 = 0.47. In total, 12 samples were made: 3 samples that were not deformed and were used as a control group; 3 samples deformed only by the first degree of deformation (φ1 = 0.13), 3 samples deformed by the second degree of deformation (φ2 = 0.29), and 3 samples deformed by the third degree of deformation (φ3 = 0.47). The surface of the first sample from each group was polished; the surface of the second sample from each group was ground; and the surface of the third sample from the group was cut without being processed. The surfaces of all samples were cleaned and degreased before corrosion resistance testing was conducted.

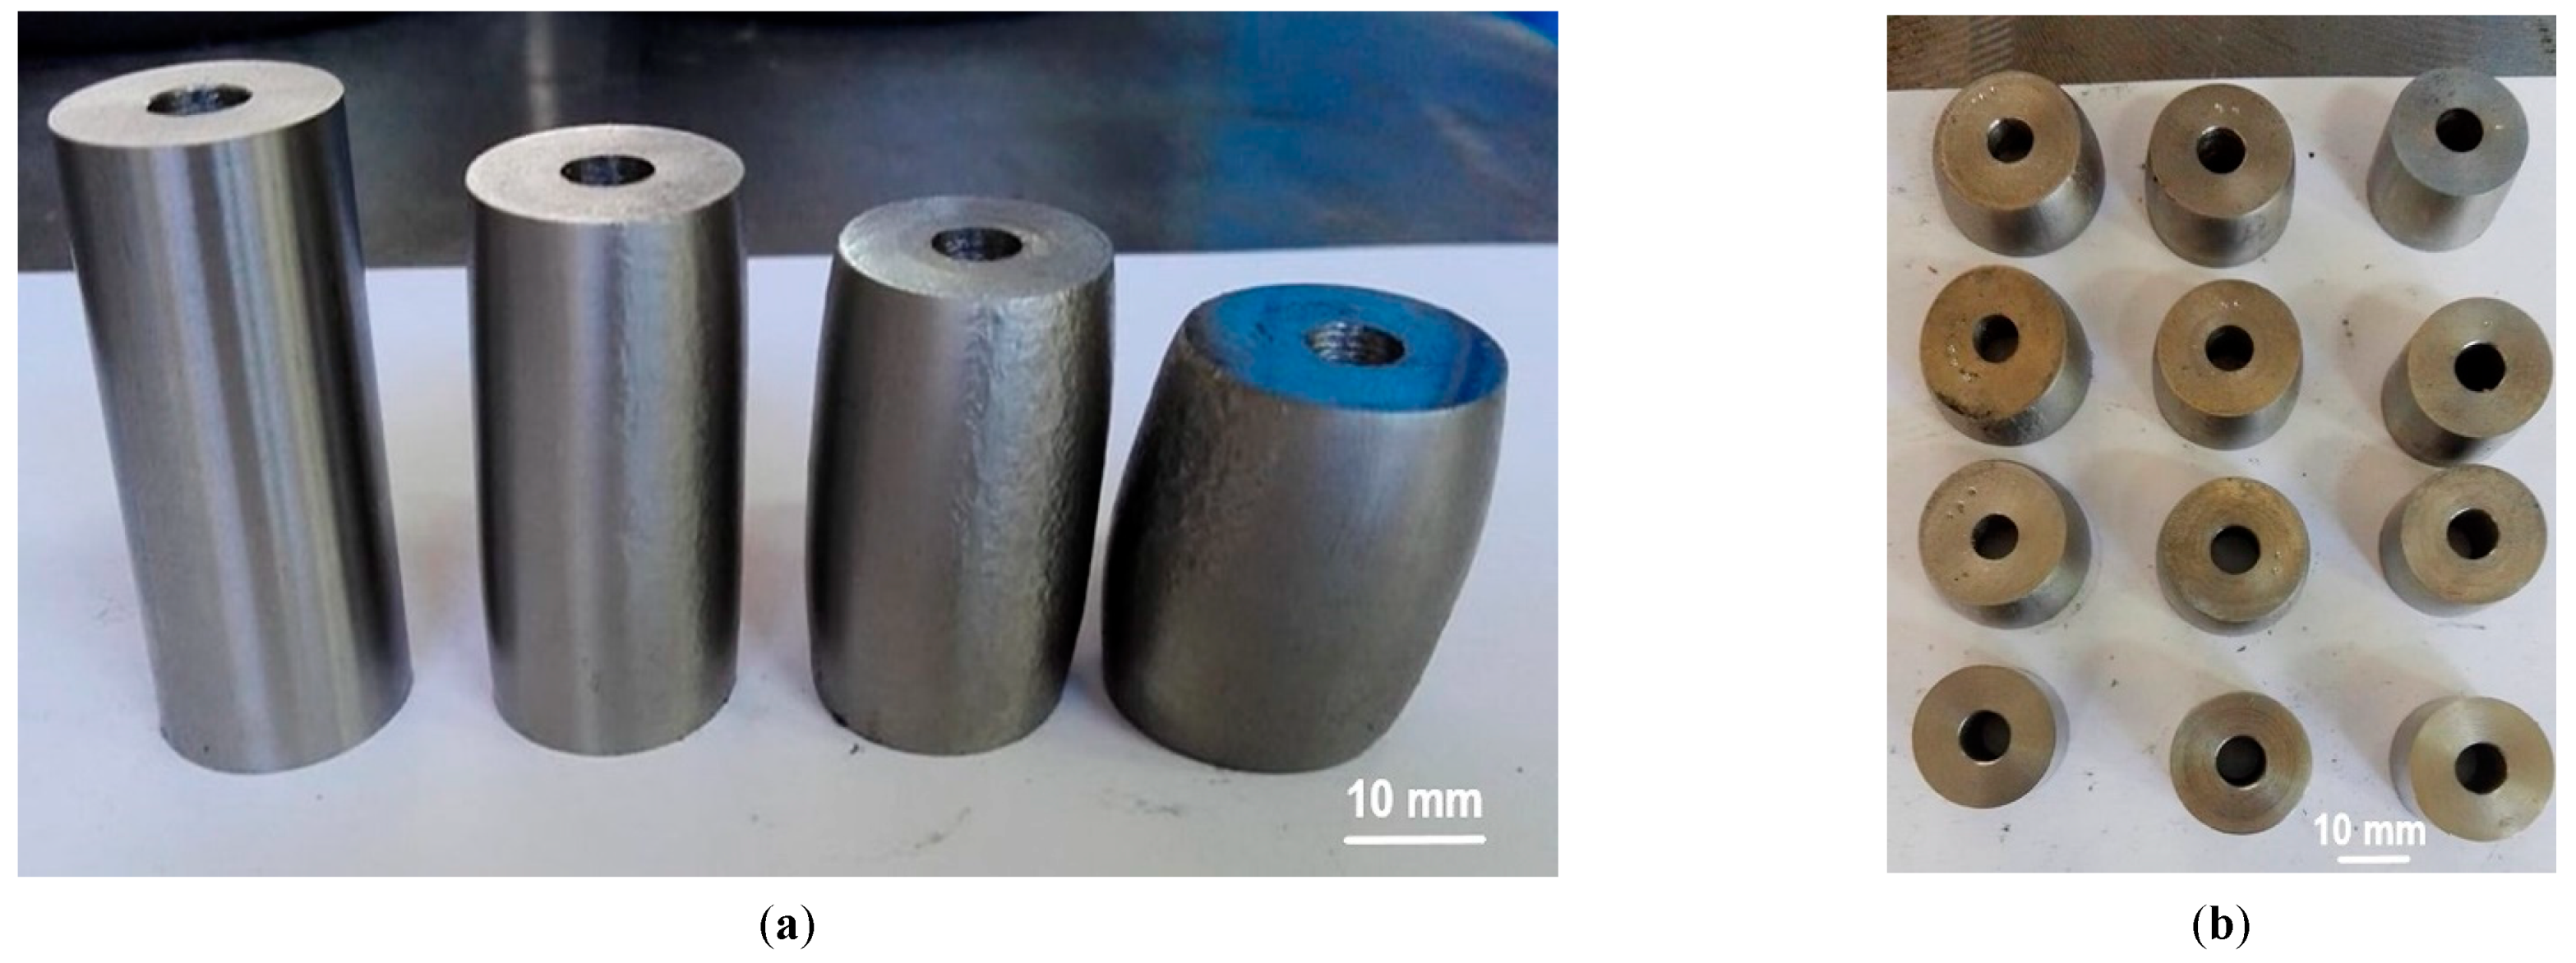
2.1. Open Die Forging—Upsetting

The hydraulic press SICMI PMM 150 MC was used in the upsetting process. The deformation rate was 3 mm/s. The true strains and the final dimensions of samples are given in Table 2. After the upsetting process and surface finishing was completed, 12 samples were prepared for corrosion resistance testing. Figure 1 presents the final sample features and all of the 12 deformed and finished samples. In Table 3, all of the samples are numbered and grouped according to the achieved true strain and surface condition.

2.2. Measurement of Surface Topography

The Oxford MFP-3D Origin atomic force microscope (AFM) was used to obtain information on the state of the sample surface in nanometers. Twelve samples were measured by the AFM tapping mode at five different locations on the measured surfaces. The scanned areas were 20 µm × 20 µm.
The measurement results (namely, arithmetic mean and standard deviation) of the height surface topography parameters—also called height area roughness parameters or 3D amplitude roughness parameters—are presented in Table 4. Images of the surface topography of different surface finishing, both in 2D and 3D format, are presented in Figure 2a–c.
The list of height area roughness parameters are as follows:
  • Sa—Arithmetic mean deviation;
  • Sz—Maximum height;
  • Sv—Maximum profile valley depth;
  • Sp—Maximum profile peak height;
  • Sku—Kurtosis;
  • Ssk—Skewness; and
  • Sq—Root mean square deviation.
Although all of the height parameters presented in Table 2 have been measured, further analysis of the impact of surface conditions on corrosion resistance was performed based on the parameters Sa and Sz. The most commonly used height or amplitude area roughness parameters in the field of corrosion resistance are the arithmetic mean height parameter (Sa) and the maximum height parameter (Sz) [15]. The measured values of the arithmetic mean height parameter Sa and maximum height parameter Sz for all samples are presented in Figure 3.

2.3. Corrosion Resistance Testing

Electrochemical direct current (DC) testing was used to test corrosion resistance using a potentiodynamic polarization measurement. The testing was performed using the Potentiostat EG&G Princeton Applied Research Model 273A and the SoftCorr III software. The test cell was composed of a reference electrode (Saturated Calomel Electrode, SCE), a graphite counter electrode, and a working electrode (specimen). A 3.5% NaCl solution at room temperature was used as an electrolyte.
Three studies were conducted as part of the electrochemical corrosion testing: testing of open circuit potential (EOC), linear polarization (polarization resistance value Rp), and Tafel extrapolation (corrosion rate vcorr).

2.3.1. Testing of an Open Circuit Potential

Open circuit potential (corrosion potential) testing was the first of three electrochemical studies conducted on the prepared samples. This study measures the difference in potential between the working electrode (test sample) and the reference electrode (Saturated calomel electrode, SCE), when no current is flowing. A change in potential in a time of 1000 s was monitored. The open circuit potential of all samples in the 3.5% NaCl solution is presented in Figure 4. For the result, the final value was measured at the very end of the monitoring, since the stability of the system had been achieved by that point. The open circuit potential indicates the tendency of metals to corrode, but it does not provide information about the corrosion rate. Whereas changes in the open circuit potential of the samples from more negative values to positive values means that the material tends to create a protective passive film, changes from more negative values to positive values means that the metal is corroded in the testing solution. The more positive the value of the open circuit potential, the more resistant the test sample is to corrosion. However, if the value of the open circuit potential is greater than zero, we can then conclude that our sample is a noble metal.
Measured values of the open circuit potential EOC for all samples are graphically presented in Figure 5.
Since all of the EOC values are negative, we can therefore conclude that our samples have a tendency to corrode in a 3.5% NaCl solution.

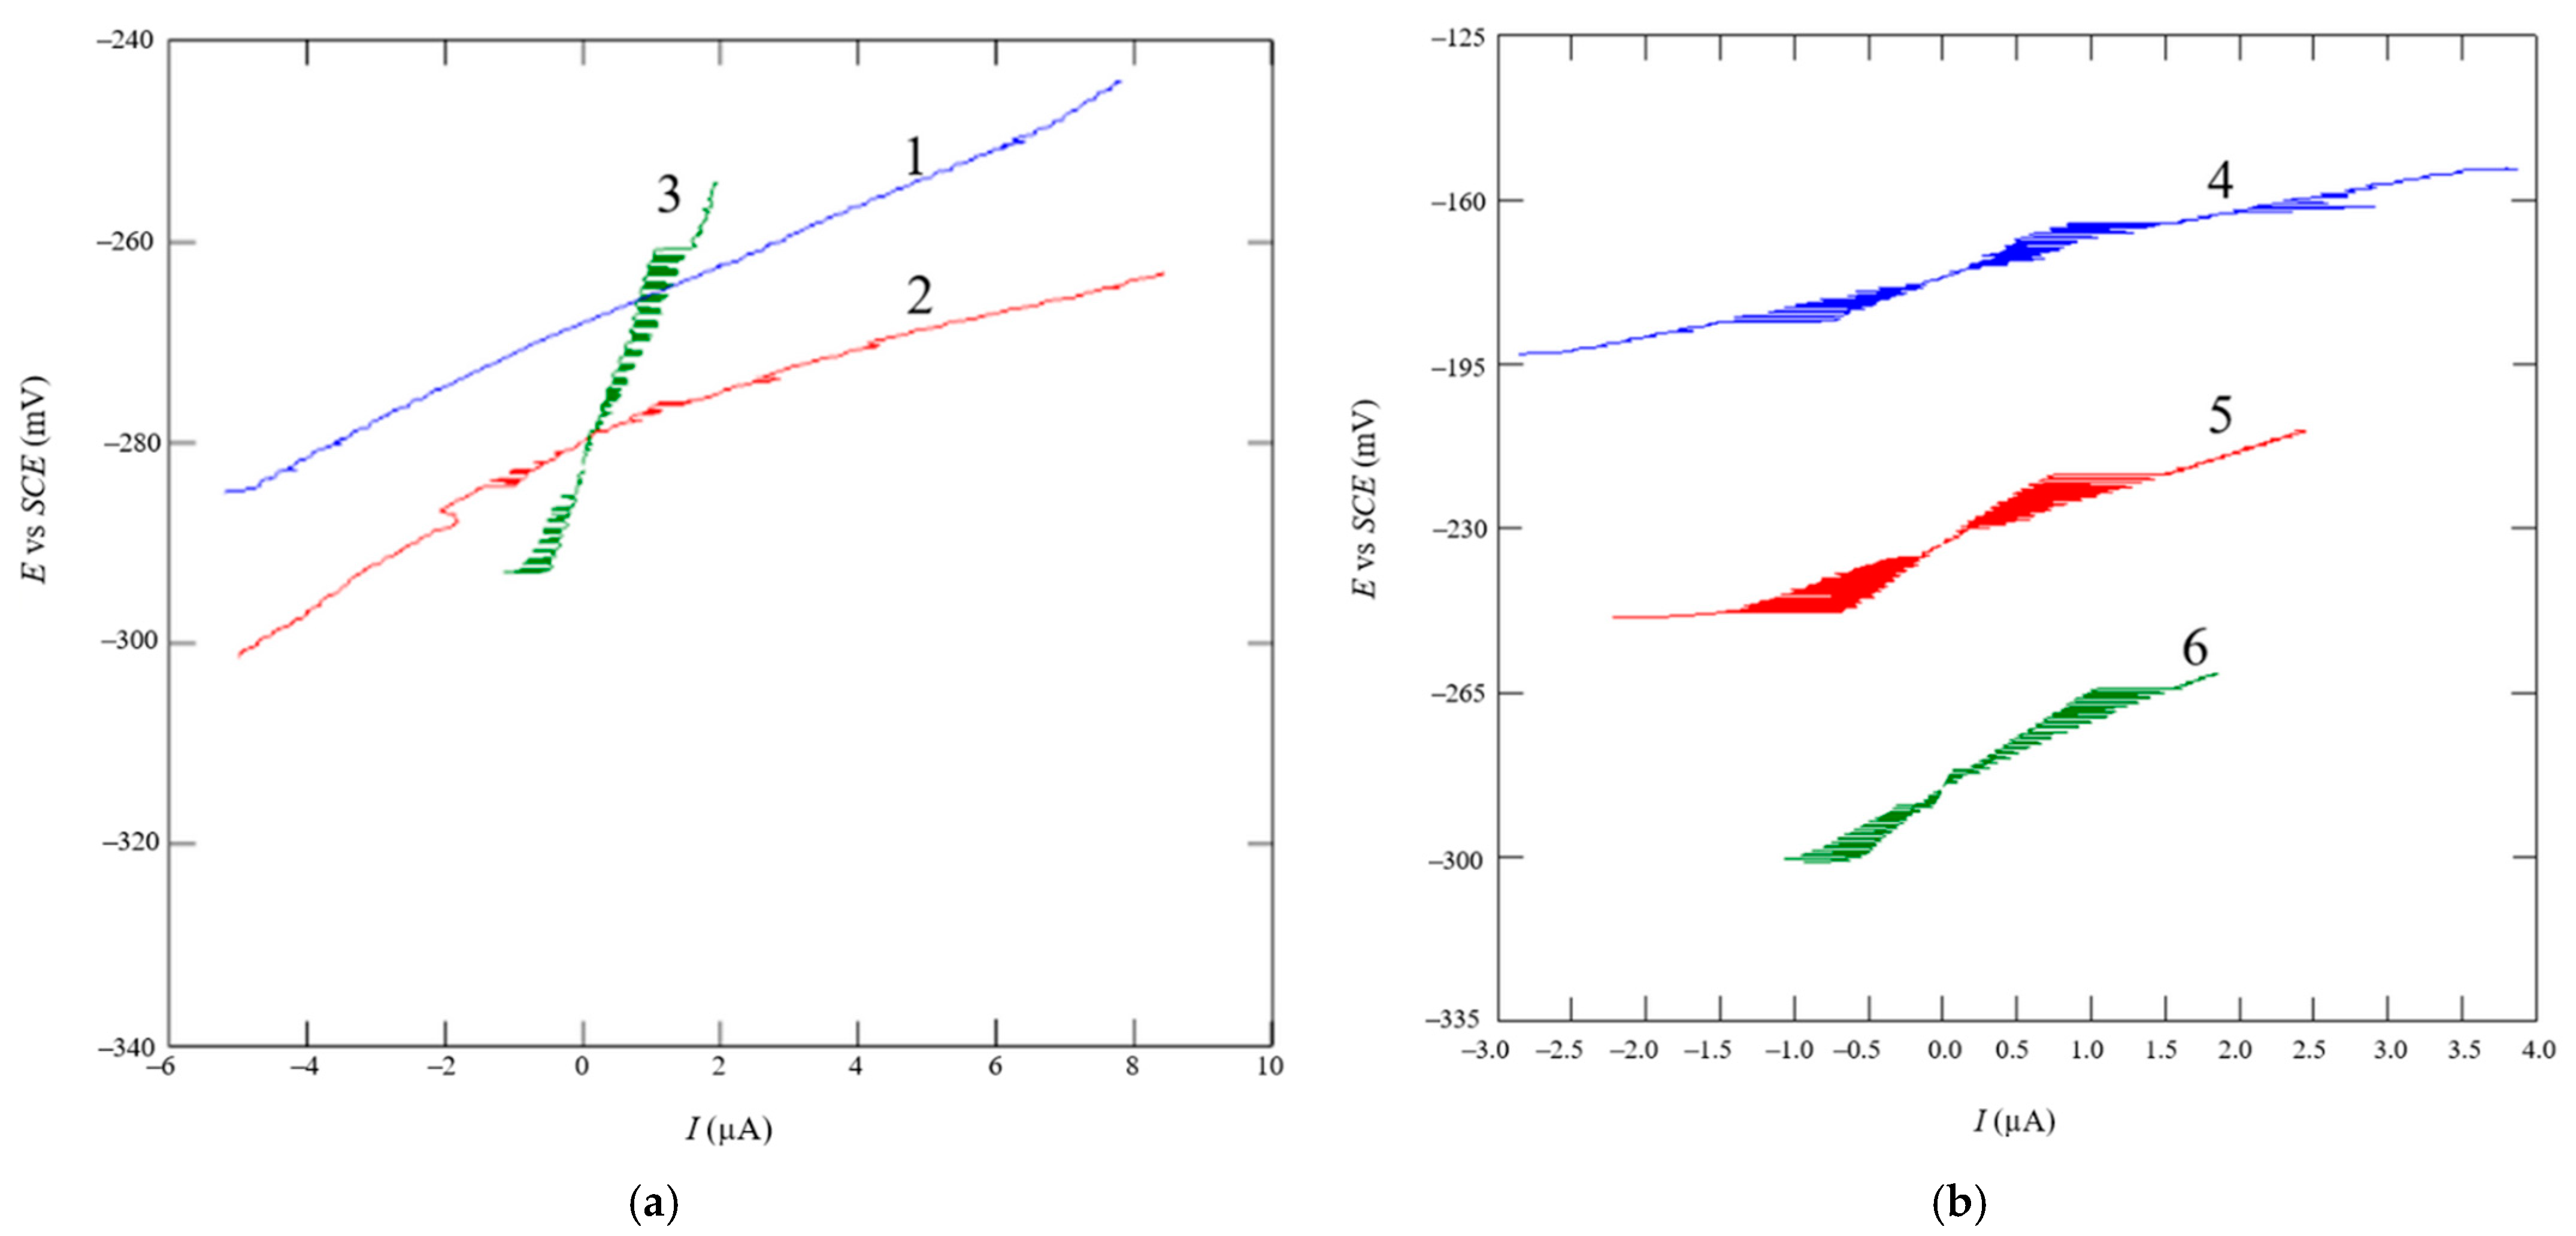
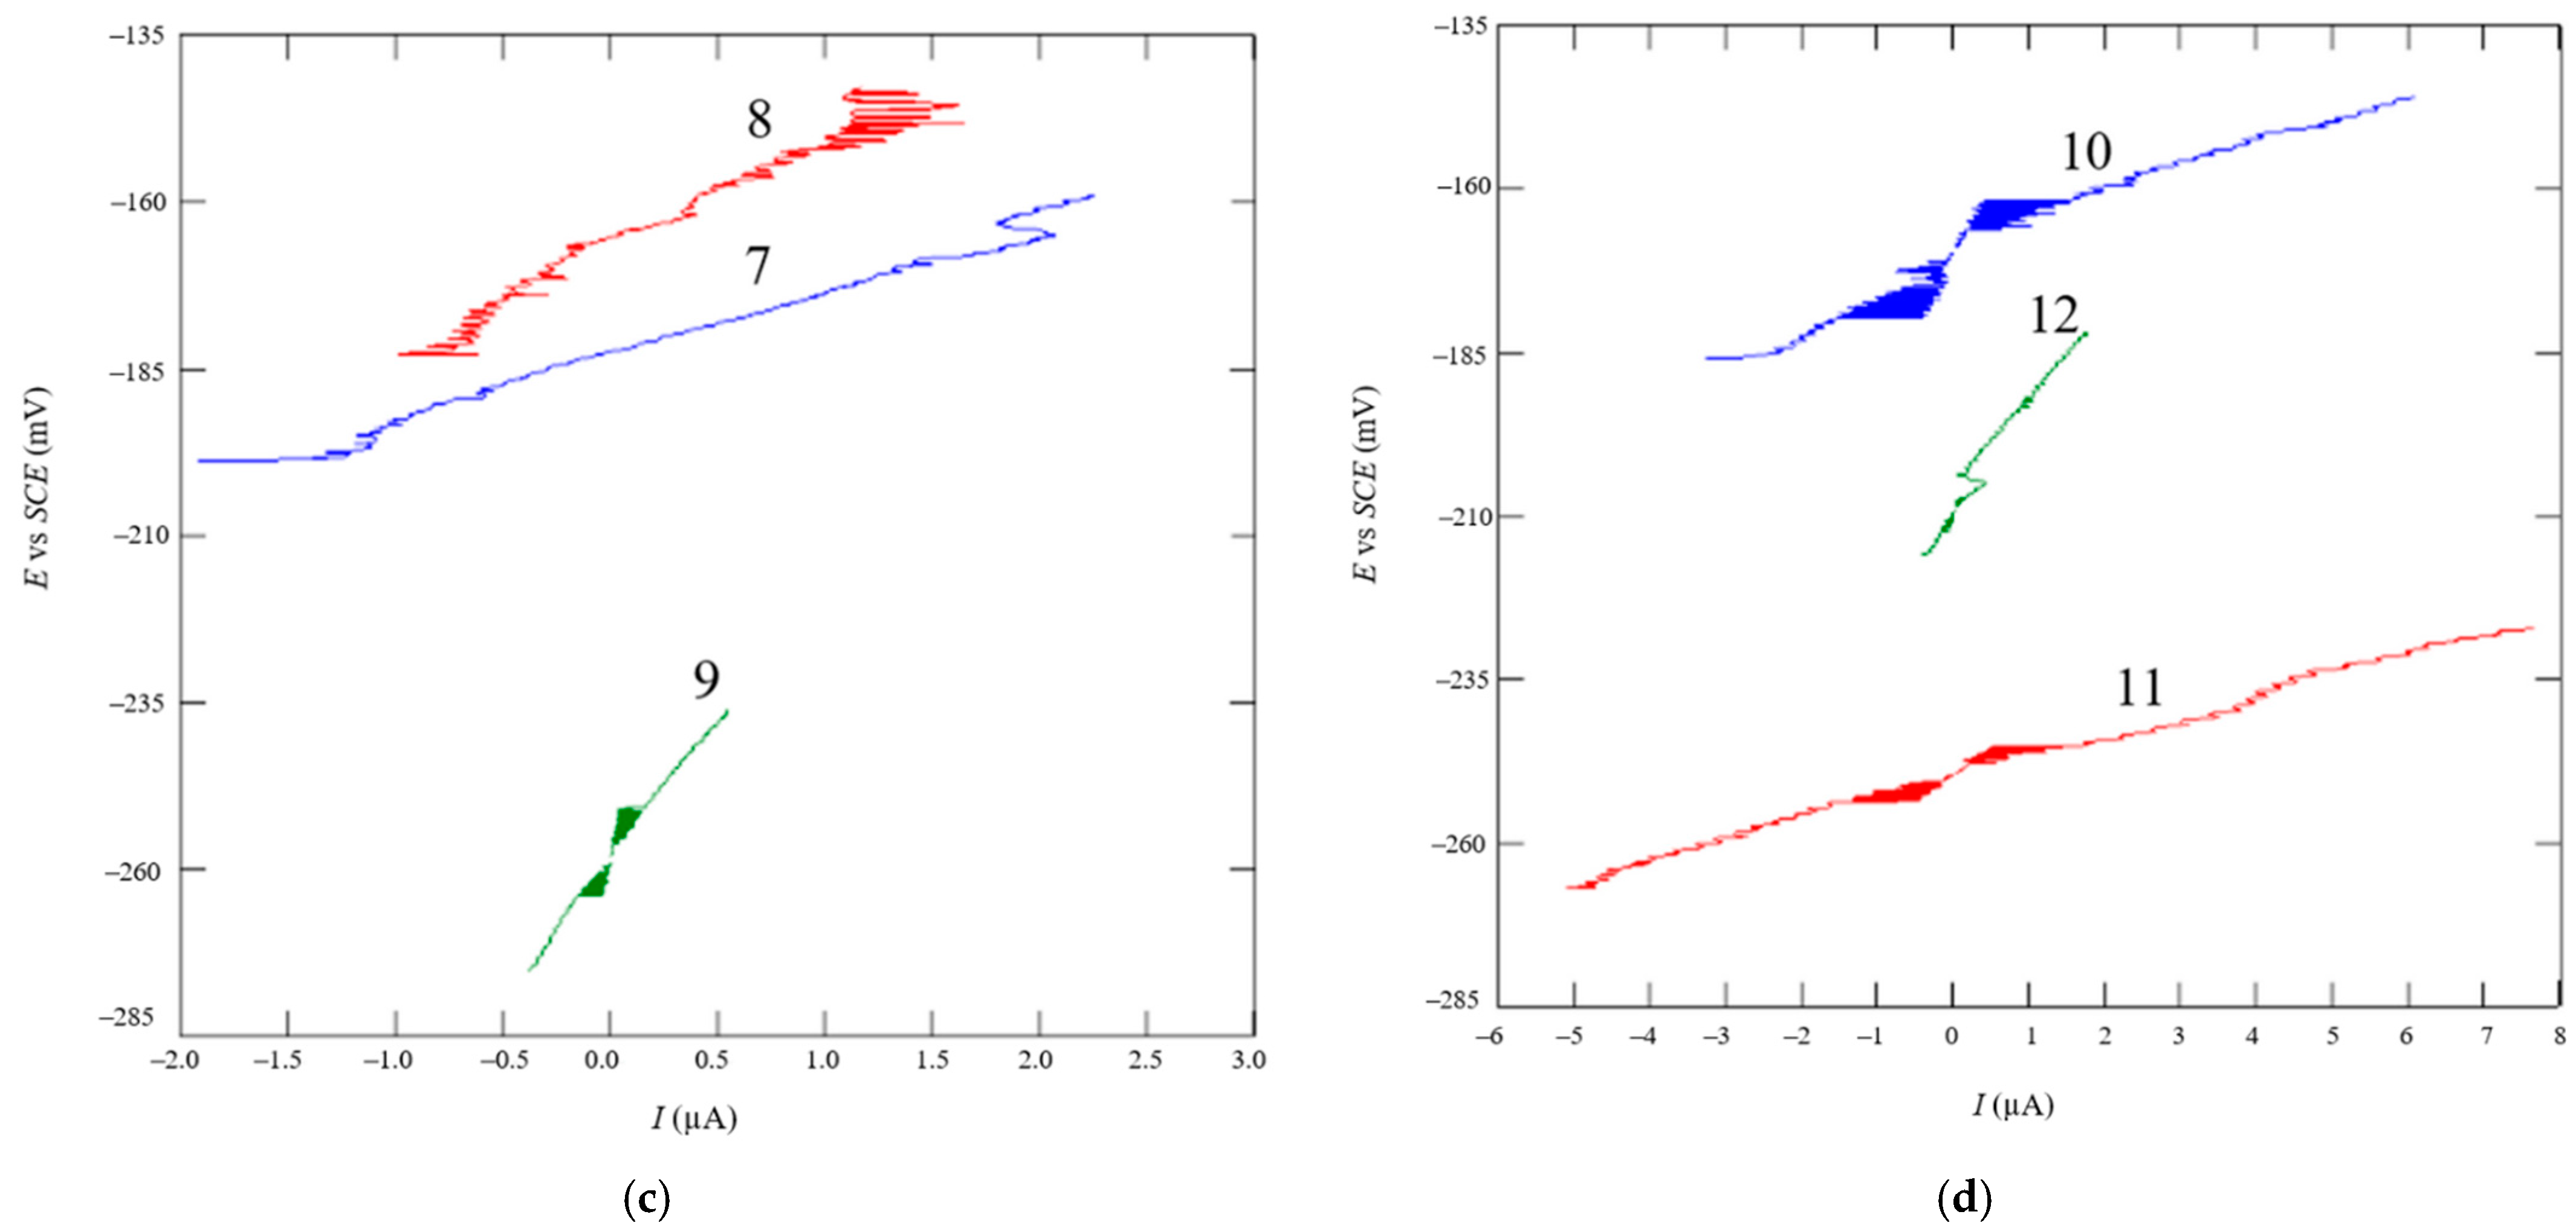
2.3.2. Linear Polarization

Linear polarization is a method used to determine polarization resistance or resistance to Faraday’s reaction (RP). This factor can be defined as resistance to the passage of electroactive particles from one phase (metal or alloy) to another (electrolyte) and vice versa., The higher its value, the higher the resistance of the test material to corrosion. Linear polarization resistance for all samples in the 3.5% NaCl solution is presented in Figure 6.
The linear polarization resistance method consists of applying a 20 mV potential variation to the metal below and above the open circuit potential (EOC). In this narrow region, the plot of potential vs. current is approximately linear. The slope of that linear polarization curve at the corrosion potential is defined as the polarization resistance (RP). Higher polarization resistance means lower corrosion current. The values of polarization resistance for all samples are graphically presented in Figure 7.

2.3.3. Tafel Extrapolation

Tafel extrapolation is a method by which we determine the corrosion rate of a particular sample in the testing medium (a 3.5% NaCl solution). The results provided by the SoftCorr III are presented graphically in semi-logarithmic form (Figure 8). By extrapolating the linear portion of anodic and cathodic curves to the corrosion potential, the value of the corrosion current density is determined and the corrosion rate is calculated. Figure 8 shows anodic and cathodic polarization curves for samples in the 3.5% NaCl solution.
The corrosion rate vcorr was calculated from the corrosion current density jcorr obtained from the Tafel diagram, according to the ASTM G5-94 (Equation (1)) [16]:
v c o r r = 0.13 × j c o r r × E W ρ
where
  • ρ—density, g/cm3;
  • jcorr—corrosion current density, µA/cm2; and
  • Ew—equivalent weight, g.
The calculated corrosion rate gives a clearer picture of corrosion resistance. The calculated results are graphically presented in Figure 9.
Compared to the linear polarization method, the Tafel plot was performed in a wider potential range of ±250 mV with respect to corrosion potential, providing the data concerning corrosion current and corrosion process kinetics [17].

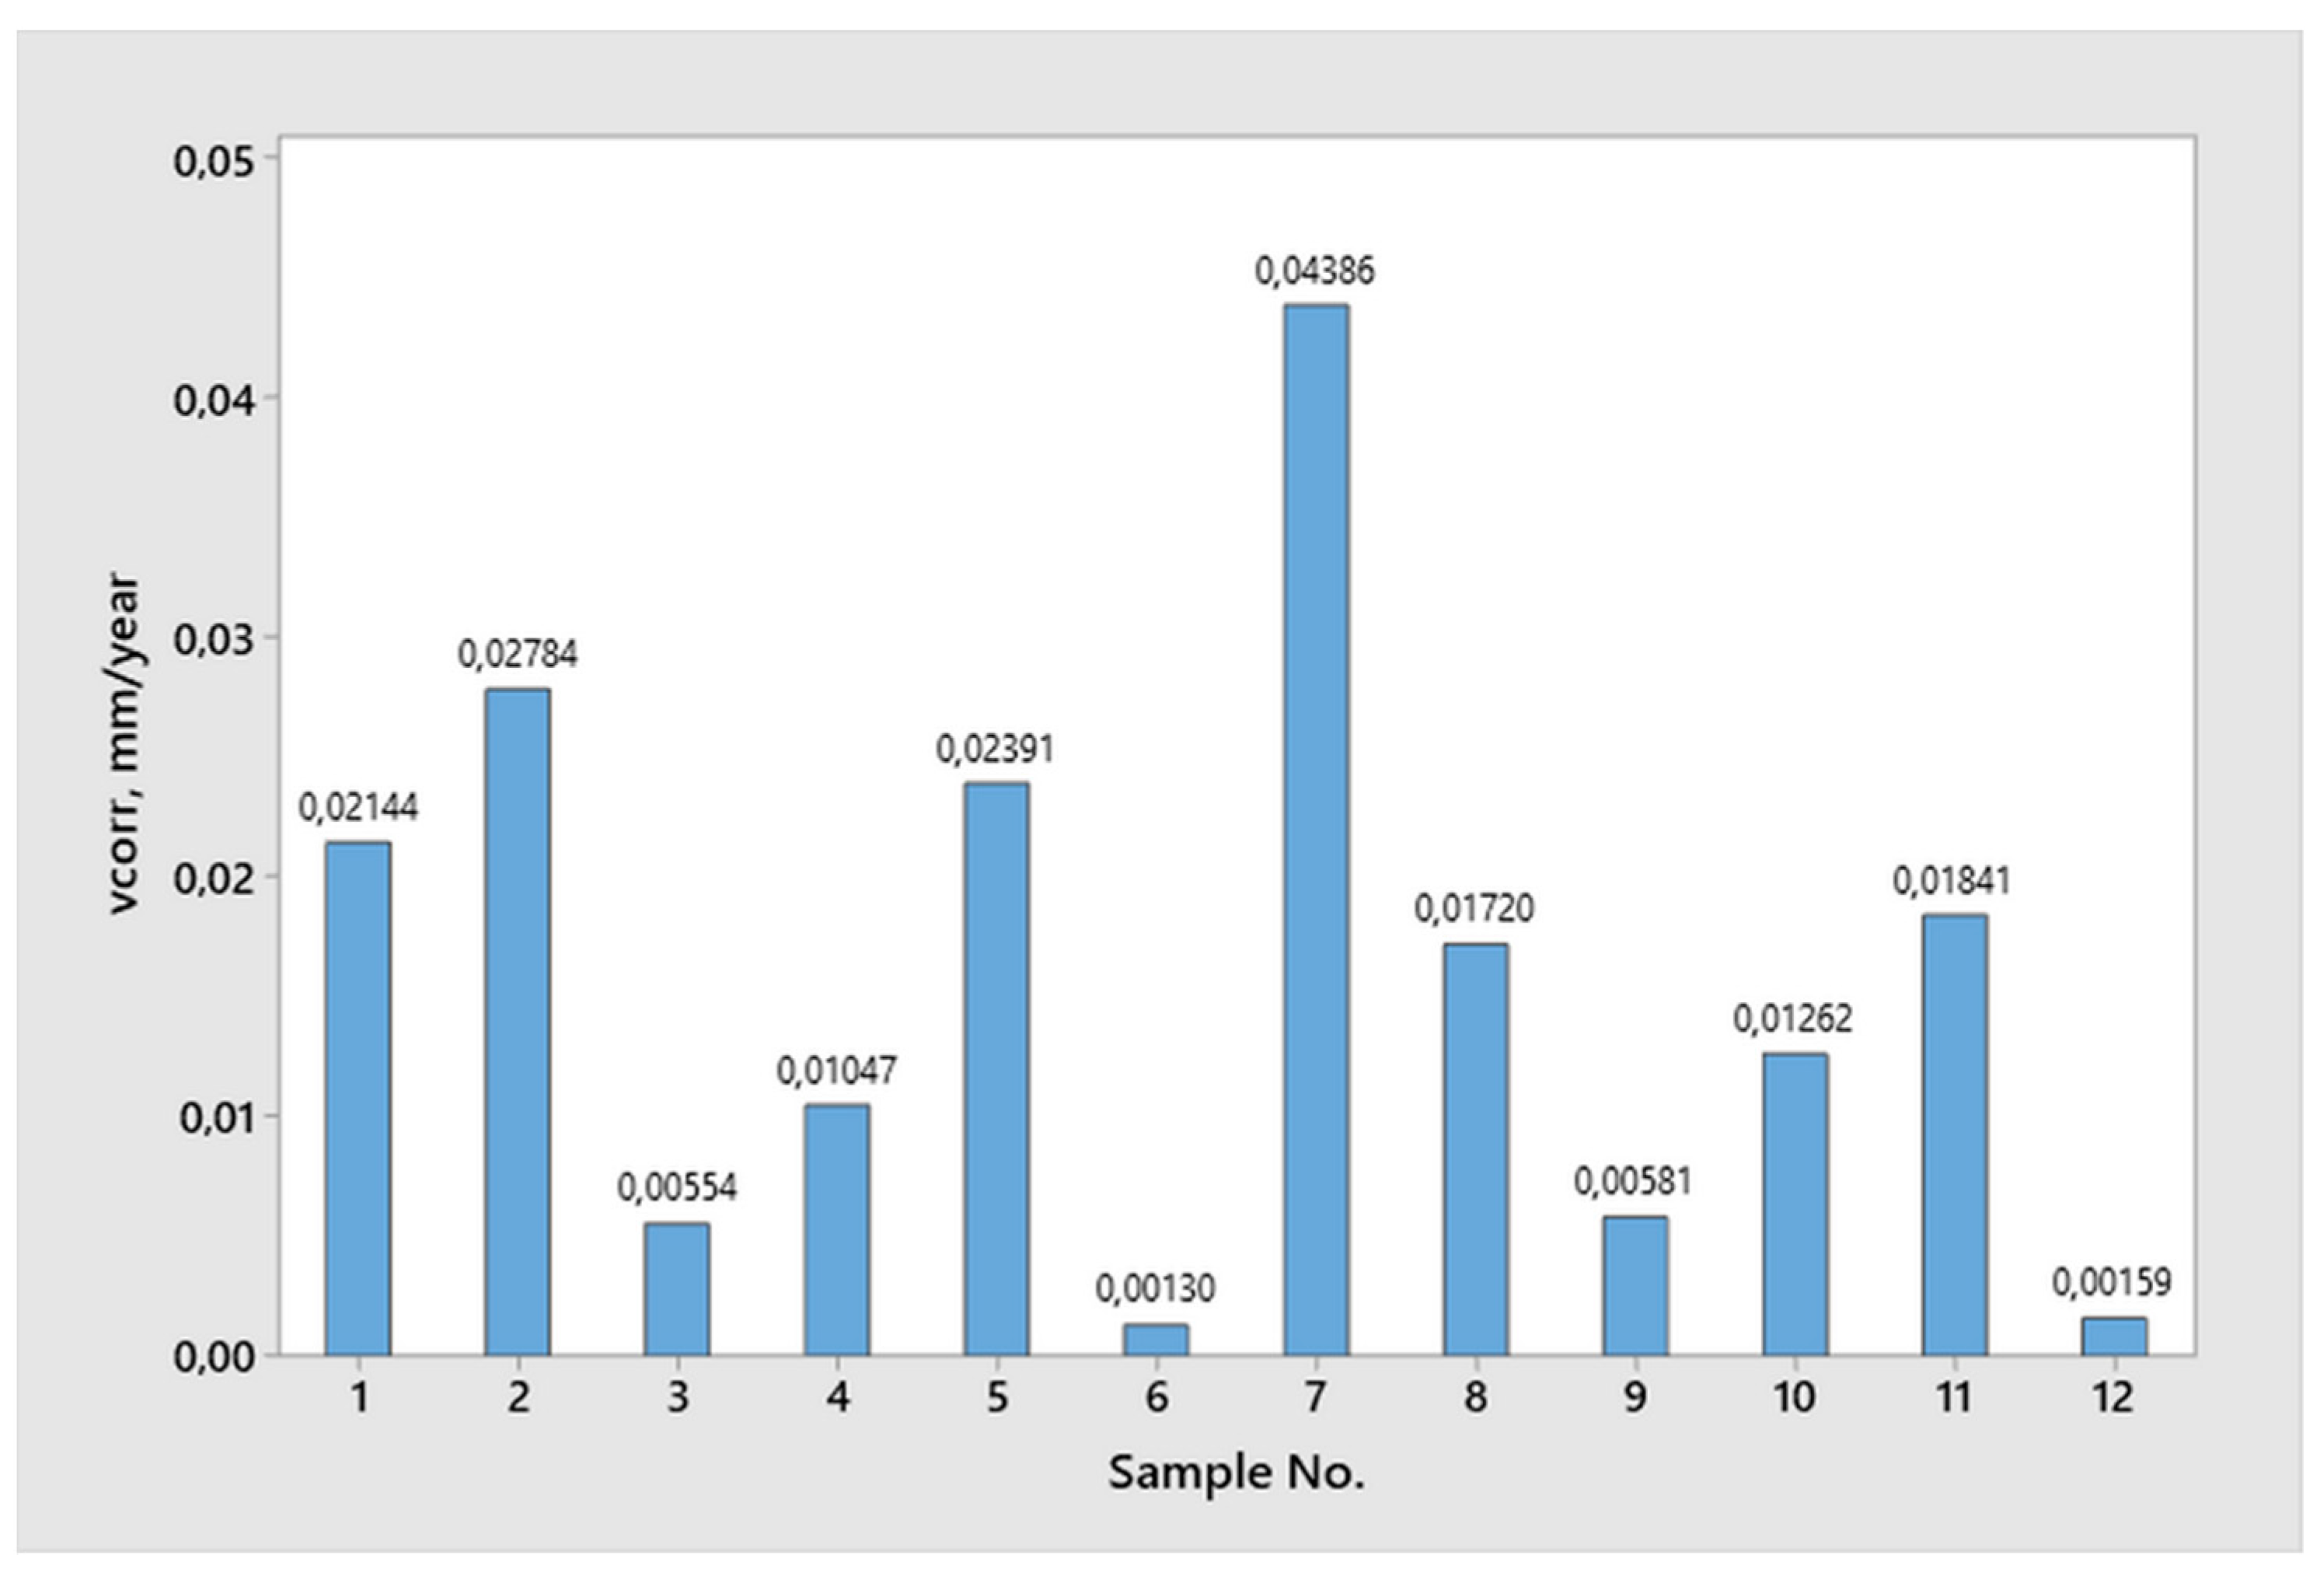
3. Results and Discussion

On the basis of the results of open circuit potential EOC, we can conclude that all of the samples have a certain dissolution in the 3.5% NaCl solution because the values of open circuit potential for all of the samples are less than zero. Based on the obtained results, however, we cannot ascertain any correlation between the true strain value and the differences in the surfacing with the measured potential of EOC. Likewise, we cannot conclude from these tests that the degree of deformation and quality of sample finishing has influenced corrosion resistance.
In order to determine the influence of the degree of plastic deformation and the surfacing type on corrosion resistance and corrosion rate of the stainless steel AISI 304, an analysis of the variance (ANOVA method) and Multiple Comparisons t-Test (Fisher LSD) was conducted for the results of Linear polarization and Tafel extrapolation methods. While a t-Test is used to determine if there is a significant difference between the means of two groups, ANOVA is used to demonstrate if there are any statistical differences between the means of three or more independent groups. The results of the corrosion resistance and the results of the corrosion rate are presented in Table 4 and Table 5, respectively. Using the ANOVA method, it was determined that the p-value was 0.907 for the corrosion resistance and 0.698 for the corrosion rate. The p-values represent sufficient evidence to support the conclusion that all of the means of the corrosion resistance and corrosion rate for different deformation degrees are equal when the significance level (alpha) is set at 0.05. The interval plot displays the mean and confidence interval for corrosion resistance and corrosion rate depending on the deformation degree (Figure 10 and Figure 11).
It can be concluded that the deformation degree has no statistically significant influence on corrosion resistance and corrosion rate.
Using the ANOVA method, the influence of the surfacing type on the corrosion resistance and corrosion rate was also analyzed. The p-value (0.001) for the corrosion resistance and p-value (0.032) for the corrosion rate represent sufficient evidence to support the conclusion that the means of the corrosion resistance and the means of the corrosion rate for different surfacing types are not all equal when alpha is set at 0.05 (Figure 12 and Figure 13).
To explore the differences among the means for different surfacing types, the Multiple Comparisons t-Test (Fisher LSD) was applied. In accordance with the Multiple Comparisons t-Test (Fisher LSD), if an interval does not contain zero, then the corresponding means are significantly different. Multiple Comparisons t-Test (Fisher LSD) showed that the mean of the corrosion resistance and the mean of the corrosion rate for the polished surfacing type are significantly different from the means of ground and cut surfacing types (Figure 14 and Figure 15). The difference between cut surfacing types and ground surfacing types are not statistically significant for both corrosion resistance and corrosion rate when alpha is set at 0.05.
Photographs of all observed surfaces, before and after corrosion resistance testing, do not show any visible changes in surface structure. All surface photographs are classified in Table 5.
The results of height roughness parameters Sa and Sz are presented in Figure 3.
Using the ANOVA method, it was determined that the p-value (0.940) for the arithmetic mean height parameter Sa and the p-value (0.973) for the maximum height parameter Sz represent sufficient evidence to support the conclusion that all of the means of the parameter Sa and parameter Sz for different deformation degrees are equal when alpha is set at 0.05. The interval plot displays the mean and confidence interval for the Sa and Sz parameters with respect to the deformation degree (Figure 16 and Figure 17).
Using the ANOVA method, the influence of the surfacing type on the roughness height parameters Sa and Sz was also analyzed. The p-value (0.032) for parameter Sa and the p-value (0.000) for parameter Sz represent sufficient evidence to support the conclusion that the mean values of the roughness parameters Sa and Sz for different surfacing types are not all equal when alpha is set at 0.05 (Figure 18 and Figure 19).
In order to explore the differences among the means for different surfacing types, multiple comparison results were examined. The Multiple Comparisons t-Test (Fisher LSD) demonstrated that the mean of the roughness height parameters Sa and Sz for the polished surfacing type was significantly different from the means for ground and cut surfacing types (Figure 20 and Figure 21). The difference between the corrosion rate for cut surfacing types and ground surfacing types was not statistically significant when alpha was set at 0.05. In accordance with the Fisher test, if the interval does not contain zero, the corresponding means are significantly different.
To explore the differences among the means, the Tukey Pairwise Comparisons and the Hsu’s MCB (Multiple Comparisons with the Best) were also applied. All of the tests that were used gave equal results. The analysis of the results was performed using a trial version of the Statistical Software Minitab.

4. Conclusions

Plastically deformed products of stainless steel are often used in corrosion aggressive environments in the food industry. In these conditions, anti-corrosion treatments can be very limited. For this reason, it is important to obtain insight into the corrosion behavior of a material in different circumstances of its exploitation. This paperwork presents research into the corrosion resistance of plastically deformed stainless steel 304 at different deformation degrees with different surfacing types. The main conclusions of the corrosion resistance testing in 3.5% NaCl solution are as follows:
  • From the open circuit potential testing, we can conclude that none of the samples are fully corrosion resistant and that all samples have a certain dissolution in the 3.5% NaCl solution. However, we cannot obtain any correlation between the true strain value and the differences in the surfacing with the measured potential of EOC. Therefore, we cannot conclude that the deformation degree and quality of sample finishing has an influence on corrosion resistance.
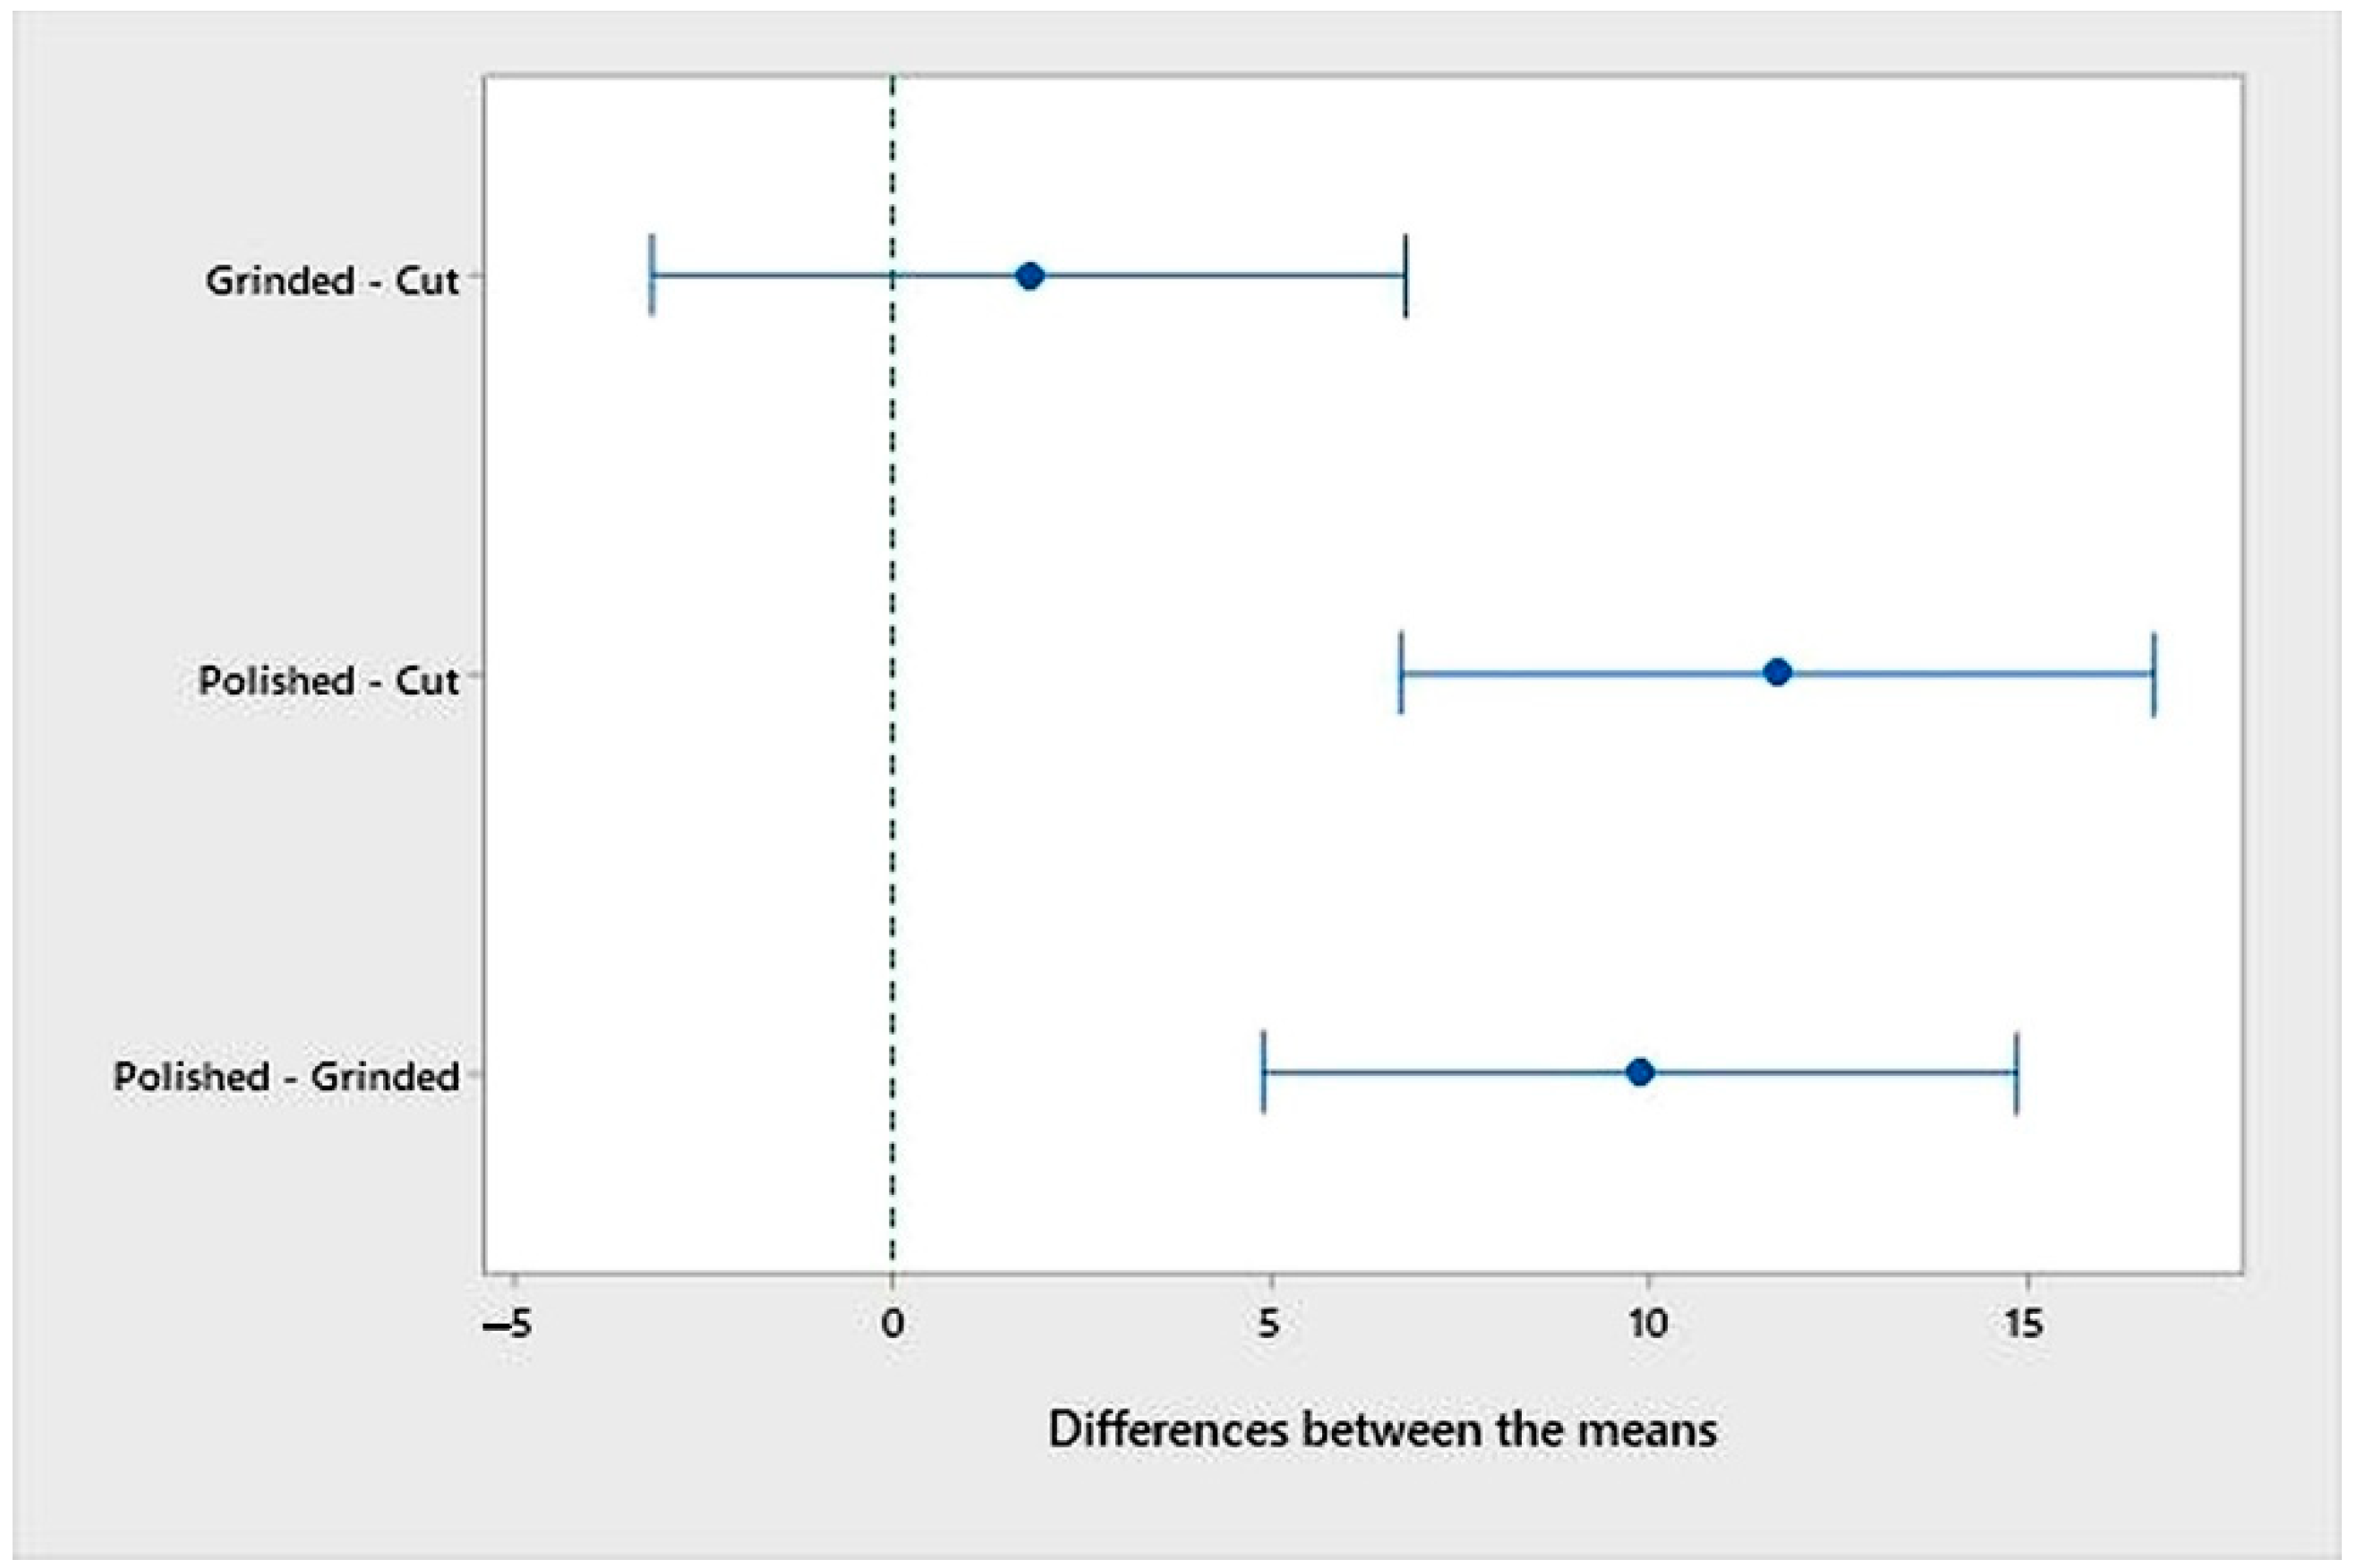
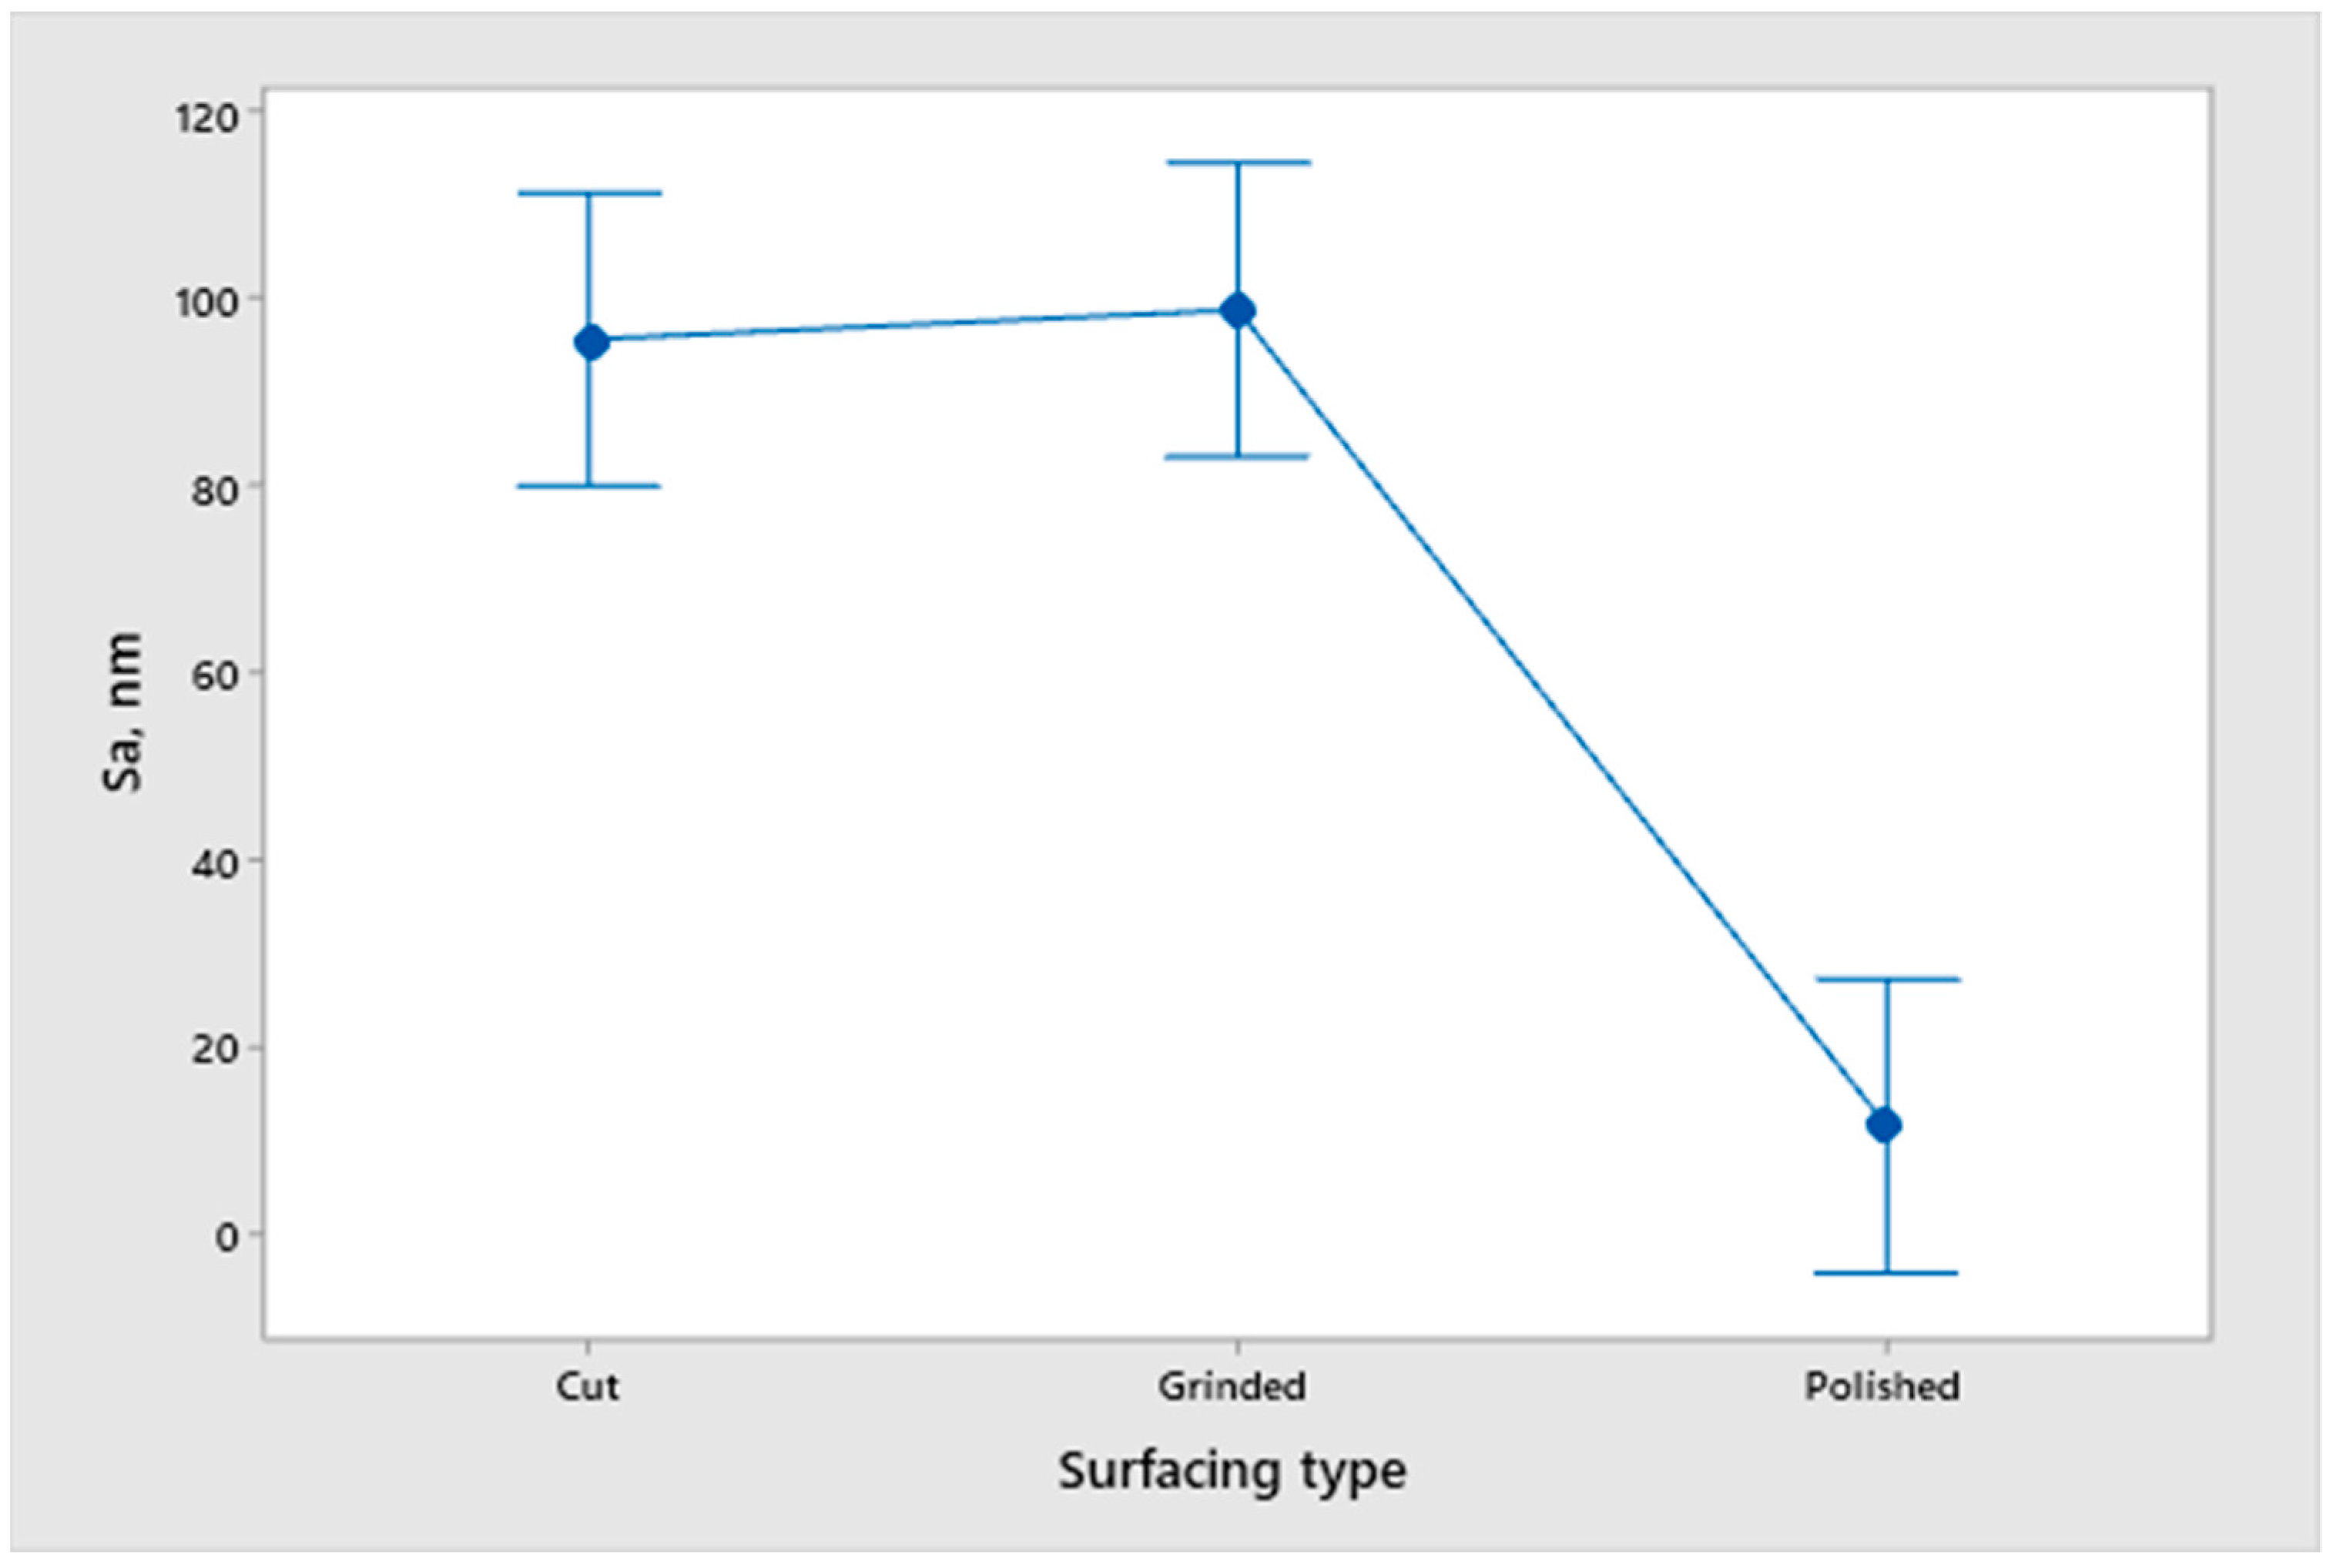
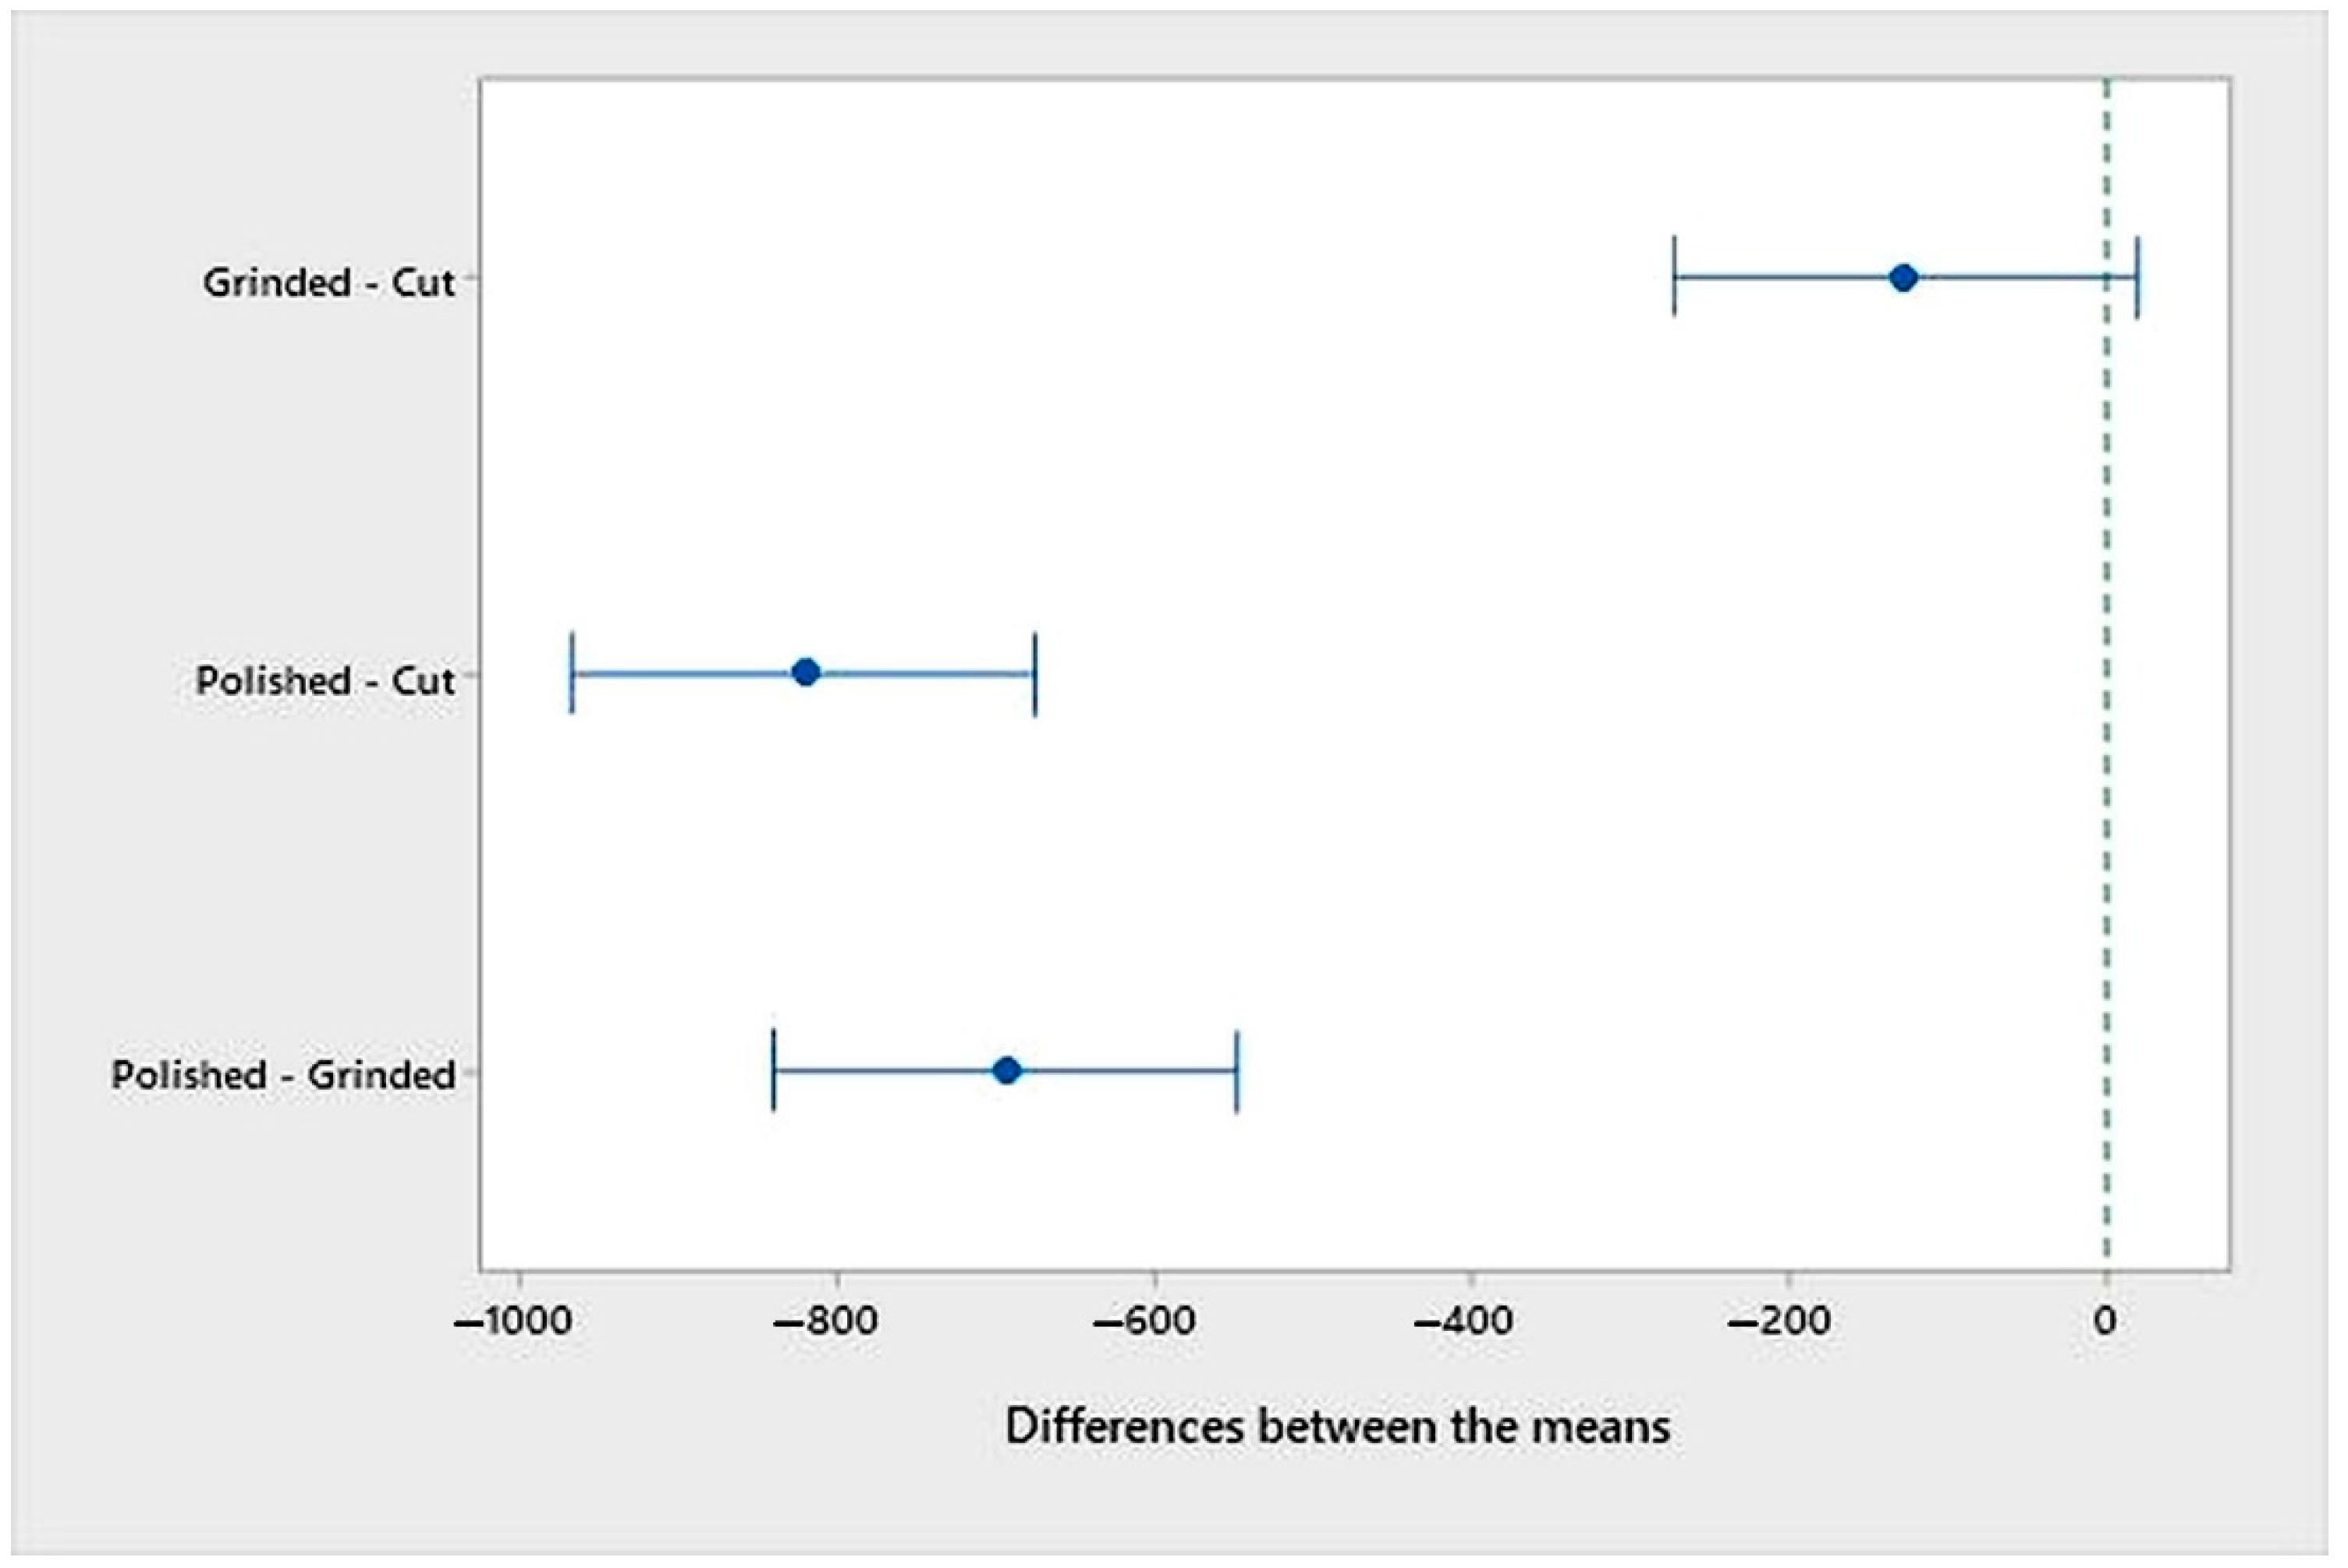
  • An analysis of the variance (ANOVA method) and Multiple Comparisons t-Test (Fisher LSD) was conducted for the results of the Linear polarization method and the Tafel extrapolation method. It can be concluded that the deformation degree has no statistically significant influence on corrosion resistance and corrosion rate. Multiple Comparisons t-Test (Fisher LSD) showed that the mean of the corrosion resistance and the mean of the corrosion rate for the polished surfacing type are significantly different from the means for ground and cut surfacing types. The difference between cut surfacing types and ground surfacing types is not statistically significant for either corrosion resistance or corrosion rate when alpha is set at 0.05.
  • Photographs of all surfaces before and after corrosion resistance testing do not show any visible changes on the surfaces.
According to all of the above conclusions, we can claim that cold deformation of stainless steel 304 did not have a negative influence on its applications in an environment containing NaCl (aq). Although a polished surface presents the best choice for adequate product surfacing in such conditions, changes in surface roughness (caused by localized wear or simple scratches) do not present a greater danger for general corrosion resistance in a controlled period.

Author Contributions

Conceptualization, Z.K.; methodology, I.S.; writing—original draft preparation, Z.K. and B.R.; validation, B.R.; writing—review and Editing, A.H.N.; formal analysis and data curation, A.R.; investigation, D.V. All authors have read and agreed to the published version of the manuscript.

Funding

This research received no external funding.

Institutional Review Board Statement

Not applicable.

Informed Consent Statement

Not applicable.

Data Availability Statement

Data is contained within the article.

Acknowledgments

The authors acknowledge funding from the European Regional Development Fund (ESI ERDF) for the Innovative Croatian Solutions for the Global Automotive Industry (FAT) project.

Conflicts of Interest

The authors declare no conflict of interest.

References

  1. Danchenko, V.N. Metal Forming; NMetAU: Dnepropetrovsk, Ukraine, 2007. [Google Scholar]
  2. Kingkam, W.; Zhao, C.Z.; Li, H.; Zhang, H.X.; Li, Z.M. Hot Deformation and Corrosion Resistance of High-Strength Low-Alloy Steel. Acta Metall. Sin. 2019, 32, 495–505. [Google Scholar] [CrossRef] [Green Version]
  3. Lv, J.; Guo, W.; Liang, T. The effect of pre-deformation on corrosion resistance of the passive film formed on 2205 duplex stainless steel. J. Alloy. Compd. 2016, 686, 176–183. [Google Scholar] [CrossRef]
  4. Wu, G.; Singh, P.M. Effect of Plastic Deformation on Pitting Mechanism of SS304. Metall. Mater. Trans. A 2019, 50, 4750–4757. [Google Scholar] [CrossRef]
  5. Peguet, L.; Malki, B.; Baroux, B. Influence of cold working on the pitting corrosion resistance of stainless steels. Corros. Sci. 2007, 49, 1933–1948. [Google Scholar] [CrossRef]
  6. Hsu, C.-H.; Chen, T.-C.; Huang, R.-T.; Tsay, L.-W. Stress Corrosion Cracking Susceptibility of 304L Substrate and 308L Weld Metal Exposed to a Salt Spray. Materials 2017, 10, 187. [Google Scholar] [CrossRef] [PubMed] [Green Version]
  7. Tung, H.-M.; Chen, T.-C.; Chang, J.-M. The Effects of Cold Work on the Incipient Pitting Morphology Evolution of 304L Stainless Steels. Corrosion 2021, 77, 339–349. [Google Scholar] [CrossRef]
  8. Bösing, I.; Herrmann, M.; Bobrov, I.; Thöming, J.; Kuhfuss, B.; Epp, J.; Baune, M. The influence of microstructure deformation on the corrosion resistance of cold formed stainless steel. MATEC Web Conf. 2018, 190, 04002. [Google Scholar] [CrossRef]
  9. Kumar, V.; Gupta, R.K.; Das, G. Influence of Forging and Annealing on the Microstructure and Corrosion Behavior of Austenitic Stainless Steel. J. Inst. Eng. 2020, 101, 105–109. [Google Scholar] [CrossRef]
  10. Ralston, K.D.; Birbilis, N. Effect of Grain Size on Corrosion: A Review. Corrosion 2010, 66, 1–4. [Google Scholar] [CrossRef]
  11. Liu, L.; Li, Y.; Wang, F. Influence of Microstructure on Corrosion Behaviour of a Ni-Based Superalloy in 3.5 wt.% NaCl. Electrochim. Acta 2007, 52, 7193–7202. [Google Scholar] [CrossRef]
  12. Xu, C.C.; Hu, G. Effect of deformation-induced martensite on the pit propagation behavior of 304 stainless steel. Anti-Corros. Methods Mater. 2004, 51, 381–388. [Google Scholar] [CrossRef]
  13. Dacapo: Corrosion Resistance Table. Available online: https://dacapo.com/assets/download/tech/corrosion_resistance_table.pdf (accessed on 30 March 2021).
  14. Guanyu Tube: Corrosion Resistance Table of Stainless Steel Nickel Monel Inconel. Available online: https://tubingchina.com/Corrosion-Resistance-Table.htm (accessed on 30 March 2021).
  15. Evgeny, B.; Hughes, T.; Eskin, D. Effect of surface roughness on corrosion behaviour of low carbon steel in inhibited 4 M hydrochloric acid under laminar and turbulent flow conditions. Corros. Sci. 2016, 103, 196–205. [Google Scholar] [CrossRef]
  16. ASTM G5-94(2011)e1. Standard Reference Test Method for Making Potentiostatic and Potentiodynamic Anodic Polarization Measurements. Annu. Book ASTM Stand. 2004, 3, 48–58. [Google Scholar]
  17. Tkacz, J.; Minda, J.; Fintová, S.; Wasserbauer, J. Comparison of Electrochemical Methods for the Evaluation of Cast AZ91 Magnesium Alloy. Materials 2016, 9, 925. [Google Scholar] [CrossRef] [Green Version]
Figure 1. (a) Final sample features; (b) finished samples.
Sustainability 13 05871 g001
Figure 2. Images of surface topography for different surface finishing samples in 2D and 3D formats: the surfaces of (a) raw, (b) ground, and (c) polished material.
Sustainability 13 05871 g002
Figure 3. Measured values of arithmetic mean height parameter Sa and maximum height parameter Sz.
Sustainability 13 05871 g003
Figure 4. Open circuit potential of samples in the 3.5% NaCl solution: (a) not deformed (1, 2, and 3), (b) first degree of deformation (4, 5, and 6), (c) second degree of deformation (7, 8, and 9), and (d) third degree of deformation (10, 11, and 12).
Sustainability 13 05871 g004
Figure 5. Measured values of open circuit potential.
Sustainability 13 05871 g005
Figure 6. Linear polarization resistance of samples in the 3.5% NaCl solution: (a) not deformed (1, 2, and 3), (b) first degree of deformation (4, 5, and 6), (c) second degree of deformation (7, 8, and 9), and (d) third degree of deformation (10, 11, and 12).
Sustainability 13 05871 g006aSustainability 13 05871 g006b
Figure 7. Measured polarization resistance.
Sustainability 13 05871 g007
Figure 8. Polarization curves for samples in the 3.5% NaCl solution: (a) not deformed (1, 2, and 3), (b) first degree of deformation (4, 5, and 6), (c) second degree of deformation (7, 8, and 9), and (d) third degree of deformation (10, 11, and 12).
Sustainability 13 05871 g008
Figure 9. Tafel extrapolation—corrosion rate.
Sustainability 13 05871 g009
Figure 10. The interval plot of the mean and confidence interval for corrosion rate depending on the deformation degree.
Sustainability 13 05871 g010
Figure 11. The interval plot of the mean and confidence interval for corrosion resistance depending on the deformation degree.
Sustainability 13 05871 g011
Figure 12. The interval plot of the mean and confidence interval for corrosion resistance depending on the surfacing type.
Sustainability 13 05871 g012
Figure 13. The interval plot of the mean and confidence interval for corrosion rate depending on the surfacing type.
Sustainability 13 05871 g013
Figure 14. Multiple Comparisons t-Test (Fisher LSD) for corrosion resistance.
Sustainability 13 05871 g014
Figure 15. Multiple Comparisons t-Test (Fisher LSD) for corrosion rate.
Sustainability 13 05871 g015
Figure 16. The interval plot of the mean and confidence interval for roughness height parameter Sa depending on the deformation degree.
Sustainability 13 05871 g016
Figure 17. The interval plot of the mean and confidence interval for roughness height parameter Sz depending on the deformation degree.
Sustainability 13 05871 g017
Figure 18. The interval plot of the mean and confidence interval for roughness height parameter Sa depending on the surfacing type.
Sustainability 13 05871 g018
Figure 19. The interval plot of the mean and confidence interval for roughness height parameter Sz depending on the surfacing type.
Sustainability 13 05871 g019
Figure 20. Multiple Comparisons t-Test (Fisher LSD) for roughness height parameter Sa.
Sustainability 13 05871 g020
Figure 21. Multiple Comparisons t-Test (Fisher LSD) for roughness height parameter Sz.
Sustainability 13 05871 g021
Table 1. Chemical compositions of the austenitic stainless steel 304 (X5 CrNi 18-10).
Chemical ElementC (%)Mn (%)P (%)S (%)Si (%)Cr (%)Ni (%)Mo (%)
0.082.000.0450.0300.751.068.050.29
Table 2. Final dimensions of samples after upsetting process.
DeformationAverage Sample Height h, mmTrue Strain
φ
Final Outer Diameter d0, mmFinal Inner Diameter d1, mmForming Force
F, kN
No Deformation40.0-207-
Stage 135.10.13217400
Stage 229.90.29238500
Stage 325.20.47269550
Table 3. Sample status and numbering.
Sample No.123456789101112
True Strainφ0 = 0φ1 = 0.13φ2 = 0.29φ3 = 0.47
SurfacingCGPCGPCGPCGP
Legend for surfacing: C—Cut Surface; G—Ground Surface; P—Polished Surface.
Table 4. Results of height (amplitude) area roughness parameters.
Height Area Roughness ParametersSaSzSvSpSkuSskSq
Surface Typenmnmnmnm--nm
Cut SurfaceArithmetic
Mean
105.51265.9628.5637.53.9−0.2202.2
Standard Deviation10.8692.5258.3485.42.10.6162.8
Ground SurfaceArithmetic
Mean
98.6730.1314.9415.32.70.1119.3
Standard Deviation21.186.153.163.00.30.224.3
Polished SurfaceArithmetic
Mean
11.6122.054.467.53.5−0.114.6
Standard Deviation3.313.211.312.40.70.54.0
Table 5. Photographs of sample surfaces before and after corrosion testing.
Sample No.Before Corrosion Resistance TestingAfter Corrosion Resistance TestingSample No.Before Corrosion Resistance TestingAfter Corrosion Resistance Testing
1 Sustainability 13 05871 i001 Sustainability 13 05871 i0027 Sustainability 13 05871 i003 Sustainability 13 05871 i004
2 Sustainability 13 05871 i005 Sustainability 13 05871 i0068 Sustainability 13 05871 i007 Sustainability 13 05871 i008
3 Sustainability 13 05871 i009 Sustainability 13 05871 i0109 Sustainability 13 05871 i011 Sustainability 13 05871 i012
4 Sustainability 13 05871 i013 Sustainability 13 05871 i01410 Sustainability 13 05871 i015 Sustainability 13 05871 i016
5 Sustainability 13 05871 i017 Sustainability 13 05871 i01811 Sustainability 13 05871 i019 Sustainability 13 05871 i020
6 Sustainability 13 05871 i021 Sustainability 13 05871 i02212 Sustainability 13 05871 i023 Sustainability 13 05871 i024
Publisher’s Note: MDPI stays neutral with regard to jurisdictional claims in published maps and institutional affiliations.

