3. Results
In the 2017/18 season, there was 7920 kg ha
−1 and 7070 kg ha
−1 of straw dry matter on the soil in the NTS and APS, respectively. In the NTS, the palisade grass was mowed on 27 November 2018, to facilitate soybean sowing, as the average green matter was 18,840 kg ha
−1.
Table 5 presents the initial soil characteristics.
Table 6,
Table 7 and
Table 8 show the values of the F test for the chemical attributes of the soil at depths of 0.0–0.2 and 0.2–0.4 m in the CPS, NTS, and APS, respectively, in the 2017/18, 2018/19, and 2019/20 seasons.
The Al3+ content was 0.0 cmolc dm−3 in several samples collected at depths of 0.0–0.2 and 0.2–0.4 m in the 2018/19 and 2019/20 seasons in the CPS and 0.0–0.2 m in the 2019/20 season in the NTS and APS. Consequently, no statistical analysis of Al3+ content was performed.
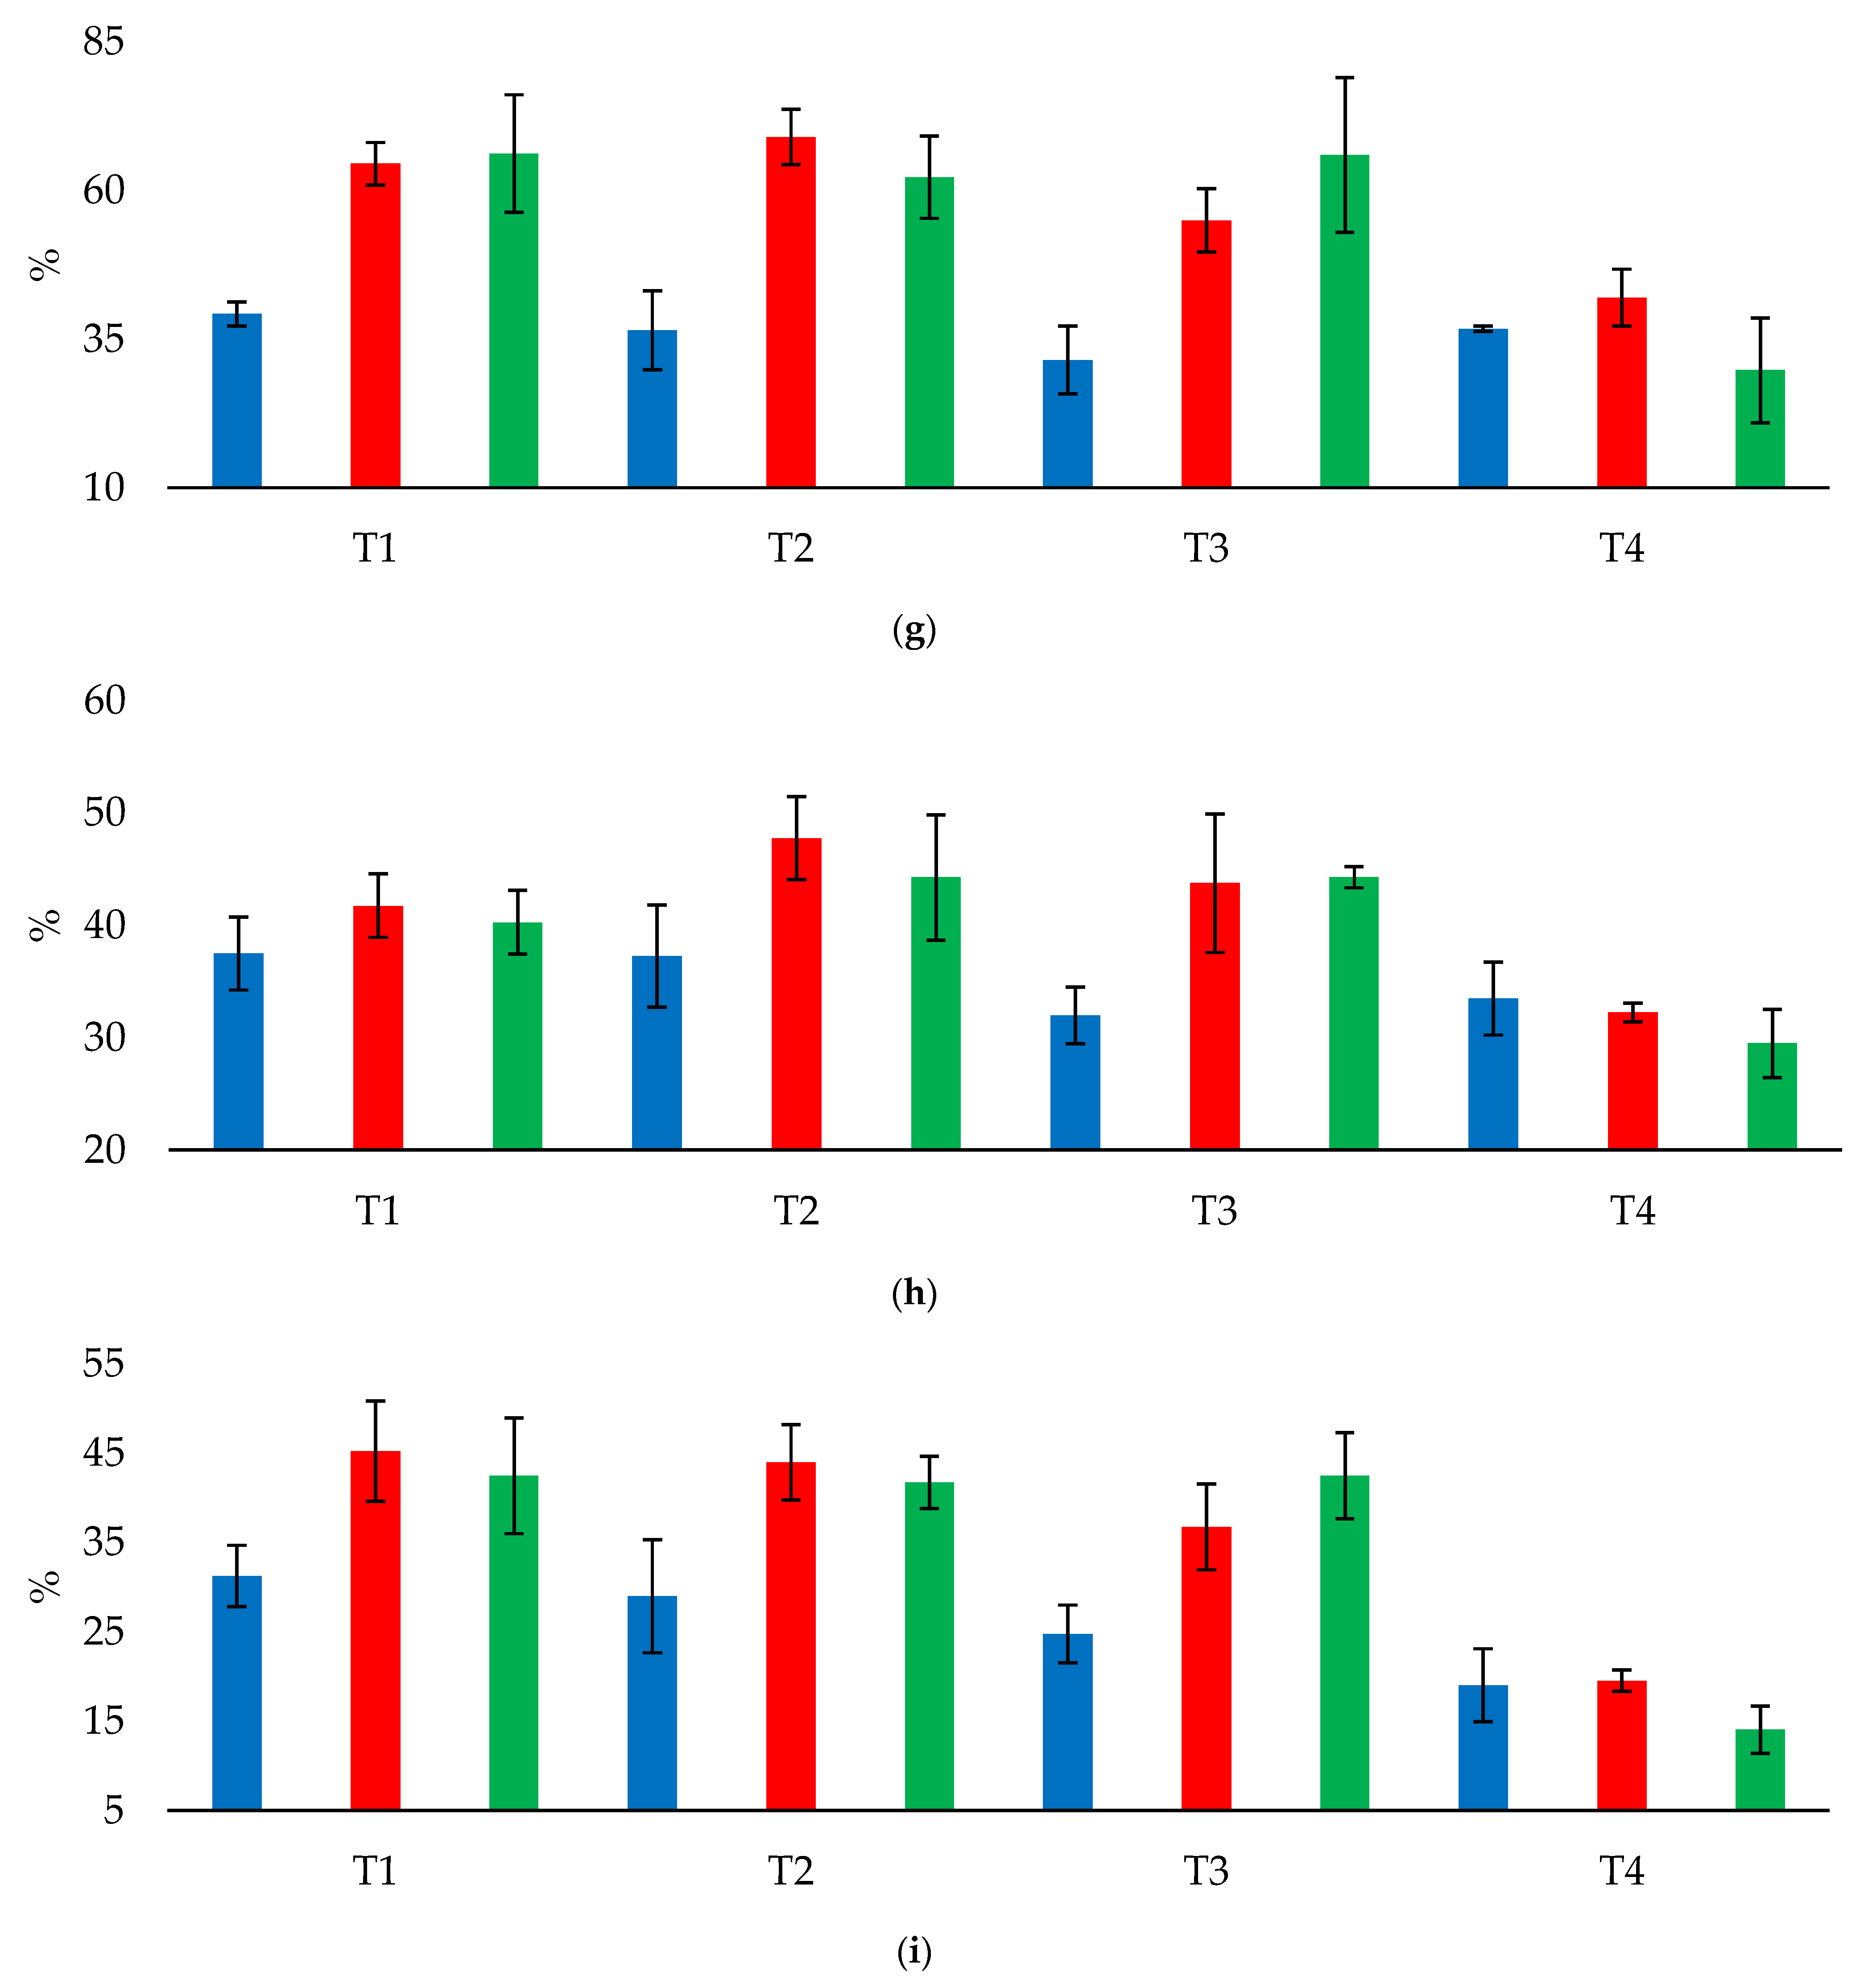
Figure 5,
Figure 6 and
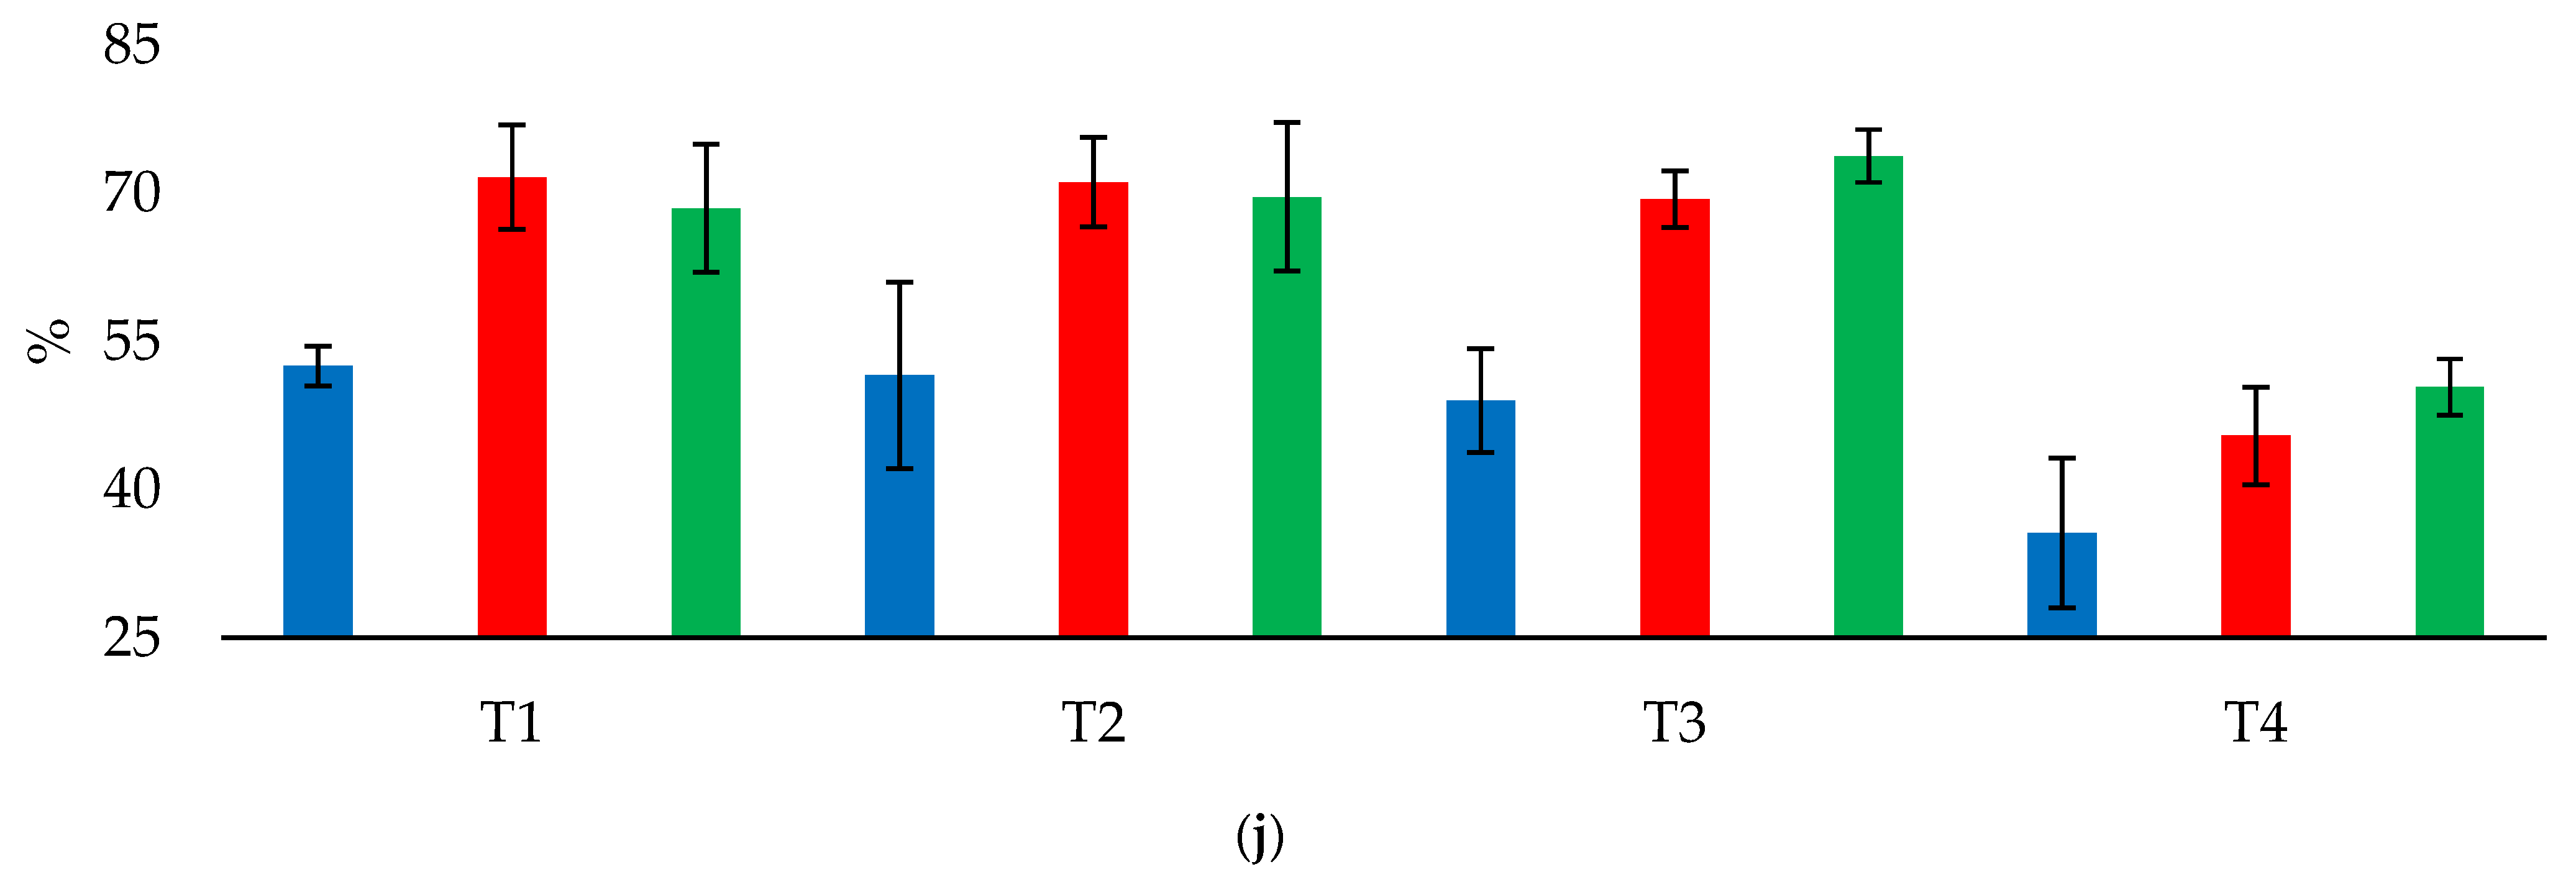
Figure 7 show the changes in the chemical attributes of the soil at depths of 0.0–0.2 and 0.2–0.4 m in the CPS, NTS, and APS in the three seasons (2017/18, 2018/19, and 2019/20).
In the CPS, there were no differences (p < 0.05) in soil chemical attributes at depths of 0.0–0.2 and 0.2–0.4 m among the treatments, despite the significant values of F for Ca2+ content and Ca2+/CEC at a depth of 0.0–0.2 m.
In the NTS, at a depth of 0.0–0.2 m, P content increased by 8.5 mg dm−3 in T3 compared with T1, but S-SO42−, K+, K+/CEC, and Mg2+/CEC did not differ (p < 0.05) among the treatments in which LS and GP were applied (T1, T2, and T3). At a depth of 0.2–0.4 m, P content increased by 5.25–6.25 mg dm−3 in T3 compared with T2 and T1; S-SO42− content increased by 12.5–20.25 mg dm−3 in T1, T2, and T3 compared with the control (T4); and Ca2+/ECEC increased by 11.82–15.5 percentage points in T1, T2, and T3 compared with the control. By contrast, compared with the control, K+ content decreased by 0.06–0.09 cmolc dm−3 in T1, T2, and T3. K+/CEC and Mg2+/CEC did not differ (p < 0.05) among T1, T2, and T3.
In the APS, at a depth of 0.0–0.2 m, Ca2+/CEC increased by 12.34 percentage points in T1 compared with the control (T4). In addition, S-SO42− content increased by 10.5 mg dm−3 in T1 and by 4.0–4.5 mg dm−3 in T2 and T3 compared with the control; P content increased by 9.5 mg dm−3 in T3 compared with T2; and Ca2+ content increased by 0.53 cmolc dm−3 in T1 compared with the control. Mg2+ and K+ content and Mg2+/CEC did not differ (p < 0.05) among T1, T2, and T3. By contrast, compared with the control, K+/CEC decreased by 0.89–1.05 percentage points in T1, T2, and T3. At a depth of 0.2–0.4 m, S-SO42− content increased by 26.25 mg dm−3 in T1 and by 5.5–7.5 mg dm−3 in T2 and T3 compared with the control; P content increased by 9.75–11.5 mg dm−3 in T1 and T3 compared with T2; Ca2+/CEC increased by 8.42 and 7.24 percentage points in T1 and T2, respectively, compared with the control; Mg2+/CEC increased by 2.65 percentage points in T2 compared with T3; and Ca2+/ECEC increased by 16.88 percentage points in T1 compared with the control.
In the CPS, at a depth of 0.0–0.2 m, S-SO42− content increased by 10.67 mg dm−3 in T1 compared with T2 and T3; Mg2+ content increased by 0.78 cmolc dm−3 in T3 compared with T1; and Mg2+/CEC increased by 9.75 percentage points in T2 and 12.25 percentage points in T3 compared with T1. Despite a significant F value, total acidity did not differ (p < 0.05) among the treatments. At a depth of 0.2–0.4 m, S-SO42− content increased by 8.67 and 7.5 mg dm−3 in T3 compared with T1 and T2, respectively.
In the NTS, at a depth of 0.0–0.2 m, pH increased by 0.4–0.58, Ca2+ content increased by 0.98–1.33 cmolc dm−3, BS increased by 14.83–21.33 percentage points, and Ca2+/CEC increased by 12.0–16.0 percentage points in T1, T2, and T3 compared with the control. Mg2+ content increased by 0.51 cmolc dm−3 in T1 compared with T3, and Al3+ content and Mg2+/CEC did not differ (p < 0.05) among T1, T2, and T3. By contrast, K+ content decreased by 0.18–0.2 cmolc dm−3 in T1, T2, and T3 compared with the control. CEC increased by 1.27 cmolc dm−3 in T1 compared with the control, and K+/CEC decreased by 3.27–3.95 percentage points. At a depth of 0.2–0.4 m, S-SO42− content increased by 9.25 mg dm−3 in T1 compared with the control; P content increased by 8.0 mg dm−3 in T2 compared with T1; Al3+ decreased by 0.23–0.34 cmolc dm−3 in T1 and T3 compared with T2; and Mg2+/CEC increased by 0.4–0.45 cmolc dm−3 percentage points in T3 and T1 compared with T2. Despite a significant F value, BS did not differ (p < 0.05) among the treatments.
In the APS, at a depth of 0.0–0.2 m, Ca2+ content increased by 1.16–1.46 cmolc dm−3, total acidity decreased by 0.65–0.85 cmolc dm−3, and Al3+ decreased by 0.18–0.25 cmolc dm−3 in T1, T2, and T3 compared with the control. In addition, P content was 17.0, 10.5, and 8.5 mg dm−3 higher in T2, T1, and T3, respectively, than in the control, and BS increased by 27.0, 22.5, and 13.0 percentage points, respectively. Ca2+/CEC increased by 25.75, 24.5, and 17.25 percentage points in T1, T2, and T3, respectively, compared with the control. Compared with the control, S-SO42− content increased by 1.92 and 3.25 mg dm−3 in T1 and T3, respectively; pH increased by 0.93, Mg2+ content increased by 0.73 cmolc dm−3, and CEC increased by 1.9 percentage points in T2. K+/CEC did not differ (p < 0.05) among T1, T2 and T3. At a depth of 0.2–0.4 m, S-SO42− content increased by 6.5–9.5 mg dm−3 in T1, T2, and T3 compared with the control; Ca2+ content increased by 0.58–0.8 cmolc dm−3, Al3+ decreased by 0.3–0.38 cmolc dm−3, BS increased by 9.5–15.5 percentage points, Ca2+/CEC increased by 14.75, 19.25, and 15.25 percentage points, respectively, and Ca2+/ECEC increased by 23.96–26.18 percentage points.
In the CPS, at a depth of 0.0–0.2 m, S-SO42− content increased by 2.67 mg dm−3 in T3 compared with the control; Ca2+ content increased by 0.67 cmolc dm−3 in T2 and by 0.27–0.3 cmolc dm−3 in T1 and T3 compared with the control; and Ca2+/CEC increased by 17.33 percentage points in T2 compared with the control. At a depth of 0.2–0.4 m, Ca2+ content increased by 0.3–0.43 cmolc dm−3 and Ca2+/ECEC increased by 10.75–20.54 percentage points in T1, T2, and T3 compared with the control. In addition, S-SO42− content increased by 5.66 mg dm−3 in T3 and by 1.33 mg dm−3 in T1 and T2 compared with the control, and Mg2+ content increased by 0.3 cmolc dm−3 in T1 compared with T3. Ca2+/CEC and Mg2+/CEC did not differ (p < 0.05) among T1, T2, and T3.
In the NTS, at a depth of 0.0–0.2 m, pH increased by 1.2–1.5 in T1, T2, and T3 compared with the control; Ca2+ content increased by 1.65–2.05 cmolc dm−3, total acidity decreased by 0.1–1.3 cmolc dm−3, BS increased by 35.33–42.0 percentage points, CEC increased by 17.57–22.4 percentage points, and Ca2+/CEC increased by 19.0–26.67 percentage points. In addition, Mg2+ content increased by 0.15, 0.13, and 0.11 cmolc dm−3 in T1, T2, and T3, respectively, compared with the control, and Mg2+/CEC increased by 19.0–21.0 percentage points in T1 and T2 and 15.5 percentage points in T3. OM content increased by 6.5 g dm−3 in T2 compared with the control. Despite a significant F value, P content did not differ (p < 0.05) among the treatments. At a depth of 0.2–0.4 m, S-SO42− content increased by 3.67 and 9.17 mg dm−3 in T2 and T3, and Ca2+/CEC increased by 6.5–11.33 percentage points in T1, T2, and T3 compared with the control. In addition, compared with the control, BS increased by 16.67 percentage points in T2 and 8.0–9.0 percentage points in T1 and T3; Mg2+/ECEC increased by 3.5–7.67 percentage points in T1 and T2; Ca2+ content increased by 0.6 cmolc dm−3, Mg2+ content increased by 0.4 cmolc dm−3, and Al3+ content decreased by 0.2 cmolc dm−3 in T2.
In the APS, at a depth of 0.0–0.2 m, pH increased by 1.1–1.33, Ca2+ content increased by 1.58–1.9 cmolc dm−3, total acidity decreased by 1.13–1.33 cmolc dm−3, BS increased by 32.5–36.5 percentage points, and Ca2+/CEC increased by 27.75–28.5 percentage points in T1, T2, and T3 compared with the control. In addition, compared with the control, P content increased by 4.75 mg dm−3 in T2; S-SO42− content increased by 2.33 and 4.58 mg dm−3 in T1 and T2, respectively; Mg2+ content increased by 0.9, 0.78, and 0.5 in T1, T3, and T2, respectively; CEC increased by 1.53 percentage points in T1; and Mg2+/CEC increased by 10.5 percentage points in T1 and T2. By contrast, compared with the control, K+ content decreased by 0.1–0.11 cmolc dm−3 and K+/CEC decreased by 2.72–2.81 percentage points in T1, T2, and T3. At a depth of 0.2–0.4 m, Ca2+ content increased by 0.5–0.73 cmolc dm−3, Al3+ decreased by 0.25–0.35 cmolc dm−3, BS increased by 10.75–14.75 percentage points, Ca2+/CEC increased by 12.5, 12.75, and 15.0 percentage points, and Ca2+/ECEC increased by 18.1–23.42 percentage points in T1, T2, and T3 compared with the control. In addition, compared with the control, S-SO42− content increased by 9.0, 4.75, and 2.5 in T2, T1, and T3, respectively, and P content increased by 6.25 mg dm−3 in T2. Despite a significant F value, total acidity did not differ (p < 0.05) among the treatments.
LS and GP application increased S-SO42− content at depths of 0.0–0.2 m (T1 and T2 in the NTS and T1, T2, and T3 in the APS in the 2017/18 season; T1 in the CPS and T1 and T3 in the APS in the 2018/19 season; and T3 in the CPS and T1 and T2 in the APS in the 2019/20 season) and 0.2–0.4 m (T1, T2, and T3 in the NTS and APS in the 2017/18 and 2018/19 seasons and T1, T2, and T3 in the CPS, NTS, and APS in the 2019/20 season).
The application of LS and GP increased pH at a depth of 0.0–0.2 m (T1, T2, and T3 in the NTS and T2 in the APS in the 2018/19 season and T1, T2, and T3 in the NTS and APS in the 2019/20 season).
LS and GP application increased Ca2+ content at depths of 0.0–0.2 m (T1 in the APS in the 2017/18 season; T1, T2, and T3 in the NTS and APS in the 2018/19 season; and T1, T2 and T3 in the CPS, NTS, and APS in the 2019/20 season) and 0.2–0.4 m (T1, T2, and T3 in the APS in the 2018/19 season and T1, T2, and T3 in the CPS and APS and T2 in the NTS in the 2019/20 season).
At a depth of 0.0–0.2 m, LS and GP application increased Mg2+ content in T1 in the NTS and T2 in the APS in the 2018/19 season and in T1, T2, and T3 in the NTS and APS in the 2019/20 season. At a depth of 0.2–0.4 m, LS and GP application increased Mg2+ content in T2 in the NTS in the 2019/20 season.
LS and GP application decreased Al3+ content at depths of 0.0–0.2 m (T1 and T2 in the NTS and T1, T2, and T3 in the APS in the 2018/19 season) and 0.2–0.4 m (T1 and T3 in the NTS and T1, T2, and T3 in the APS in the 2018/19 season and T2 in the NTS and T1, T2, and T3 in the APS in the 2019/20 season).
The application of LS and GP decreased K+ content at a depth of 0.0–0.2 m in T1, T2, and T3 in the NTS in the 2018/19 season and the APS in the 2019/20 season. At a depth of 0.2–0.4 m, LS and GP decreased K+ content in T1, T2, and T3 in the NTS in the 2017/18 season.
LS and GP application decreased the total acidity at a depth of 0.0–0.2 m in T1, T2, and T3 in the APS in the 2018/19 season and in T1, T2, and T3 in the NTS and APS in the 2019/20 season.
LS and GP increased BS at depths of 0.0–0.2 m (T1, T2, and T3 in the NTS and APS in the 2018/19 and 2019/20 seasons) and 0.2–0.4 m (T1, T2, and T3 in the APS in the 2018/19 season and T1, T2, and T3 in the NTS and APS in the 2019/20 season).
The application of LS and GP increased CEC at a depth of 0.0–0.2 m in T1 in the NTS and T2 in the APS in the 2018/19 season and in T1, T2, and T3 in the NTS and T1 in the APS in the 2019/20 season.
The application of LS and GP increased Ca2+/CEC at a depth of 0.0–0.2 m (T1, T2, and T3 in the NTS and APS in the 2018/19 and 2019/20 seasons and T2 in the CPS in the 2019/20 season).
LS and GP increased Mg2+/CEC at depths of 0.0–0.2 m (T1 in the NTS in the 2018/19 season and T1, T2, and T3 in the NTS and T1 and T3 in the APS in the 2019/20 season) and 0.2–0.4 m (T1 and T2 in the NTS in the 2019/20 season).
The application of LS and GP decreased K+/CEC at a depth of 0.0–0.2 m in T1, T2, and T3 in the NTS in the 2018/19 season and in the APS in the 2019/20 season.
The application of LS and GP increased Ca2+/ECEC content at a depth of 0.2–0.4 m (T1, T2, and T3 in the NTS and APS in the 2017/18 season; T1, T2, and T3 in the APS in the 2019/20 season; and T1, T2, and T3 in the CPS and APS in the 2019/20 season).
4. Discussion
The increases in S-SO
42− content illustrate the importance of combining GP amendment with LS application to improve S-SO
42− content at depths of a 0.0–0.4 m layer in CPSs, NTSs, and APSs. GP was previously reported to improve the availability of exchangeable SO
42− in the entire soil profile [
24,
37,
38]. In addition, several studies have found that the tandem application of LS and GP provides nutrients and is an alternative strategy for improving the root environment in the early years of cultivation, when the effects of LS have not yet reached the subsurface layers due to its poor solubility and mobility [
26,
39].
Combining LS and GP provided better conditions for LS to act on the soil solution and increase pH [
40]. Liming is the most efficient methodology for increasing pH [
29], particularly in the surface layer (depth of 0.0–0.1 m) [
41,
42]. GP indirectly corrects soil pH in deeper layers in the soil because it contains SO
42−, which displaces OH
− from soil colloids into solution [
26].
Increasing Ca
2+ content at soil depths of 0.0–0.2 m and 0.2–0.4 m is important due to the role of Ca
2+ in root growth [
13], including cell division [
43], and because plants absorb Ca
2+ almost exclusively via the roots [
44]. Ca
2+ absorbed by superficial roots cannot meet the needs of deep roots located in environments with poor levels of this nutrient [
45]. The continuity of channels in NTSs [
46] promotes the descent of Ca
2+ [
47], and no soil turning was performed in the crop systems in the present study. LS application has previously been reported to increase Ca
2+ content [
45,
48], as has GP application [
24,
29,
47,
49,
50]. Moreover, previous studies have shown that combined application of LS and GP can increase Ca
2+ content [
40,
51,
52]. The combined application of LS and GP enhances the descent of Ca
2+ and Mg
2+, which are added by liming, in the soil profile [
53,
54] via the formation of ionic pairs with SO
42− [
55] dissociated from GP. This ion descends easily in the soil profile, carrying K
+, Mg
2+, and, mainly, Ca
2+ along with it [
47,
56,
57]. Increasing and redistributing Ca
2+, Mg
2+, and K
+ at greater depths in NTSs is important for alleviating the chemical impairment of root development and for promoting water deficit resistance in maize and soybean crops [
42]. In addition, the presence of grazing cattle in the CPS and APS increased the effects of surface application of LS at greater depths by promoting Ca
2+ and Mg
2+ leaching in the soil profile through the formation of low-molecular-weight organic acids. These organic acids are released during the decomposition of animal waste, mainly feces, or are exuded by pasture plants during grazing [
58]. Grazing of palisade grass leads to a higher regrowth rate, as this grass is characterized by a voluminous fasciculated root system. The greater regrowth of tillers after grazing increases the volume of pores in the soil, allowing the movement of cations within the soil profile.
Mg
2+ and Ca
2+ compete for negative charges in soil, and Ca
2+ is preferred in exchange sites [
59]. As LS contains a high percentage of Ca (31% CaO), it provides a high Ca
2+ concentration in the soil, which promotes the displacement of Mg
2+ from exchange sites. Mg
2+ is less strongly retained due to its greater hydrated radius and lower electronegativity. This displacement allows greater movement of Mg
2+ within the profile and formation of the MgSO
40 ion pair [
24,
60]. Movement of Mg
2+ within the soil profile is also promoted by water-soluble compounds originating from the residues of previous crops [
61]. Compared with the initial content of Mg
2+ in the soil, LS and GP increased Mg
2+ content at a depth of 0.0–0.2 m by 1.0 and 0.53 cmol
c dm
−3 in the NTS and APS, respectively. These results are consistent with previous studies that have found increases in Mg
2+ content with the application of GP [
42]. However, another study found that GP improved soil fertility in the soil profile but that Mg
2+ migrated down over a period of three years, regardless of application [
38]. GP application reduces Mg
2+ in the surface layers, leading to accumulation in the subsurface layers [
26]. Thus, the methodology used in this study to apply LP and GP promotes a more uniform distribution of Mg
2+ along the soil profile.
Once in the soil solution, the ion Ca
2+ can react in the soil exchange complex, shifting Al
3+, K
+, and Mg
2+ to the soil solution. In turn, these ions can react with SO
42− to form AlSO
4+ (which is less toxic to plants) and the neutral pairs K
2SO
40, MgSO
40, and CaSO
40, which have great mobility in the soil profile [
62]. The dissociation of GP releases Ca
2+, which binds to organic carbon, making SO
42− available in the soil solution to replace OH
−. These chemical changes in the soil solution also interfere with the increase in pH and reduction of acidity by Al
3+ [
22].
The decreases in K
+ content and K
+/CEC at a depth of 0.0–0.2 m in the NTS and APS due to LS and GP application are related to K
+ lixiviation within the soil profile, which is promoted by GP [
51]. By contrast, GP application did not promote K
+ lixiviation in the CPS, corroborating previous findings [
45,
47,
52,
63]. The absence of an effect of GP application on K
+ lixiviation can be explained by the low formation of the K
2SO
40 ionic pair (0.2% of total solubility) [
64].
The reduction in total acidity in the NTS and APS may have been due to the movement of fine particles of LS through the continuous pores within the soil profile (which are the result of root system decomposition) [
10] and the formation of ionic pairs between sulfate or nitrate and Ca
2+ and Mg
2+ from LS [
65]. Decreasing total acidity is important to avoid restrictions on the expansion of the root system, which would impair access to water and nutrients found in the deepest layers of the soil [
52]. The reduction in total acidity may also be related to the formation of complexes of Ca
2+ and Mg
2+ with soluble organic compounds released by the decomposition of plant biomass deposited on the soil surface (carboxylic and phenolic radicals) [
66,
67]. In the present study, all cultivations were carried out under no-till on the residues of the previous crops, as the NTS was established in the 2009/10 season and the APS was established in the 2011/12 season.
The increases in BS and CEC in the NTS and APS were promoted by the supply of Ca
2+ and Mg
2+ by LS, which contained 31% CaO and 21% MgO, and GP, which contained 17% CaO, and by the movement of Ca
2+ and Mg
2+ in the soil profile. Previous studies have reported that combining GP with LS enhances the vertical movement of Ca
2+ in the soil profile [
40,
54,
68,
69]. GP application has also been shown to increase BS [
45,
49,
50]. In addition, changes in BS are always greatest after the grazing season (winter) [
70]. However, this improvement in BS is temporary because the decomposition of plant residues increases soil acidity, which was minimized in the present study by the use of three applications of LS [
71].
