
Model for Sustainable Evaluation of the Impact of the Total Number of Centers for Technical Inspections of Motor Vehicles on the Occurrence and Consequences of Traffic Accidents in an Area

 ,
,  , , and
Abstract
:1. Introduction
2. Review of Previous Research
- Comparative studies between countries where technical inspection of vehicles is not or is mandatory;
- Studies before and after the introduction of mandatory TIV control;
- Analyses that compare data on accidents before and after mandatory introduction of TIV control;
- Analysis of representation of vehicles that have attended periodical technical inspections within the total number of traffic accidents.
3. The Presence of Centers for the Control of the Technical Correctness of Vehicles in Serbia and Other Countries in the Region
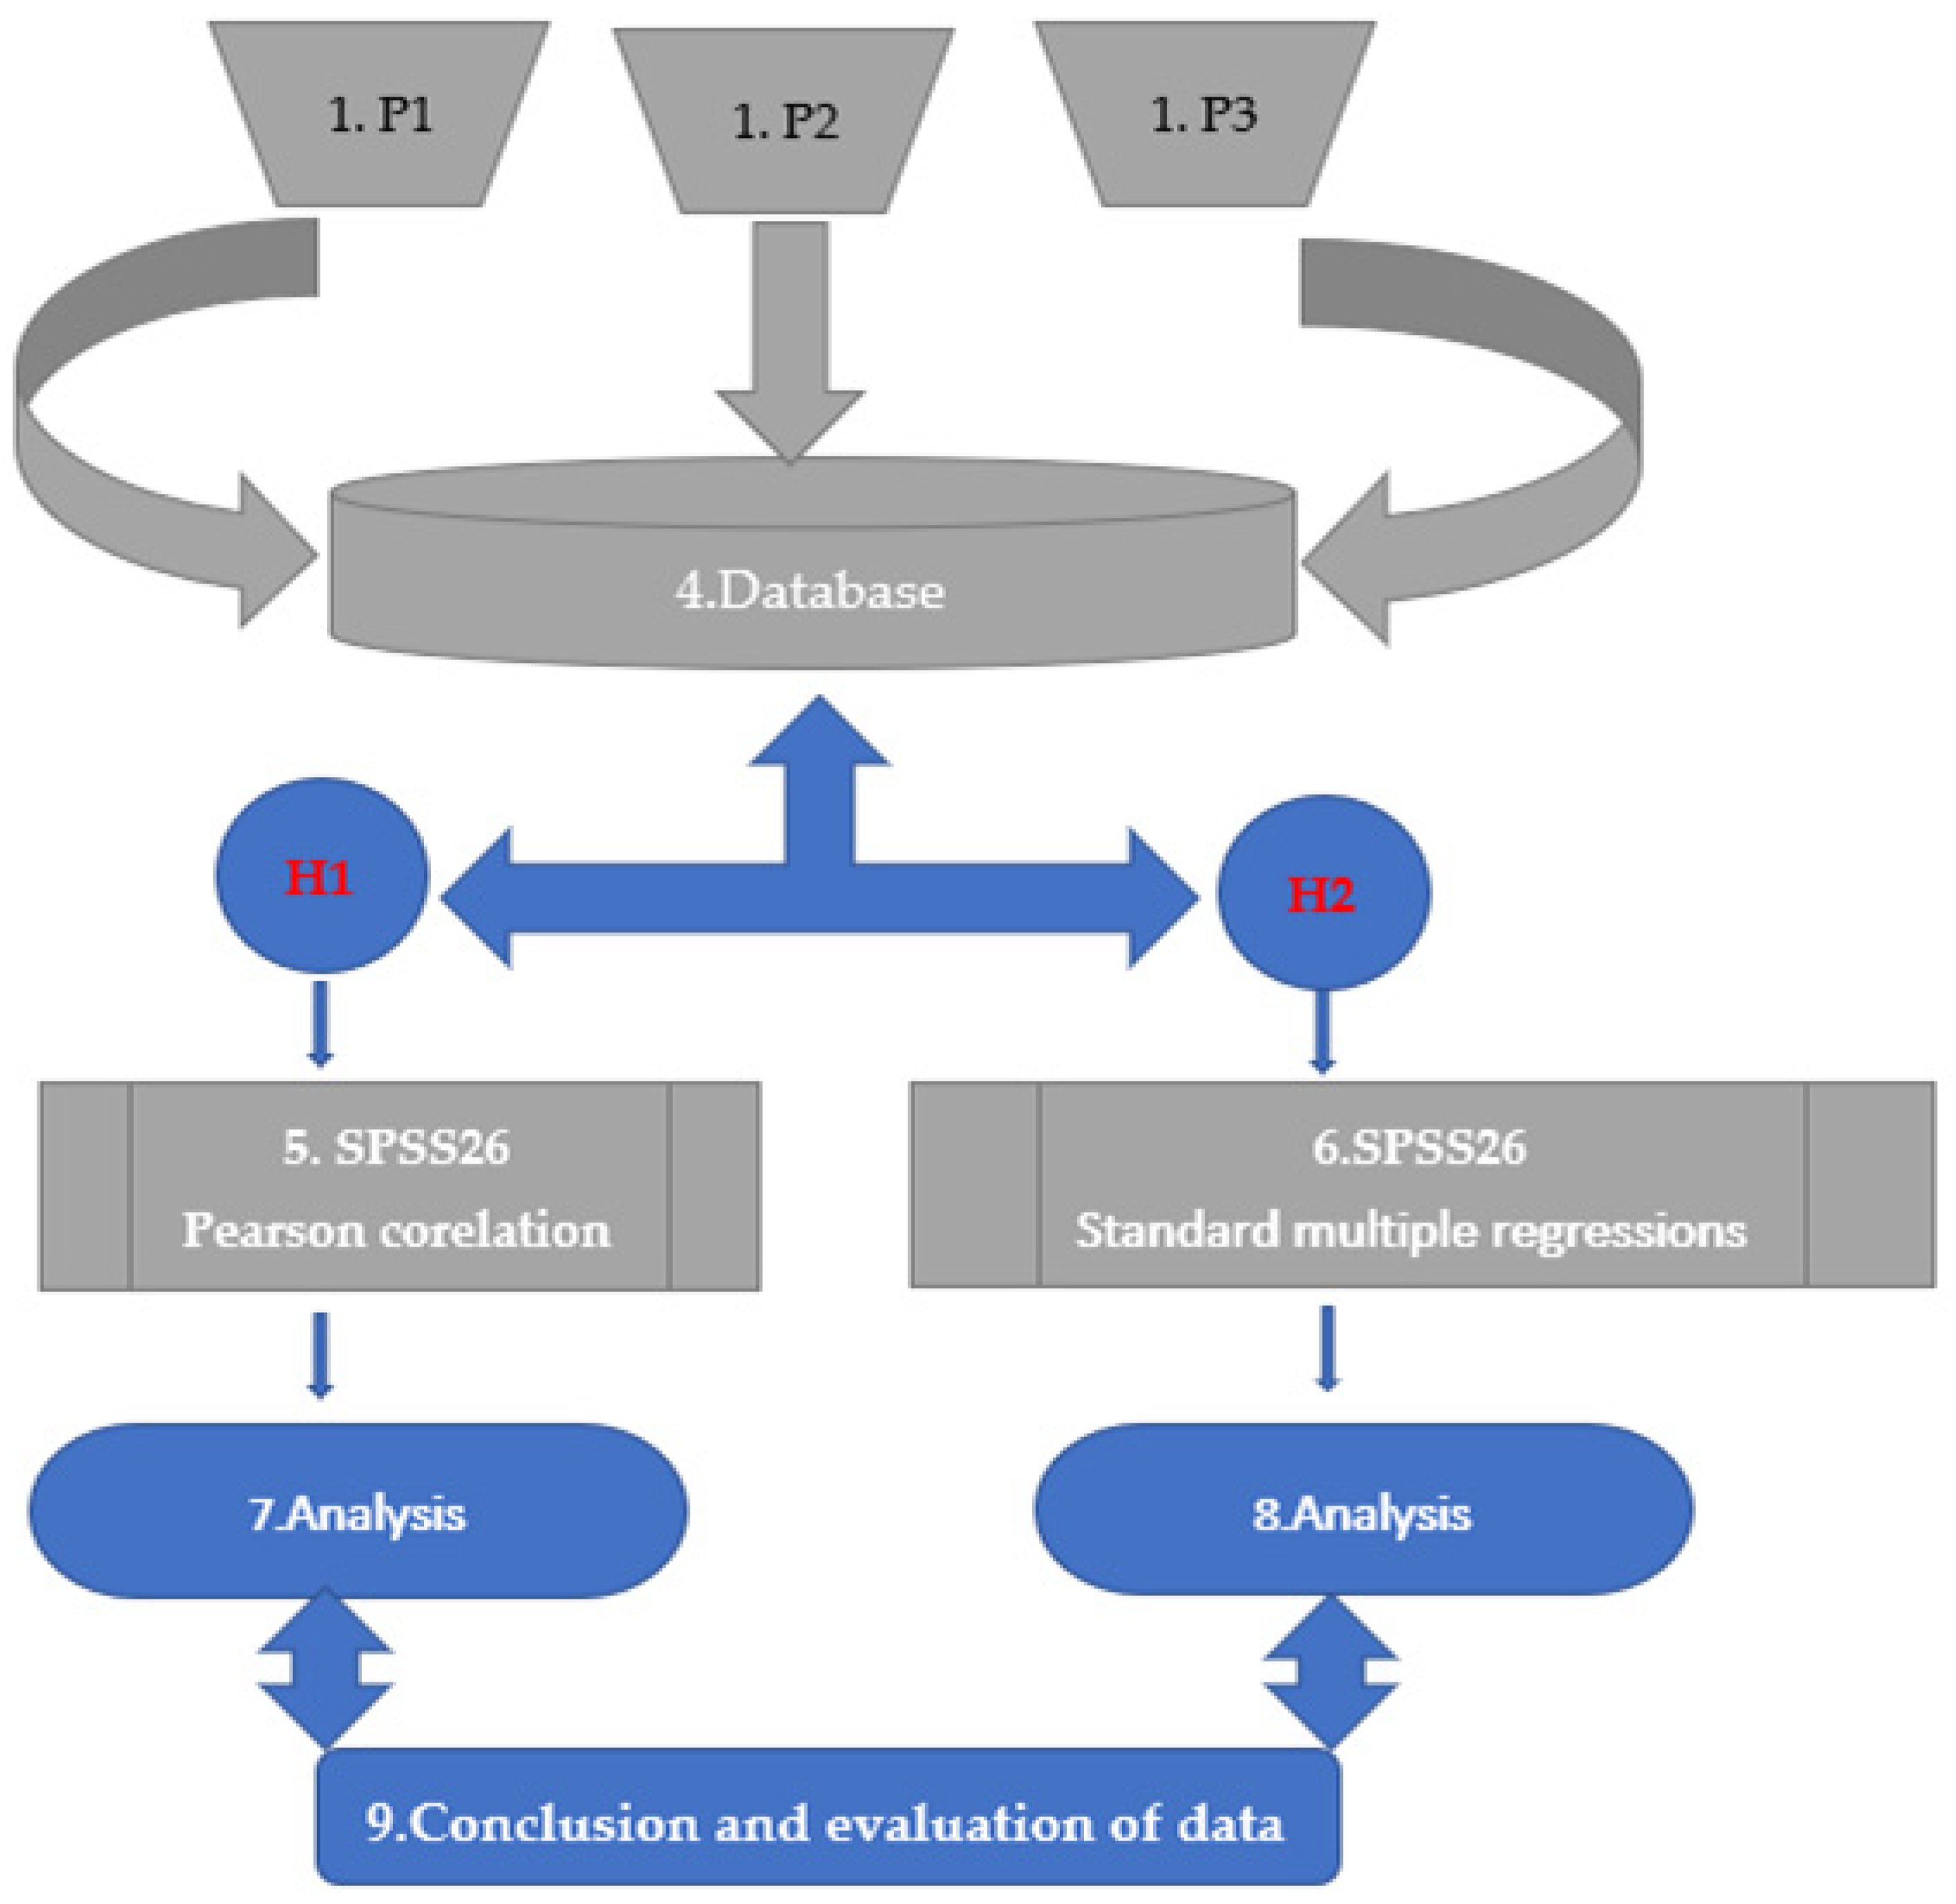
4. Research Methodology
4.1. Research Tools
4.2. Materials and Methods of Data Analysis
- Data on traffic accidents from the Traffic Safety Agency.
- Data on the total number of centers for the control of the technical correctness of vehicles by police jurisdiction and from the RS Ministry of the Interior.
- Data on the total number of vehicles registered by police administrations from the Republic’s Bureau of Statistics.
- Summarized database for the purpose of conducting analyses and statistical comparisons.
- Entry of data into SPSS and analysis thereof using Pearson’s correlation.
- Entry of data into SPSS and analysis thereof using standard multiple regression.
- Analysis and generation of reports for data obtained with Pearson’s correlation method.
- Analysis and report generation for data obtained with the method of standard multiple regression.
- Final conclusions and sustainable impact assessment.
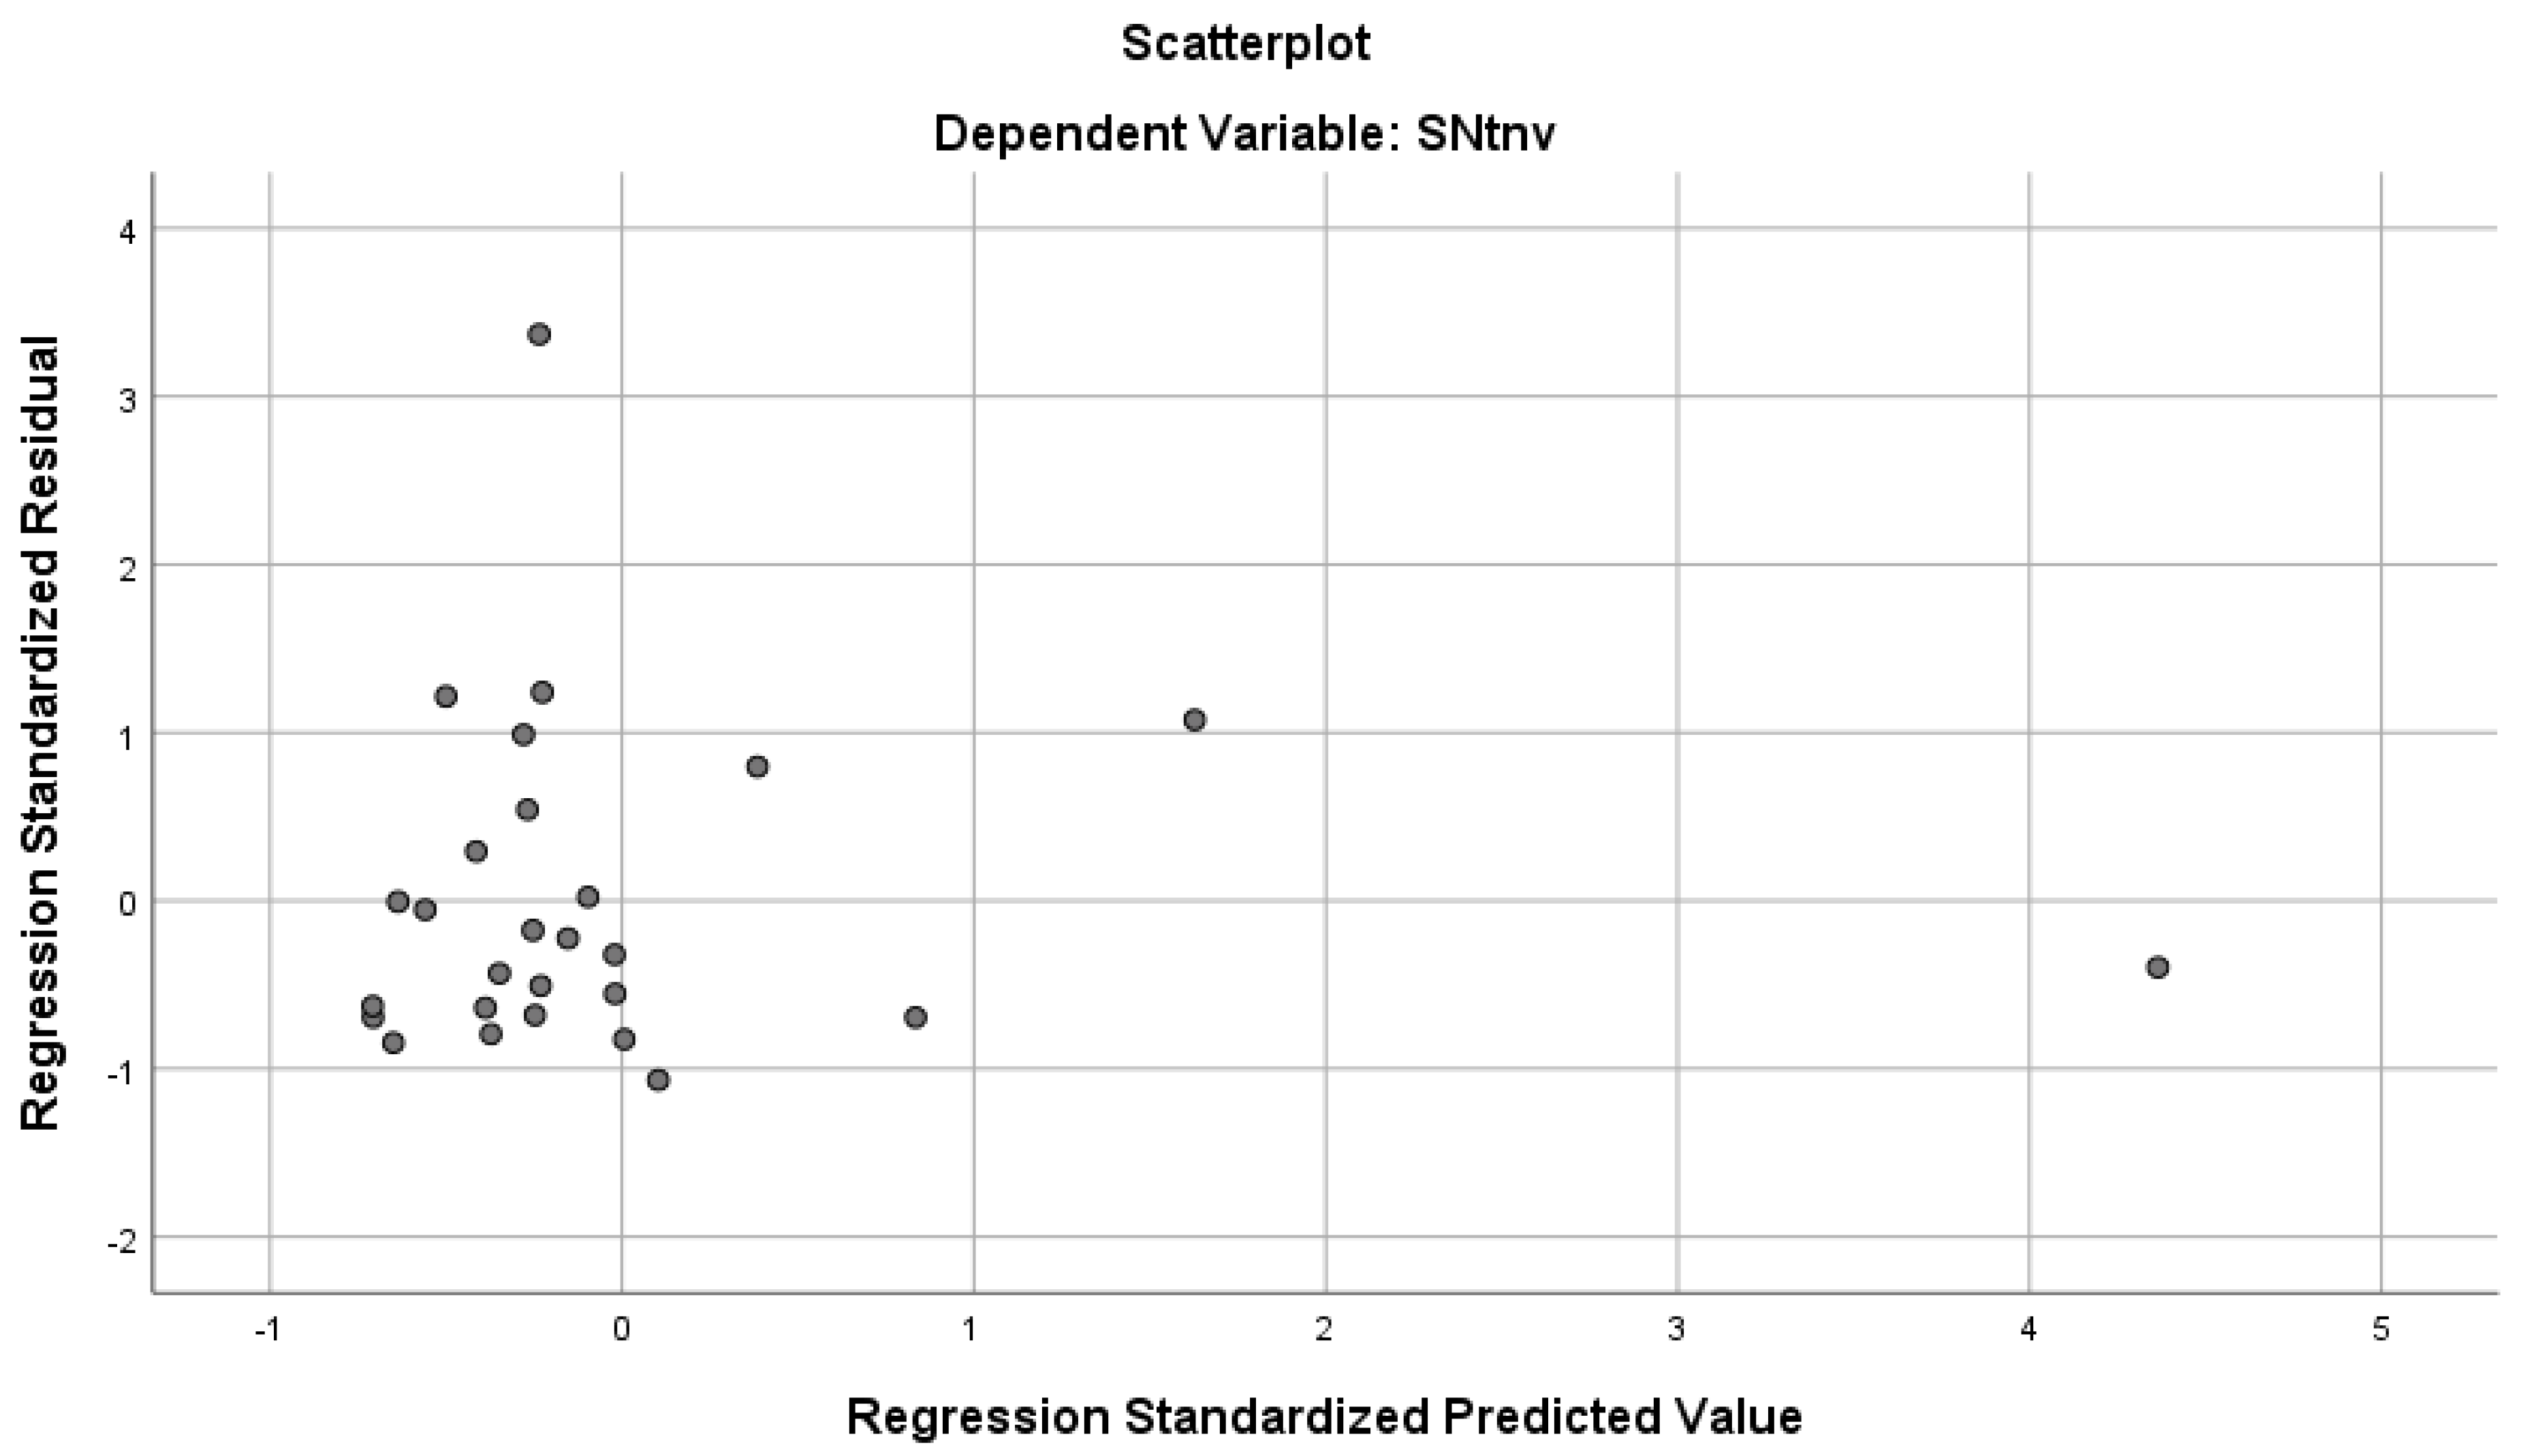
5. Research Results and Discussion
- The number of traffic accidents where the cause was technical malfunction of vehicles according to the police administrations in Serbia (TAtmv) was considered as a continuous dependent variable.
- The total number of TIV control centers by police jurisdiction in Serbia (Ntp) and the total number of registered vehicles in the area of these police jurisdictions (NVehicles) were considered as two independent variables.
6. Conclusions
- The results of the analysis of the defined model, which included the total number of registered vehicles and the number of centers for the control of the technical correctness of vehicles, explained 67.9% of the variance in the total number of accidents where the cause was technical malfunction of vehicles.
- Out of the two independent variables, the largest unique contribution (beta = 1.232) was provided by the number of technical inspections, and the number of registered vehicles (beta = −0.411) provided significantly less.
Author Contributions
Funding
Institutional Review Board Statement
Informed Consent Statement
Conflicts of Interest
References
- Pomonia, M.; Platia, C.; Kaneb, M.; Loizosa, A. Polishing behaviour of asphalt surface course containing recycled materials. Int. J. Transp. Sci. Technol. 2021. [Google Scholar] [CrossRef]
- Global Plan for the Decade of Action for Road Safety 2021-2030; World Health Organization: Geneva, Switzerland, 2021.
- Road Accident Investigation Guidelines for Road Engineers; World Road Association-PIARC: Paris, France, 2007.
- Hudecab, J.; Šarkanb, B.; Cződörováab, R. Examination of the results of the vehicles technical inspections in relation to the average age of vehicles in selected EU states. Transp. Res. Procedia 2021, 55, 2–9. [Google Scholar] [CrossRef]
- Vranješ, Đ.; Vasiljević, J.; Jovanov, G.; Radovanović, R.; Đurić, T. Study of the impact of technical malfunctiong of vital vehicular parts on traffic safety. Teh. Vjesn. 2019, 26, 217080. [Google Scholar] [CrossRef]
- European Commission-ECE. Tougher Vehicle Testing Rules to Save Lives. Available online: http://ec.europa.eu/transport/road_safety/events-archive/2012_07_13_press_release_en.htm (accessed on 21 June 2015).
- Jarosinski, W. Periodic technical inspections of vehicles and road traffic safety with the number of road accidents involving fatalities. Eksploat. i Niezawodn. Maint. Reliab. 2014, 16, 105–111. [Google Scholar]
- Law on Road Traffic Safety. Official Gazette of the Republic of Serbia, No. 41/09, 53/10, 101/11. 2009. Available online: https://www.paragraf.rs/propisi/zakon_o_bezbednosti_saobracaja_na_putevima.html (accessed on 31 March 2022).
- Regulation for technical vehicle inspection, 2018, Serbia. Available online: https://www.paragraf.rs/propisi/pravilnik-o-tehnickom-pregledu-vozila.html (accessed on 31 March 2022).
- Fuchs, V.R.; Leveson, I. Motor accident mortality and compulsory inspection of vehicles. J. Am. Med. Assoc. 1967, 201, 657–661. [Google Scholar] [CrossRef]
- Little, J.W. Uncertainties in evaluating periodic motor vehicle inspection by death rates. Accid. Anal. Prev. 1971, 2, 301–313. [Google Scholar] [CrossRef]
- Schroer, B.J.; Peyton, W.F. The effects of automobile inspections on accident rates. Accid. Anal. Prev. 1979, 11, 61–68. [Google Scholar] [CrossRef]
- Loeb, P.D.; Gilad, B. The efficacy and cost-effectiveness of vehicle inspection: A state specific analysis using time series data. J. Transp. Econ. Policy 1984, 18, 145–164. [Google Scholar]
- Berg, G.; Danielsson, S.; Junghard, O. Traffic Safety and Vehicle Inspection. In Svedish Road and Traffic Research Institute, Rapport; Swedish National Road and Transport Research Institute: Linköping, Sweden, 1984. [Google Scholar]
- Rompe, K.; Seul, E. Advantages and disadvantages of conducting roadworthiness tests to monitor the mechanical condition for private cars, the impact of such tests on road safety, environmental protection and the renewal of the vehicle fleet and the scope for introducing roadworthiness testing throughout the European community. Final report commissioned by the Directorate-General for Transport. In VII/G-2 of the Commission of the European Communities; TUV Rheinland: Cologne, Germany, 1985. [Google Scholar]
- White, W.T. Does periodic vehicle inspection prevent accidents? Accid. Anal. Prev. 1986, 18, 51–62. [Google Scholar] [PubMed]
- Asander, S. Vehicle safety inspection systems. In Wheels’ 92: Conference and Workshop; Proceedings; Institution of Engineers: Kolkata, India, 1993; p. 63. [Google Scholar]
- Elvik, R. The effect on accidents of technical inspection of heavy vehicles in Norway. Accid. Anal. Prev. 2002, 34, 753–762. [Google Scholar] [CrossRef]
- Martín-delosReyes, L.M.; Lardelli-Claret, P.; García-Cuerva, L.; Rivera-Izquierdo, M.; Jiménez-Mejías, E.; Martínez-Ruiz, V. Effect of Periodic Vehicle Inspection on Road Crashes and Injuries: A Systematic Review. Int. J. Environ. Res. Public Health 2021, 18, 6476. [Google Scholar] [CrossRef] [PubMed]
- Blows, S.; Rebecca, Q.; Connor, J.; Ameratunga, S.; Norton, R. Does periodic vehicle inspection reducecar crash injury? Evidence from theAuckland Car Crash Injury Study. Aust. New Zealand J. Public Health 2002, 27, 323–327. [Google Scholar] [CrossRef] [PubMed]
- Cristensen, P.; Evlik, R. Effects on accidents of periodic motor vehicle inspection in Norway. Accid. Anal. Prev. 2007, 39, 47–52. [Google Scholar] [CrossRef] [PubMed]
- Vlahos; Nicholas, J.; Lawton, S.T.; Komanduri, A.K.; Popuri, Y.D.; Gaines, D.L. Pennsylvania’s Vehicle Safety Inspection Program Effectiveness Study (070609) Summary of Findings; Report No. PA-2009-004-070609; The Pennsylvania Department of Transportation: Harrisburg, PA, USA, 2009. [Google Scholar]
- Zovak, G.; Kučinić, T.; Ševo, I. Importance of technical inspection of vehicles after traffic accidents. Int. Sci. J. 2016, 4, 3–6. [Google Scholar]
- Fosser, S. An experimental evaluation of the effects of periodic motor vehicle inspection on accidents rates. Accid. Anal. Prev. 1992, 24, 599–612. [Google Scholar] [CrossRef]
- Holdstock, J.; Zalinger, D.; Hagarty, D. Review of a Mandatory Vehicle Inspection Program; Study Report for the Ministry of Tranpsortation and Highways; Ministry of Transportation & Highways, Motor Vehicle Branch: Victoria, BC, Canada, 1994. [Google Scholar]
- Merrell, D.; Poitras, M.; Sutter, D. The Effectiveness of Vehicle Safety Inspections: An Analysis Using Panel Data. South. Econ. J. 1999, 65, 571. [Google Scholar]
- Poitras, M.; Sutter, D. Policy Ineffectiveness or Offsetting Behavior? An Analysis of Vehicle Safety Inspections. South. Econ. J. 2002, 68, 922. [Google Scholar]
- Crain, W.M. Vehicle Safety Inspection Systems. How Effective? American Enterprise Institute for Public Policy Research: Washington, DC, USA, 1980. [Google Scholar]
- Keall, M.D.; Newstead, S. An evaluation of costs and benefits of a vehicle periodic inspection scheme with six-monthly inspections compared to annual inspections. Accid. Anal. Prev. 2013, 58, 81–87. [Google Scholar] [CrossRef] [PubMed]
- Hudec, J.; Šarkan, B. Effect of Periodic Technical Inspections of Vehicles on Traffic Accidents in the Slovak Republic. Oper. Econ. Transp. 2022, 24, A142–A159. [Google Scholar] [CrossRef]
- International Motor Vehicle Inspection Committee-CITA, Brussels, Belgium, 2021. Available online: https://citainsp.org/31.03.2022 (accessed on 1 April 2022).
- Pallant, J. SPSS Survival Manual; Allen & Unwin: Crows Nest, Australia, 2011. [Google Scholar]
- Statistics of Road Traffic Accidents in Europe and North America, Volume LV.; United Nations: San Francisco, CA, USA, 2019.
- Pamučar, D.; Božanić, D.; Puška, A.; Marinković, D. Application of neuro-fuzzy system for predicting the success of a company in public procurement. Decis. Mak. Appl. Manag. Eng. 2022, 5, 135–153. [Google Scholar] [CrossRef]


| State | Number of TIV Control Centers | Number of Registered Vehicles | Presence of Centers per 100,000 Vehicles |
|---|---|---|---|
| Sweden | 550 | 5,804,296 | 9.475740038 |
| Croatia | 168 | 1,893,119 | 8.874244039 |
| Estonia | 128 | 871,642 | 14.68492799 |
| France | 6791 | 38,513,225 | 17.63290402 |
| Germany | 92,500 | 53,638,471 | 172.4508516 |
| Lithuania | 69 | 817,192 | 8.44354815 |
| Portugal | 221 | 6,360,765 | 3.474424853 |
| Slovakia | 157 | 2,714,784 | 5.783148862 |
| Spain | 470 | 33,656,638 | 1.396455582 |
| Serbia | 1196 | 2,357,699 | 50.72742534 |
| Police Administration | Total Traffic Accidents | Total Traffic Accidents with Casualties | Total Traffic Accidents with Material Damage | Number of Registered Vehicles (2017) | Number of TIV Centers | TIV Centers’ Representation per 100,000 Vehicles |
|---|---|---|---|---|---|---|
| Belgrade | 240 | 141 | 99 | 661,007 | 255 | 3.857750 |
| Bor | 28 | 11 | 17 | 53,312 | 20 | 3.751501 |
| Čačak | 25 | 16 | 9 | 75,247 | 35 | 4.651348 |
| Jagodina | 39 | 28 | 11 | 74,436 | 42 | 5.642431 |
| Kikinda | 30 | 12 | 18 | 42,446 | 21 | 4.947463 |
| Kragujevac | 29 | 15 | 14 | 98,792 | 49 | 4.959916 |
| Kraljevo | 31 | 14 | 17 | 63,598 | 34 | 5.346080 |
| Kruševac | 32 | 15 | 17 | 75,785 | 43 | 5.673946 |
| Leskovac | 46 | 31 | 15 | 59,311 | 40 | 6.744112 |
| Niš | 84 | 45 | 39 | 108,880 | 40 | 3.673769 |
| Novi Pazar | 16 | 9 | 7 | 28,204 | 25 | 8.863991 |
| Novi Sad | 162 | 101 | 61 | 132,533 | 101 | 7.620744 |
| Pančevo | 53 | 42 | 11 | 85,191 | 41 | 4.812715 |
| Pirot | 4 | 2 | 2 | 24,094 | 14 | 5.810575 |
| Požarevac | 148 | 60 | 88 | 72,297 | 35 | 4.841141 |
| Prijepolje | 2 | 2 | 0 | 10,272 | 14 | 13.629283 |
| Prokuplje | 6 | 4 | 2 | 24,349 | 14 | 5.749723 |
| Šabac | 73 | 37 | 36 | 99,912 | 72 | 7.206342 |
| Smederevo | 61 | 35 | 26 | 57,226 | 32 | 5.591864 |
| Sombor | 28 | 15 | 13 | 53,312 | 29 | 5.439676 |
| Sremska Mitrovica | 98 | 39 | 59 | 100,272 | 58 | 5.784267 |
| Subotica | 20 | 12 | 8 | 62,864 | 29 | 4.613133 |
| Užice | 71 | 37 | 34 | 89,960 | 29 | 3.223655 |
| Valjevo | 43 | 29 | 14 | 60,374 | 36 | 5.962832 |
| Vranje | 40 | 25 | 15 | 53,504 | 32 | 5.980861 |
| Zaječar | 74 | 31 | 43 | 36,801 | 29 | 7.880221 |
| Zrenjanin | 47 | 35 | 12 | 53,720 | 27 | 5.026061 |
| Correlations | |||
|---|---|---|---|
| Presence/ Representation | Total Traffic Accidents | ||
| Presence/Representation | Pearson Correlation | 1 | −0.224 |
| Sig. (2-tailed) | 0.261 | ||
| N | 27 | 27 | |
| Total Traffic Accidents | Pearson Correlation | −0.224 | 1 |
| Sig. (2-tailed) | 0.261 | ||
| N | 27 | 28 | |
| Correlations | |||
|---|---|---|---|
| Presence/ Representation | Total Traffic Accidents with Casualties | ||
| Presence/Representation | Pearson Correlation | 1 | −0.210 |
| Sig. (2-tailed) | 0.294 | ||
| N | 27 | 27 | |
| Total Traffic Accidents with Casualties | Pearson Correlation | −0.210 | 1 |
| Sig. (2-tailed) | 0.294 | ||
| N | 27 | 28 | |
| Correlations | |||
|---|---|---|---|
| Presence/ Representation | Total Traffic Accidents with Material Damage | ||
| Presence/Representation | Pearson Correlation | 1 | −0.223 |
| Sig. (2-tailed) | 0.263 | ||
| N | 27 | 27 | |
| Total Traffic Accidents with Material Damage | Pearson Correlation | −0.223 | 1 |
| Sig. (2-tailed) | 0.263 | ||
| N | 27 | 28 | |
| Correlations | ||||
|---|---|---|---|---|
| TAtmv | NVehicles | Ntp | ||
| Pearson Correlation | TAtmv | 1.000 | 0.786 | 0.833 |
| NVehicles | 0.786 | 1.000 | 0.972 | |
| Ntp | 0.833 | 0.972 | 1.000 | |
| Sig. (1-tailed) | TAtmv | 0.000 | 0.000 | |
| NVehicles | 0.000 | 0.000 | ||
| Ntp | 0.000 | 0.000 | ||
| N | TAtmv | 27 | 27 | 27 |
| NVehicles | 27 | 27 | 27 | |
| Ntp | 27 | 27 | 27 | |
| Descriptive Statistics | ||||
|---|---|---|---|---|
| Mean | Std. Deviation | N | ||
| TAtmv | 56.6667 | 53.35296 | 27 | |
| NVehicle | 87,322.1852 | 118,140.75700 | 27 | |
| Ntp | 44.2963 | 45.90443 | 27 | |
| Model Summary b | ||||
| Model | R | R Square | Adjusted R Square | Std. Error of the Estimate |
| 1 | 0.839 a | 0.704 | 0.679 | 30.23627 |
| ANOVA a | ||||||
|---|---|---|---|---|---|---|
| Model | Sum of Squares | df | Mean Square | F | Sig. | |
| 1 | Regression | 52,068.426 | 2 | 26,034.213 | 28.477 | 0.000 b |
| Residual | 21,941.574 | 24 | 914.232 | |||
| Total | 74,010.000 | 26 | ||||
| Coefficients a | |||||||||||||
|---|---|---|---|---|---|---|---|---|---|---|---|---|---|
| Model | Unstandardized Coefficients | Standardized Coefficients | t | Sig. | 95.0% Confidence Interval for B | Correlations | Collinearity Statistics | ||||||
| B | Std. Error | Beta | Lower Bound | Upper Bound | Zero-order | Partial | Part | Tolerance | VIF | ||||
| 1 | (Constant) | 9.429 | 9.551 | 0.987 | 0.333 | −10.283 | 29.141 | ||||||
| NVehicle | 0.000 | 0.000 | −0.411 | −0.876 | 0.390 | −0.001 | 0.000 | 0.786 | −0.176 | −0.097 | 0.056 | 17.799 | |
| Ntp | 1.432 | 0.545 | 1.232 | 2.628 | 0.015 | 0.307 | 2.557 | 0.833 | 0.473 | 0.292 | 0.056 | 17.799 | |
Publisher’s Note: MDPI stays neutral with regard to jurisdictional claims in published maps and institutional affiliations. |
© 2022 by the authors. Licensee MDPI, Basel, Switzerland. This article is an open access article distributed under the terms and conditions of the Creative Commons Attribution (CC BY) license (https://creativecommons.org/licenses/by/4.0/).
Share and Cite
Vranješ, Đ.; Marić, B.; Đurić, T.; Jovanov, G.; Vasiljević, J.; Jovanov, N.; Stojčić, D.R. Model for Sustainable Evaluation of the Impact of the Total Number of Centers for Technical Inspections of Motor Vehicles on the Occurrence and Consequences of Traffic Accidents in an Area. Sustainability 2022, 14, 8873. https://doi.org/10.3390/su14148873
Vranješ Đ, Marić B, Đurić T, Jovanov G, Vasiljević J, Jovanov N, Stojčić DR. Model for Sustainable Evaluation of the Impact of the Total Number of Centers for Technical Inspections of Motor Vehicles on the Occurrence and Consequences of Traffic Accidents in an Area. Sustainability. 2022; 14(14):8873. https://doi.org/10.3390/su14148873
Chicago/Turabian StyleVranješ, Đorđe, Bojan Marić, Tihomir Đurić, Goran Jovanov, Jovica Vasiljević, Nemanja Jovanov, and Dunja Radović Stojčić. 2022. "Model for Sustainable Evaluation of the Impact of the Total Number of Centers for Technical Inspections of Motor Vehicles on the Occurrence and Consequences of Traffic Accidents in an Area" Sustainability 14, no. 14: 8873. https://doi.org/10.3390/su14148873
APA StyleVranješ, Đ., Marić, B., Đurić, T., Jovanov, G., Vasiljević, J., Jovanov, N., & Stojčić, D. R. (2022). Model for Sustainable Evaluation of the Impact of the Total Number of Centers for Technical Inspections of Motor Vehicles on the Occurrence and Consequences of Traffic Accidents in an Area. Sustainability, 14(14), 8873. https://doi.org/10.3390/su14148873