Article

Time-Use and Spatio-Temporal Variables Influence on Physical Activity Intensity, Physical and Social Health of Travelers

by
Mujahid Ali
1,*,
Dimas Bayu Endrayana Dharmowijoyo
1,*,
Afonso R. G. de Azevedo
2,
Roman Fediuk
3,
Habil Ahmad
4 and
Bashir Salah
5
1
Department of Civil and Environmental Engineering, Universiti Teknologi PETRONAS, Perak Seri Iskandar 32610, Perak, Malaysia
2
LECIV—Civil Engineering Laboratory, UENF—State University of the Northern Rio de Janeiro, Campos dos Goytacazes 28013-602, Brazil
3
Polytechnic Institute, Far Eastern Federal University, 690922 Vladivostok, Russia
4
School of Civil, Mining and Environmental Engineering, University of Wollongong, Wollongong 2522, Australia
5
Department of Industrial Engineering, College of Engineering, Kind Saud University, P.O. Box 800, Riyadh 11421, Saudi Arabia
*
Authors to whom correspondence should be addressed.
Sustainability 2021, 13(21), 12226; https://doi.org/10.3390/su132112226
Submission received: 23 September 2021 / Revised: 22 October 2021 / Accepted: 27 October 2021 / Published: 5 November 2021
(This article belongs to the Special Issue Evaluation of Sustainable Transportation Infrastructure)

Abstract

:
Using a multi-dimensional three-week household time-use and activity diary, this study aims to investigate the interaction between time-use and activity travel participation, built environment, leisure-time physical activity, travel parameters, and physical intensity on physical and social health. The relationship between time-use and activity travel participation is complex. Therefore, physical activity (PA) intensity is assumed to intermediate the relationship between endogenuous and exogenous variables. This study use a comprehensive set of data that was collected at a household level for twenty-one (21) consecutive days. A total of 732 individuals and 191 households were recorded, representing 0.029% total population of Bandung Metropolitan Area (BMA). The data analyzed with descriptive and linear regression analysis using Statistical Package for Social Sciences SPSS version 26.0.0 software (IBM: Armonk, NY, USA). An advanced model, such as the hierarchical Structural Equation Model (SEM), is used to validate the relationship between activity patterns and health parameters. The estimated results indicate that a minute increase in public transport mode has an 8.8% positive correlation with physical health and 9.0% with social health. Furthermore, an increase in the one-minute duration of in-home maintenance and out-of-home leisure activities are positively correlated by 2.9% and 3.2%, respectively, with moderate-intensity PA and by 4.5% and 1.8% strenuous-intensity PA. Additionally, high accessibility and availability of basic amenities at a walkable distance and using auxiliary time in social activities are significantly correlated with better physical and social health. Moreover, this study adopted multidisciplinary approaches for better transport policy and a healthier society with a better quality of life.

1. Introduction

In the scientific area of research, theories play a crucial role typically in transport geography and travel behaviour research, which describes activity-travel participation such as physical, social, economic, and geographic [1]. The time-geographical framework is a broader and powerful perspective that analyses human behaviour [2]. The time geography theory, also called the time-space prism theory, was introduced by Hägerstrand in the (1970s) to describe the spatio-temporal constraints under which individuals make activity and travel decisions [3]. The time-space prism theory works on three things: needs, resources, and constraints [4]. Needs and desires are the human necessities that can influence an individual to undertake and participate in an activity [5], whereas resources are the source of supply that enable us to travel and participate in activities [6]. However, constraints that limit an individual’s ability to travel and participate in an activity are further sub-divided into capability, coupling, and authority constraints [7]. These limitations interrelate with the needs and resources to develop people daily time-space prism. However, different daily needs, desires, and constraints and their time geography and paths also vary from daily [8].
House, health, physical, and social security are essential for person to live a complete and energetic lifespan [9]. The right to health is as important as the right to food and shelter. For access to these fundamentals, an individual must have resources, in the form of money, that enable the individuals to travel and participate in activities. It is essential to realize that the transport system aims to provide passengers and goods movement to reach their destinations. Travel behaviour research studies the bodily movement of a person for any purpose outside their reference location. Freight movement is only addressed in the context of people who transport goods/cargo for work, shopping, or other personal reasons [10]. The logistics of this study does not include the manufacture and supply of services and goods. Limiting ourselves to passengers, the transportation system enables individuals to travel for work, shopping, visiting family and friends, and visiting cultural and health-care facilities [11].
Shopping, working, recreating, and living are spatially separate activities; people have to travel to participate in these activities [12]. Travel behaviour is derived from the activity. To study travel behaviour, activity-travel patterns must be investigated. Every person has a different set of activities on a given day at specific places/locations. To participate in a several set of activities on a given day, individuals have to travel [13]. Travel is a permanent constraint to move from place to place [3]. While participating in an activity, there must be some needs, desires, and resources to manage the constraints [5]. The availability of infrastructures, such as commercial areas and transport networks, and accessibility to several transport modes, would provide better opportunities to involve high/fewer activities with more/less discrete places within probable time constraints [1,7].
Each person is unique, and their daily activities are also different from day-to-day [7]. Each individual has a specific role within a household, such as a husband, wife, and children. The activity is categorized into mandatory/fixed and discretionary/flexible activities [14]. Discretionary activities are further sub-divided into leisure and maintenance activities. Mandatory activities are fixed and difficult to be re-scheduled [5,6,15]. In addition, discretionary activities are those activities that can be easily re-scheduled with higher time-based and space flexibility [16]. These activities are further sub-divided into in-home and out-of-home activities. Time spent by an individual in an activity outside their residence is usually mentioned to as “out-of-home activity”, whereas the in-home activities are the opposite [17]. Women spend more time in their in-home activities to care for children and other household activities. In contrast, men need to spend most of their time in out-of-home activities to work and pick up/drop the children at school, so travel is essential to perform such activities [7,18].
The total travel time depends on the type of activity, availability of activity location, individual commitments, and available travel mode [19]. It is widely believed that an individual’s travel time is reduced by providing a closer activity location to the residential site and encouraging non-motorized transport. Some of the activities are at a long distance, whereas others are at walkable distance. Meanwhile, some individuals travel for mandatory activities while others travel for discretionary, leisure, and maintenance activities. These travels are undertaken for in-home and out-of-home activities. Individuals use different modes of transport such as motorized/passive transport (PT), non-motorized/active transport (AT), and public transport to participate in a different set of activities at a different location on a given day. Moreover, self-driving vehicles have their own strengths and weakness, such as self-driving cars following traffic rules, being fully automatic and using robotics, allowing improvement in mobility for the people who cannot drive, fuel-saving, improvement in air pollution, and reduction in car thefts. However, self-driving effects a megaregion’s traffic [20] and has some ethical issues. Strong opinions for and against driverless cars may give rise to severe social and political conflicts [21]. On the other side, there are some weaknesses: higher unemployment rate, high R&D cost, high initial purchase price, reduced social contact, difficult maintenance, and being costly. Using various transportation modes for daily activity participation positively or negatively influences one’s physical, social, and mental health [22].
Further, the individual needs to choose healthier and more environmentally friendly routes and transport modes rather than a comfortable, cheap, and quicker transport mode. For instance, the forms of travel or transport mode that are carried out by an individual (non-motorized transport mode) need to be considered, such as a trip on foot, a bicycle trip [23], a trip by a private car [24], a trip by means of public transport, or a combined trip [25], i.e., with the use of public means of transport. The increase in walking and cycling and reduction in motorized transport modes contribute to the reduction in pollution, improving health and providing a sustainable environment. Therefore, the use of active transport should be encouraged through better infrastructure, adequate land-use developments, and information campaigns.
Transport and health are interlinked at various phases. Sometimes transport affects health, whereas health influences transport decisions [26]. This means that health is also a part of capability constraints, while participating in an activity which can influence activity-travel patterns [18]. Health indicators will expose an additional dimension of individual capability factors. An individual has needs, desires, and available resources such as a car and money and wants to travel and participate in an activity at different locations. However, due to physical (e.g., broken legs, blindness, sickness and disorder), social (e.g., family/friends pressure), or mental health (e.g., stress), they may be unable to travel and participate in an activity [7,18,27]. The conceptual model/framework for the interaction of activity-travel participation and health is shown in Figure 1.
The conceptual model illustrates the dominant relationship essential for the interaction between travel behaviour and health but does not explain all categories of variables such as lifestyle habits, multitasking activities, drinking, genetics, smoking, etc., which can also affect health parameters. Due to the complexity and reason for demarcation, these factors are not discussed in this paper. The model includes relationships relevant to time-use activity-travel participation, travel behaviour, and health linked with different intermediate variables. For further discussion of the interaction between travel behaviour and health, please refer to [11,28,29]. It is a very complex phenomenon to study the influence of travel behaviour (TB) and activity-travel participation (ATP) on health [16,30]. According to the author’s view and recent literature, there has not been any study explaining the direct association among individuals’ time-use and activity-travel patterns and health conditions [11,31,32]. Meanwhile, activity-travel patterns are a too general set of variables that do not directly explain the health parameters. A link can be established with the help of more specific variables among activity-travel patterns and health variables. Active transport and physical intensity are used as a mediation variable to study the interaction of activity-travel patterns and health parameters. Physical activity can improve and maintain health parameters, but the optimal mode, intensity, frequency, and physical activity’s duration have not been determined [33,34]. Further, previous research has clearly shown that health is a permanent constraint and influence activity-travel participation and travel parameters [16,35,36]. However, the previous research rarely investigated the influence of participation in a different set of activity and travel engagement and travel parameters on a given day on health parameters, primarily physical and social health [28,31,32].
An inclusive dataset is required at an individual and household level to better understand the influence of activity-travel patterns on health conditions. The dataset includes a time-use and activity diary, detailed both in-home and out-of-home activity participation, detailed travel behaviour, rate/intensity of physical activity, and quality of life (QoL) information. The purposes of this study is to describe such data collection, which clearly shows the interaction of activity and health in the Bandung Metropolitan Area (BMA) of Indonesia. This paper highlights (1) the time-use and activity diary survey along with the advanced issue in BMA, (2) a comprehensive dataset that will provide broad understandings of the activity-travel decision-making process and opportunity at the household level to analyze the interaction between activity-travel participation and health parameters, and (3) how these influence the policy implementation for different transport modes.
The current study contributes to the body of knowledge in three different ways; Methodological, Theoretical, and Practical. The current study proposes a new conceptual and theoretical model for the daily activity participation and health parameters which nudge, empower, and educate the individual about their daily activities and health benefits. Additionally, the study’s findings may help the policymaker to build/provide sustainable environment in terms of networks, connectivity, parks, recreational places, and well-being that positively influence physical and social health. Moreover, the development of active and public transport lines and accessibility will provide more opportunities to engage in more physical activity, which will reduce pollution and provide a better, safe, and sustainable environment.
The paper’s organization is as follows: Section 2 and Section 3 shows the study area, research design, dataset, and exploratory analysis. Model estimation results of multi-dimensional data is presented in Section 4. However, Section 5 describes the discussions whereas, the conclusion are presented in Section 6.

2. The Bandung Metropolitan Area (BMA) Data Set

In 2013 the BMA dataset was designed to collect multi-dimensional data that is household information, physical activity and its intensity, time-use and activity diary, social activities within and with other household members, travel behaviour, lifestyle habits, subjective well-being, and health-related QoL data. A comprehensive dataset was collected to analyze an individual’s behaviours and health effects in a multi-dimension perspective. Because of residents’ poor education and enlistment, the surveys were conducted in the local language, i.e., Bahasa Indonesia. The survey began with a face-to-face meeting between inspectors and potential respondents, and data was collected using random selection techniques.
A number of samples need to be collected to avoid the chances of error. To determine how much respondent data will be needed, Daryle W. Morgan and Robert V. Krejcie [37,38] introduced a formula in the 1970s (refer to Equation (1)). The total dataset contained 732 individuals and 191 households for 21 subsequent days, which represents 0.029% population of the inner area of BMA in 2013. After omitting missing data and dependent children (below seven years old), this study includes 508 respondents, representing 0.020% of the population of the inner area in 2013. For details about the data set and more about Bandung, refer to Dharmowijoyo, et al., [6,32] and [39,40]. Table 1 shows the description of the 508 respondents.
s = X 2 N P   ( 1 P )   ÷ d 2 ( N 1 ) + X 2 P   ( 1 P )
s = sample size
X 2 = chi-square value for 1 degree of freedom at the desired confidence level (3.841)
N = size of the population
P = the maximum proportion of the population (assumed to be 0.50)
d = degree of accuracy (0.050).
The degree of accuracy, often called the degree of variability, refers to the population’s distribution of attributes. The confidence interval (CI) for the current study was selected as 95%; therefore, the degree of accuracy should be 5%, equivalent to 0.05. A large sample size is required to obtain a high or given level of precision in a more heterogeneous population and vice versa. A proportion of 50% (0.50) indicates maximum variability in a population, while 20% (0.20) and 80% (0.80) show that the majority do not or do, respectively, have the attribute of interest [37,41]. Meanwhile, for the safest side, a figure of 0.5 for P should be used for the population proportion. The value of P = 0.5 will provide the largest sample size in simple random sampling techniques [42,43]. Based on the equation, a total of 436 respondents samples need to be collected, representing 0.017% of the total population of the inner area in 2013. As such, for the current study, the authors collected 732 samples. After omitting the children and missing values, the remaining 508 sample respondents, representing 0.020% of the inner area population, are sufficient to fulfil the analysis’s basic requirements.

2.1. Data Set

Household and time-use and activity diary surveys were arranged for the respondents above seven years old. In contrast, household physical activity, lifestyle, and health-related QoL surveys were prepared among persons greater than or equal to (≥) 15 years old. Due to the age limitations and missing data, only 508 respondents were analyzed in lifestyle and health-related QoL surveys. Within the period gaps, since the dataset has been collected, any new regulations that may significantly alter the collected dataset are not found. Therefore, the 2013 BMA dataset was still adequate for this current study.
Household and individual survey contained eight elements: household composition, accommodation type and ownership, neighbourhood, household income, property and internet access, travel behaviour, dependent children in the household, and physical disability questions. The socio-demographic variables’ description consists of gender type, age, occupation, education level, dependent child, and household income level. Instead of objective measurement, subjective awareness was used in the dataset because the mobbing circumstances in BMA, as with the cities of Jakarta and Surabaya, are frequently highly congested and unpredictable. Thus, a subjectively perceived accessibility was considered the best step to determine the desire of the various activity locations available in the individual house/built-up sites. These data were gathered on a five-point Likert scale, with 1 indicating strong disagreement and 5 indicating strong agreement. Previous studies [31] specify that these subjective variables are extremely affected by individual activity-travel patterns, destination options, and health parameters.
Time-use and activity diary survey data are required for the analysis and estimation of the activity-based approach. A time-use survey entailed collecting data regarding all the in-home and out-of-home (mandatory and discretionary) activities on a given day [13]. Instead of a travel diary, time-use and activity diary data were collected [44] because it provided richer information for computing daily time-use and activity participation and individual travel behaviour [45]. The time-use and activity diary survey were planned for 15 min intervals (1440/15 = 96-time slices in a day) because it caused less bias in assessing their time allocation to the particular activity types and was entirely understandable to both respondents and surveyors. Those activities which are less than 15 min would not be able to be recorded. Each activity dairy contained 23 types of activity participation, which were classified as in-home and out-of-home activities. These activities are further categorized as in-home and out-of-home mandatory maintenance and leisure activities along with travel participation, as shown in Table 2.
Respondents were asked to talk about time spent on different activities on a given day from morning till sleeping throughout the week from Monday to Thursday, Friday (weekdays), and Saturday and Sunday (weekends). The time spendt for in-home mandatory activities was more than the rest of the activities because the category contains a sleeping activity, which can occupy more than 10 h per day. Based on activities’ classification, there is a trend of activities across the week. Compared to out-of-home activities, there is a continuous increasing in-home activities’ allocation for all mandatory, leisure, and maintenance throughout the week.
The household physical activity and health-related quality of life survey contained four main components: physical and social activity at a household level, communication within and with other family members, lifestyle habits, and health-related QoL and its potential influencing factors. Household physical activities are classified as vigorous/strenuous and M-IPA. Those activities that require more effort (running, hiking, playing basketball or football, or tennis games), burn many calories more than six Metabolic Equivalent Tasks (6 METs), and activities where a high amount of oxygen consumption is required to complete the activity are defined as vigorous activities. In contrast, M-IPA burns off 3–6 times more energy per minute as compared to sitting quietly, which brings them into the 3 to 6 METs range. Household data contain social and communication activities within/outside the family, consisting of frequency (how many days in a week) and duration (how many minutes in a day) for which an individual participates in such activities.
This questionnaire contained health-related Quality of Life (QoL) questions based on SF-36 (Short-Form 36), one of the universal scales for health-related surveys. The set of questions contained eight subscales for health parameters and has been adopted by more than 11 countries [31]. As suggested by [46,47], physical health is defined by the eight subscales, which are measured in categories such as physical functioning (PF), limitations on role functioning due to physical health (RP), bodily pain (BP), and general health (GH) as shown in Figure 2. Meanwhile, limitations on role functioning due to emotional problems (RE), social functioning (SF), and limitations on role functioning according to physical health (RP) are defined as social health, as shown in Figure 3. In contrast, bodily pain (BP), general health (GH), social functioning (SF), mental health (MH), and vitality (VT) define mental health.
Figure 3 illustrates the sub-variables of social health, which contained RE, RP, and SF. The question related to RE was “During the past 4 weeks, have you had any difficulties in your work or other daily activities as a result of any emotion problem (such as feeling depressed or anxious)?,” which was answered by the respondents on five-point Likert scale from negative to positive expressions. The detailed measurement model and factor analysis of observed variables for the estimation of social health are shown in Figure 3.
The question related to PF was, “Does your health now limit you in vigorous and moderate activities? If so, how much?” Respondents answered on a five-point Likert scale from expressions of all the time to never. Meanwhile, questions on RP variables contained “During last 4 weeks, how much did you get the difficulties in your work as a result of your health condition?”. However, BP contained questions such as “How much bodily pain have you had during the past 4-weeks?, whereas GH included questions such as “In general, how would you say your health is?”. Respondents answered on a five-point Likert scale of “Excellent, very good, good, fair, and poor.” The factor analysis of these variables on physical health is shown in Figure 2.

2.2. Methods

SPSS version 26.0 was used to create a factor score with a Promax rotation of kappa 4 and extract the values using basic principle component analysis with an absolute value of greater than 0.30. The regression score aims to find the value of “Y” based on the values of the observed variable “X” to minimize the error term “ɛ,” as shown in Equation (2). As suggested by [48] Promax and varimax rotations are used when a single factor is expected from the multi-dimensional information of latent variables. The general purpose of factor score analysis is to summarise the data so that the relationship and patterns can be easily interpreted and understood. Factor score analysis is typically used to regroup variables into a small cluster group [49].
Y = α + β X + ε  
The questionnaire survey’s reliability was checked in Statistical Package for Social Sciences (SPSS) through Chronbach’s Alpha. Further, the validity of the questionnaire was tested using the Pearson correlation coefficient test using SPSS. After checking the reliability and validity of the questionnaire survey data, the data were transferred from paperwork to the computer (excel sheet) for cleaning and screening. After the cleaning of the data, it was converted to SPSS for the descriptive statistic analysis. For the Structural Equation Modeling (SEM) and Non-linear and Linear Mixed Mode Effect Models (NLME), the data was transferred to RStudio. An aggregate data tool was used for the classification of the activities, whereas the record function was used for the socio-demographic classification such as gender record as male and female.
The two main factor analysis techniques are exploratory factor analysis (EFA) and confirmatory factor analysis (CFA). Practitioners may use exploratory factor analysis (EFA) to reduce a large number of items for a questionnaire or survey to a smaller component. EFA tries to uncover latent dimension/complex patterns such as physical and social health from the observed variables (sub-variables of physical and social health) or examining which item has the strongest association with a given factor. Once EFA identifies the number of factors in the underlying dataset, the observed variables are subsequently analyzed [48].

3. Exploratory Analysis

3.1. Physical Activities at Socio-Demographic Level

Physical activities are categorized as strenuous/vigorous and M-IPA. The rate of physical intensity is measured from the frequency and duration of an activity. Frequency means how many days in a week an individual performs the S-IPA and M-IPA. In contrast, the duration is the minutes in a day taken to perform S-IPA and M-IPA at a socio-demographic level. In this research, the duration of the activity is considered instead of the frequency because the duration provides richer information towards the health parameters. The duration (minutes/day) of S-IPA and M-IPA with socio-demographic variables is shown in Figure 4.
Those with high incomes are involved in more S-IPA and M-IPA than the rest of all socio-demographics. Meanwhile, workers and those aged 23 to 45 years are engaged in high physical activities compared to children, older people, non-workers, and students. Regarding the genders, males commi more as compared to females. In contrast, in males, individuals perform more M-IPA than S-IPA.

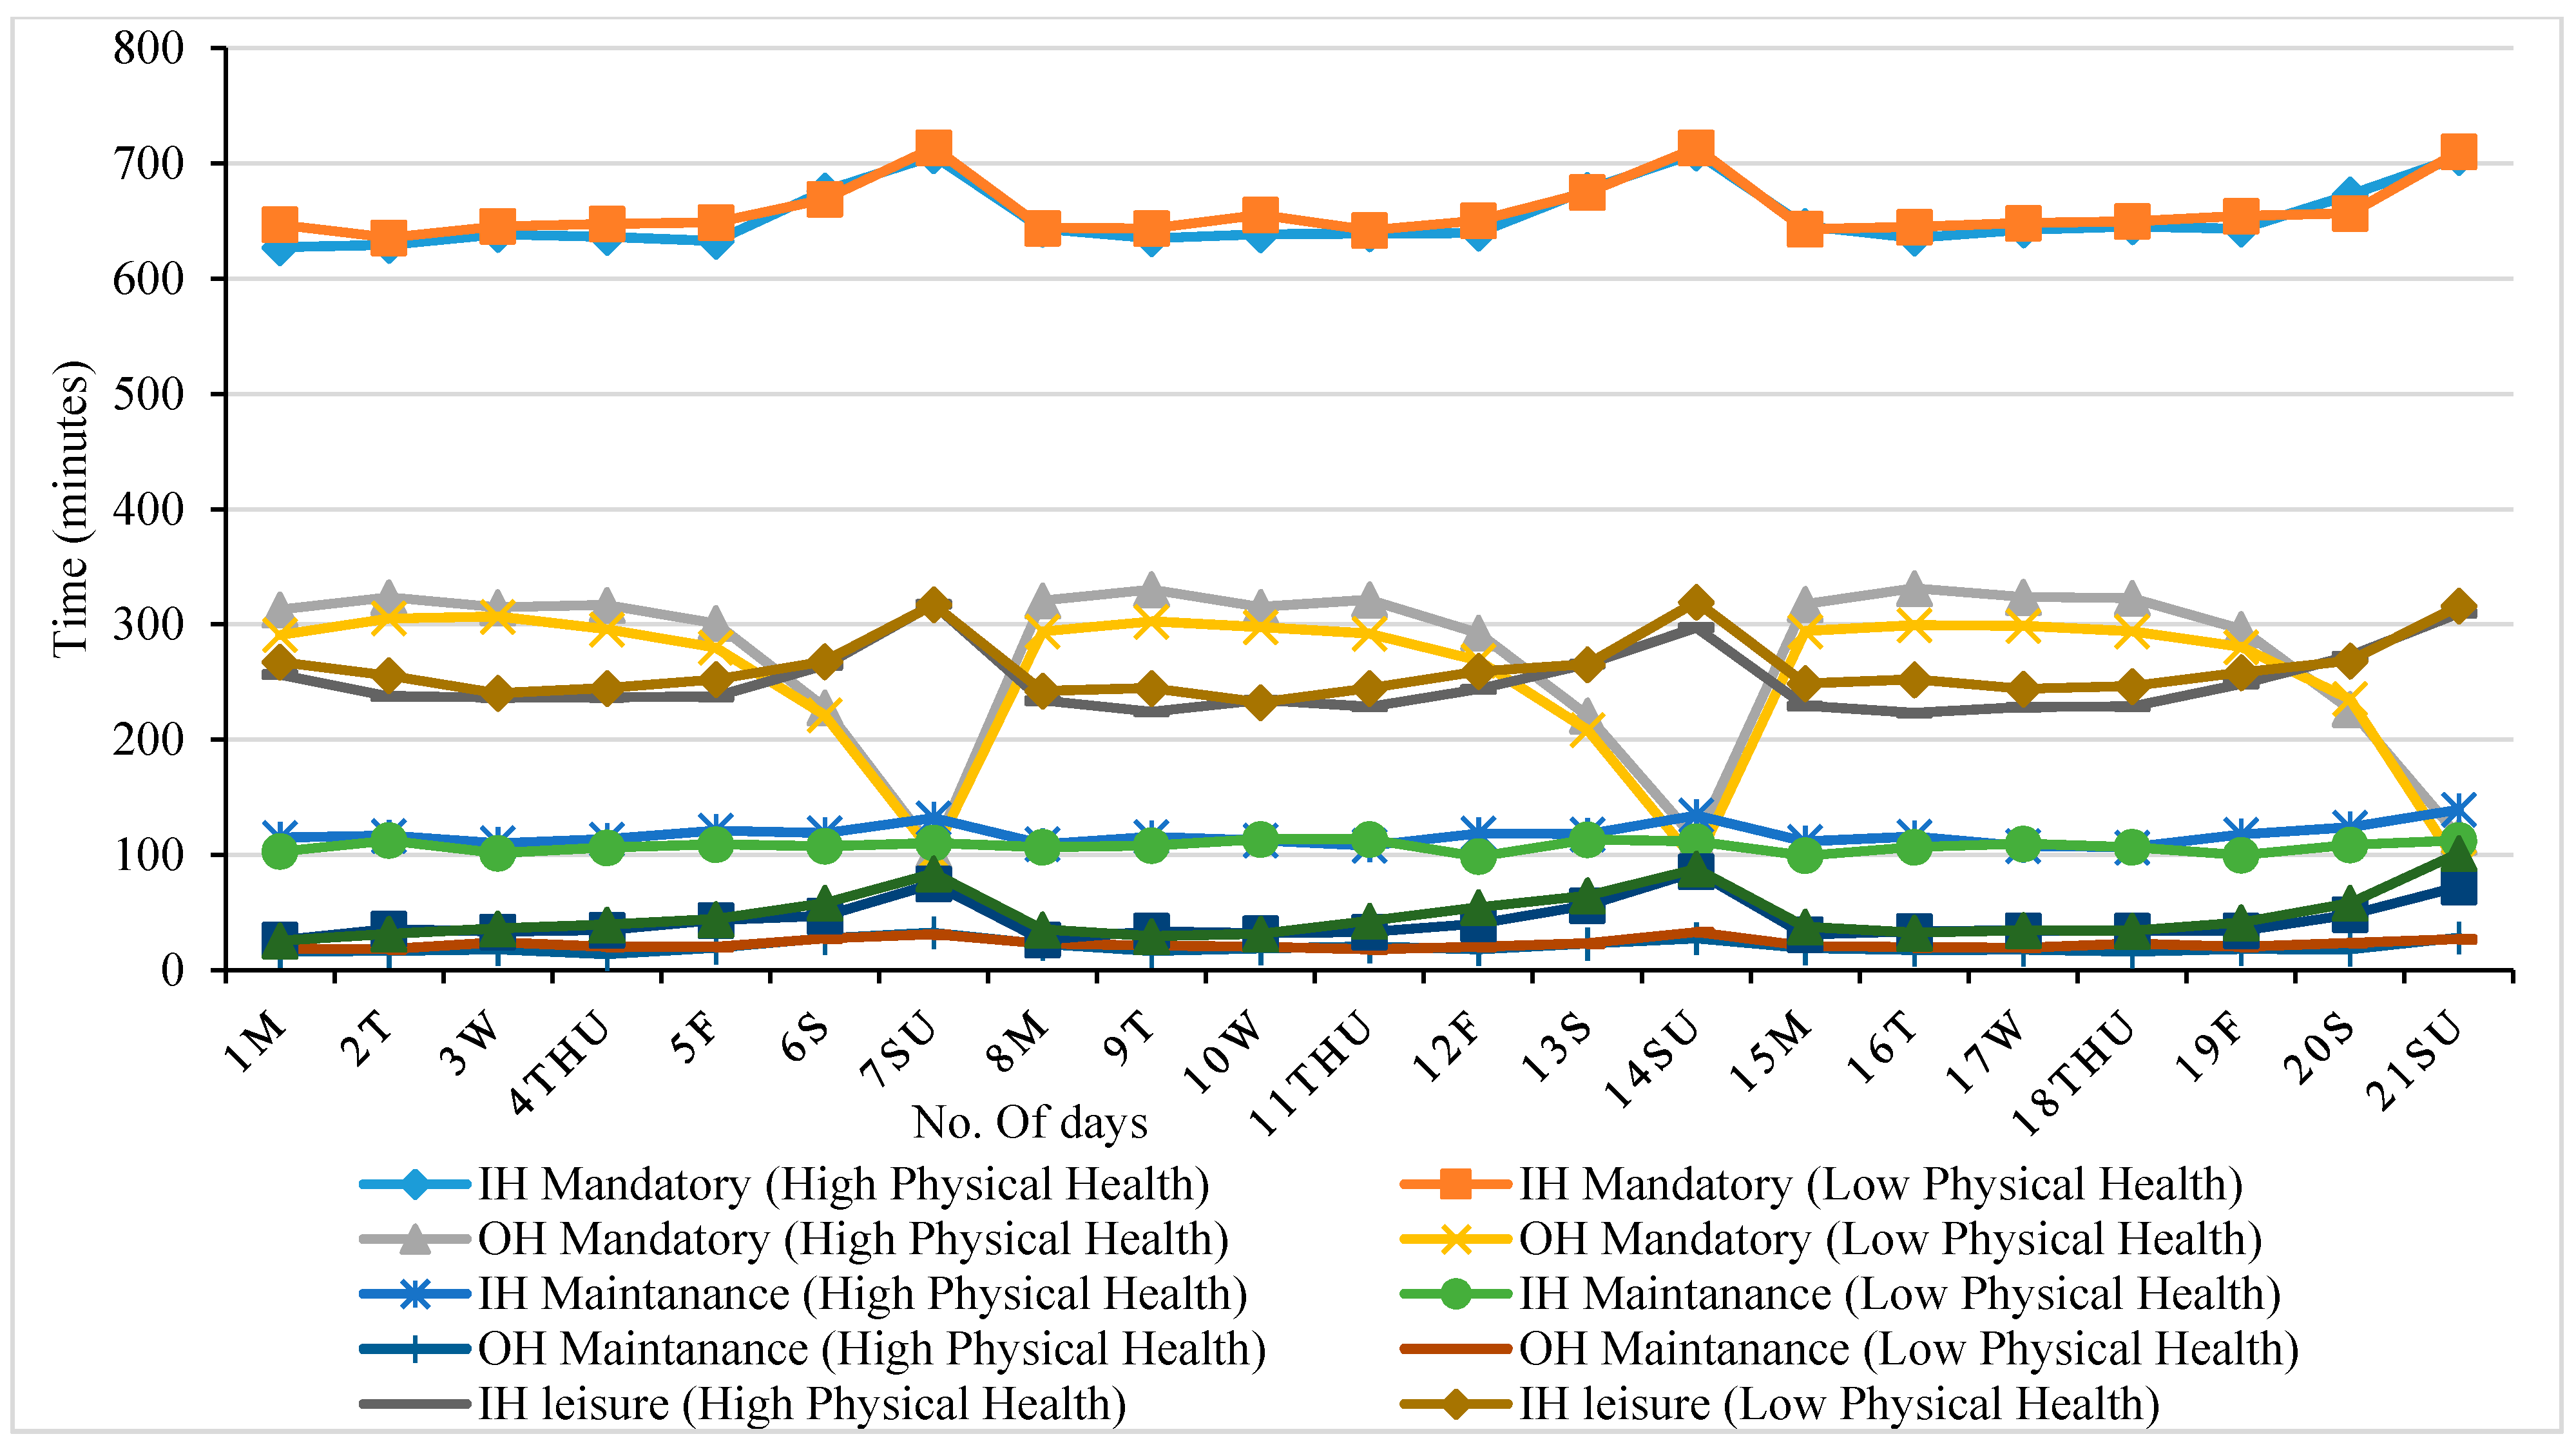
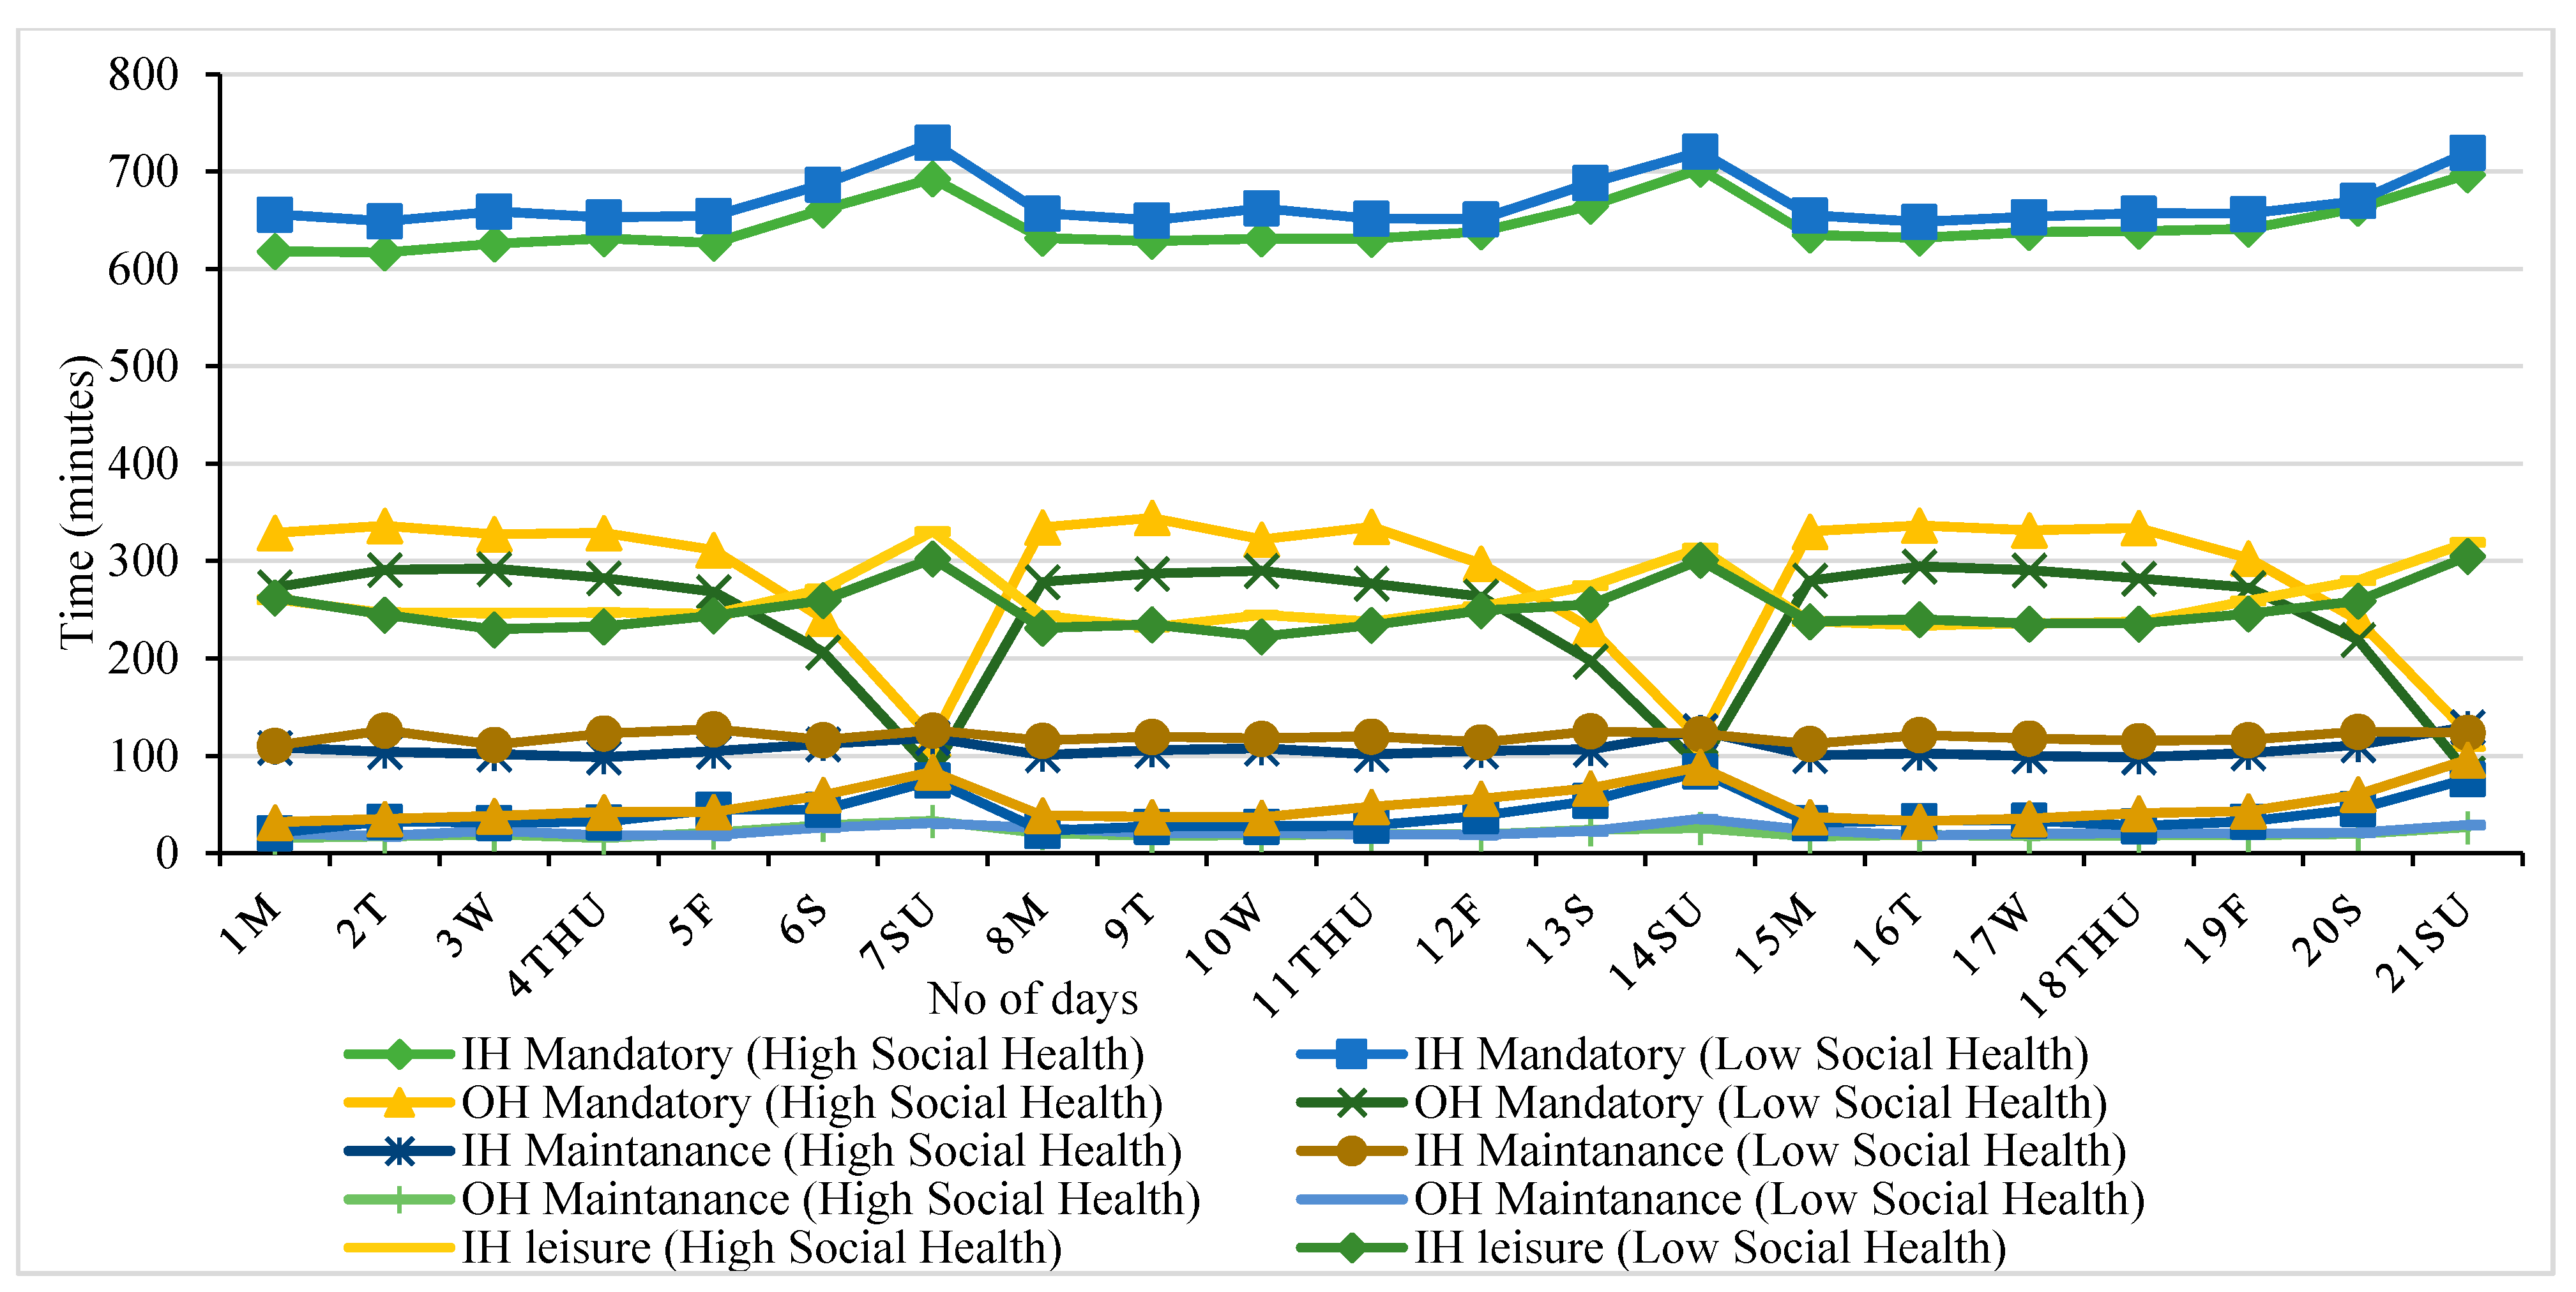
3.2. Daily Time-Use for Various Activities

Figure 5 exhibits the relationship between daily time-use and activity travel participation for a different S-IPA with high and low physical activity on a given day in a week. The highest time spent for the in-home mandatory activities is because of the in-home mandatory activity of sleeping time, which uses more than eight hours (480 min) in a day. As in-home mandatory and leisure activities are increased on the weekend, the out-of-home activities are decreased. However, there is a slight variation in the in-home and out-of-home maintenance activities throughout the weeks. Increase and decrease are positively and negatively correlated with physical, social, and mental health. Doing more physical activities, either in-home or out-of-home, significantly influences physical health.
Figure 6 shows the daily time spent on travel parameters by strenuous physical activity throughout the week. Travel time offers the highest consumption of time because it combines all modes of transport (motorized, non-motorized, and public transport). However, there is a variation within the travel time in low and high strenuous physical activities on weekdays and weekends. Meanwhile, individuals spend more of their travel time on high strenuous physical activities than low strenuous physical activity. An individual was generally involved more in both high and low strenuous physical activities on weekdays and less on weekends. Individuals use different modes of transport for their activities in other places/locations. On weekends, individuals use more non-motorized modes for both low and high strenuous activities than others, which shows that individuals are involved in more leisure and maintenance activities at weekends.
Meanwhile, motorized and public transport are used more on weekdays, which shows that most individuals are engaged in out-of-home mandatory activities such as working, office, and picking up/dropping off kids from school. All these variations are differently correlated with physical and social health.
Figure 7 illustrates the relationship between daily time-use on different in-home and out-of-home M-IPA with low and high physical activity on a given day throughout the week. In-home mandatory, leisure, and out-of-home maintenance activities increase on weekends in low and high-intensity physical activity. In contrast, the out-of-home mandatory activities are decreased, which means that most individuals are busy in their working and office activities on weekdays and resting on weekends at home. There is a slight variation in the in-home maintenance, out-of-home leisure, and maintenance activities on both weekdays and weekends, and both high and low M-IPA on given days throughout the weeks. Doing more work and office activities is positively correlated with better physical health, whereas engaging in more or less leisure and maintenance activities is significantly associated with better social and mental health.
Figure 8 exhibits the average travel time and modes of transport to participate in different sets of M-IPA on a given day throughout the weeks. As with S-IPA, M-IPA behaves the same, with a slight decrease in the average travel time. There is a variation in the high- and low-intensity physical activity, as the average travel time and motorized mode are decreasing on weekends (Sunday) in low-intensity physical activity, whereas increasing in the high-intensity physical activity. However, the non-motorized mode of transport increases on weekends in both high- and low-intensity physical activity. In contrast, public transport decreases on weekends, which means that most individuals perform out-of-home leisure and maintenance activities using a non-motorized mode of transport. Meanwhile, the motorized mode of transport is decreased on the weekend, which shows that most of the individuals are engaged with out-of-home mandatory activities (working and office) on weekdays by using a motorized mode of transport for their daily activities. Those individuals who have a regular activity-travel pattern on a weekday compared to other days of the week are significantly correlated with better physical and social health.
The relationship between an individual and other household members’ daily work, in-home, and out-of-home mandatory, leisure, and maintenance activity time used by physical and social health is shown in Figure 9 and Figure 10. Meanwhile, the effect of life variables, such as socio-demographic variables, S-IPA and M-IPA, and health parameters are exposed in Figure 11. However, the effect of socio-demographic variables on the physical and social health variables are shown in Figure 12. In these figures, S-IPA and M-IPA, physical and social health refers to those with an above-zero (positive value) S-IPA and M-IPA, and physical and social health index. However, low S-IPA and M-IPA, and physical and social health means someone with zero or less than zero (negative value) S-IPA and M-IPA, and physical and social health.
Undertaking more physical and social activities on weekends (especially on Sunday) represents more meaningful physical and social activity participation than weekdays from Monday to Friday and Saturday, as shown in Figure 9 and Figure 10. In addition, an individual who lives with other household members and works for longer hours has significantly better physical and social health than those who have shorter working hours in-home and out-of-home. Meanwhile, those engaged in more S-IPA and M-IPA have better physical health. In contrast, those who have social participation in different places and locations have better social health.
In terms of life variables with the intensity of physical activity and health parameters (physical and social), Figure 11 shows that households with low- to middle-income show better S-IPA and M-IPA, and physical and social health compared to medium- to high-income households. On the other hand, males, workers, and those from 23 to 45 years old have a better intensity of physical activity, and physical and social health than females, children, aged people, non-workers, and students.

4. Model Estimation Results

Table 3 examines how socio-demographic and economic variables, personal and household, and spatial-temporal characteristics explain the average time engaged with physical activity, and physical and social health. Meanwhile, the endogenous variable was supposed to interact with the time-use and activity travel participation, trip and travel parameters, and average time engaged with social activities on physical and social health in a multivariate manner. A physical activity’s intensity (strenuous and moderate) is used as a mediation variable between the time-use and activity-travel patterns and health parameters to solve the endogeneity problem, as shown in Figure 13.
The results are estimated using two-stage least square (2SLS) with an instrumental variable (IV) and regression analysis by taking the standardized value to see the effect of exogenous variables on the endogenous variables, which are represented in the form of positive and negative signs. The instrumental variable (IV) is a well-known method for dealing with endogeneity [50]. Instrumental variables (the intensity of physical activity) are used as mediation to see the effect of exogenous variables (spatiotemporal variables) on the endogenous variables (physical and social health variables). The individual and other household members’ day-to-day activity-travel participation variation made by the individual i household h on a day t is considered by the coefficient parameter (βn) in this model. However, the uncorrelated and specific error term of individual and household (uh and ui) had zero mean, whereas the εi,h,t is the uncorrelated individual, household, and time error component with zero mean value as shown in Equations (3)–(6). Equations (3)–(6) can be written as follows to better explain the proposed model in Figure 13 using a mathematical form.
(M-IPA)i, h, t = (αi, h + ui + uh) + β1 Si, h + β2 Bi, h + β3 Acti, h, t + β4 Tripi, h, t + β5 Traveli, h, t, + β6 Sociali, h, t + εi, h, t
(S-IPA)i, h, t = (αi, h + ui + uh) + β7 Si, h + β8 Bi, h + β9 Acti, h, t + β10 Tripi, h, t + β11 Traveli, h, t, + β12 Sociali, h, t + εi, h, t
(PH)i,h = (αi, h + ui + uh) + β13 Si, h + β14 Bi, h + β15 Acti, h, t + β16 Tripi, h, t + β17 Traveli, h, t, + β18 Sociali, h, t + ɣ1 (M-IPA) i,h, t + ɣ2 (S-IPA)i,h, t + εi, h, t
(SH)i,h = (αi, h + ui + uh) + β19 Si, h + β20 Bi, h + β21 Acti, h, t + β22 Tripi, h, t + β23 Traveli, h, t, + β24 Sociali, h, t + ɣ3 (M-IPA) i,h, t + ɣ4 (S-IPA)i,h + εi, h, t
Additionally, the coefficient parameter is βn, uh and ui is the uncorrelated and specific error term of individual and household, εi,h,t is the uncorrelated individual, household, and time error component with a mean value of zero, and α is the co-efficient constant, with nestings of individual (i), household (h), and activity (t).
Figure 12 shows the effect of life stage variables such as socio-demographic variables on physical and social health. High physical and social health refers to someone with above zero (>0) physical and social health, whereas low physical and social health refers to those who have an equal to or less than zero (<0) physical and social health index. Regarding ages, those less than 22 years old show high physical and social health compared to others. Those above 46 years old have the lowest physical and social health problems because of their workload, family burden, and weak body. As suggested by [51], age and gender are consistently related to physical activity. However, [16] shows that those above 50 years old have physical, social, and mental health problems.
Regarding gender, males have better physical and social health than females because males are engaged with more out-of-home mandatory, leisure, maintenance, and social activities. As mentioned in recent studies, males participate more in out-of-home activities than females because men have a different level of activity, which improves their physical and social health [7,32,52]. In addition, students show the highest level of physical and social health because of the daily participation of physical and social activities within and with other family members at different locations on a given day throughout the week. Meanwhile, those with low incomes have better physical and social health than those with high incomes, which shows that most of them belong to workers and students.

5. Discussion

Table 3 shows the statistically significant influence of time-use and activity travel participation and travel patterns on travellers’ physical and social health. Committing to using the non-motorized and public mode of transport for their daily activity are positively correlated with physical and social health. In contrast, the number of trips to and from the workplace using any mode of transport is negatively correlated with physical and social health but positively associated with S-IPA and M-IPA. Additionally, the number of the trip chain is the opposite. Participating in S-IPA and M-IPA using moterized and public transport is negatively correlated and does not influence the motorized transport mode. An increase in 1 min of total travel time is 0.049 positively correlated with M-IPA, whereas it has a −0.05 negative correlation with physical health and has no significant correlation with social health. The motorized mode of transport positively correlates with social health, whereas no such correlations were found between the non-motorized transport and health parameters. A 1minute increase in public transport mode positively influences, by 0.088 (8.8%) and 0.090 (9%), physical and social health, respectively. In today’s world, it is estimated that more than 35% of all adults do not get enough physical activity [53]. Active transportation has the potential to reduce pollution and climate change while also providing significant health benefits [54].
Regarding activity classification, in-home and out-of-home maintenance and leisure are positively correlated with moderate and strenuous PA and have no significant correlation with the rest of the activities. In-home leisure activities are positively associated with physical and social health. In contrast, in-home and out-of-home mandatory and maintenance activities are negatively correlated with physical and social health. The estimated result shows an increase in the one-minute duration of in-home mandatory and maintenance activities has. by −0.03 and −0.04, a negative correlation with physical health. Further, out-of-home maintenance activities are −0.14 (14%), and in-home −0.03 (3%), negatively correlated with social health. A unit increase in in-home leisure activities has a positive association of 0.107 (10.7%) and 0.064 (6.4%) with physical health and social health, respectively. As in-home activities take 75% of daily time expenditure and limit out-of-home activities, this negatively influences physical and social health. In addition, participating in more out-of-home activities improves physical and well as social health.
An increase in one minute of out-of-home discretionary activities was positively correlated by 10% with physical health and 6.4% with social health, which means that increasing in-home mandatory activities can limit out-of-home discretionary activities, which negatively influences health parameters. According to travel behaviour research, the increase of in-home mandatory activities (e.g., working, office) reduces the number of trips/trip chains and total travel time, leading to reduced access to various out-of-home physical and social activities [55,56,57].
Regarding socio-demographic variables, males are found to have 0.073 times more moderate and 0.053 more S-IPA than females, and a 0.066 positive correlation with physical health and no correlation with social health. In socio-demographic variables, males are more likely than females to participate in M-IPA and S-IPA [58]. Meanwhile, the time-space constraints for non-workers are more flexible and they have a high social participation due to more in-home and out-of-home discretionary activities. Non-workers are −0.025 and −0.04 negatively correlated with M-IPA and S-IPA, respectively, and 0.057 and 0.129 positively correlated with physical and social health because of the increased physical and social interaction within the family members and flexible in-home and out-of-home activities. In terms of physical and social health, students have tighter time-space constraints and have a 0.325 (32.5%) and 0.278 (27.8%) positive correlation with physical and social health, respectively, which can be seen from Figure 12. However, students are more involved with M-IPA, which positively influences their lives compared with strenuous activity. Roberts suggested that the health parameters of the students are affected by financial circumstances [59].
All individuals from the age of below 55 years are positively correlated with M-IPA and S-IPA. However, those from the age of 23 to 45 show the highest involvement in physical activity and are positively associated. Further, 31.9% of individuals are involved in moderate activities, whereas 19.8% of individuals from the age of 23 to 45 are engaged in S-IPA. The correlation between physical health and age is statistically significant because all the individuals participate in both S-IPA and M-IPA, whereas for social health, it is the opposite. However, participating in different activities on a given day statistically positively influences physical health but is negatively correlated with social health [60]. Those from the age of 15 to 45 participate in more M-IPA and S-IPA with better physical health [58]. Due to less engagement in social activities, this negatively influences social health.
There is also some influence on the opportunities offered by geographical conditions. Those who reside near shopping centres, parks and bus stop stations within the populated area have 0.046, 0.108, and 0.084 positive correlations with M-IPA, respectively. In contrast, those with a government office, CBD, and grocery shop are the opposite. However, those residing near government offices and grocery shops are −0.11 and −0.181 negatively correlated with moderate activity, respectively, and −0.133 and −0.025 with S-IPA. Those living near the shopping centre and bus stop are 0.188 and 0.53 positively correlated with physical health, respectively, and 0.263 and 0.367 with social health. However, those who are near grocery stores are the opposite. Due tomainly two reasons, individuals did or did not participate in physical activities: lack of infrastructure or facilities (parks and walking tracks) and fear of safety. A 1-min increase in travel time to the bus stop is 53% positively associated with physical health and 36.7% with social health. Moreover, a unit increase in travel time to the shopping centre is 18% positively correlated with physical health and 26.3% with social health. However, travel time to grocery shop has a 19% negative correlation with physical health and 12% with social health. The built environment may be considered a foundation for the health parameters and well-being [61,62].
Residing in the city centre within populated areas where all the facilities are available at a walkable distance is positively correlated with better physical and social health. The estimated results show that the responded location’s trade centre and settlement area negatively correlate with M-IPA and S-IPA. However, it is positively correlated with physical and social health along with the industry area. Settlement area, trade centre, and industrial area are 33.5%, 34.9%, and 47.1% positively correlated with physical health, respectively, whereas they are 26.4%, 31.7%, and 25.8% positively associated with social health. This result also exhibits that those living in the poverty areas, denser industrial and agriculture areas, are socially excluded, increasing social and physical health problems [7].
In terms of social activities within and with other family members, many households with low income experienced psychological distress, which caused social health problems. In this study, the frequency of social activities within a family member and other household members is, respectively, 0.15 and 0.09, and 0.24 and 0.036 negatively correlated with physical and social health. Further, the duration of social activities within family members and other household members are 0.074 and 0.047, and 0.075 and 0.036 positively associated with physical and social health, respectively. Therefore, having more household members provides more opportunities to engage in more physical and social activities that improve one’s physical and social health [32].

6. Conclusions

The current research uses physical activity intensity (PAI) at work as a mediation variable to investigate the relationship between time-use and ATP and health parameters in BMA, Indonesia. There is a strong correlation between ATP and health parameters and PAI, meaning that PAI mediates the relationship between those variables. Model estimation results and SEM show that PAI mediates the relationship between ATP and health parameters. The endogenous S-IPA shows a positive correlation with physical and social health, whereas M-IPA is the opposite. Therefore, a one-minute increase in S-IPA is, by 0.889 and 0.703, positively correlated with physical and social health, respectively. In travel behavior research and health studies, the 10% R-Square value is acceptable; however, the current study’s R-square value is above 20% for all the dependent variables.
This paper explains how time-use and activity travel participation, activity-travel patterns, trip parameters, perceived accessibility, geographical condition, and socio-demographic variables influence health parameters. With highly congested roads and inadequate public transport networks, travelers in BMA have high intension and commitment to using motorized mode for their daily activities, which becomes their habit and negatively affects physical health.
Those with better physical health use non-motorized or less motorized modes of transportation for their daily activity-travel participation, which is associated with better physical health. To do this and encourage individuals to use non-motorized modes, it is essential to develop or provide all the local activity centres and basic amenities at a walkable distance, which enables an individual to walk/travel by public transport and participate in activities. Furthermore, because of physical activity and communication activities among household members, individuals who have dependent children in their household tend to have better physical and social health. Besides, many households with low income experienced physical, social, and mental health problems.
When it comes to the number of trips and trip chains, those who take a lot of them engage in fewer physical and social activities. Those households with more trip chains, on the other hand, have a higher rate of participation in physical and social activities. The estimated results show that number of trips is negatively correlated with physical and social health, whereas trip chains are positively associated with physical and social health.
The survey results show that individuals spend 75% of their daily time in in-home mandatory (sleeping, bathing, and eating) and maintenance activities. In contrast, the rest of their time is spent doing out-of-home mandatory, leisure, and maintenance activities. Using daily time for out-of-home activities is positively correlated with better physical and social health than time spent doing in-home activities. Individuals spend most of their time in office activities, which negatively influences physical health. However, in-home leisure time positively affects physical and social health because individuals may do physical activities with socializing activities.
Perceived accessibility and built environment (land use and transport network) allow travellers to travel by different transport modes and provide all the necessary amenities at a walkable distance. High accessibility and availability of basic public amenities at a walkable distance provide an opportunity to travel and participate in an activity. The built environment influences physical activity, which affects physical health, whereas undertaking social and recreational activities positively correlates with better social health. The estimated results also show that those who reside near shopping centres and bus stops within populated areas are positively associated with better physical and social health. Understanding all the aspects will enable us to improve transport policy, which promotes a healthier society.
The current study will help policymakers to develop their policies based on daily activities and provide all the basic necessities at a walkable distance to increase daily activities by using non-motorized transport modes, which will improve their physical, social, and mental health. Although this research is quite significant in terms of theoretical contribution, there are certain limitations that future researchers can address. The data used in this research are limited to Bandung Indonesia, which is a specific city in Indonesia. Therefore, future work can extend the current study by taking samples from various cities of Indonesia to increase the generalizability of the results.

Author Contributions

Conceptualization, D.B.E.D. and M.A.; methodology, M.A., A.R.G.d.A. and B.S.; software, M.A., H.A., R.F.; validation, D.B.E.D., M.A. and B.S.; formal analysis, M.A. and R.F.; investigation, D.B.E.D. and M.A.; resources, D.B.E.D. and A.R.G.d.A.; data curation, A.R.G.d.A. and R.F.; writing—original draft preparation, M.A., D.B.E.D. and B.S.; writing—review and editing, M.A., R.F. and H.A.; visualization, A.R.G.d.A., H.A.; supervision, D.B.E.D., A.R.G.d.A., B.S.; project administration, D.B.E.D., M.A., B.S.; funding acquisition, B.S. All authors have read and agreed to the published version of the manuscript.

Funding

This study received funding from King Saud University, Saudi Arabia through researchers supporting project number (RSP-2021/145). And the APCs were funded by King Saud University, Saudi Arabia through researchers supporting project number (RSP-2021/145).

Institutional Review Board Statement

Not applicable.

Informed Consent Statement

Not applicable.

Data Availability Statement

The data presented in this study are available on request from the corresponding author.

Acknowledgments

The authors thanks and extend their appreciation to King Saud University, Saudi Arabia for funding this work through researchers supporting project number (RSP-2021/145).

Conflicts of Interest

The authors declare no conflict of interest.

References

  1. Miller, H.J. A Measurement Theory for Time Geography. Geogr. Anal. 2005, 37, 17–45. [Google Scholar] [CrossRef]
  2. Miller, H.J. Modelling Accessibility Using Space-Time Prism Concepts within Geographical Information Systems. Int. J. Geogr. Inf. Syst. 1991, 5, 287–301. [Google Scholar] [CrossRef]
  3. Corbett, J. Torsten Hӓgerstrand, Time Geography. Available online: https://is.muni.cz/el/1431/jaro2006/Z0147/time_geography.pdf (accessed on 26 October 2021).
  4. Neutens, T.; Schwanen, T.; Witlox, F. The Prism of Everyday Life: Towards a New Research Agenda for Time Geography. Transp. Rev. 2011, 31, 25–47. [Google Scholar] [CrossRef]
  5. Fauzi, N.F.M.; Dharmowijoyo, D.B.E. Activity-Travel Participation, Multitasking in Travel and Daily Well-Being. In MATEC Web of Conferences; EDP Sciences: Ulis, France, 2019; Volume 270, p. 8. [Google Scholar] [CrossRef] [Green Version]
  6. Dharmowijoyo, D.B.; Susilo, Y.O.; Karlström, A.; Adiredja, L.S. Collecting a Multi-Dimensional Three-Weeks Household Time-Use and Activity Diary in the Bandung Metropolitan Area, Indonesia. Transp. Res. Part A Policy Pract. 2013, 80, 231–246. [Google Scholar] [CrossRef]
  7. Dharmowijoyo, D.B.; Joewono, T.B. Mobility and Health: The Interaction of Activity-Travel Patterns, Overall Well-Being, Transport-Related Social Exclusion on Health Parameters. In Energy Efficiency in Mobility Systems; Springer: Boston, MA, USA, 2020; pp. 53–83. [Google Scholar]
  8. Susilo, Y.O.; Liu, C. The Influence of Parents’ Travel Patterns, Perceptions and Residential Self-Selectivity to Their Children Travel Mode Shares. Transportation 2016, 43, 357–378. [Google Scholar] [CrossRef]
  9. Pereira, A. Live and Let Live: Healthcare Is a Fundamental Human Right. Conn. Public Interest Law J. 2003, 3, 481. [Google Scholar]
  10. Axhausen, K.W. Concepts of Travel Behaviour Research, in Threats from Car Traffic to the Quality of Urban Life: Problems, Causes and Solutions; Gärling, T., Steg, L., Eds.; Emerald Group Publishing Limited: Bingley, UK, 2007; pp. 165–185. [Google Scholar]
  11. Wee, B.V.; Ettema, D. Travel Behaviour and Health: A Conceptual Model and Research Agenda. J. Transp. Health 2016, 3, 240–248. [Google Scholar] [CrossRef] [Green Version]
  12. Acker, V.V.; Van Wee, B.; Witlox, F. When Transport Geography Meets Social Psychology: Toward a Conceptual Model of Travel Behaviour. Transp. Rev. 2010, 30, 219–240. [Google Scholar] [CrossRef] [Green Version]
  13. Bhat, C.R.; Koppelman, F.S. Activity-Based Modeling of Travel Demand. In Handbook of Transportation Science; Springer: Boston, MA, USA, 1999; pp. 35–61. [Google Scholar]
  14. Schwanen, T.; Kwan, M.-P.; Ren, F. How Fixed Is Fixed? Gendered Rigidity of Space–Time Constraints and Geographies of Everyday Activities. Geoforum 2008, 39, 2109–2121. [Google Scholar] [CrossRef]
  15. Cullen, I.; Godson, V. Urban Networks: The Structure of Activity Patterns. Prog. Plan. 1975, 4, 1–96. [Google Scholar] [CrossRef]
  16. Ali, M.; Dharmowijoyo, D.B.; Harahap, I.S.; Puri, A.; Tanjung, L.E. Travel Behaviour and Health: Interaction of Activity-Travel Pattern, Travel Parameter and Physical Intensity. Solid State Technol. 2020, 63, 4026–4039. [Google Scholar]
  17. Petersen, J.; Austin, D.; Mattek, N.; Kaye, J. Time Out-of-Home and Cognitive, Physical, and Emotional Wellbeing of Older Adults: A Longitudinal Mixed Effects Model. PLoS ONE 2015, 10, e0139643. [Google Scholar] [CrossRef] [PubMed]
  18. Ramli, M.I.; Dharmowijoyo, D.E. Activity-Travel Behaviour, and Daily and Global Well-Being. In MATEC Web of Conferences; EDP Sciences: Ulis, France, 2018; Volume 203, p. 11. [Google Scholar] [CrossRef]
  19. Susilo, Y.O.; Dijst, M. How Far Is Too Far? Travel Time Ratios for Activity Participation in the Netherlands. Transp. Res. Rec. J. Transp. Res. Board 2009, 2134, 89–98. [Google Scholar] [CrossRef]
  20. Huang, Y.; Kockelman, K.M.; Quarles, N. How Will Self-Driving Vehicles Affect U.S. Megaregion Traffic? The Case of the Texas Triangle. Res. Transp. Econ. 2020, 84, 101003. [Google Scholar] [CrossRef]
  21. Hansson, S.O.; Belin, M.-Å.; Lundgren, B. Self-Driving Vehicles—An Ethical Overview. Philos. Technol. 2021. [Google Scholar] [CrossRef]
  22. Farber, S.; Páez, A. My Car, My Friends, And Me: A Preliminary Analysis of Automobility and Social Activity Participation. J. Transp. Geogr. 2009, 17, 216–225. [Google Scholar] [CrossRef]
  23. Arroyo, R.; Mars, L.; Ruiz, T. Perceptions of Pedestrian and Cyclist Environments, Travel Behaviors, and Social Networks. Sustainability 2018, 10, 3241. [Google Scholar] [CrossRef] [Green Version]
  24. Macioszek, E.; Kurek, A. P&R Parking and Bike-Sharing System As Solutions Supporting Transport Accessibility of the City. Transp. Probl. 2020, 15, 275–286. [Google Scholar]
  25. Macioszek, E.; Kurek, A. The Use of a Park and Ride System—A Case Study Based on the City of Cracow (Poland). Energies 2020, 13, 3473. [Google Scholar] [CrossRef]
  26. Hodgson, S.; Namdeo, A.; Araujo-Soares, V.; Pless-Mulloli, T. Towards an Interdisciplinary Science of Transport and Health: A Case Study on School Travel. J. Transp. Geogr. 2012, 21, 70–79. [Google Scholar] [CrossRef] [Green Version]
  27. Ammad, S.; Alaloul, W.S.; Saad, S.; Qureshi, A.H.; Sheikh, N.; Ali, M.; Altaf, M. Personal Protective Equipment In Construction, Accidents Involved In Construction Infrastructure Projects. Solid State Technol. 2020, 63, 4147–4159. [Google Scholar]
  28. Wee, B.V. The Traffic and Transport System and Effects on Accessibility, the Environment and Safety: An Introduction. In Transport System and Transport Policy; van Wee, B., Annema, J.A., Banister, D., Eds.; Edward Elgar Publishing: Cheltenham, UK, 2013; pp. 4–18. [Google Scholar]
  29. Mackett, R.L.; Thoreau, R. Transport, Social Exclusion and Health. J. Transp. Health 2015, 2, 610–617. [Google Scholar] [CrossRef]
  30. Memon, A.M.; Sutanto, M.H.; Napiah, M.; Yusoff, N.I.M.; Memon, R.A.; Al-Sabaeei, A.M.; Ali, M. Physicochemical, Rheological and Morphological Properties of Bitumen Incorporating Petroleum Sludge. Constr. Build. Mater. 2021, 297, 123738. [Google Scholar] [CrossRef]
  31. Zhang, J. Urban Forms and Health Promotion: An Evaluation Based on Health-Related QOL Indicators. In Proceedings of the 13th World Conference on Transportation Research, Rio de Janeiro, Brazil, 15–18 July 2013. [Google Scholar]
  32. Dharmowijoyo, D.B.; Susilo, Y.O.; Syabri, I. Time Use and Spatial Influence on Transport-Related Social Exclusion, and Mental and Social Health. Travel Behav. Soc. 2020, 21, 24–36. [Google Scholar] [CrossRef]
  33. Raglin, J.S. Exercise and Mental Health. Sports Med. 1990, 9, 323–329. [Google Scholar] [CrossRef]
  34. de Azevedo, A.R.G.; Marvila, M.T.; Ali, M.; Khan, M.I.; Masood, F.; Vieira, C.M.F. Effect of the Addition and Processing of Glass Polishing Waste on the Durability of Geopolymeric Mortars. Case Studies Constr. Mater. 2021, 15, e00662. [Google Scholar] [CrossRef]
  35. Dharmowijoyo, D.B.; Susilo, Y.O.; Karlström, A. Day-to-Day Interpersonal and Intrapersonal Variability of Individuals’ Activity Spaces in a Developing Country. Envir. Plan. B Plan. Des. 2014, 41, 1063–1076. [Google Scholar] [CrossRef]
  36. Barreto, E.D.; Stafanato, K.V.; Marvila, M.T.; de Azevedo, A.R.; Ali, M.; Pereira, R.M.; Monteiro, S.N. Clay Ceramic Waste as Pozzolan Constituent in Cement for Structural Concrete. Materials 2021, 14, 2917. [Google Scholar] [CrossRef]
  37. Krejcie, R.V.; Morgan, D.W. Determining Sample Size for Research Activities. Educ. Psychol. Meas. 1970, 30, 607–610. [Google Scholar] [CrossRef]
  38. Ali, M.; de Azevedo, A.R.G.; Marvila, M.T.; Khan, M.I.; Memon, A.M.; Masood, F.; Almahbashi, N.M.; Shad, M.K.; Khan, M.A.; Fediuk, R.; et al. The Influence of COVID-19-Induced Daily Activities on Health Parameters—A Case Study in Malaysia. Sustainability 2021, 13, 7465. [Google Scholar] [CrossRef]
  39. Tarigan, A.K.; Sagala, S.; Samsura, D.A.A.; Fiisabiilillah, D.F.; Simarmata, H.A.; Nababan, M. Bandung City, Indonesia. Cities 2016, 50, 100–110. [Google Scholar] [CrossRef]
  40. Tarigan, A.K.; Susilo, Y.O.; Joewono, T.B. Segmentation of Paratransit Users Based on Service Quality and Travel Behaviour in Bandung, Indonesia. Transp. Plan. Technol. 2014, 37, 200–218. [Google Scholar] [CrossRef]
  41. Ali, M.; Abbas, S.; Salah, B.; Akhter, J.; Saleem, W.; Haruna, S.; Room, S.; Abdulkadir, I. Investigating Optimal Confinement Behaviour of Low-Strength Concrete through Quantitative and Analytical Approaches. Materials 2021, 14, 4675. [Google Scholar] [CrossRef]
  42. Lwanga, S.K.; Lemeshow, S. Sample Size Determination in Health Studies: A Practical Manual; World Health Organization: Geneva, Switzerland, 1991; Available online: https://apps.who.int/iris/handle/10665/40062 (accessed on 26 October 2021).
  43. Ali, M.; Room, S.; Khan, M.I.; Masood, F.; Ali Memon, R.; Khan, R.; Memon, A.M. Assessment of Local Earthen Bricks in Perspective of Physical and Mechanical Properties Using Geographical Information System in Peshawar, Pakistan. In Structures; Elsevier: London, UK, 2020; Volume 28, pp. 2549–2561. [Google Scholar] [CrossRef]
  44. Axhausen, K.W.; Zimmermann, A.; Schönfelder, S.; Rindsfüser, G.; Haupt, T. Observing the Rhythms of Daily Life: A Six-Week Travel Diary. Transportation 2002, 29, 95–124. [Google Scholar] [CrossRef]
  45. Akar, G.; Clifton, K.J.; Doherty, S.T. Discretionary Activity Location Choice: In-Home or Out-of-Home? Transportation 2011, 38, 101–122. [Google Scholar] [CrossRef]
  46. Suzukamo, Y.; Fukuhara, S.; Green, J.; Kosinski, M.; Gandek, B.; Ware, J.E. Validation Testing of a Three-Component Model of Short Form-36 Scores. J. Clin. Epidemiol. 2011, 64, 301–308. [Google Scholar] [CrossRef] [PubMed]
  47. Ali, M.; Abbas, S.; Khan, M.I.; Gad, M.A.; Ammad, S.; Khan, A. Experimental Validation of Mander’s Model for Low Strength Confined Concrete Under Axial Compression. In 2020 Second International Sustainability and Resilience Conference: Technology and Innovation in Building Designs(51154), Proceedings of the 2020 Second International Sustainability and Resilience Conference, Sakheer, Bahrain, 11–12 November 2020; IEEE: Piscataway, NJ, USA, 2021. [Google Scholar] [CrossRef]
  48. DiStefano, C.; Zhu, M.; Mindrila, D. Understanding and Using Factor Scores: Considerations for the Applied Researcher. Pract. Assess. Res. Eval. 2009, 14, 20. [Google Scholar] [CrossRef]
  49. Yong, A.G.; Pearce, S. A Beginner’s Guide to Factor Analysis: Focusing on Exploratory Factor Analysis. Tutor. Quant. Methods Psychol. 2013, 9, 79–94. [Google Scholar] [CrossRef]
  50. Baiocchi, M.; Cheng, J.; Small, D.S. Instrumental Variable Methods for Causal Inference. Stat. Med. 2014, 33, 2297–2340. [Google Scholar] [CrossRef] [Green Version]
  51. Rhodes, R.E.; Blanchard, C.M.; Blacklock, R.E. Do Physical Activity Beliefs Differ by Age and Gender? J. Sport Exerc. Psychol. 2008, 30, 412–423. [Google Scholar] [CrossRef]
  52. Azevedo, M.R.; Araújo, C.L.P.; Reichert, F.F.; Siqueira, F.V.; da Silva, M.C.; Hallal, P.C. Gender Differences in Leisure-Time Physical Activity. Int. J. Public Health 2007, 52, 8. [Google Scholar] [CrossRef] [Green Version]
  53. Mueller, N.; Rojas-Rueda, D.; Cole-Hunter, T.; De Nazelle, A.; Dons, E.; Gerike, R.; Goetschi, T.; Panis, L.I.; Kahlmeier, S.; Nieuwenhuijsen, M. Health Impact Assessment of Active Transportation: A Systematic Review. Prev. Med. 2015, 76, 103–114. [Google Scholar] [CrossRef]
  54. De Hartog, J.J.; Boogaard, H.; Nijland, H.; Hoek, G. Do the Health Benefits of Cycling Outweigh the Risks? Environ. Health Perspect. 2010, 118, 1109–1116. [Google Scholar] [CrossRef] [PubMed]
  55. Ettema, D.; Verschuren, L. Multitasking and Value of Travel Time Savings. Transp. Res. Rec. 2007, 2010, 19–25. [Google Scholar] [CrossRef]
  56. Kang, H.; Scott, D.M. Exploring Day-to-Day Variability in Time Use for Household Members. Transp. Res. A Policy Pract. 2010, 44, 609–619. [Google Scholar] [CrossRef]
  57. Novaco, R.W.; Gonzalez, O.I. Commuting and Well-Being. In Technology and Well-Being; Cambridge University Press: Cambridge, UK, 2009; pp. 174–205. [Google Scholar]
  58. DiPietro, L. Physical Activity in Aging: Changes in Patterns and Their Relationship to Health and Function. J. Gerontol. Ser. A 2001, 56, 13–22. [Google Scholar] [CrossRef]
  59. Roberts, R.; Golding, J.; Towell, T.; Reid, S.; Woodford, S.; Vetere, A.; Weinreb, I. Mental and Physical Health in Students: The Role of Economic Circumstances. Br. J. Health Psychol. 2000, 5, 289–297. [Google Scholar] [CrossRef]
  60. Lum, T.Y.; Lightfoot, E. The Effects of Volunteering on the Physical and Mental Health of Older People. Res. Aging 2005, 27, 31–55. [Google Scholar] [CrossRef]
  61. Renalds, A.; Smith, T.H.; Hale, P.J. A Systematic Review of Built Environmenta Health. Fam. Community Health 2010, 33, 68–78. [Google Scholar] [CrossRef]
  62. Pappalardo, G.; Cafiso, S.; Di Graziano, A.; Severino, A. Decision Tree Method to Analyze the Performance of Lane Support Systems. Sustainability 2021, 13, 846. [Google Scholar] [CrossRef]
Figure 1. The conceptual model for the association among travel behaviour and health [11].
Sustainability 13 12226 g001
Figure 2. A measurement model and factor loadings of observed variables used to estimate physical health.
Sustainability 13 12226 g002
Figure 3. A measurement model and factor loadings of observed variables used to estimate social health.
Sustainability 13 12226 g003
Figure 4. Duration S-IPA and M-IPA at the socio-demographic level.
Sustainability 13 12226 g004
Figure 5. Daily time-use for different S-IPA on a given day in weeks.
Sustainability 13 12226 g005
Figure 6. Daily time-use for different modes of transport and S-IPA on a given day in weeks.
Sustainability 13 12226 g006
Figure 7. Daily time-use for different M-IPA on a given day in weeks.
Sustainability 13 12226 g007
Figure 8. Daily time-use for different transport modes and M-IPA on a given day in weeks.
Sustainability 13 12226 g008
Figure 9. Daily time-use and activity-travel pattern on physical health.
Sustainability 13 12226 g009
Figure 10. Daily time-use and activity-travel pattern on social health.
Sustainability 13 12226 g010
Figure 11. Socio-demographic variables with the intensity of physical activity and health parameters.
Sustainability 13 12226 g011
Figure 12. Health parameters score with various socio-demographic variables.
Sustainability 13 12226 g012
Figure 13. The proposed model (dependent and independent variables may be nested by an individual (i), household (h), and activity (t). S, B, Act. Trip, Travel, Social, shows symbol of independent variables as used in the Formulas (3)–(6).
Sustainability 13 12226 g013
Table 1. Description of the respondents (N = 508).
VariablesPercentage or Mean
Socio-demographic characteristic at individual level
Male53.54%
Female46.45%
Worker40.0%
Non-worker26.5%
Student32.0%
Dependent Children (<15 years)18.66%
Age below 22–15 (Years old)18.34%
Age below 44–23 (Years old)42.50%
Age below 55–45 (Years old)11.70%
Age above 55 years old9.50%
Medium household income (3–6 IDR)91.5%
High household income (>6 million)8.5%
Household Characteristics
Number of members in a household4.20
Dependent children per household0.45
Number of the motorized vehicle per household1.073
Trip engagement and travel time spend on weekdays (weekends)
Number of trips2.52 (2.29)
Trip chains1.20 (1.08)
Travel time by a motorized mode (%)45.59%
Travel time by Non-motorized mode (%)29.31%
Travel time by public transport (%)11.62%
Total travel time (minutes)98.29
Intensity of a physical activity
Days perform strenuous-intensity physical activity (S-IPA) (Frequency)4.5
Minutes/day to perform (S-IPA) (duration)52.54
Days perform moderate-intensity physical activity (M-IPA) (Frequency)4.83
Minutes/day to perform (M-IPA) (duration)56.21
Low-intensity physical activity58.2%
Medium intensity physical activity32.2%
High-intensity physical activity9.6%
Time spend on a different set of activities on weekdays (weekends)
Time spend on in-home mandatory activities (minutes)659.91 (704.92)
Time spend on in-home maintenance activities (minutes)105.29 (143.39)
Time spend on in-home leisure activities (minutes)247.04 (291.14)
Time spend on out-of-home mandatory activities (minutes)300 (164)
Time spend for out-of -home maintenance/grocery activities (minutes)21.26 (29.62)
Time spend on out-of-home leisure activities (minutes)25.43 (35.65)
Perceived accessibility variables
Public transport lanes passing through respondents location (number)2.470
Travel time to CBD (minutes)30.68
Travel time to a government office (minutes)15.96
Travel time to shopping centers (minutes)15.40
Travel time to grocery shop (minutes)7.60
Travel time to park (minutes)17.88
Travel time to Bus stop (minutes)14.14
Built environment variables
Government office and settlement area density per square-km0.0020 & 0.4512
Industry and trade center area density per square-km0.0032 & 0.0046
Road and railway per square-km34.46 & 4.493
Social, Political and family participations within a family
Number of days individual spend in social activities (Days)3.45
Minutes per day individual spend time to do social activities (minutes)49.43
Number of days individual spend in social activities with other family members (Days)6.33
Minutes per day individual spend time to do social activities with other family members (minutes)96.56
The italic text shows the survey variables in the table.
Table 2. Model classification for activity criteria.
Activity CriteriaMandatoryMaintenanceLeisure
In-HomeOut-of-HomeIn-HomeOut-of-HomeIn-HomeOut-of-Home
Sleeping
Personalcare
Eating and drinking at home
Indoor working activities
Outdoor working activities
Indoor School activities
Eating and drinking
Dropping/Pick up children or others
Out-of-home sleeping
Household activities
Babysitting activities
Sales activities
Shopping activities
Out-of-home maintenance
Waiting for public transport
Relaxing activities
Social, family activities
Out-of-home social
Outdoor school
Organization/Volunteer/Political activities
Sports activities
Holiday
Other out of home
Table 3. Model estimation result for the M-IPA and S-IPA, and physical and social health (only significant variables with a p-value < 0.05 and estimated parameters of standardized variables are shown).
VariablesModerate Activity (Job)Strenuous Activity (Job)Physical HealthSocial Health
CoeffT-stattCoeffT-stattCoeffT-stattCoeffT-statt
Constant117.515.4776.8211.29−2.01−3.76−0.79−3.76
Socio-demographic characteristic
Male0.0737.2880.0535.2430.0665.336
WorkerRefRefRefRefRefRefRefRef
Non-worker−0.025−2.29−0.04−3.840.0573.7510.1298.342
Student0.0312.408−0.13−10.100.3255.5720.2784.720
Dependent Children (<15 years)--0.0958.571−0.12−3.15−0.10−2.66
Age 15–22 (Years old)0.2436.7740.1032.8110.2385.385−0.14−3.16
Age 23–44 (Years old)0.3197.5790.1984.6050.1132.253−0.37−7.40
Age 45–55 (Years old)0.2458.1080.0591.9410.2455.000−0.13−2.67
Older than 55 years0.1044.110----−0.12−3.31
Medium household income (3–6 IDR)--------
High household income (>6 million)RefRefRefRefRefRefRefRef
Household Characteristics
Number of household members−0.123−11.3−0.198−17.800.1763.4480.1142.219
Number of dependent children per household--0.0958.571--−0.10−2.66
Number of the motorized vehicle per household--------
Trip engagement and travel time
Number of trips0.36816.510.37916.62−0.36−4.91−0.51−6.88
Number of trip chains−0.26−12.3−0.293−13.300.3185.1830.4126.657
Percentage of travel time using motorised mode−0.055−0.05−0.07−4.43--0.0642.610
Percentage of travel time using Non-motorized mode--------
Percentage of travel time using public transport−0.03−4.41−0.057−4.7190.0884.4800.0904.508
Total travel time (minutes) 0.0494.082−0.05−2.45--
Time spend for different set of activities on weekdays (weekends)
Time spend for in-home mandatory activities----−0.03−3.11--
Time spend for in-home maintenance activities0.0292.6880.0322.843−0.04−3.47−0.03−2.62
Time spend for in-home leisure activities----0.1074.4980.0642.652
Time spend for out-of-home mandatory activities------
Time spend for out-of -home maintenance activities0.0424.648−0.028−3.047−0.09−9.50−0.14−14.9
Time spend for out-of-home leisure activities0.0454.8740.0181.916−0.08−8.50−0.10−10.1
Perceived accessibility variables
Number of public transport lanes passing respondents−0.019−2.04--−0.05−4.79−0.03−3.01
Travel time to CBD−0.163−13.30.0322.563−0.17−3.37--
Travel time to government office−0.11−9.61−0.133−11.14--−0.10−3.40
Travel time to shopping centres0.0464.363−0.028−2.5790.1887.5580.26310.48
Travel time to grocery shop−0.181−15.8−0.025−2.203−0.19−5.36−0.12−3.41
Travel time to park0.1088.2370.1239.189−0.09−3.45--
Travel time to Bus stop0.0847.438−0.103−8.9430.5038.3850.3676.069
Built environment variables
Density of government office/km2 within respondent--0.1906.321−0.48−6.21−0.29−3.74
Density of settlement area/km2 within the respondent−0.05−4.18−0.16−11.380.3356.4240.2645.008
Density of trade center/km2 within respondent location−0.12−12.8−0.134−13.60.34912.630.31711.39
Density of industrial area/km2 within the respondent--−0.16−5.370.4716.8470.2583.720
Km-length of road/km2 within the respondent location−0.16−13.9--−0.22−5.54−0.19−4.78
Km-length of railway/km2 within respondent location−0.07−8.240.0242.522----
Social, Political and family participations within family
How many days within a week individual spend in social activities--0.0869.053−0.15−4.74−0.09−2.87
How long in a day individual spend time to do social activities−0.06−7.19−0.05−5.440.0743.7050.0472.356
How many days in week individual spend in social activities with other families−0.17−18.3--−0.24−5.41−0.13−3.02
How long in a day individual spend time to do social activities with other families−0.08−8.49−0.03−3.450.0755.0970.0362.425
Endogenous of M-IPA--−0.52−4.69−0.23−2.09
Endogenous of S-IPA--0.8895.1800.7034.061
Error term7.5906.8040.2290.231
F74.2359.5175.6769.51
R-Square0.2140.2090.2170.203
SD39393939
Note: negative coefficient indicates low S-IPA and M-IPA and physical and social health problem.
Publisher’s Note: MDPI stays neutral with regard to jurisdictional claims in published maps and institutional affiliations.

