
Analysis of the Sustainability of Livestock Farms in the Area of the Southwest of Bihor County to Climate Change

Abstract
:1. Introduction
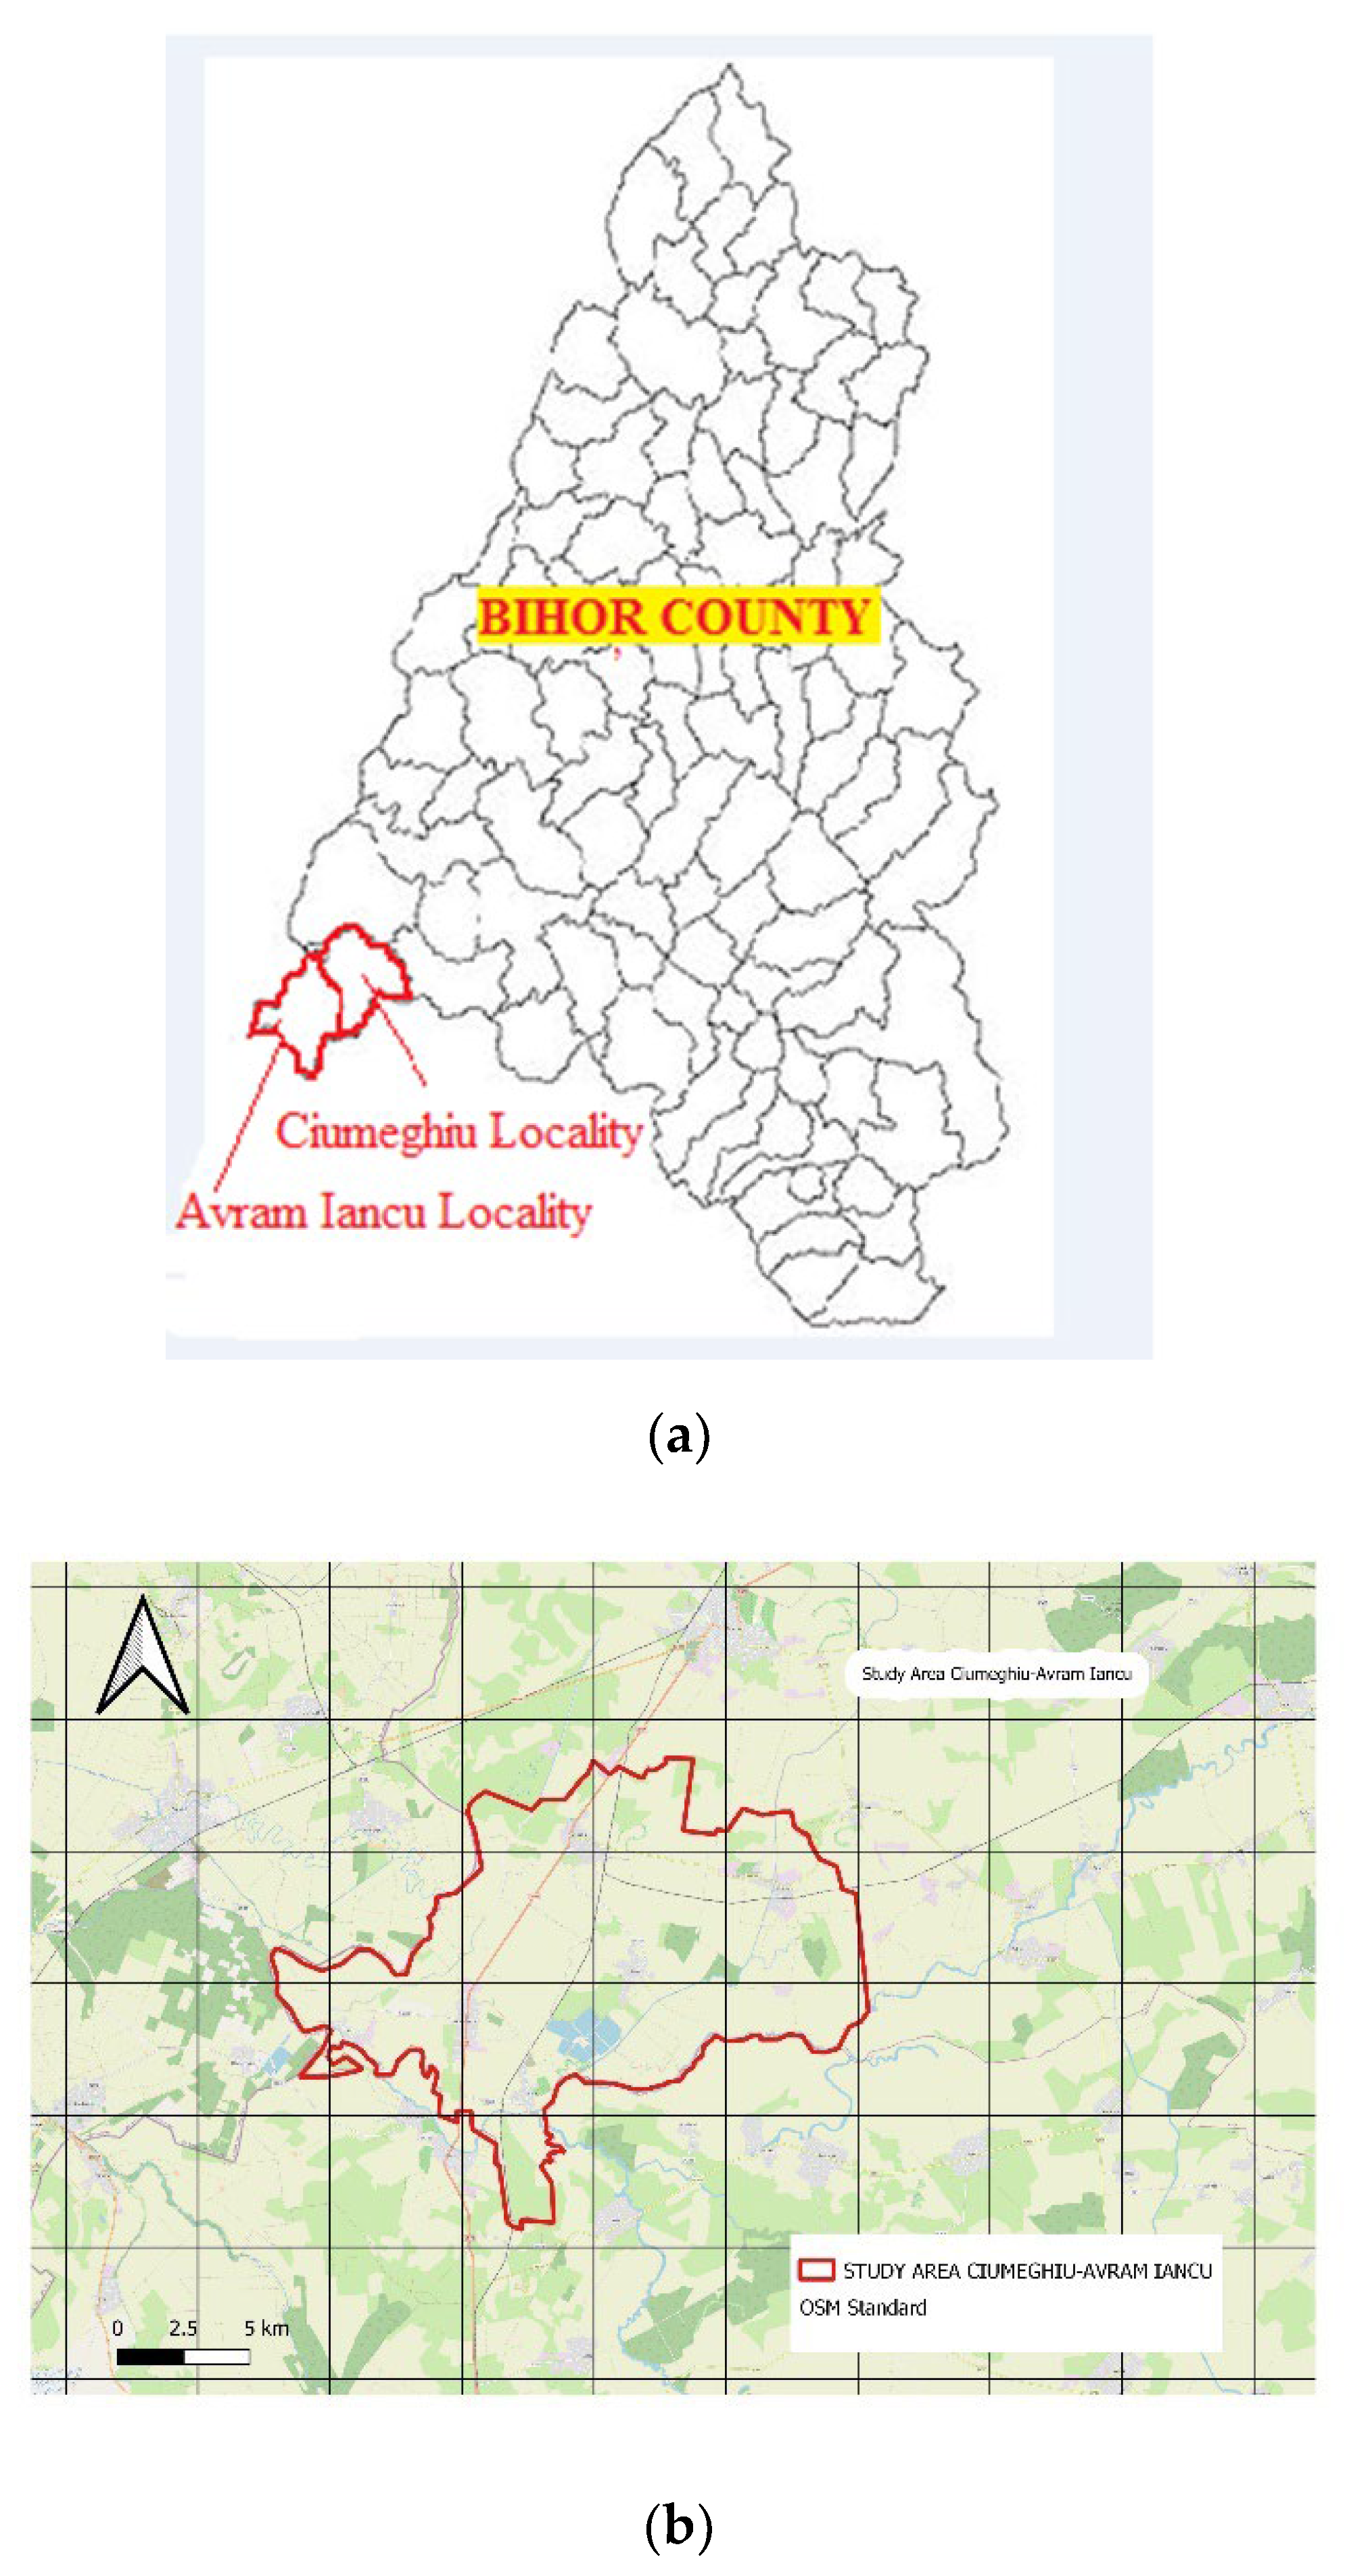
2. Materials and Methods
- Identifying the sensitivity of animal husbandry activity from a climatic point of view;
- Assessment of the exposure of livestock farms in the study area;
- Vulnerability analysis of zootechnical activities;
- Assessing the risk of animal husbandry to climate change.
- Sensitivity analysis
- High sensitivity: climate variables have a significant impact on inputs, outputs, farm production processes and transport networks;
- Medium sensitivity: climate variables have a moderate impact on inputs, outputs, farm production processes and transport networks;
- Low sensitivity: climate variables have a minimal impact on inputs, outputs, farm production processes and transport networks;
- Without sensitivity: climate variables have no impact on inputs, outputs, farm production processes and transport networks.
- b.
- Assessment of exposure
- c.
- Vulnerability analysis of zootechnical activities;
- d.
- Assessing the risk to animal husbandry posed by climate change.
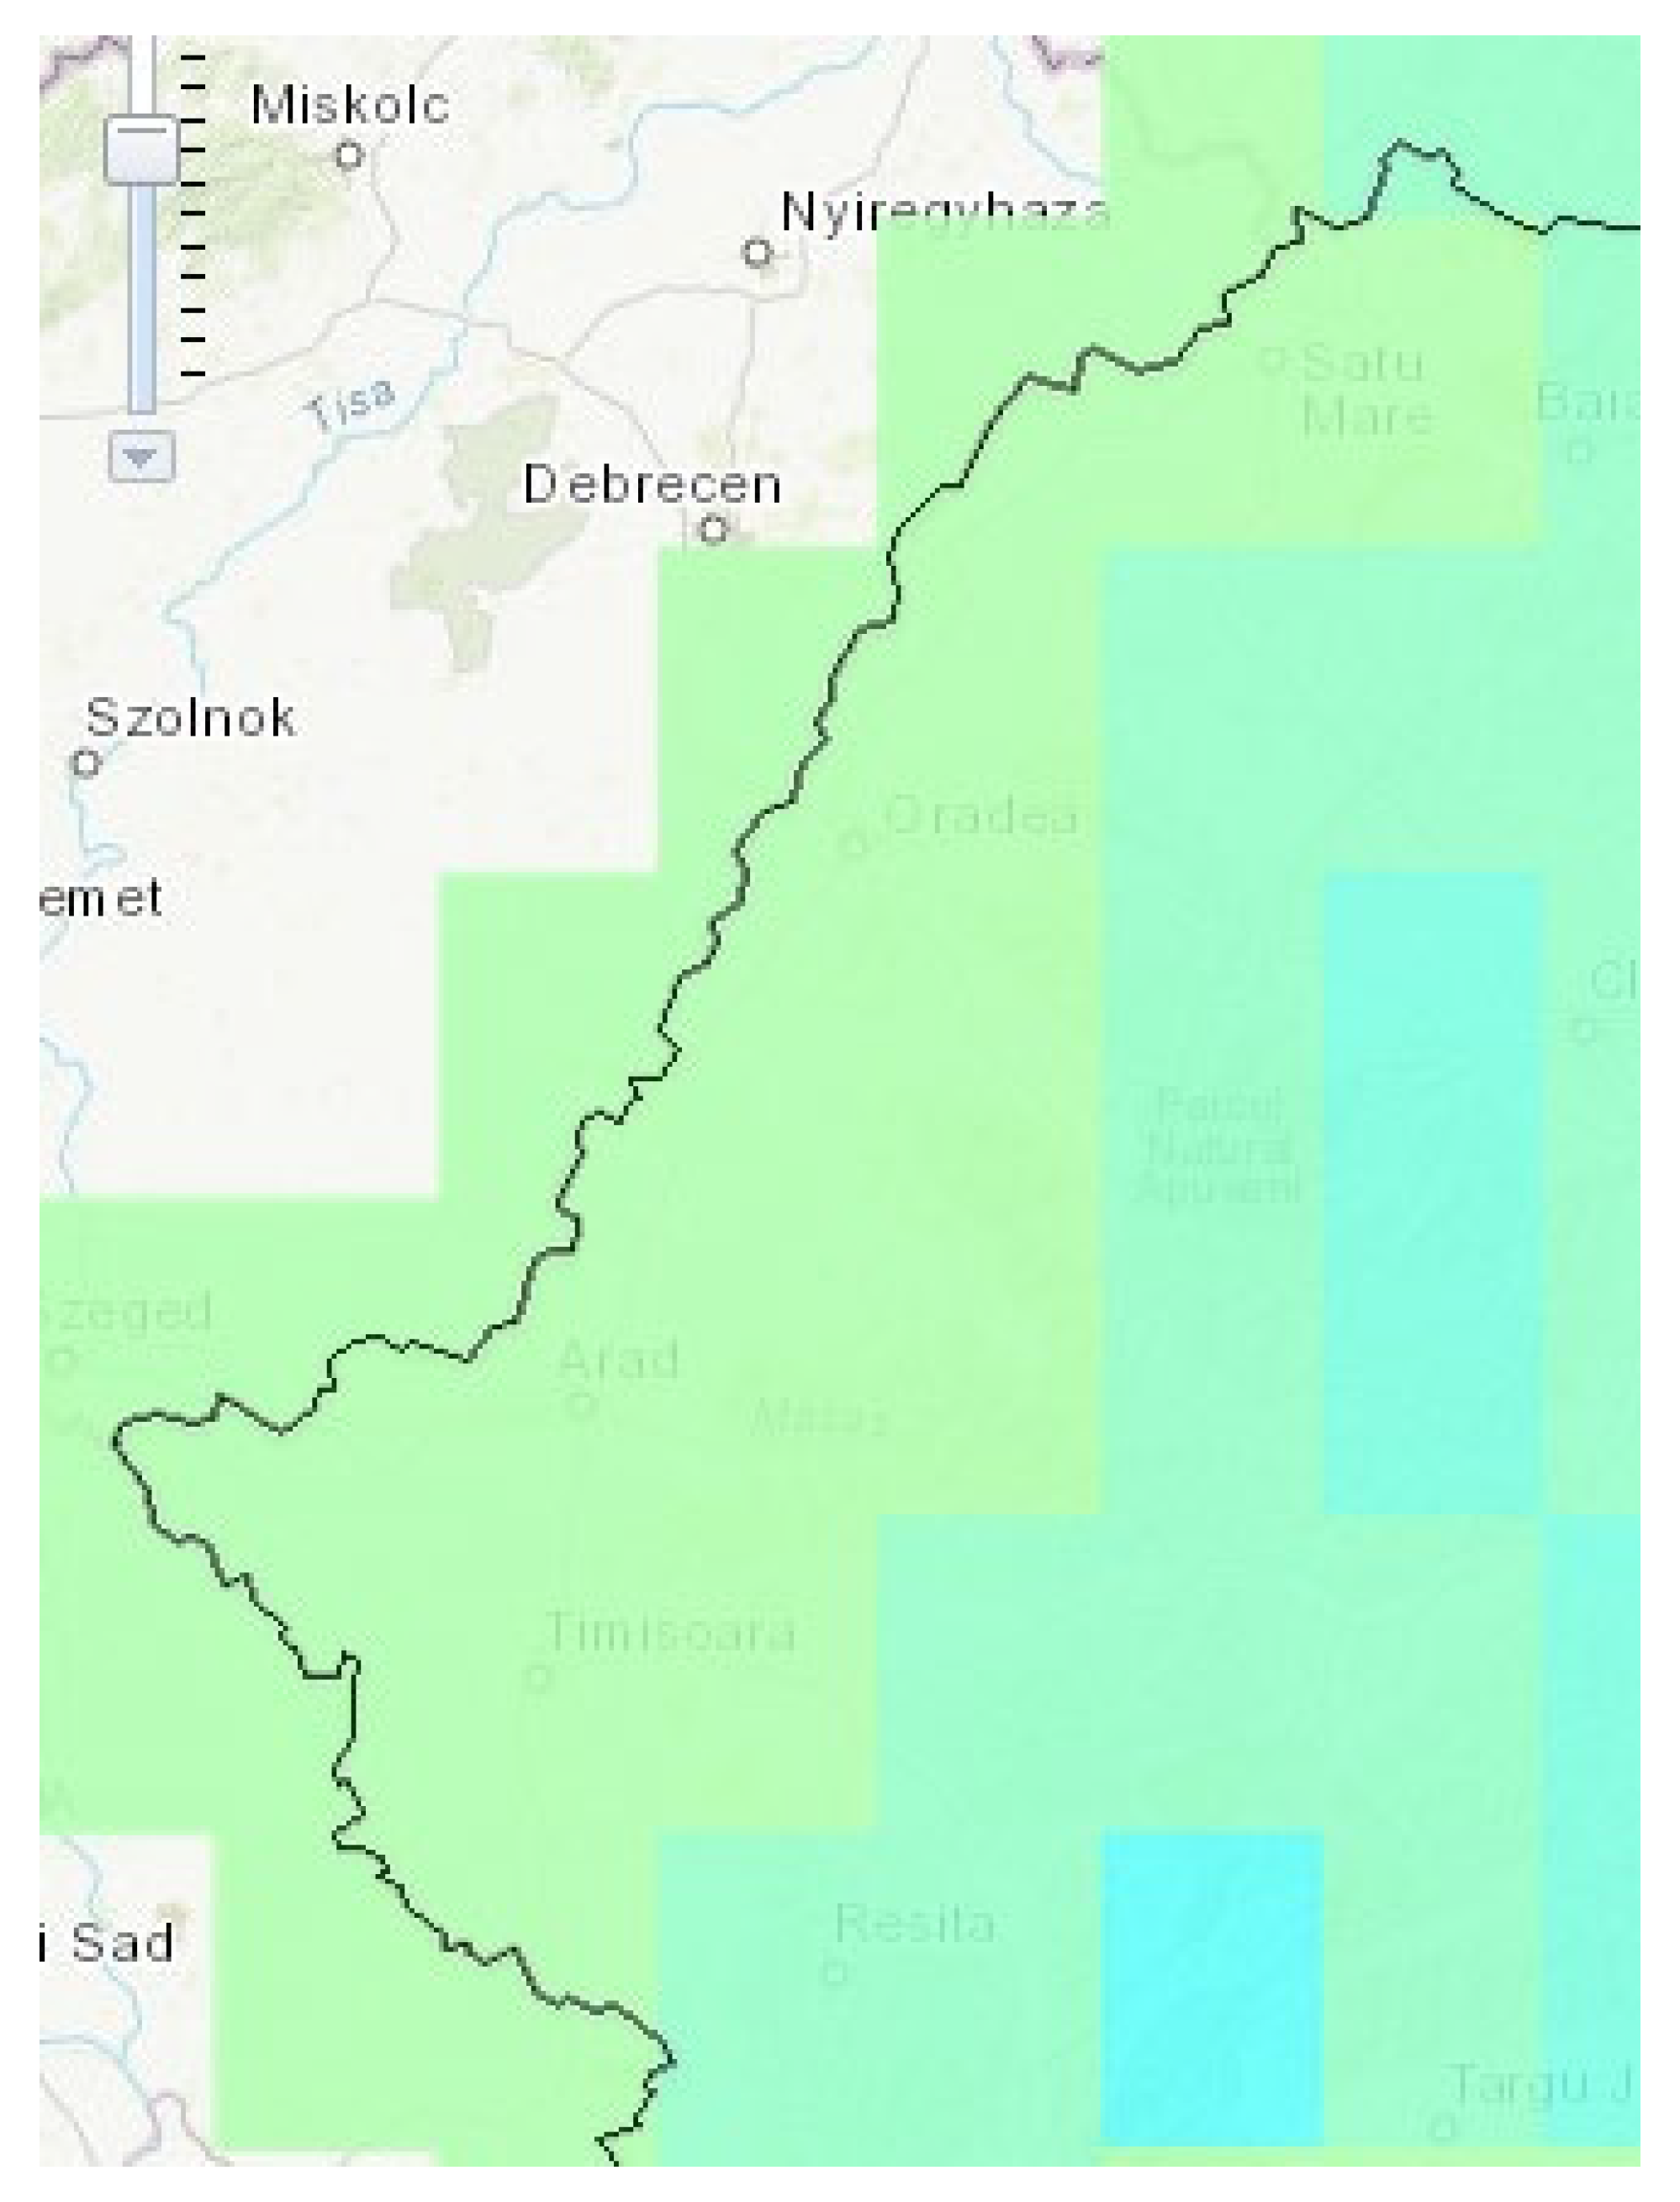
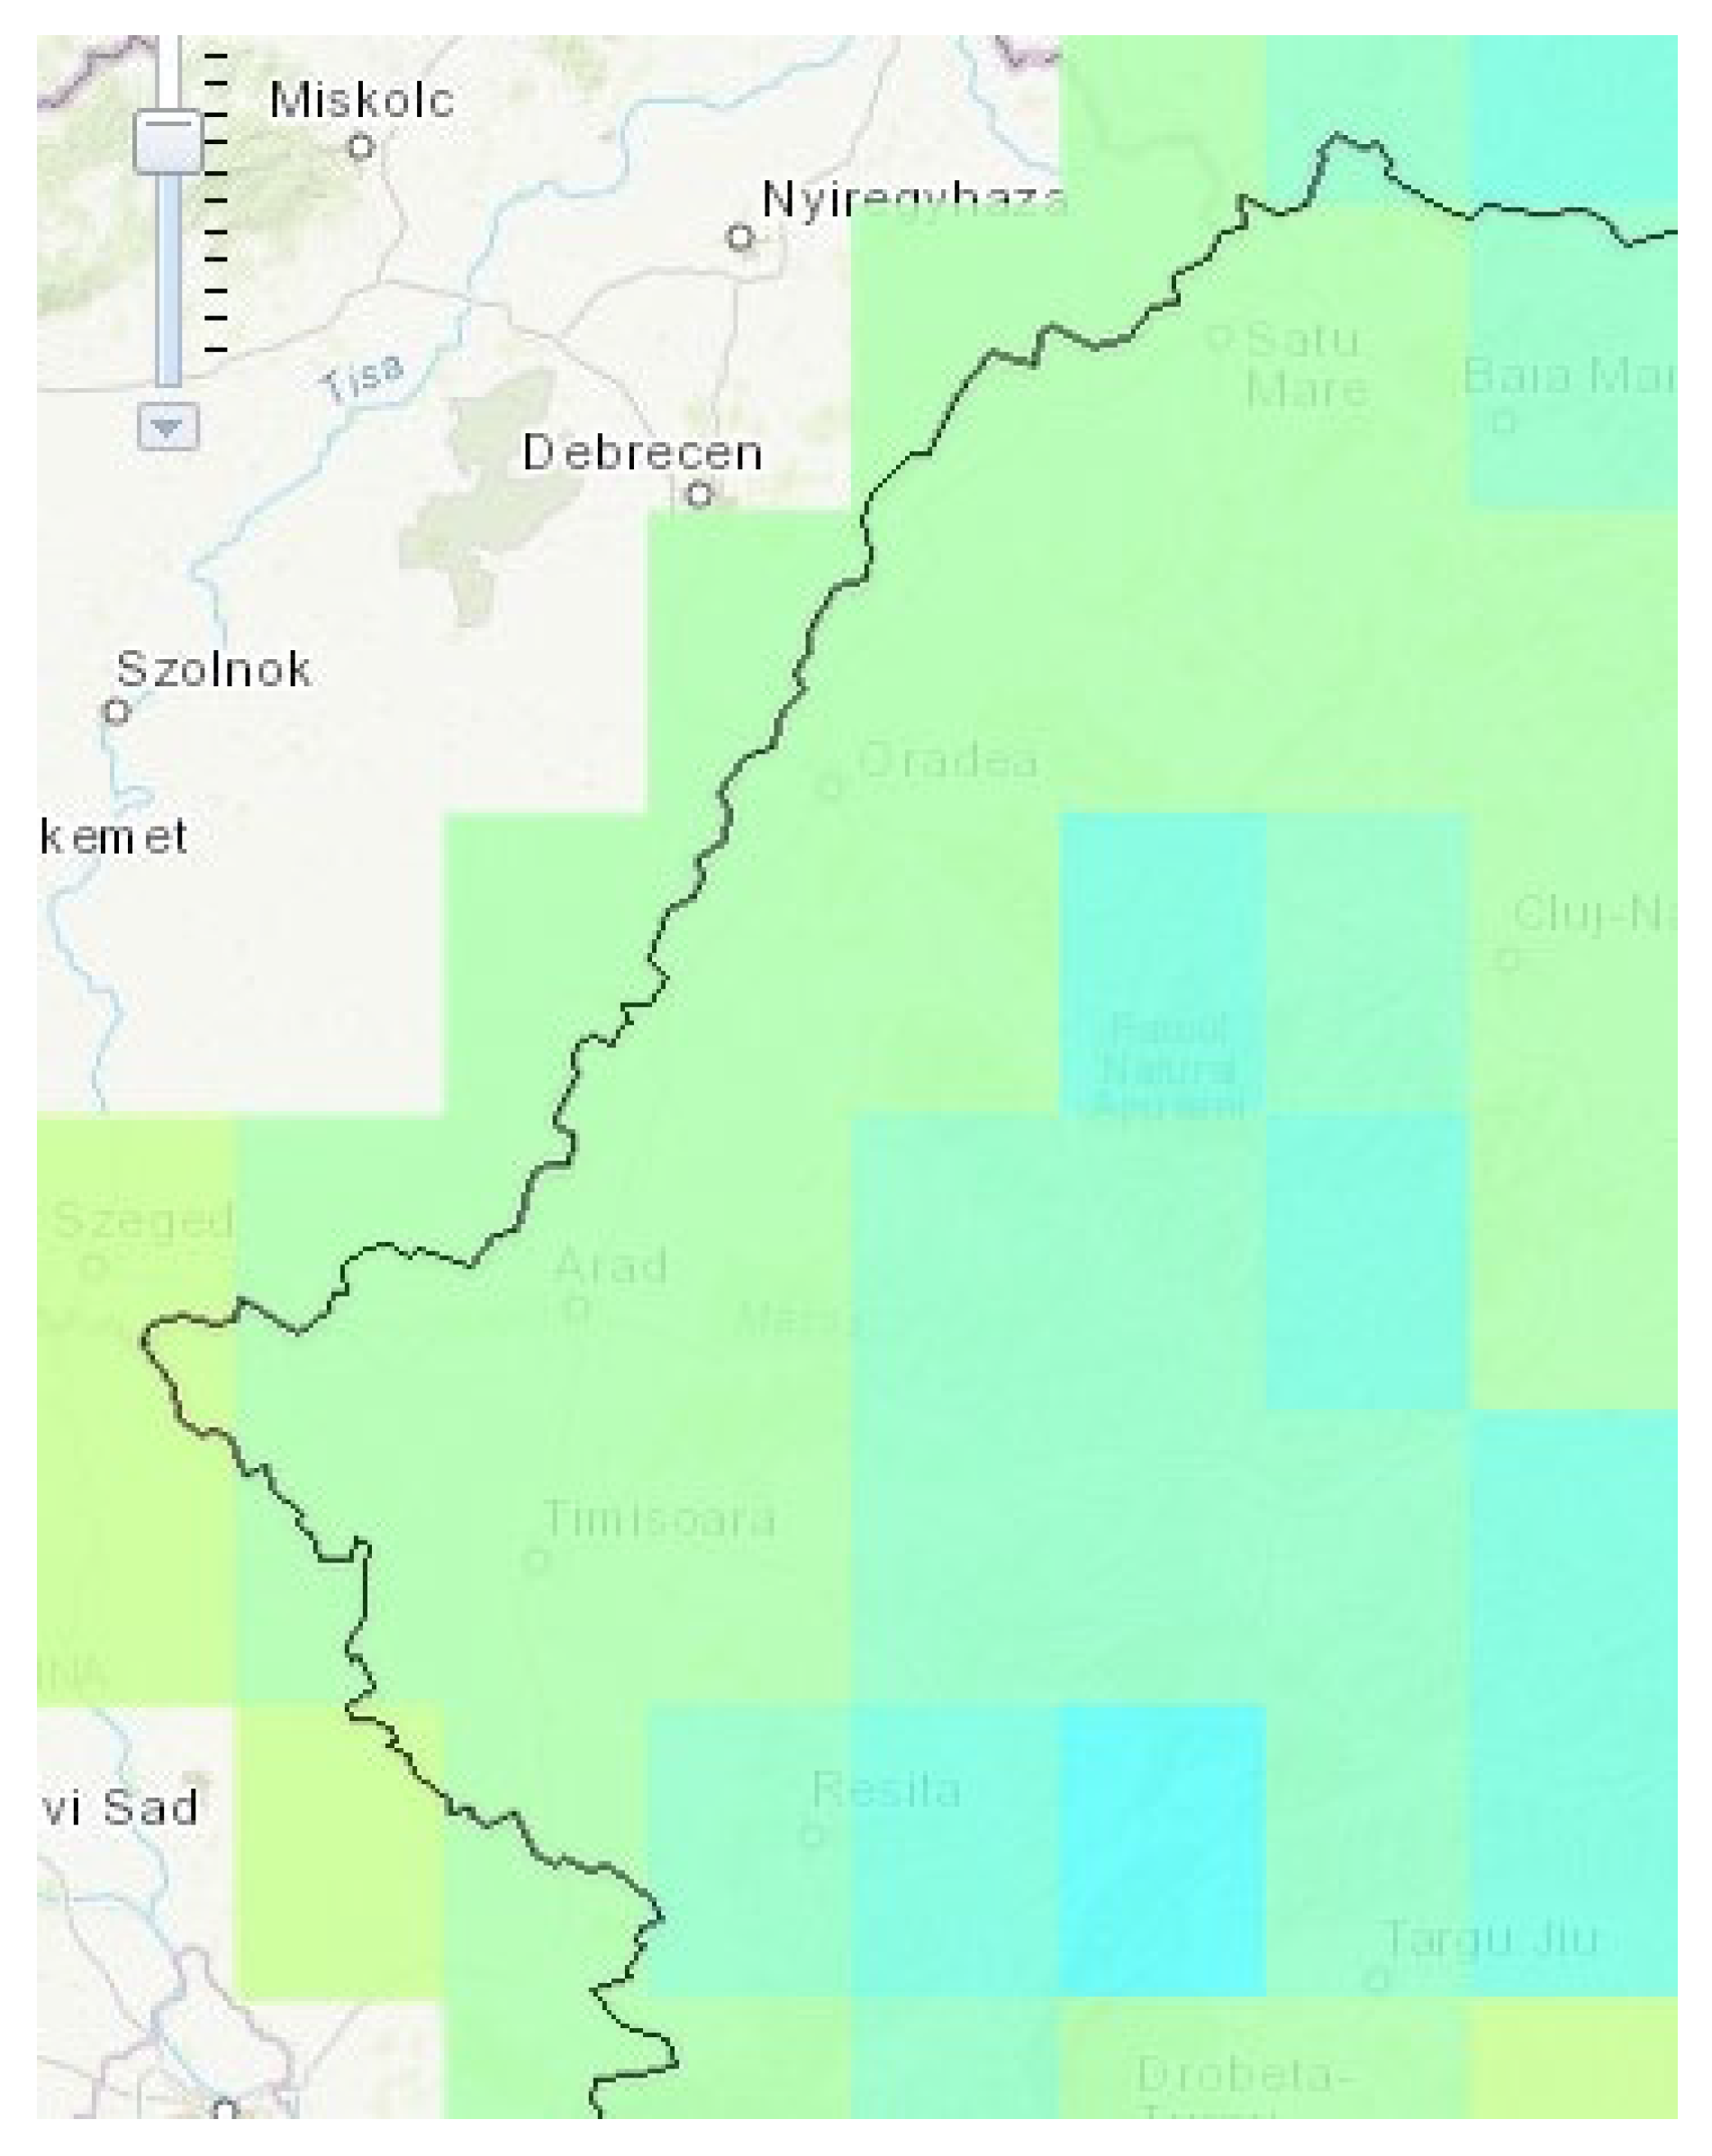
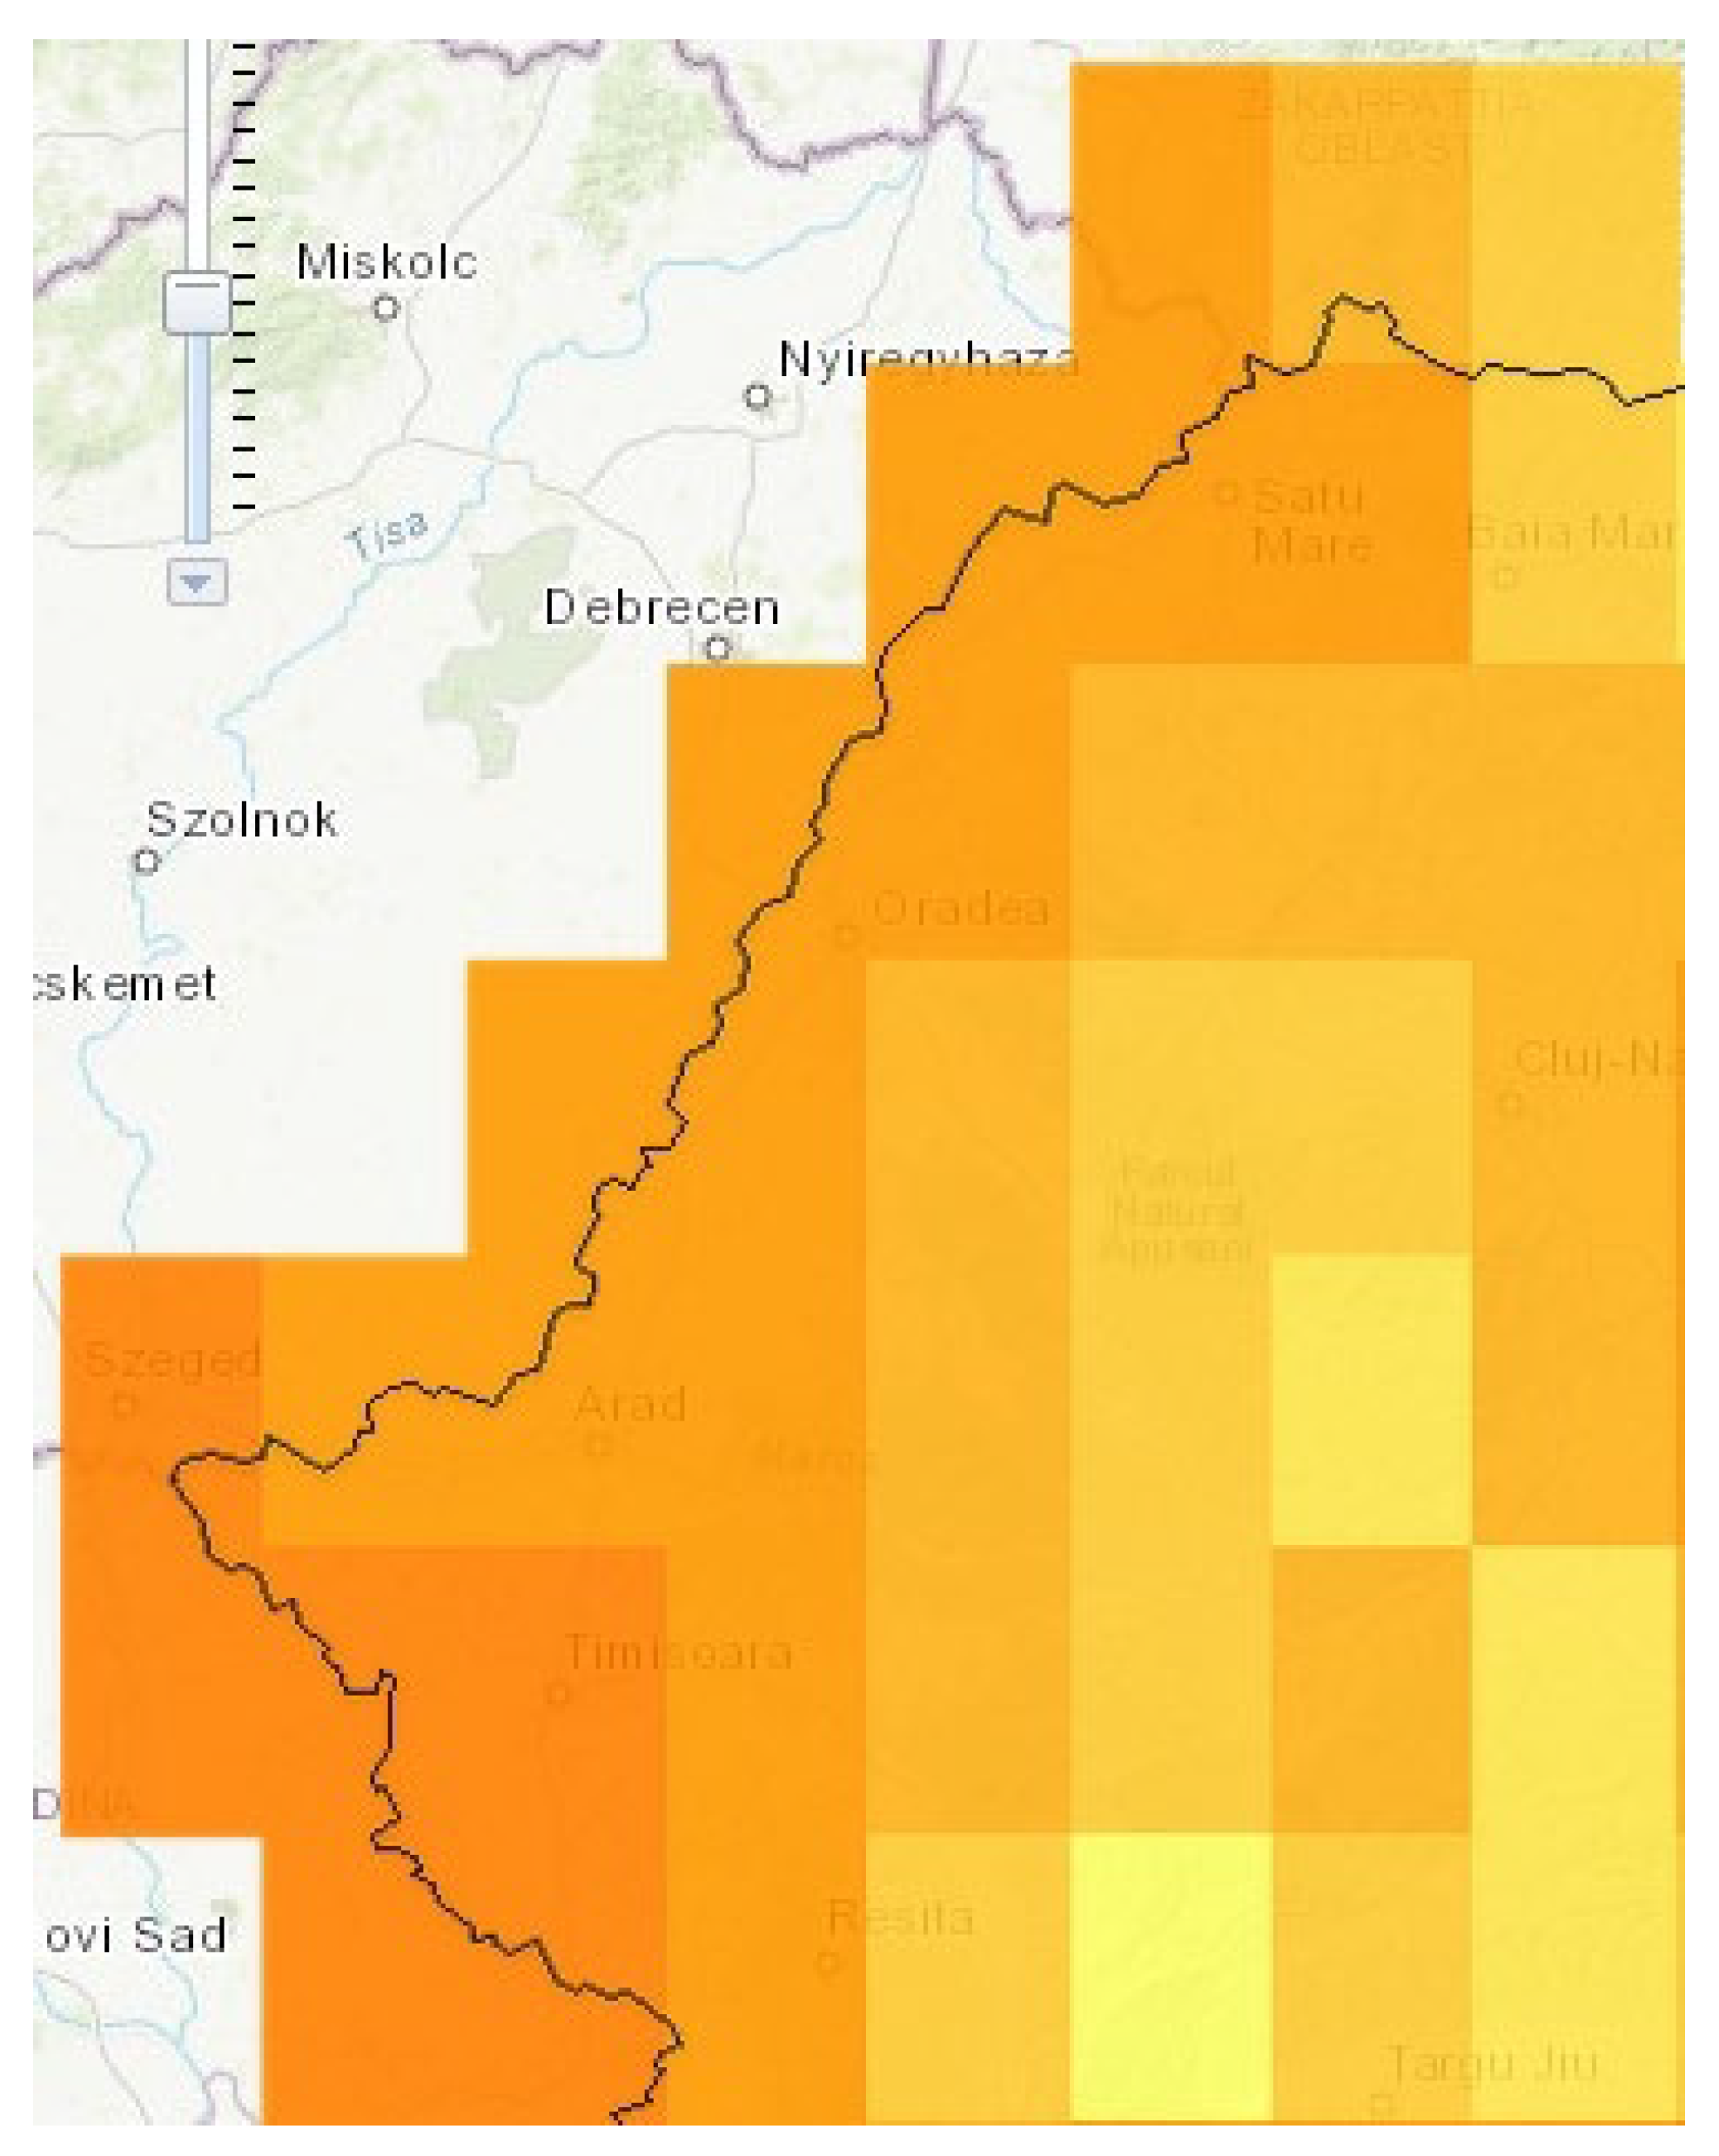
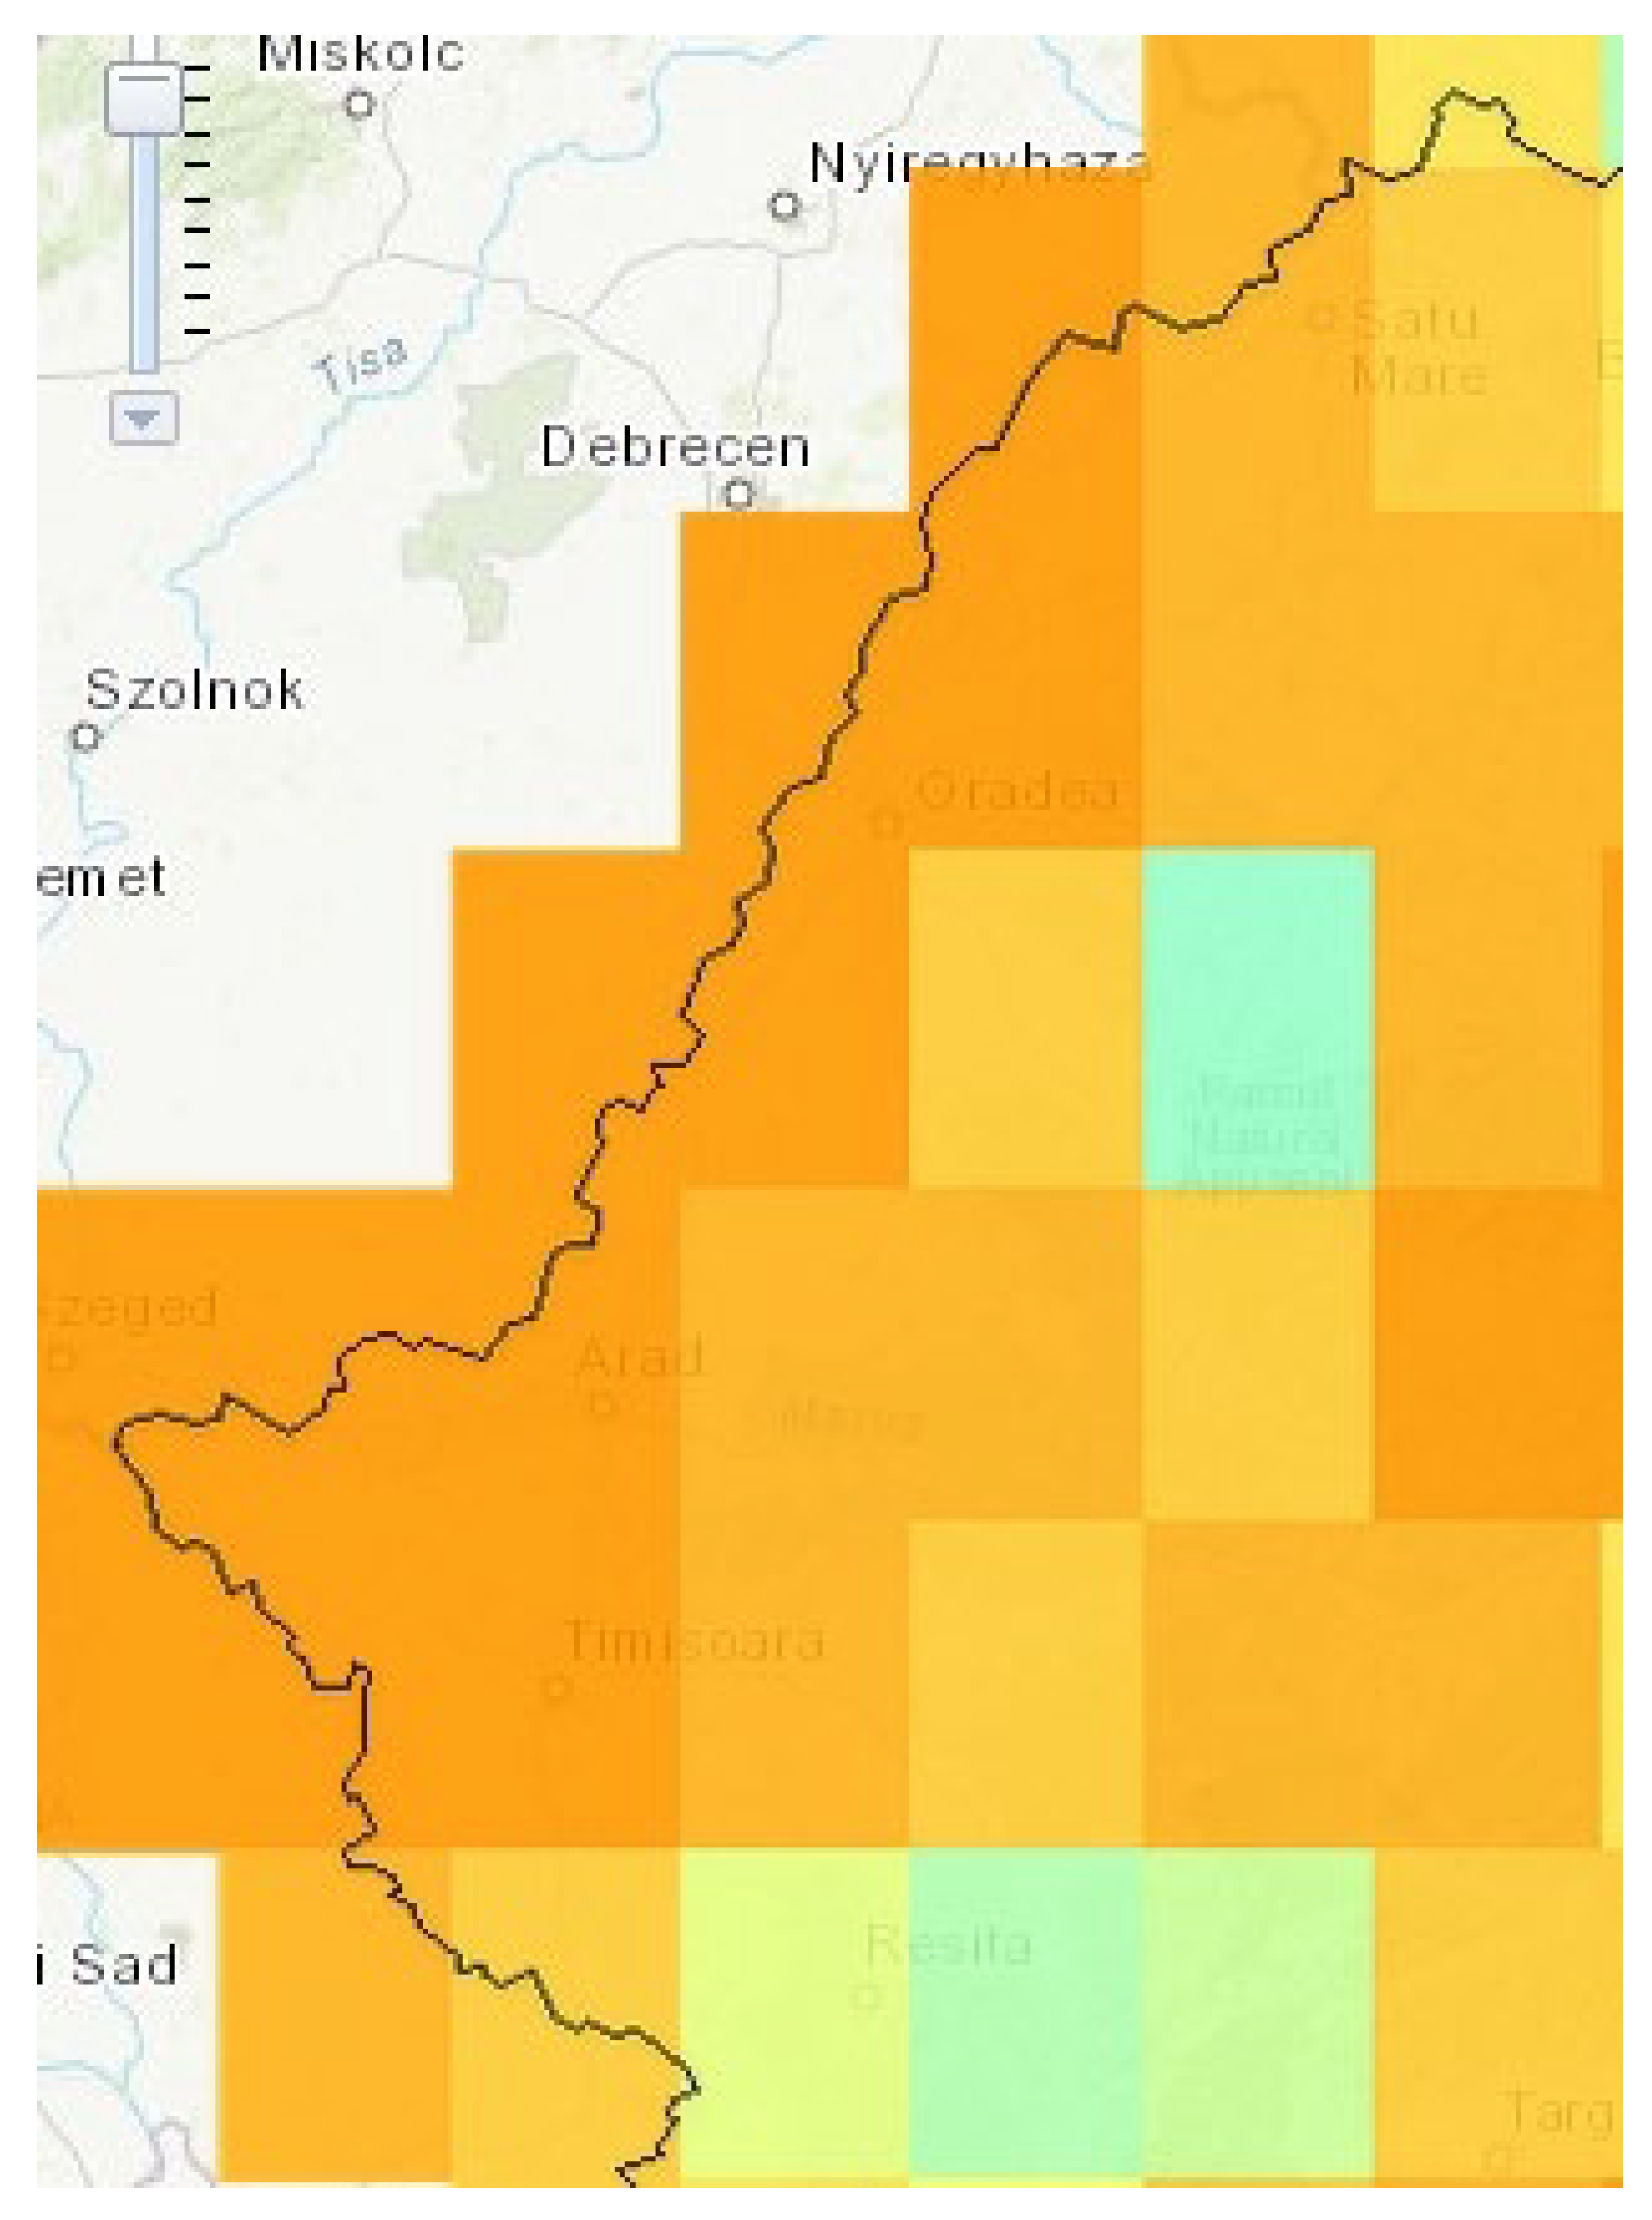
2.1. Temperature
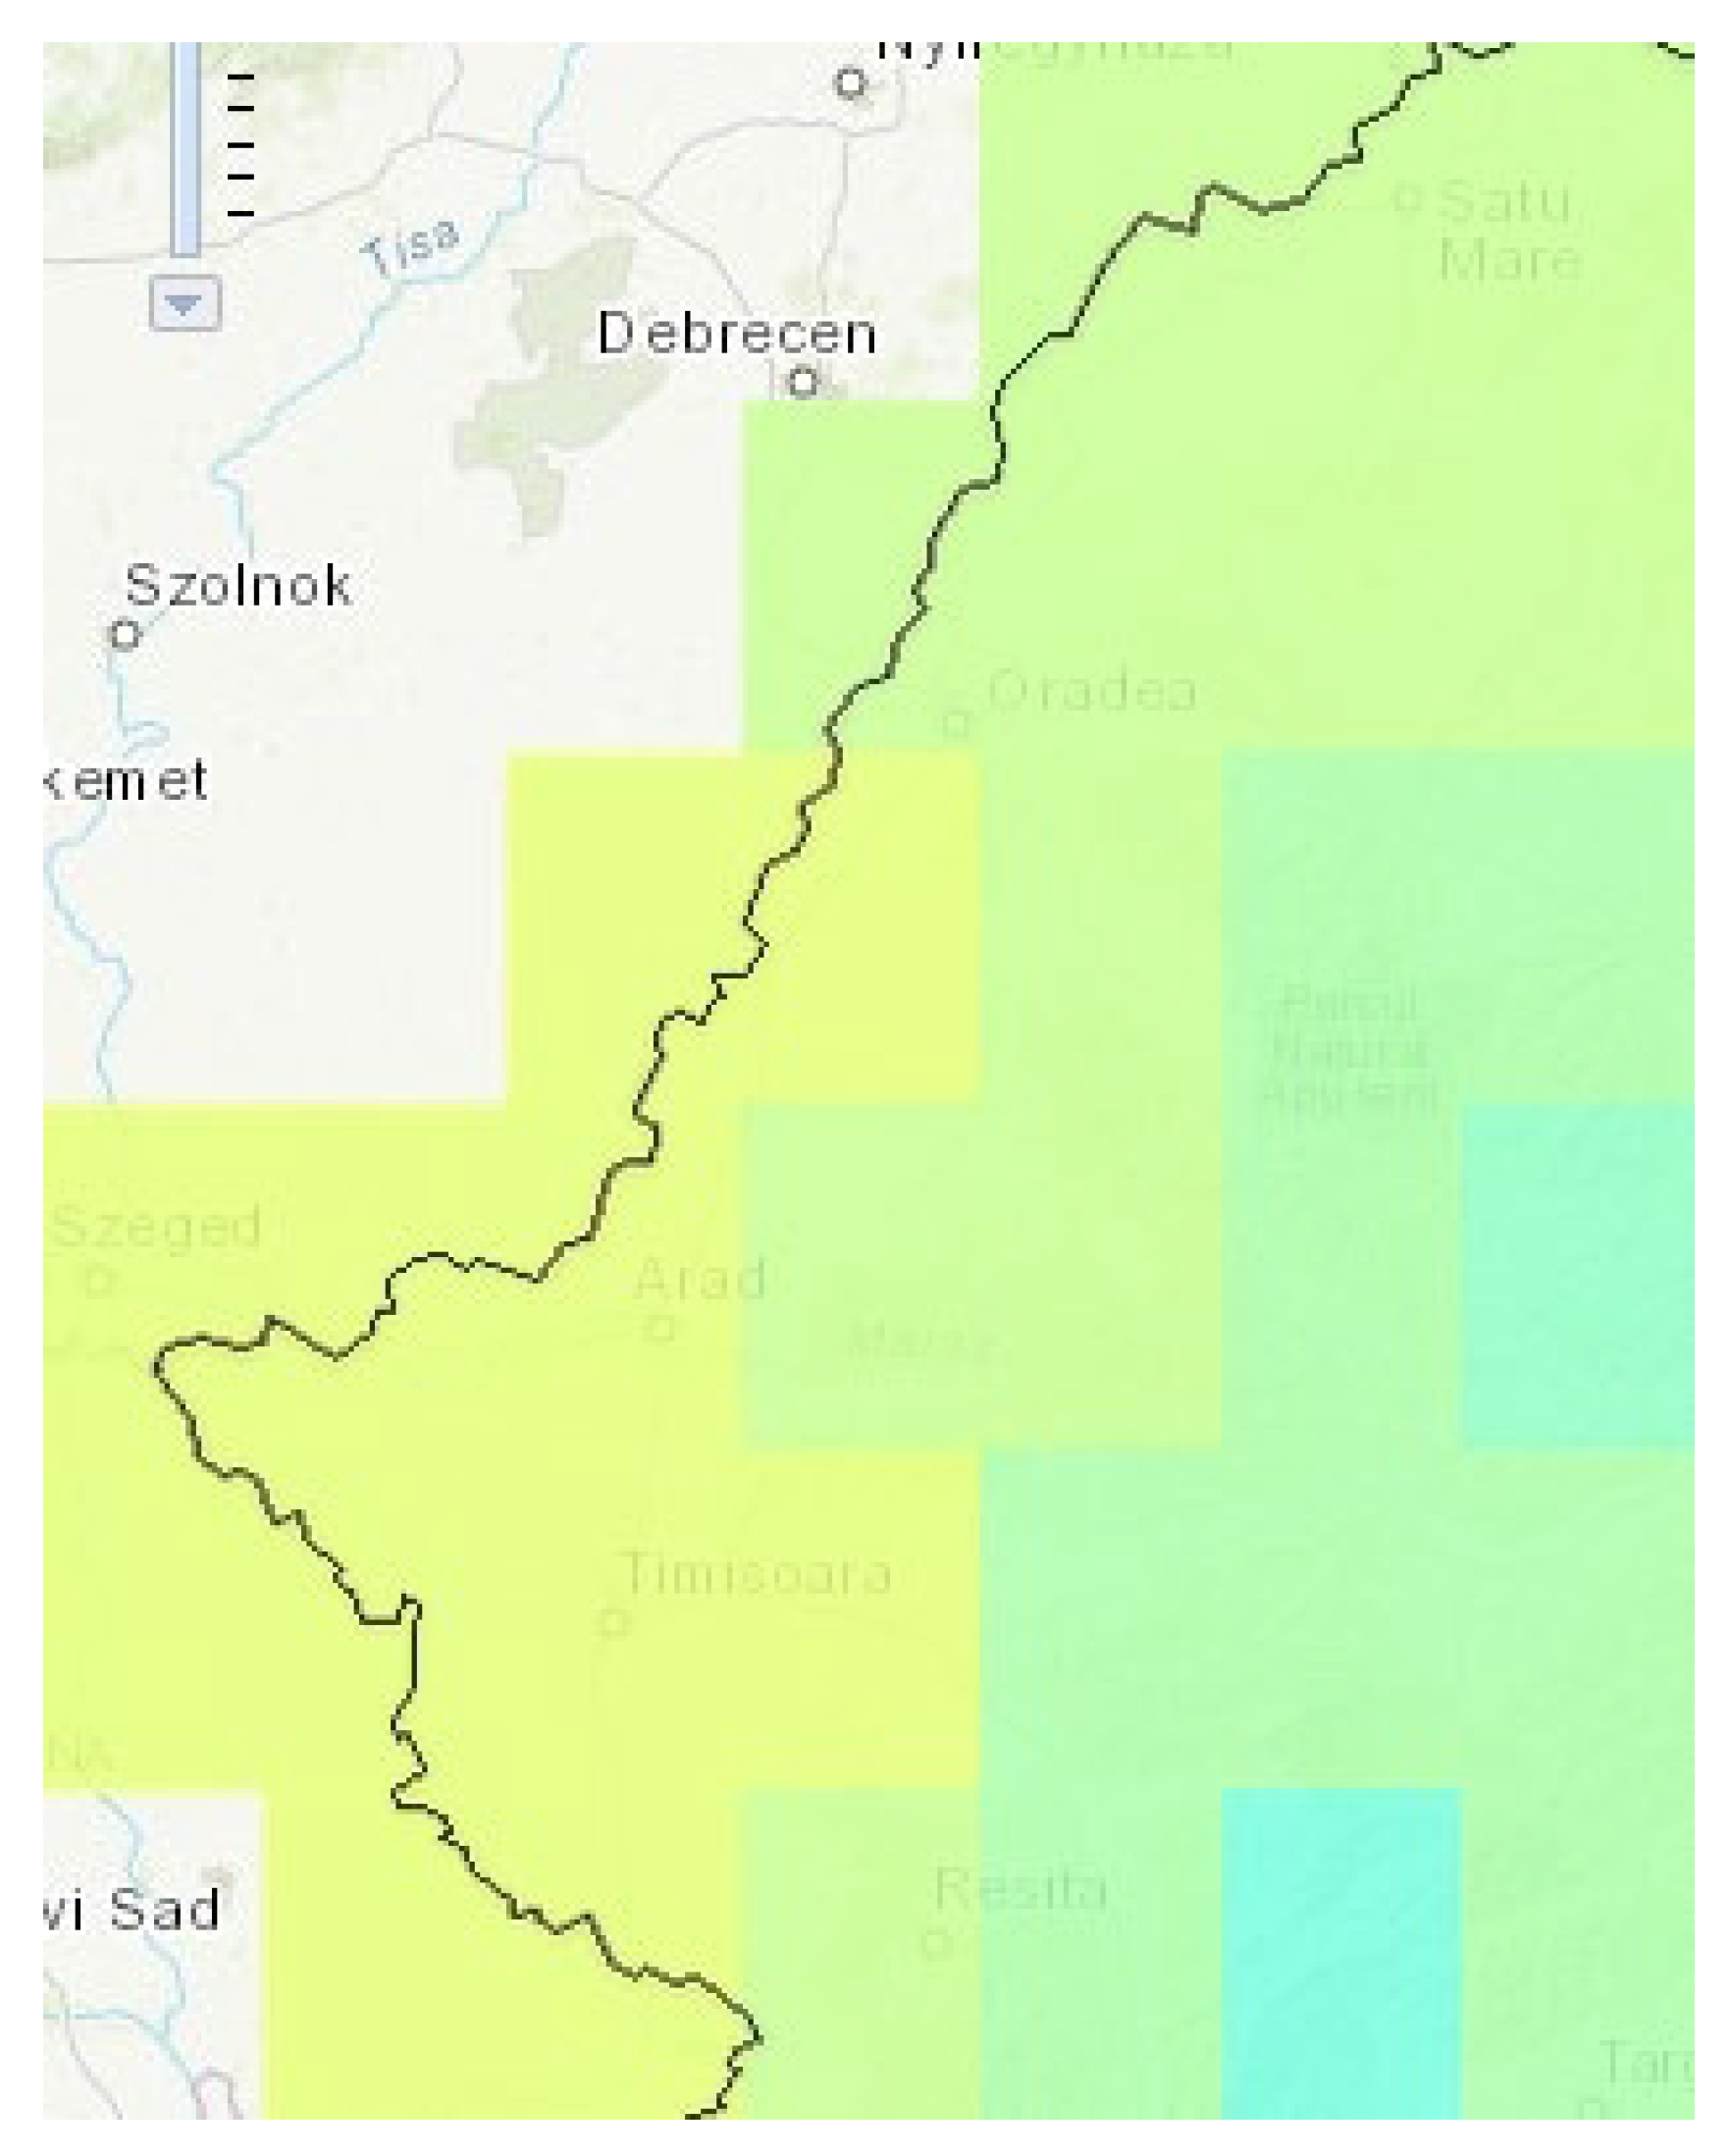
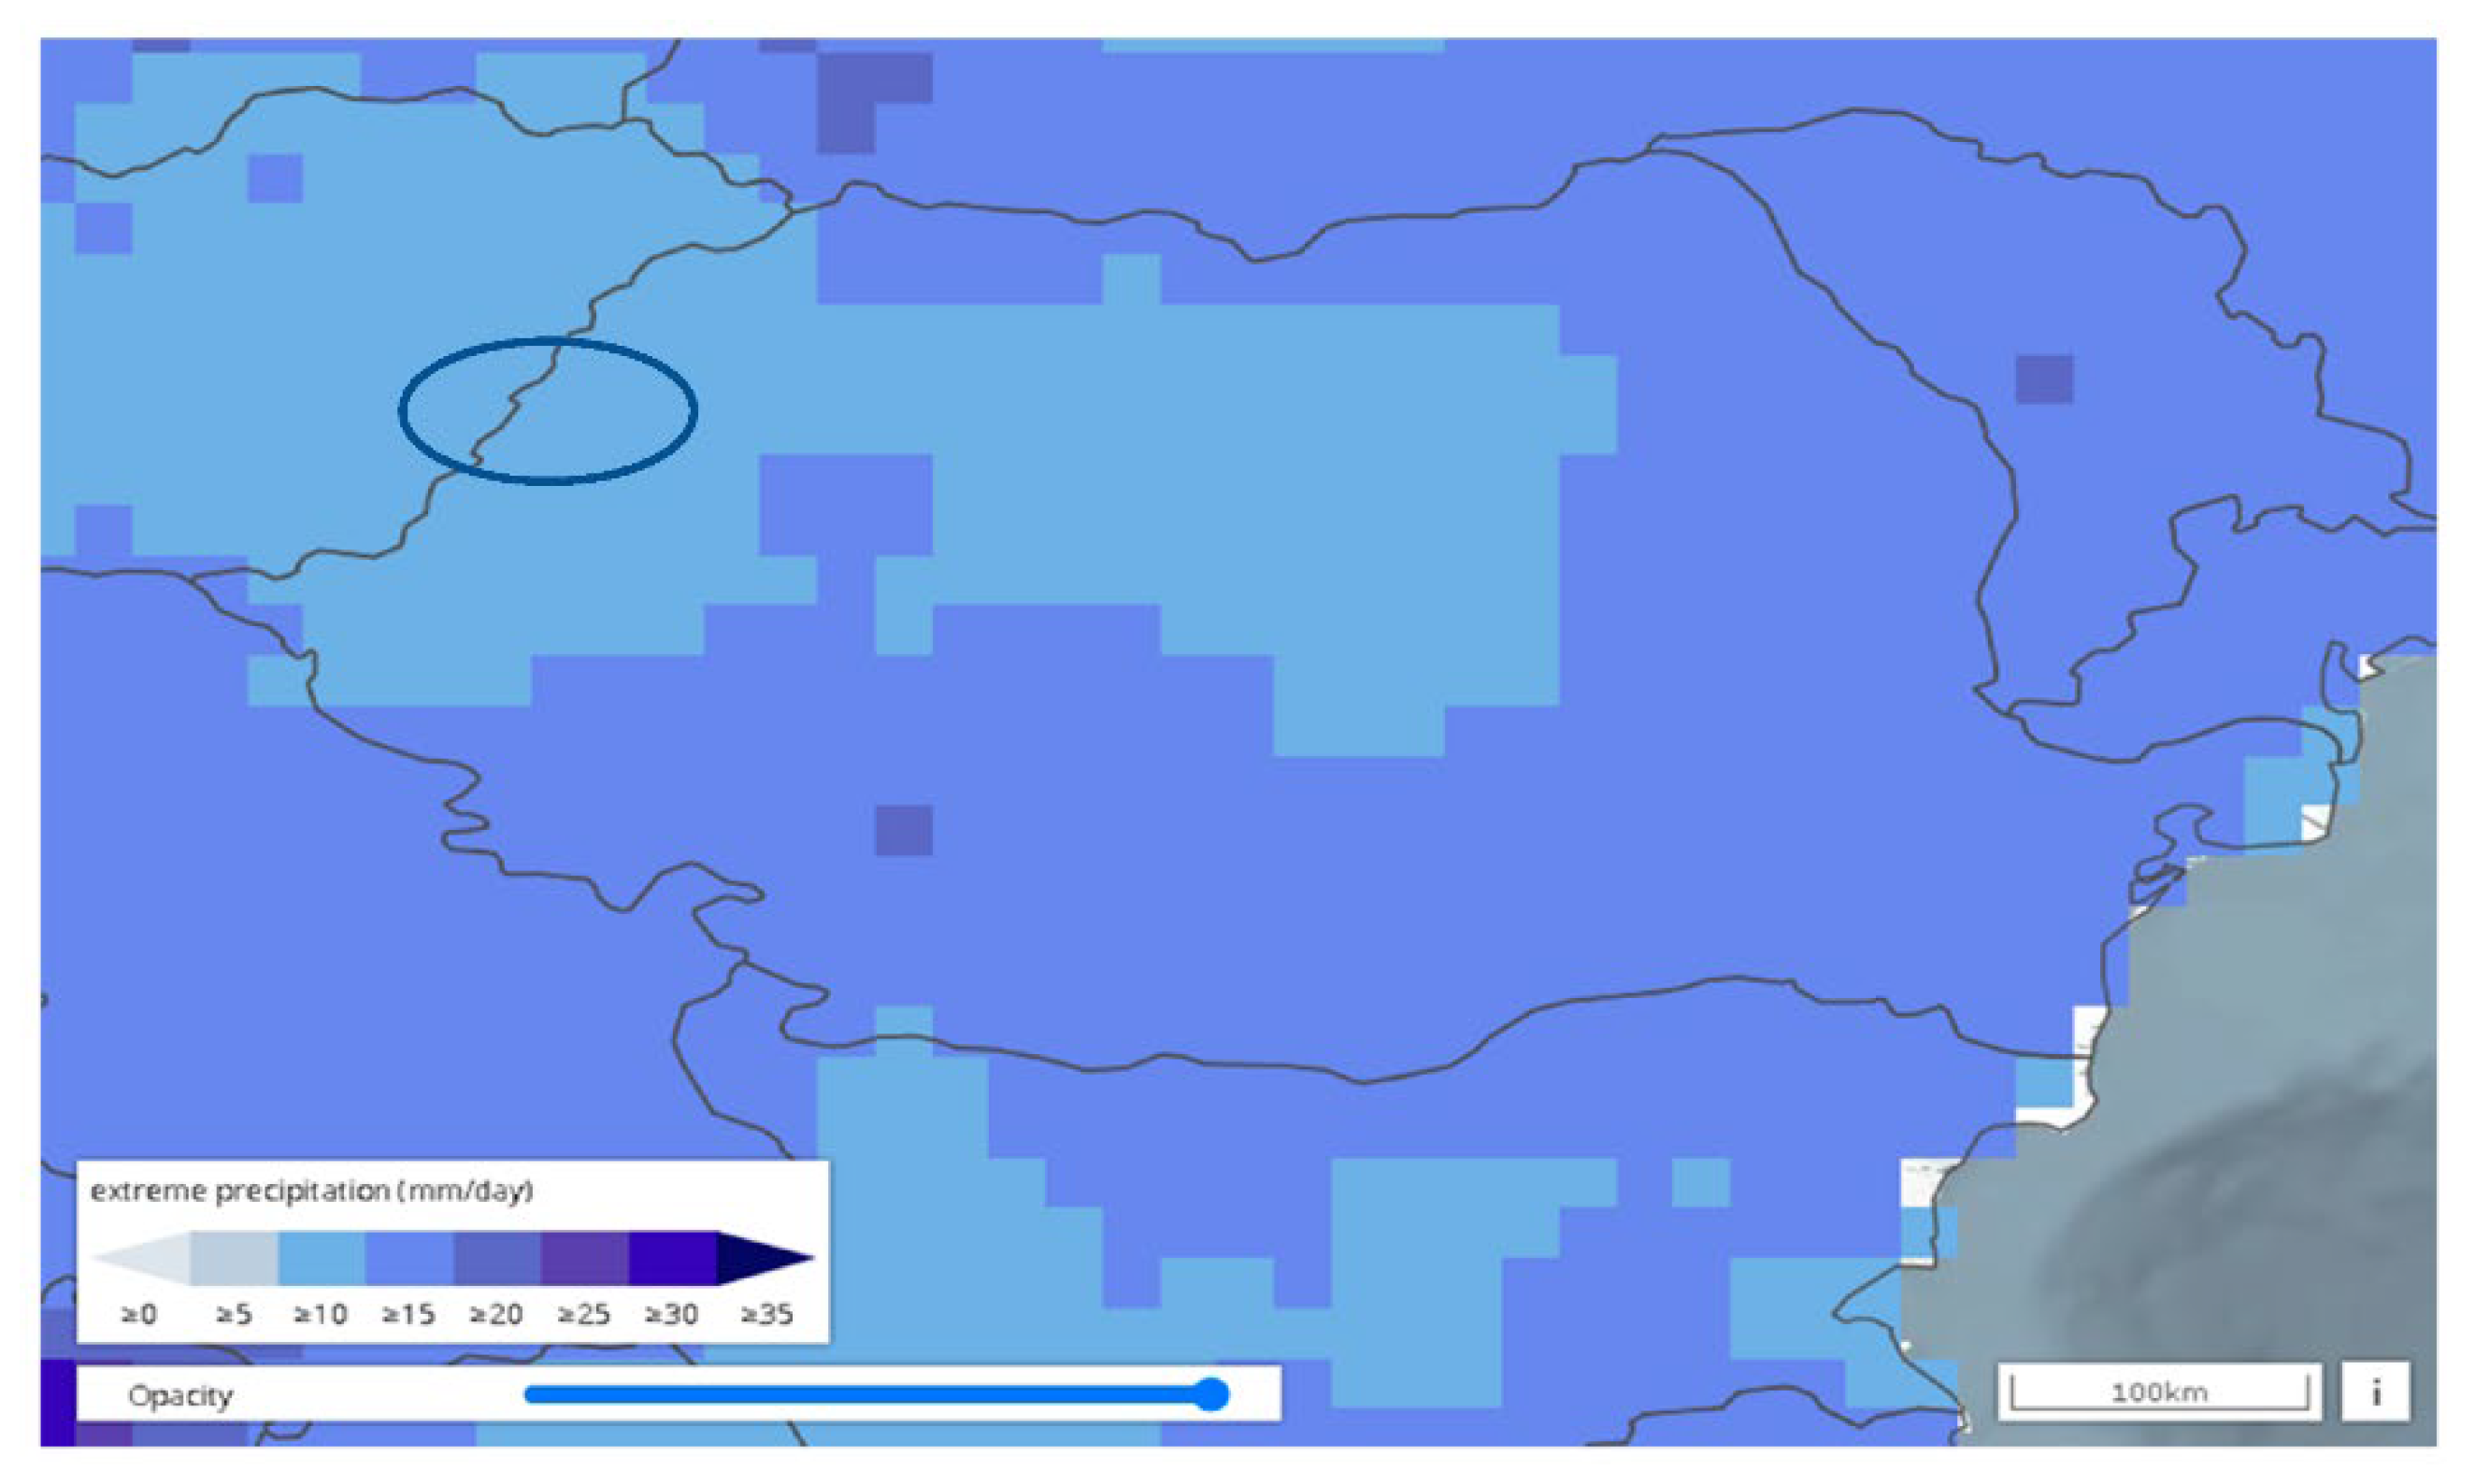
2.2. Precipitation
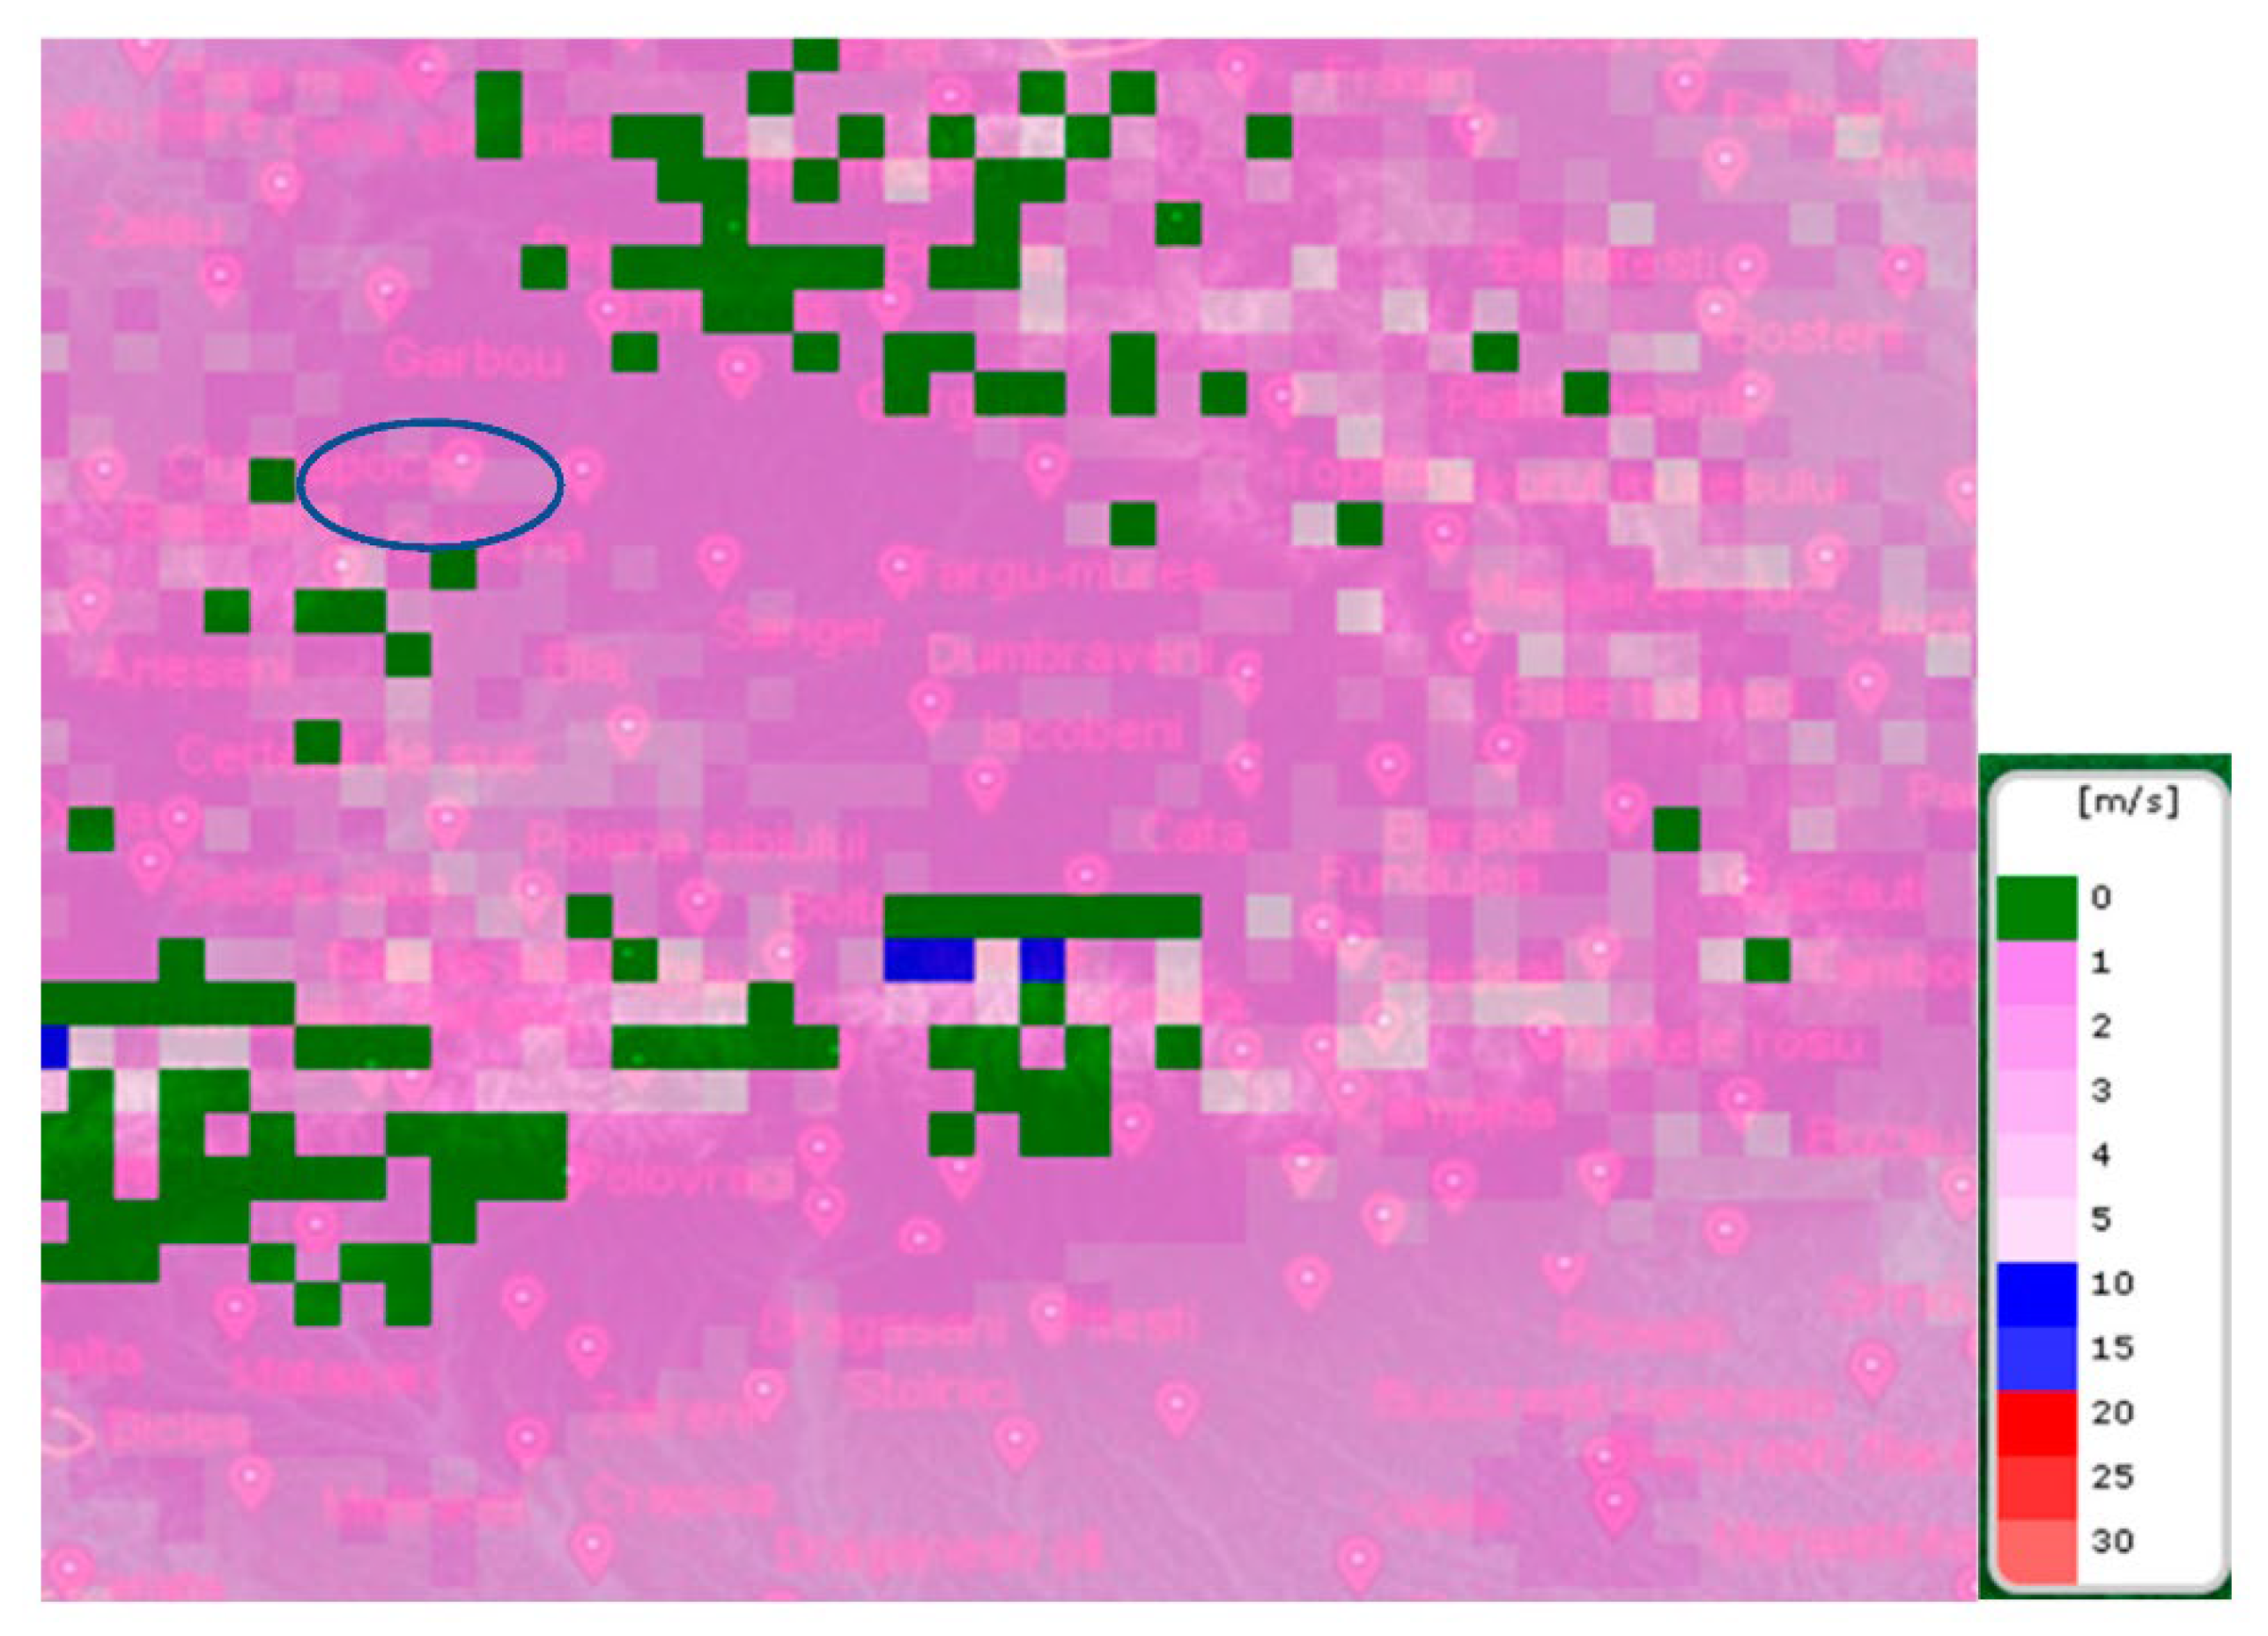
2.3. Wind Speed
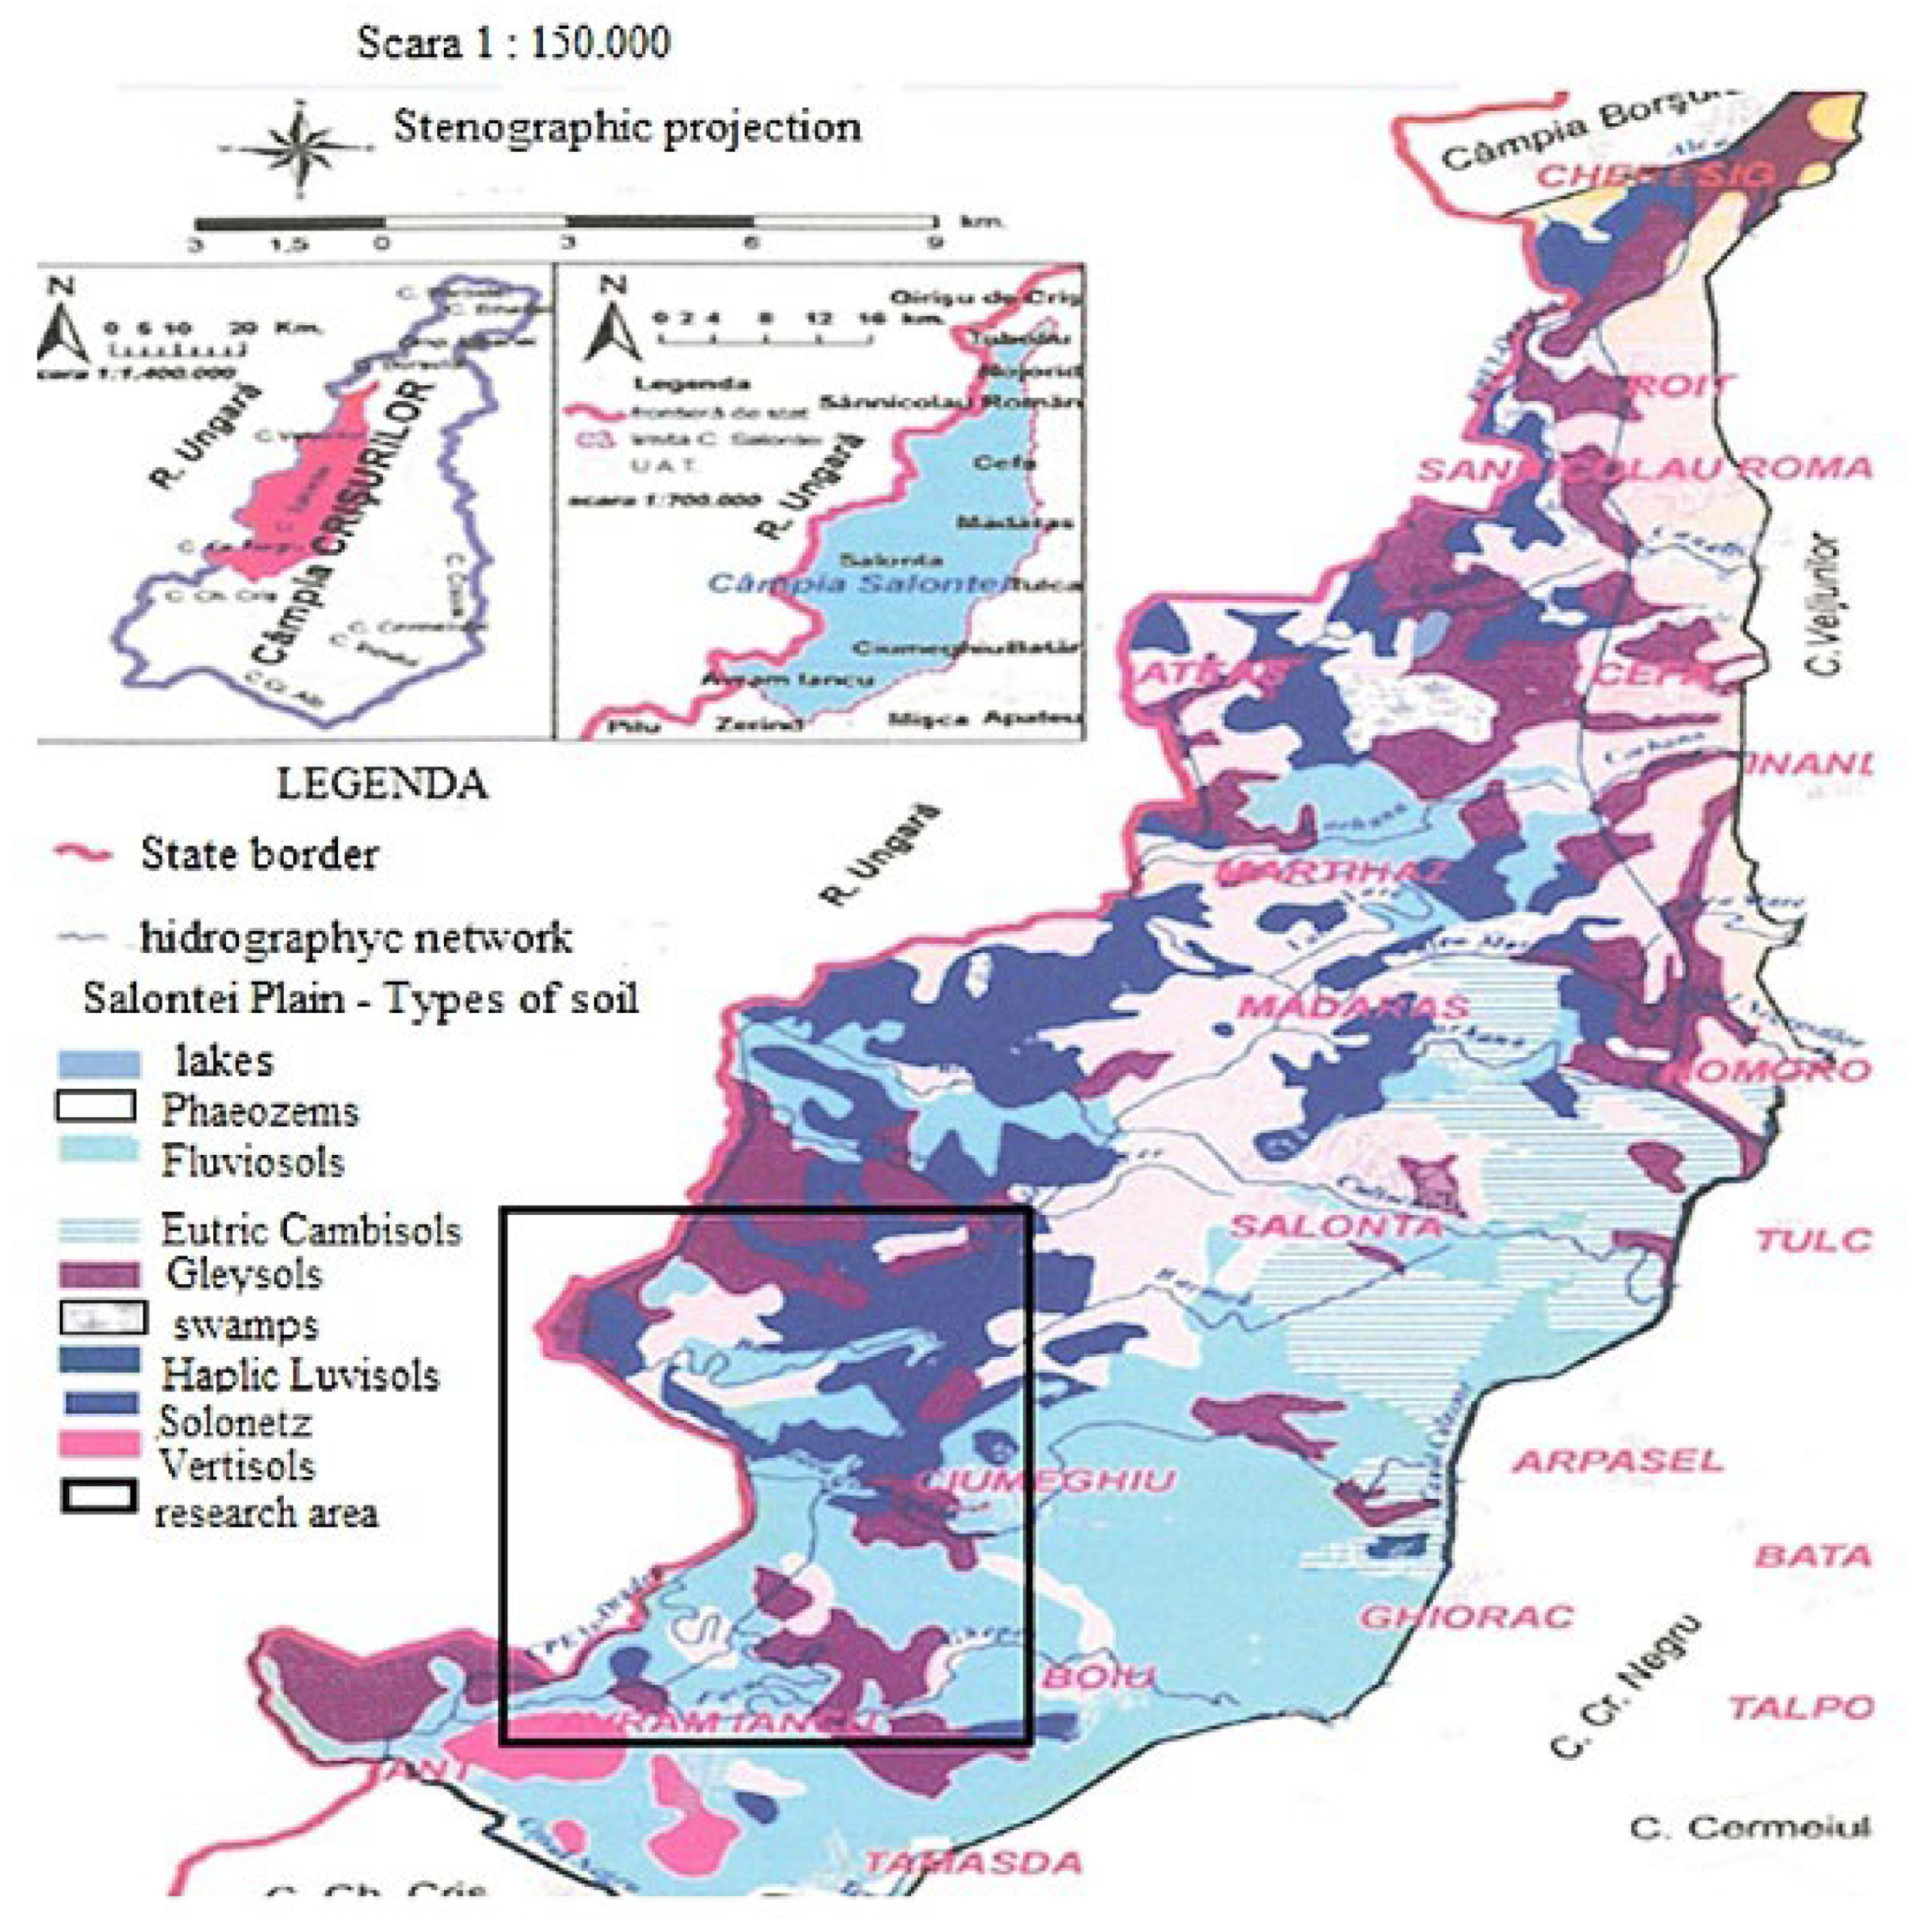
2.4. Soil Erosion
- Alluviosol, subtypes: typical, molic, gleic, batigleic, vertical.
- Faeoziom, subtypes: cambic, argic, cambic–gleic, cambic–batigleic, argic–gleic, argic–batigleic.
- Eutricambosol, subtypes: typical, molic, alluvial, batigleic.
- Preluvosol, subtypes: typical, molic, batigleic, vertical.
- Vertosol (small areas).
- Gleiosol, subtypes: typical, cambic, alluvial, molic, saline.
- Soloneț, subtypes: typical, batigleic, cambic, cambic–batigleic.
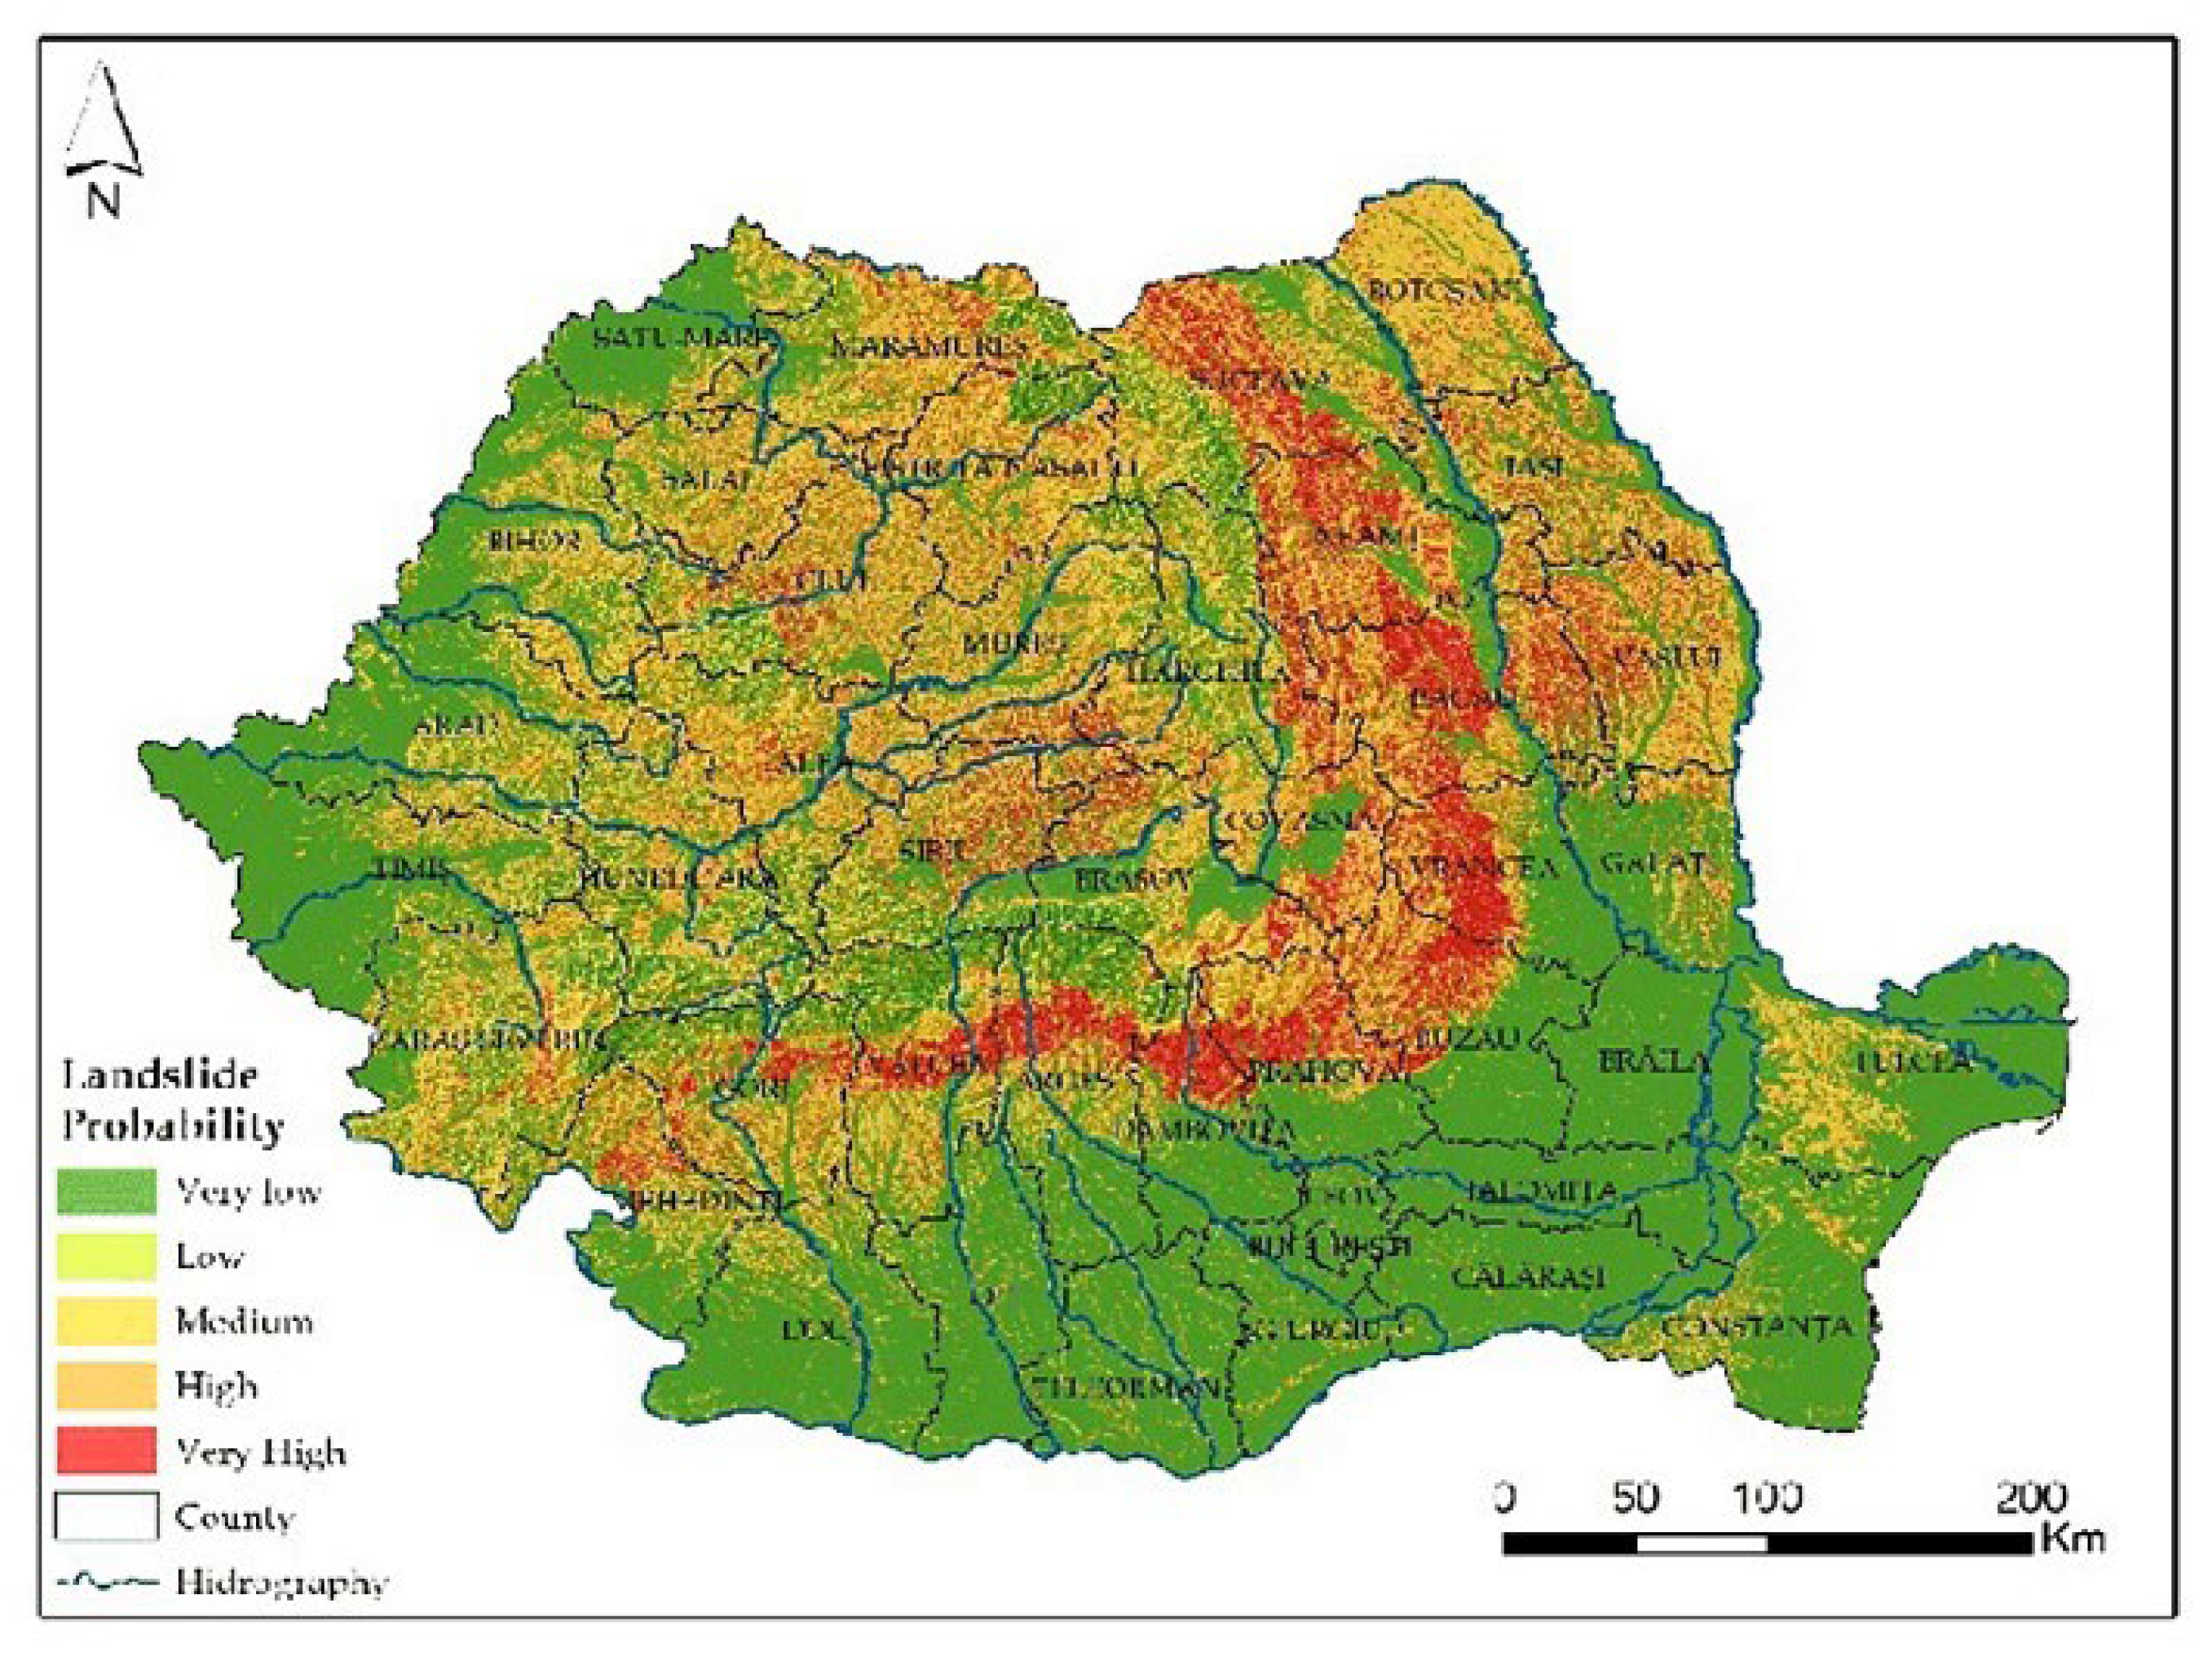
2.5. Landslides
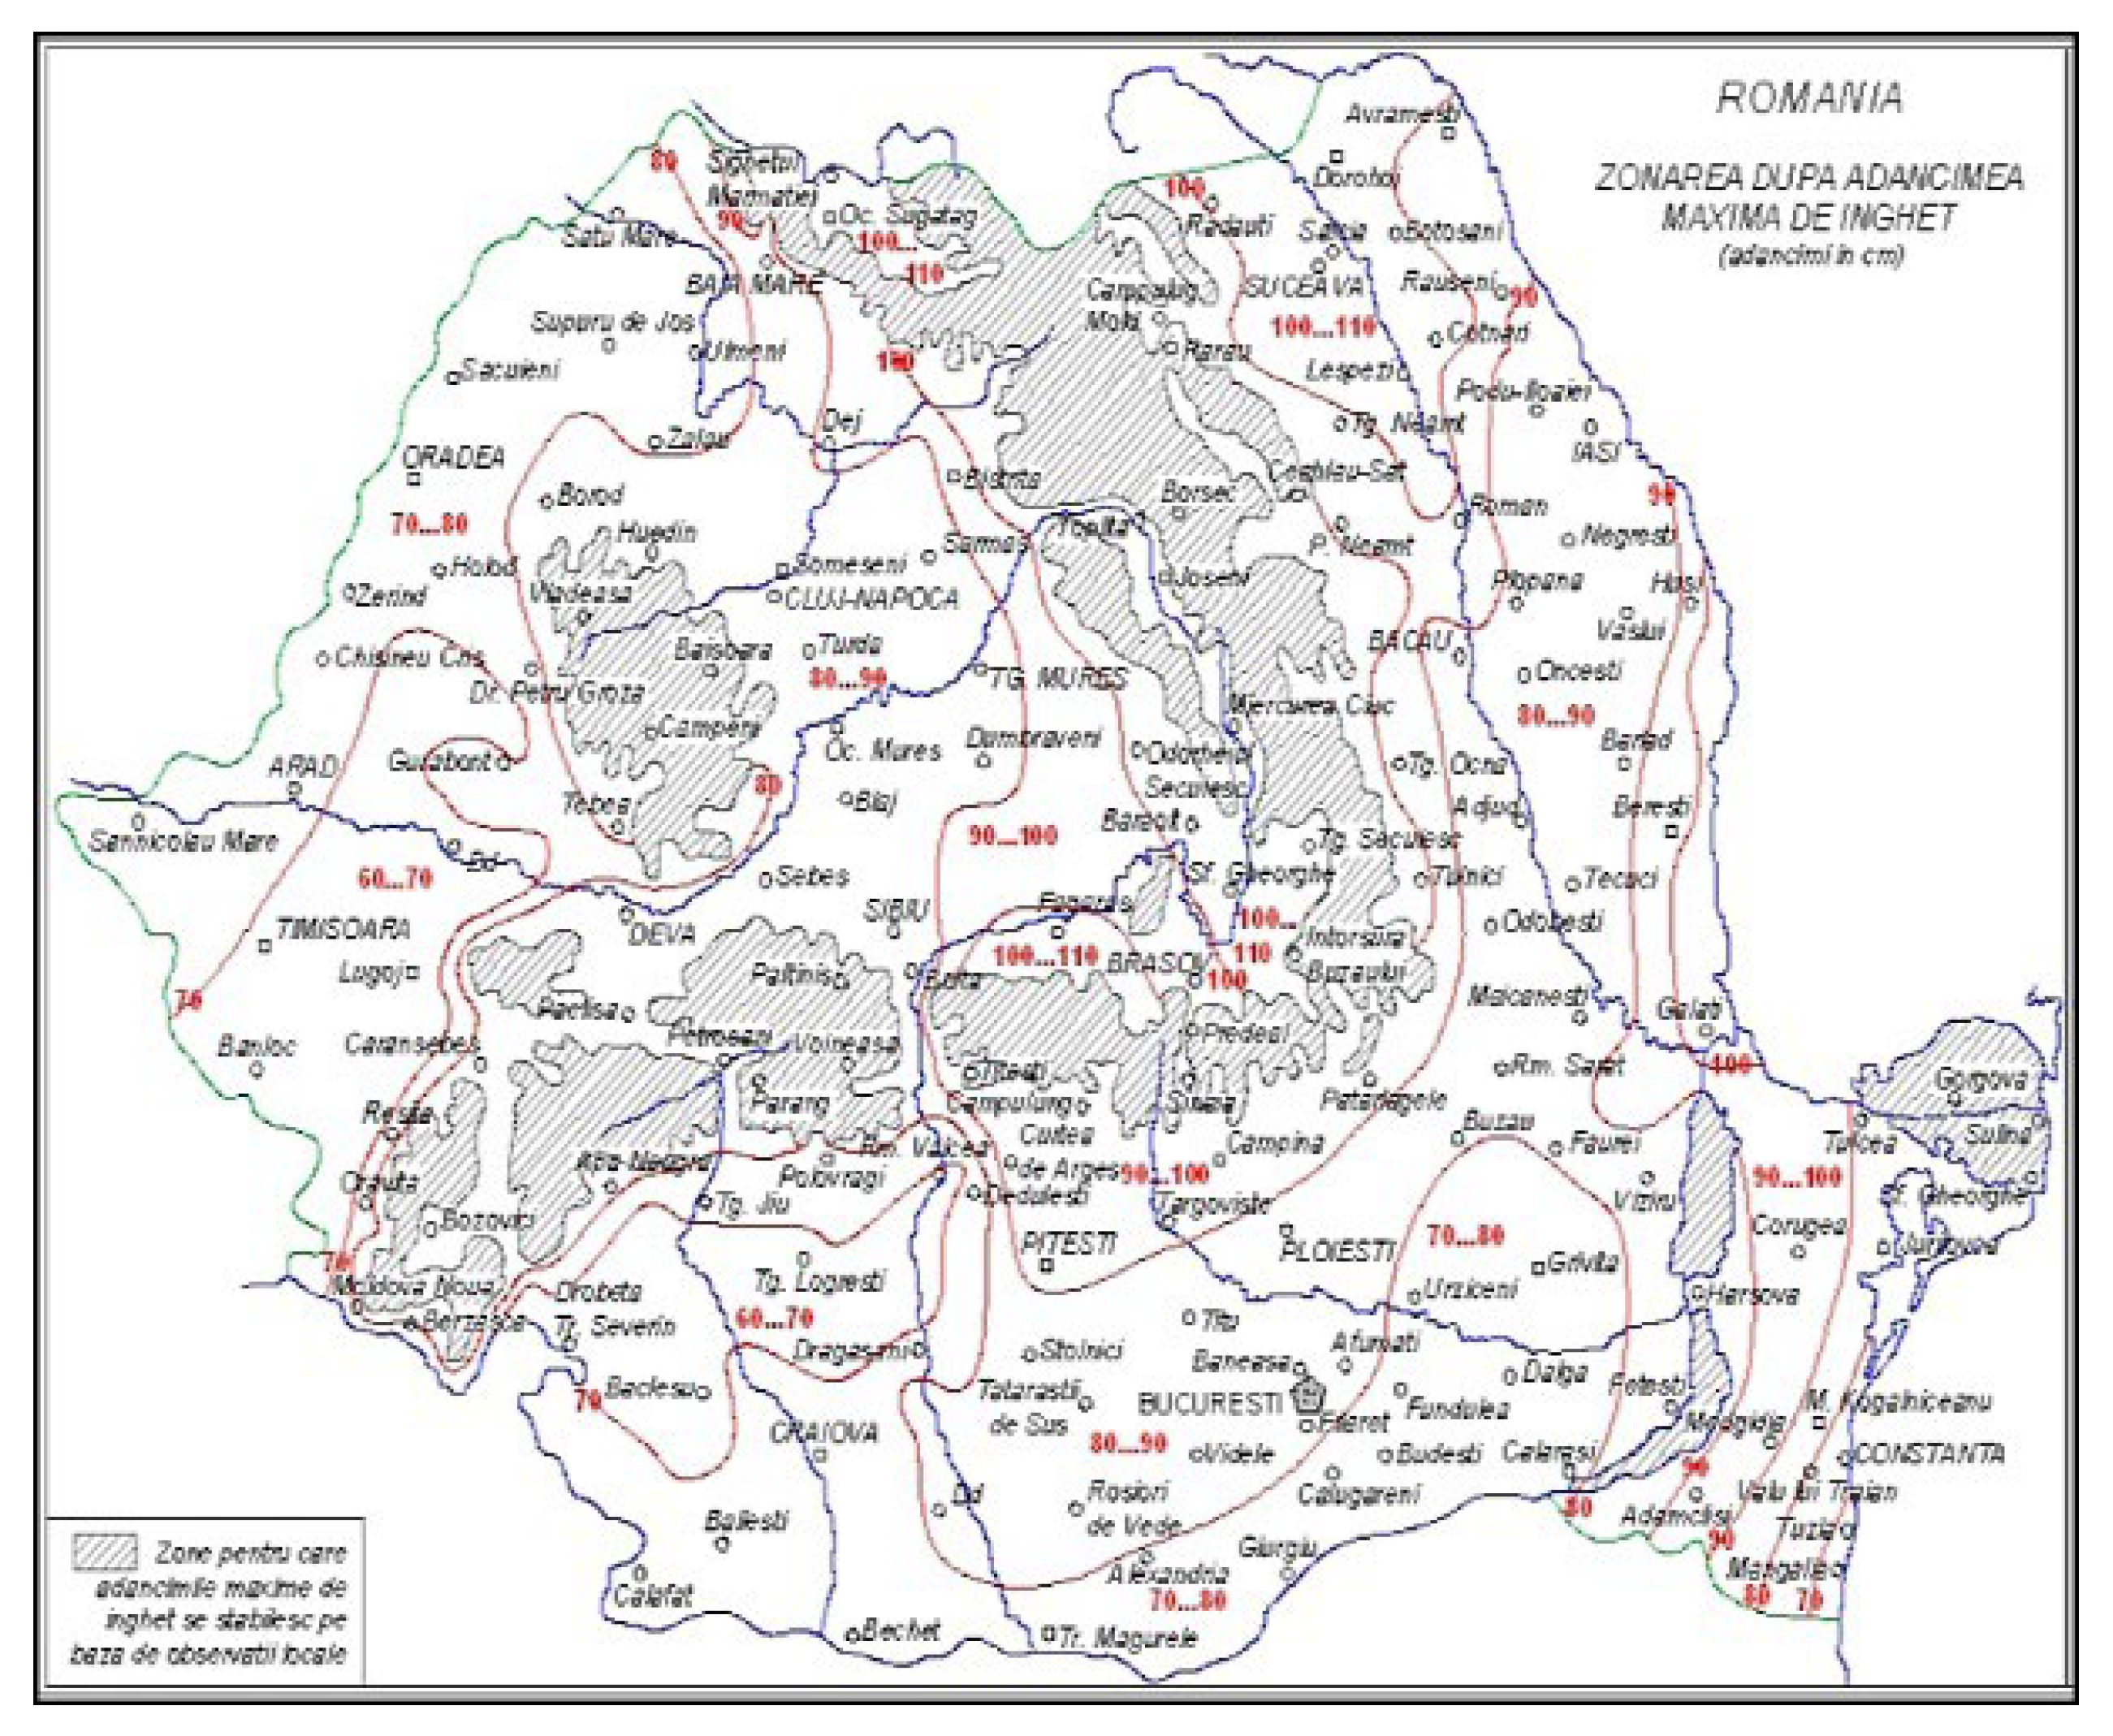
2.6. Freeze—Defrost
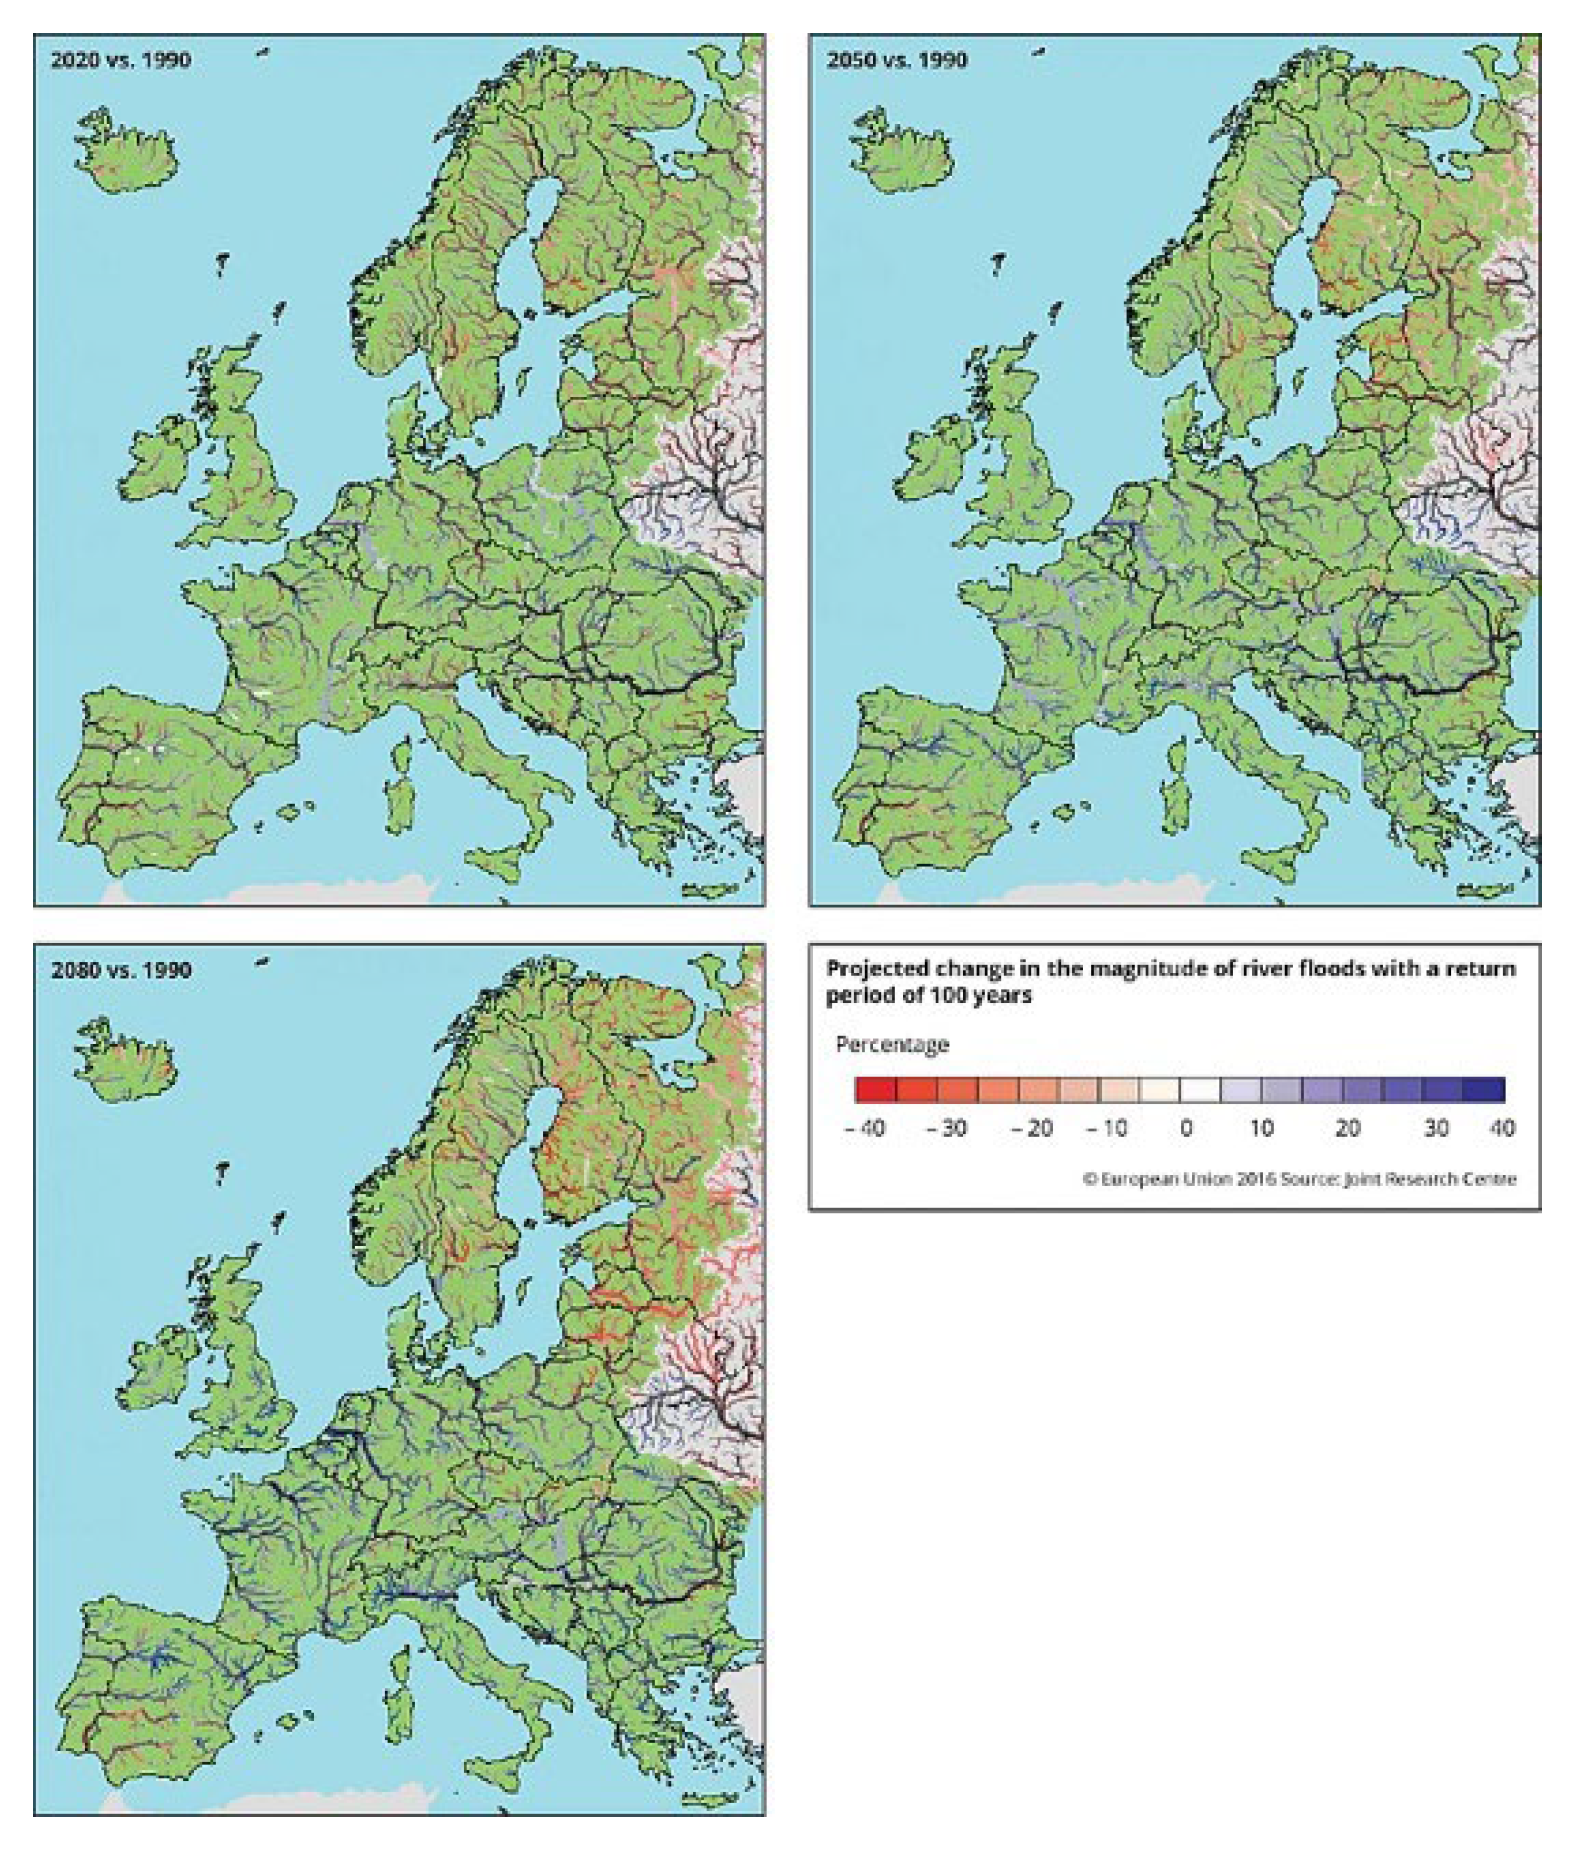
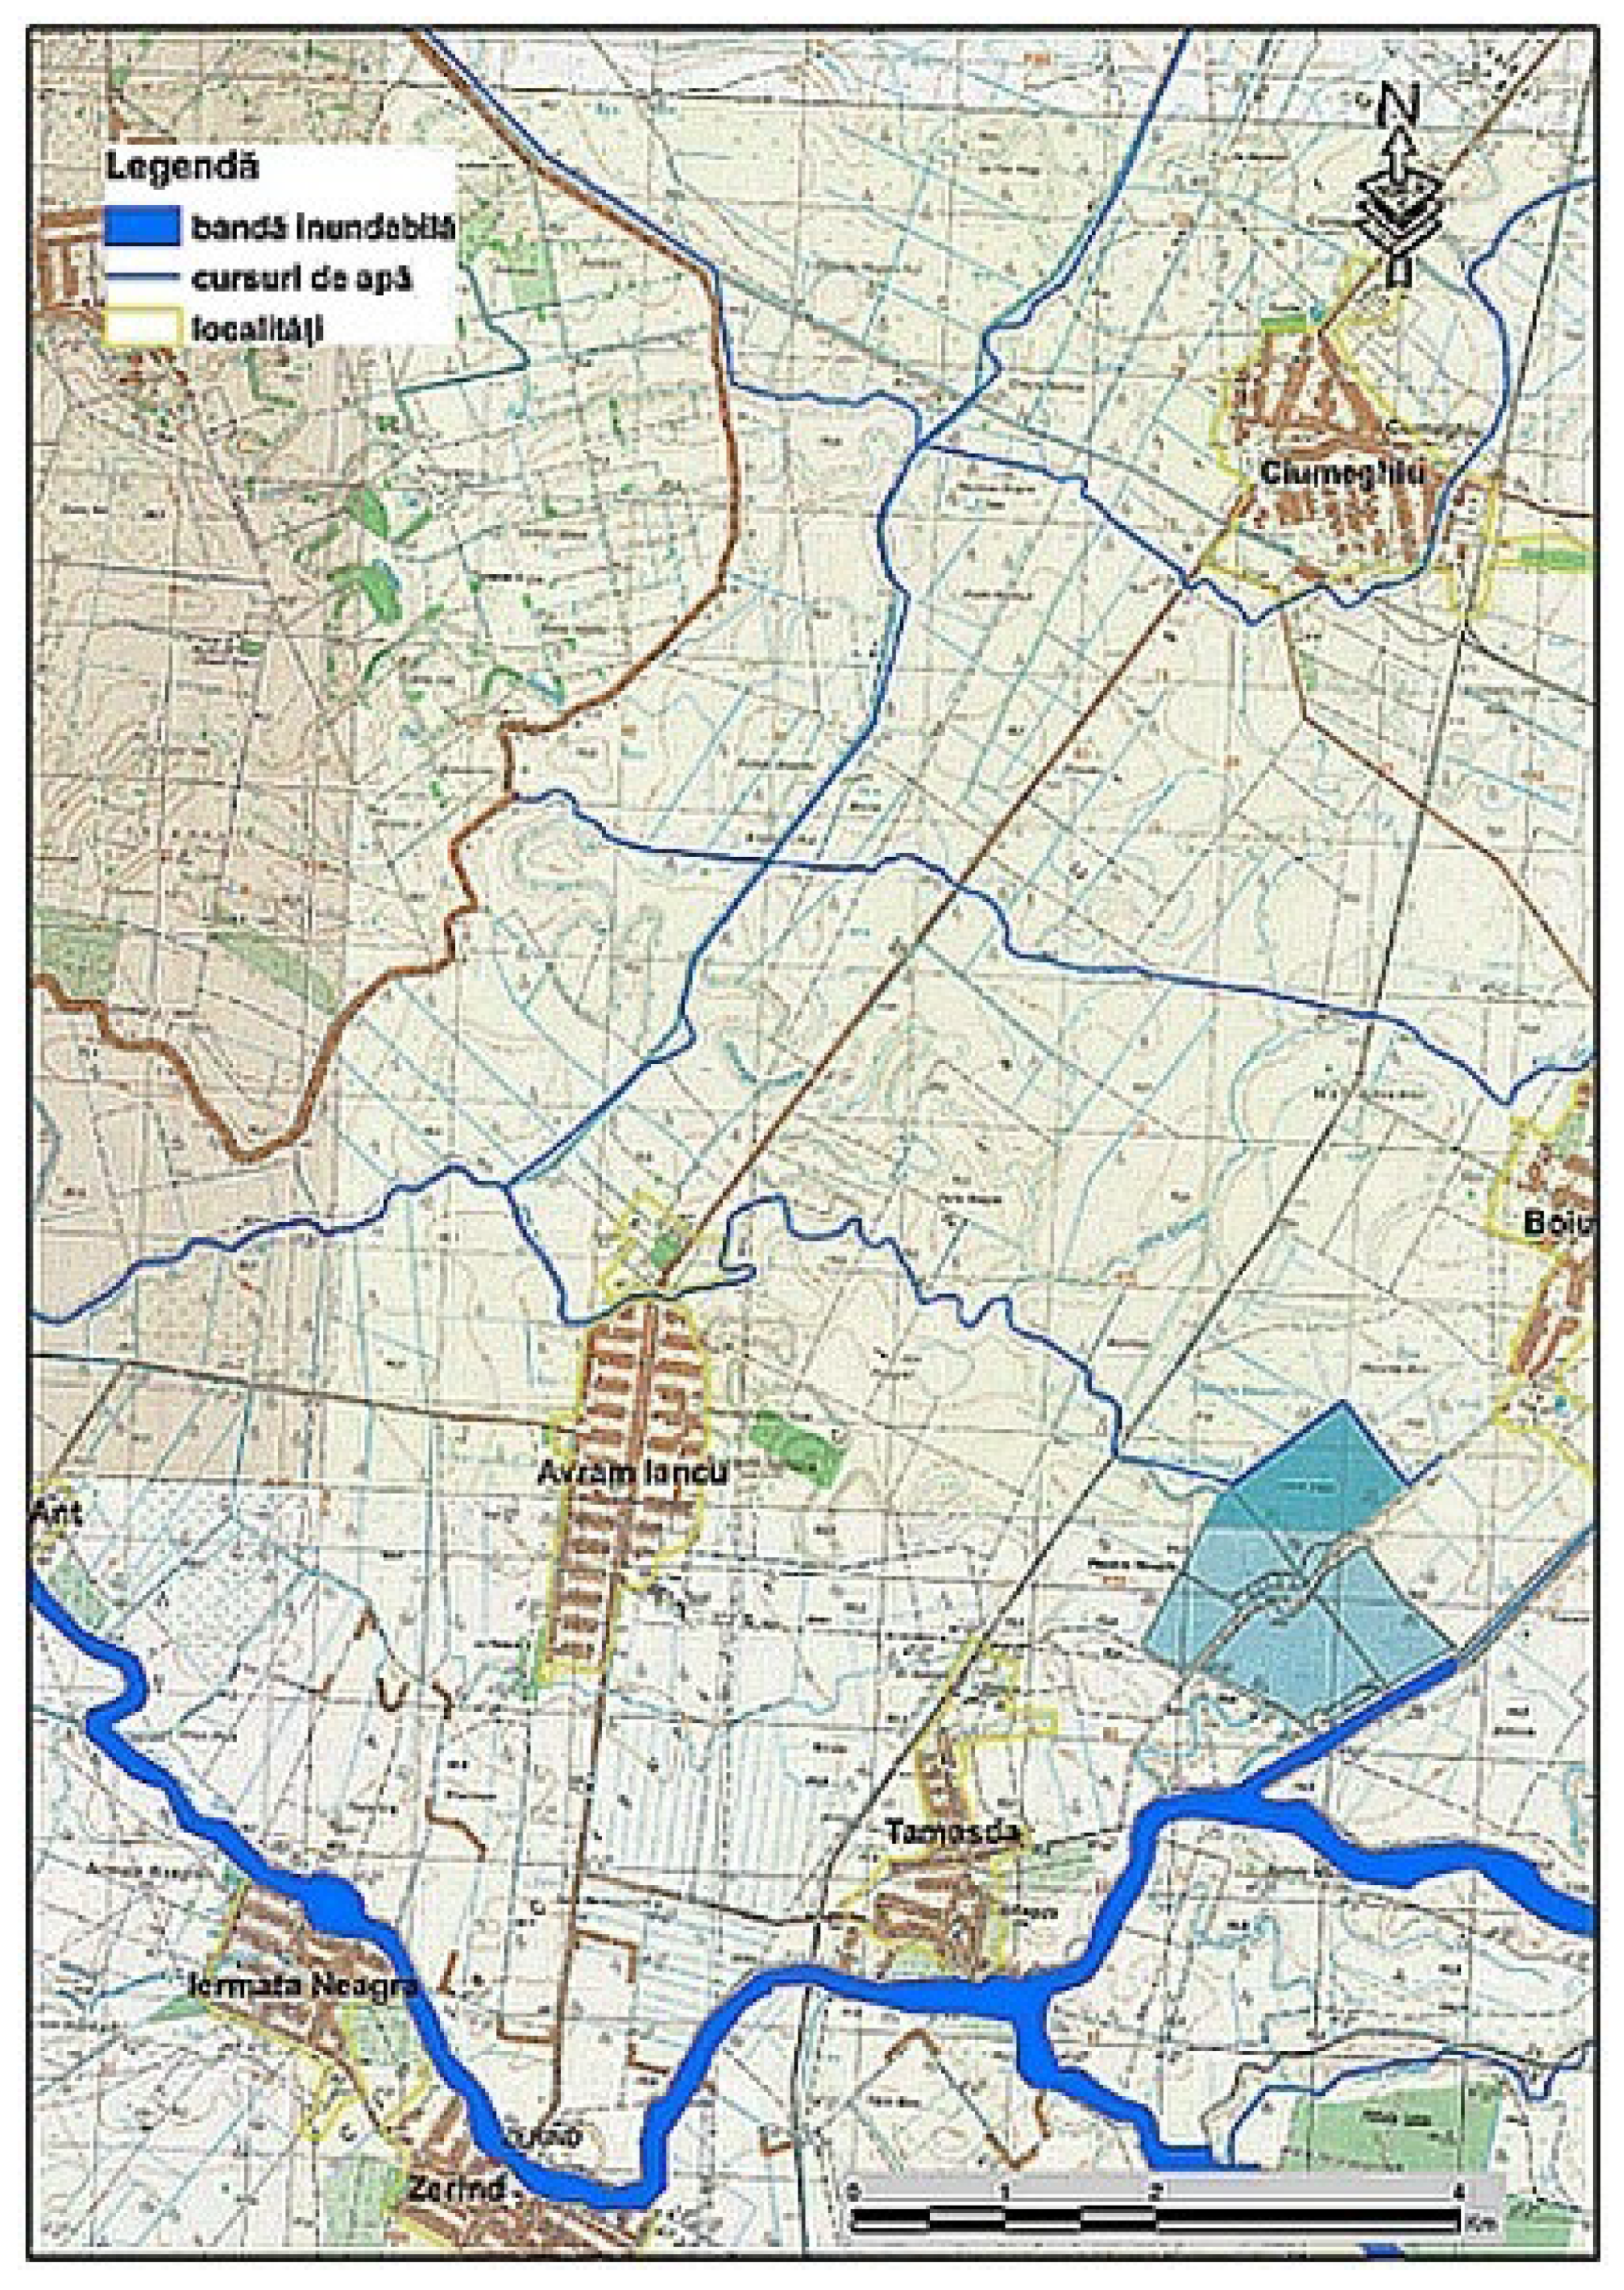
2.7. Floods
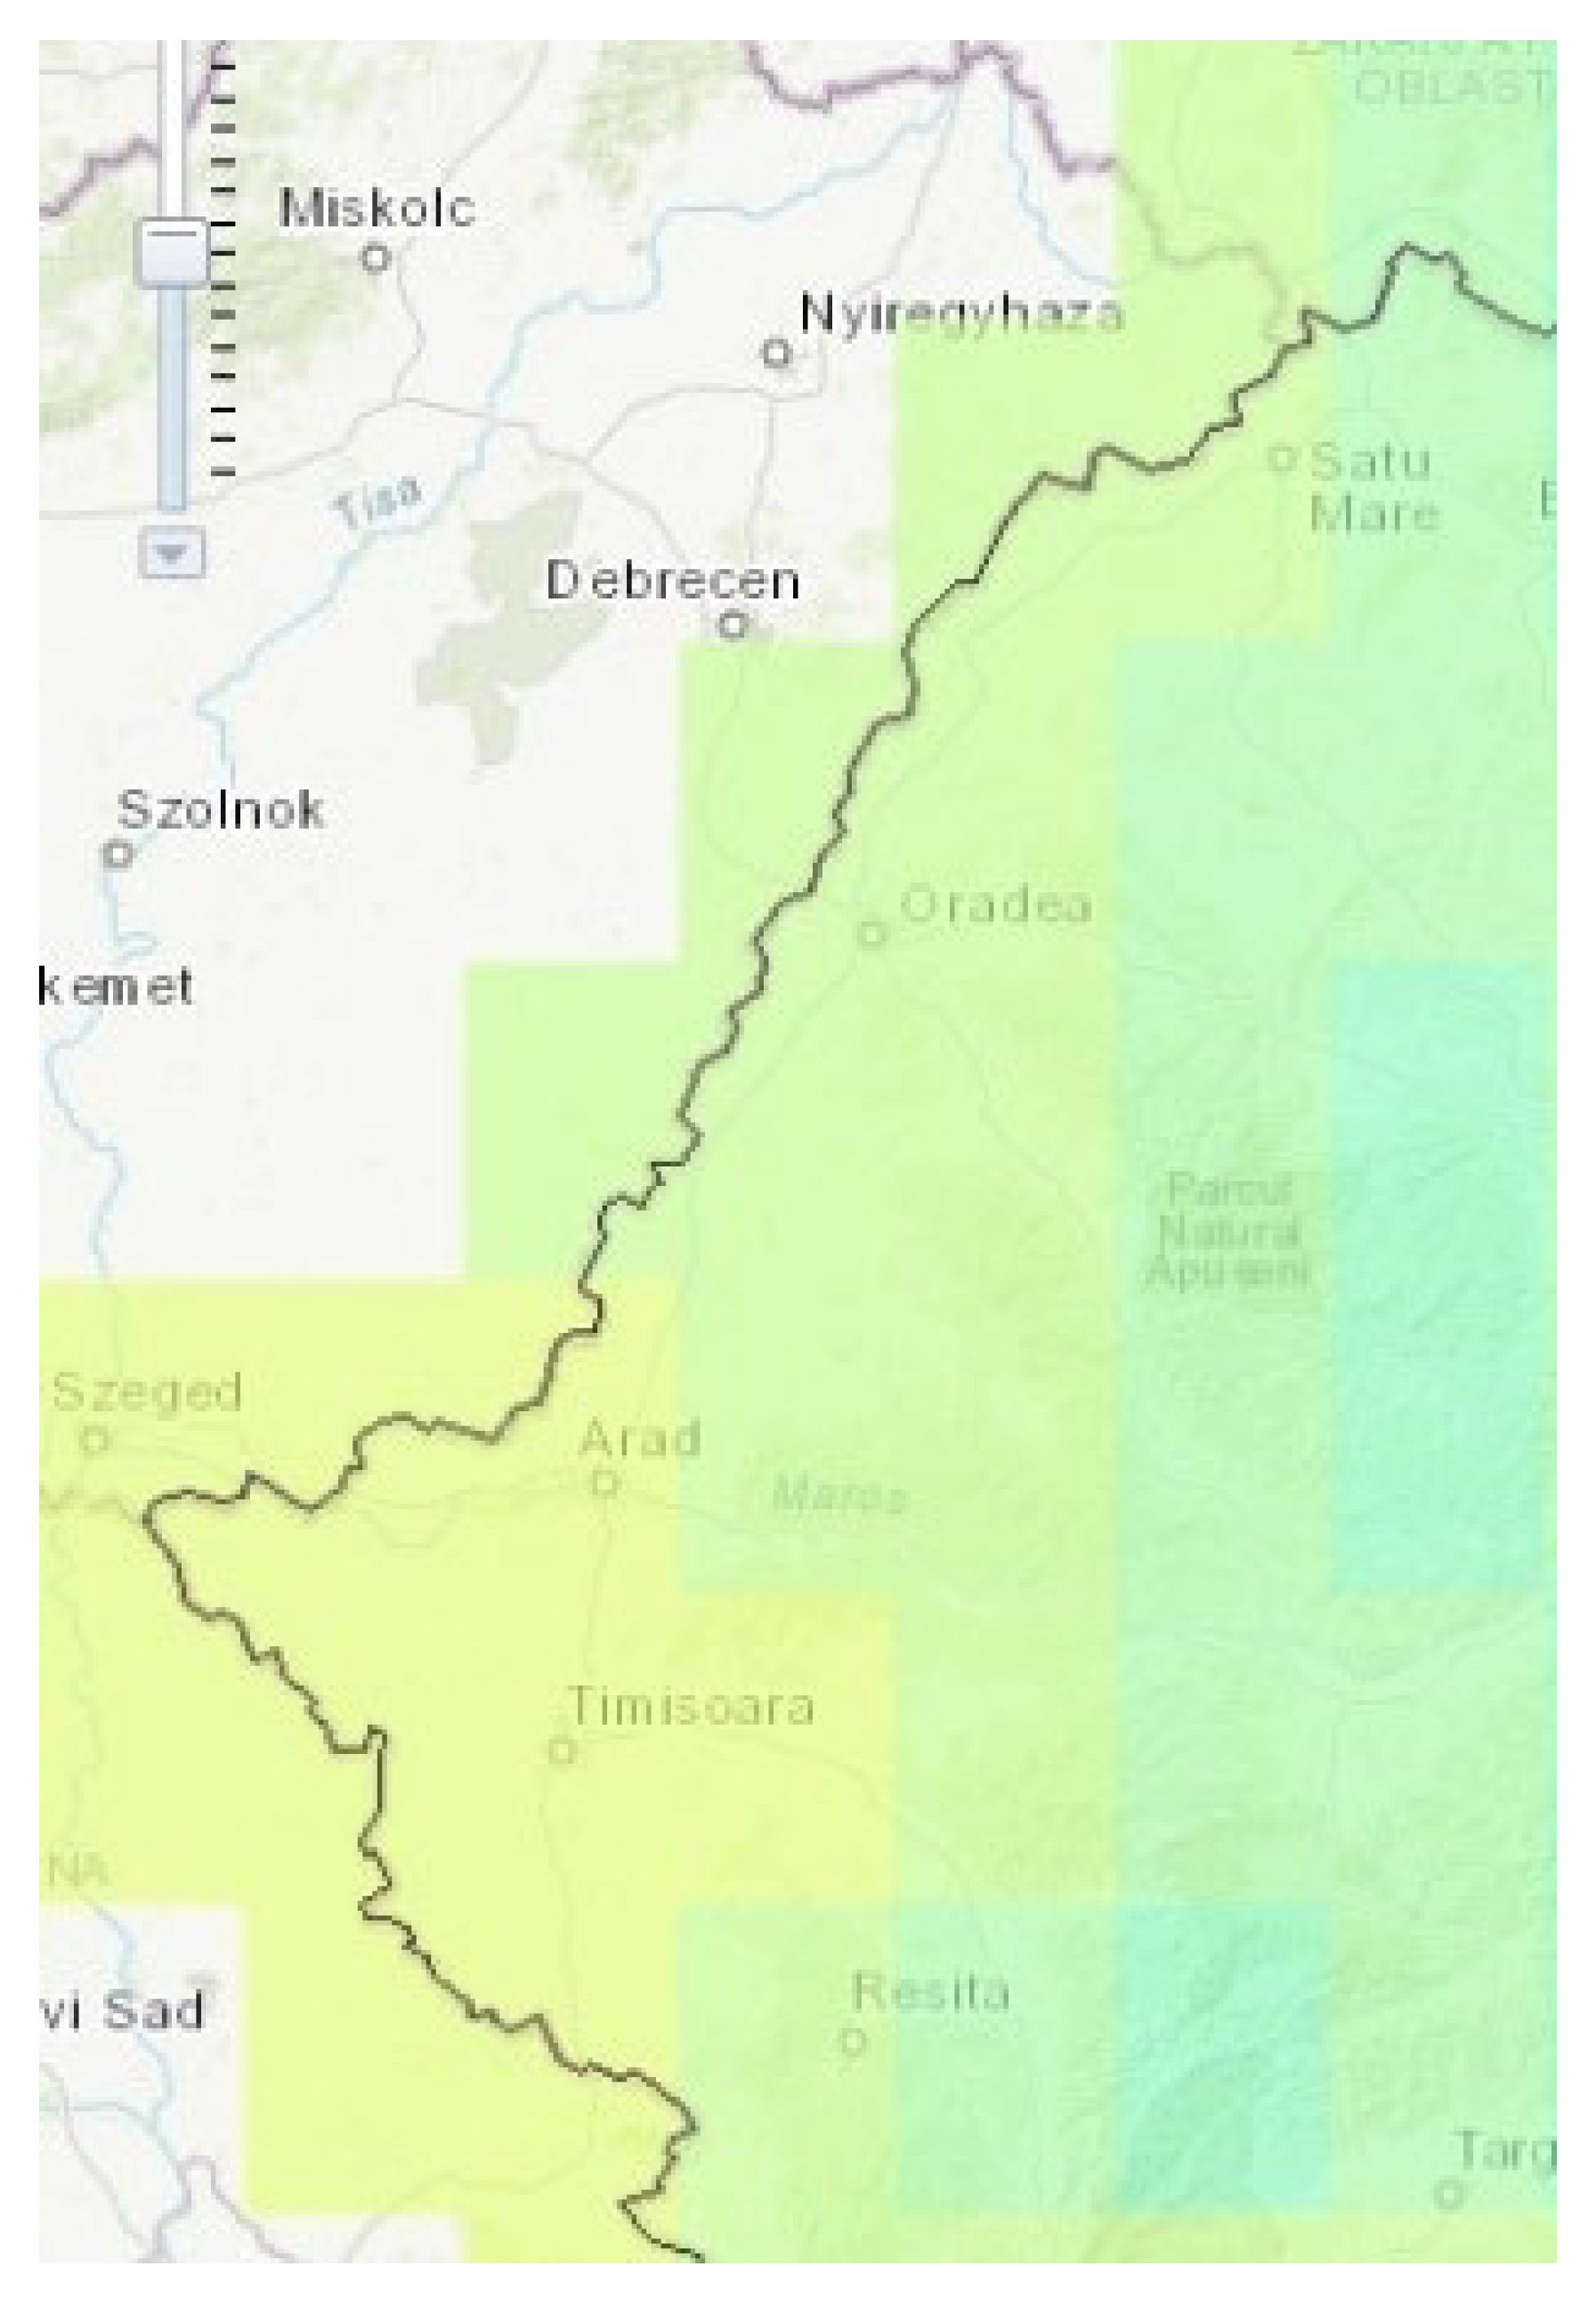
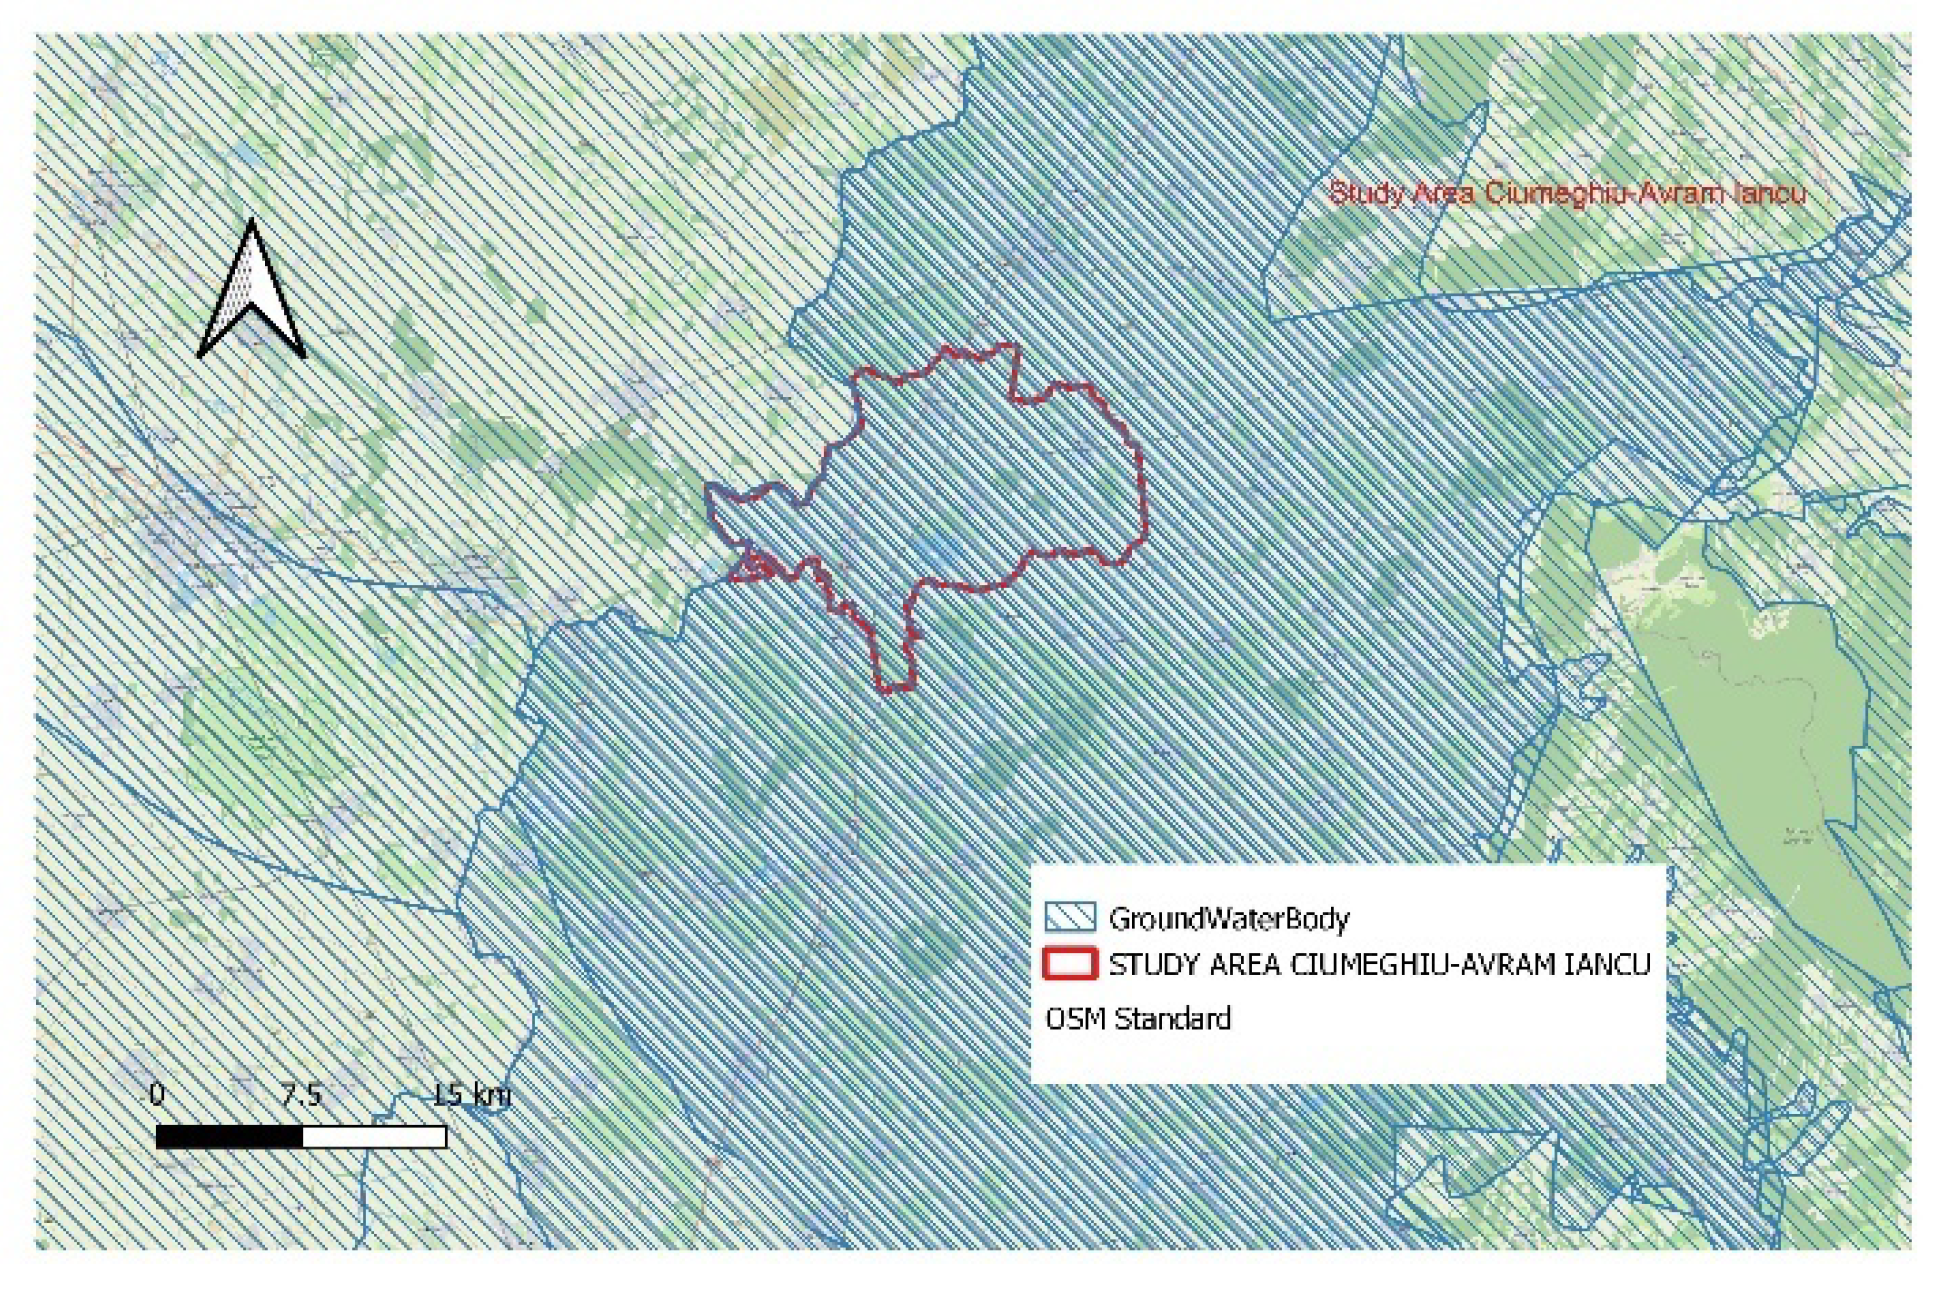
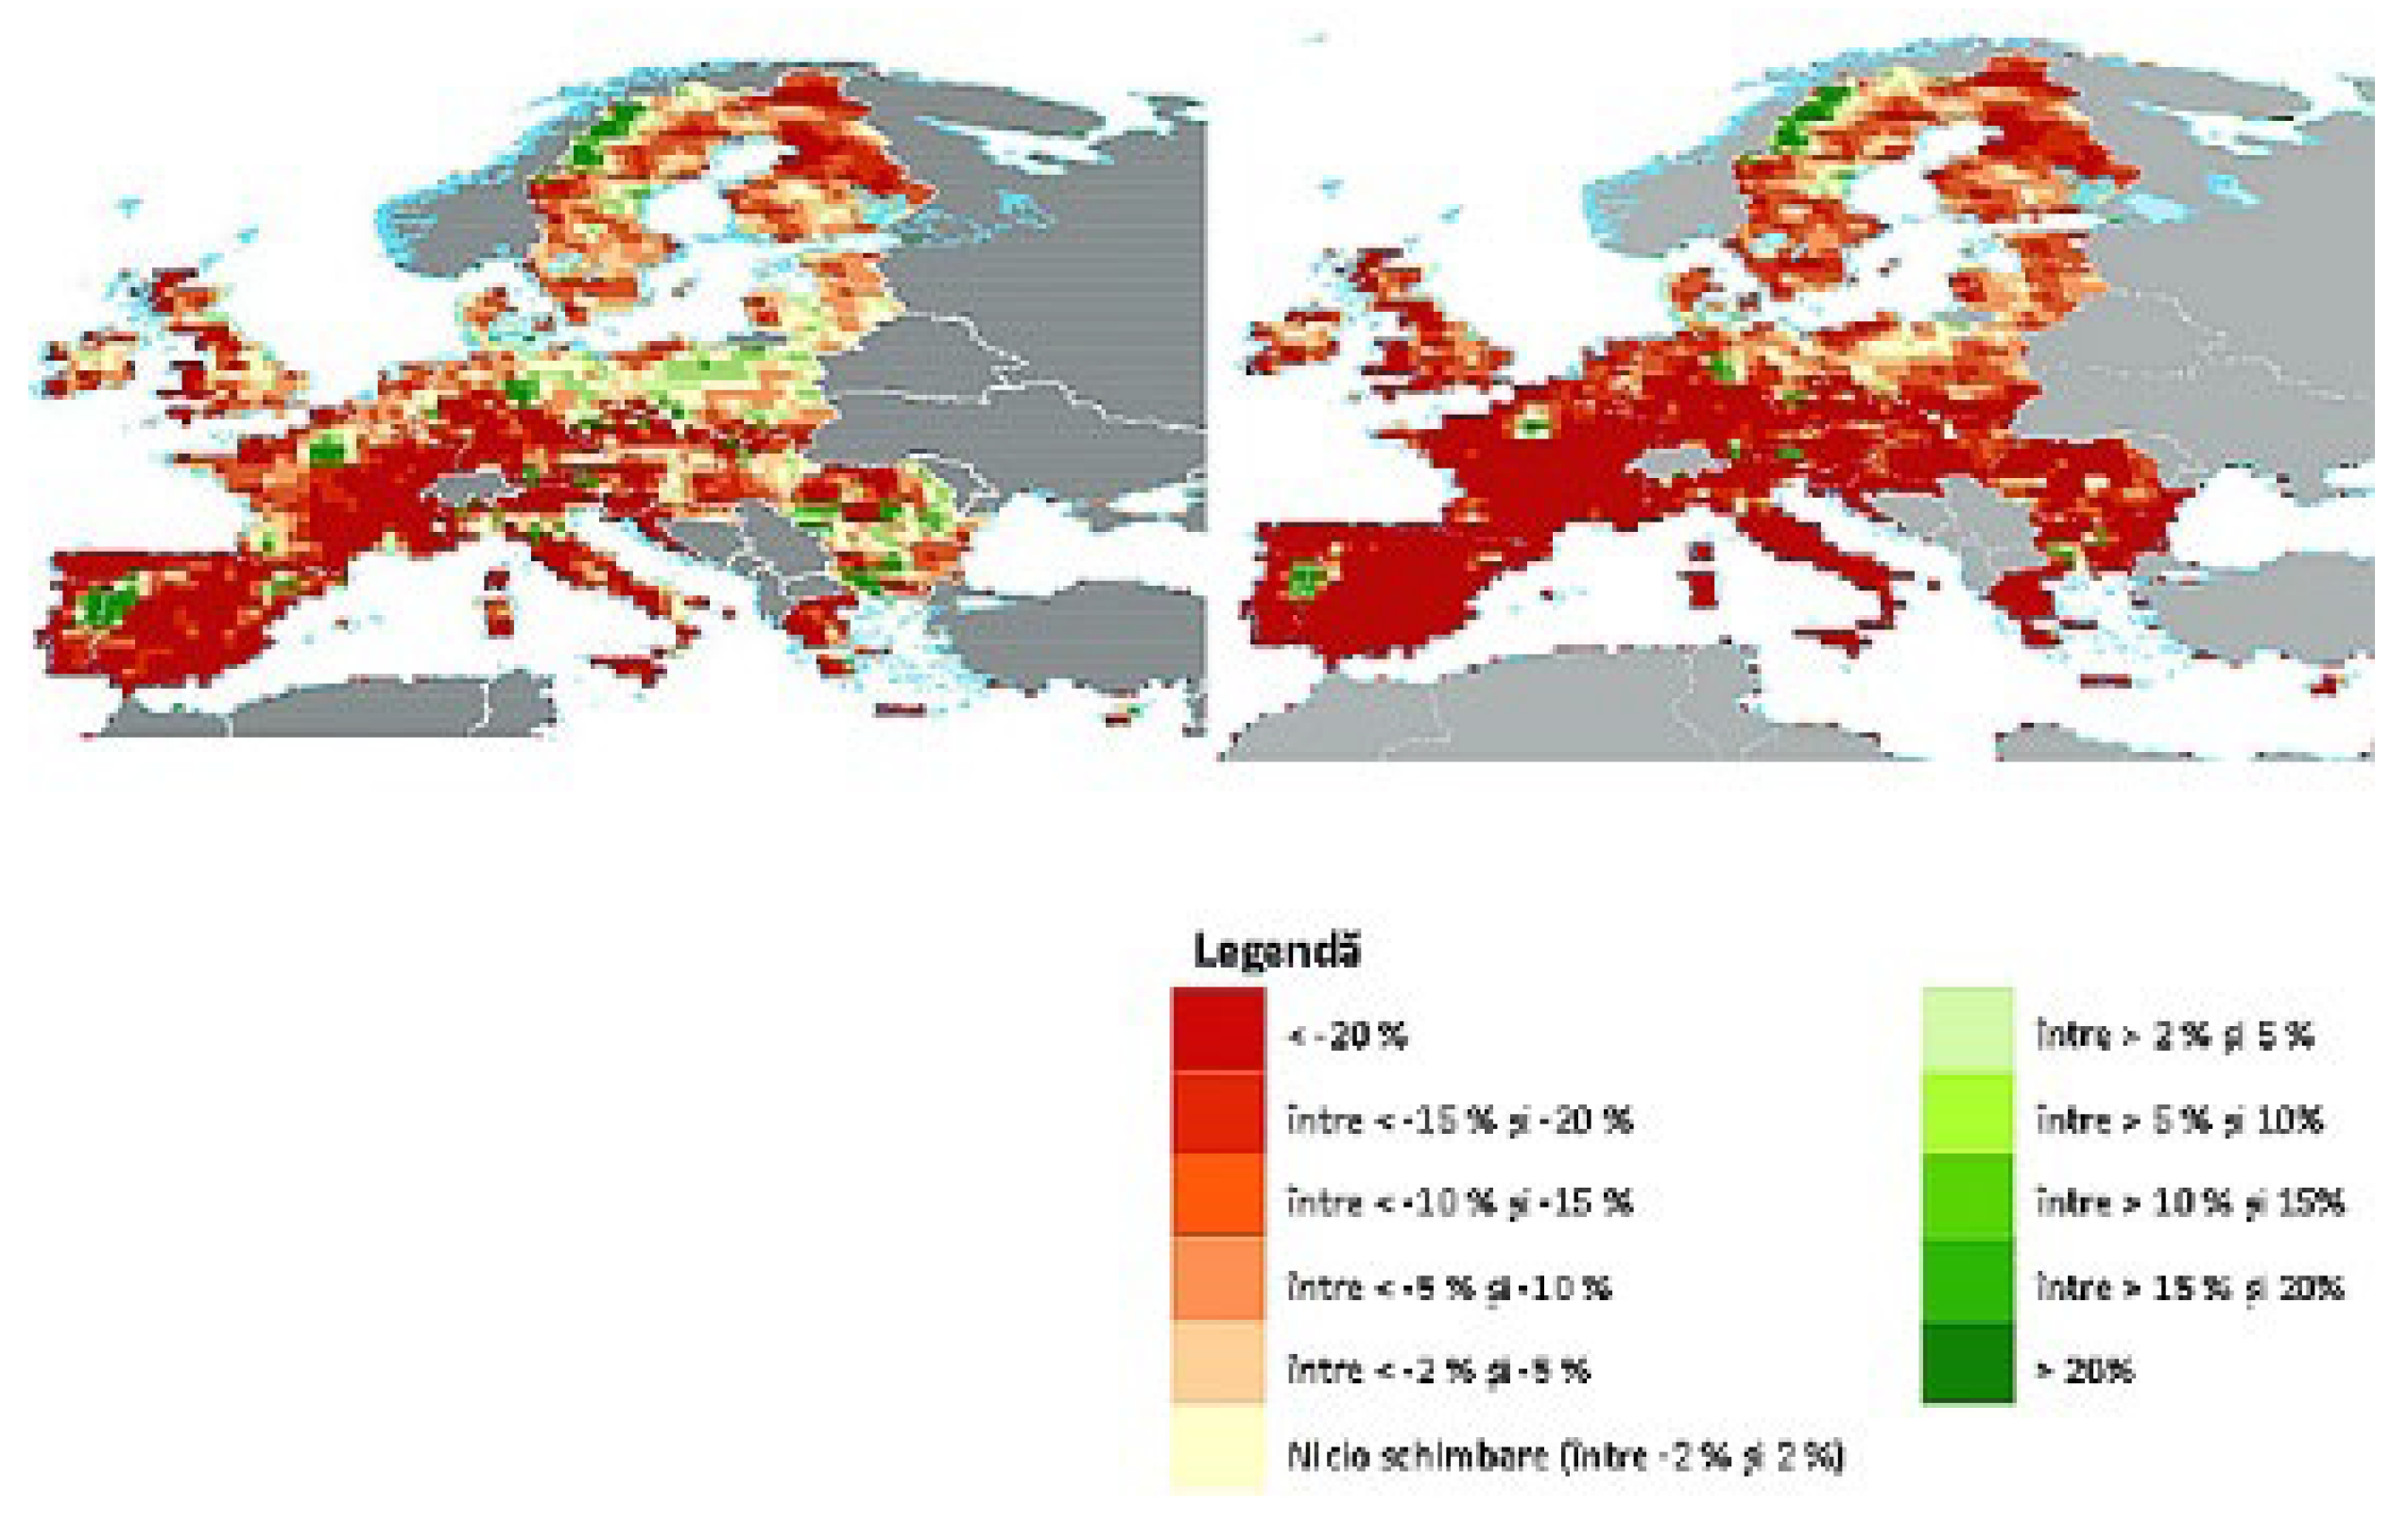
2.8. Availability of Water Resources
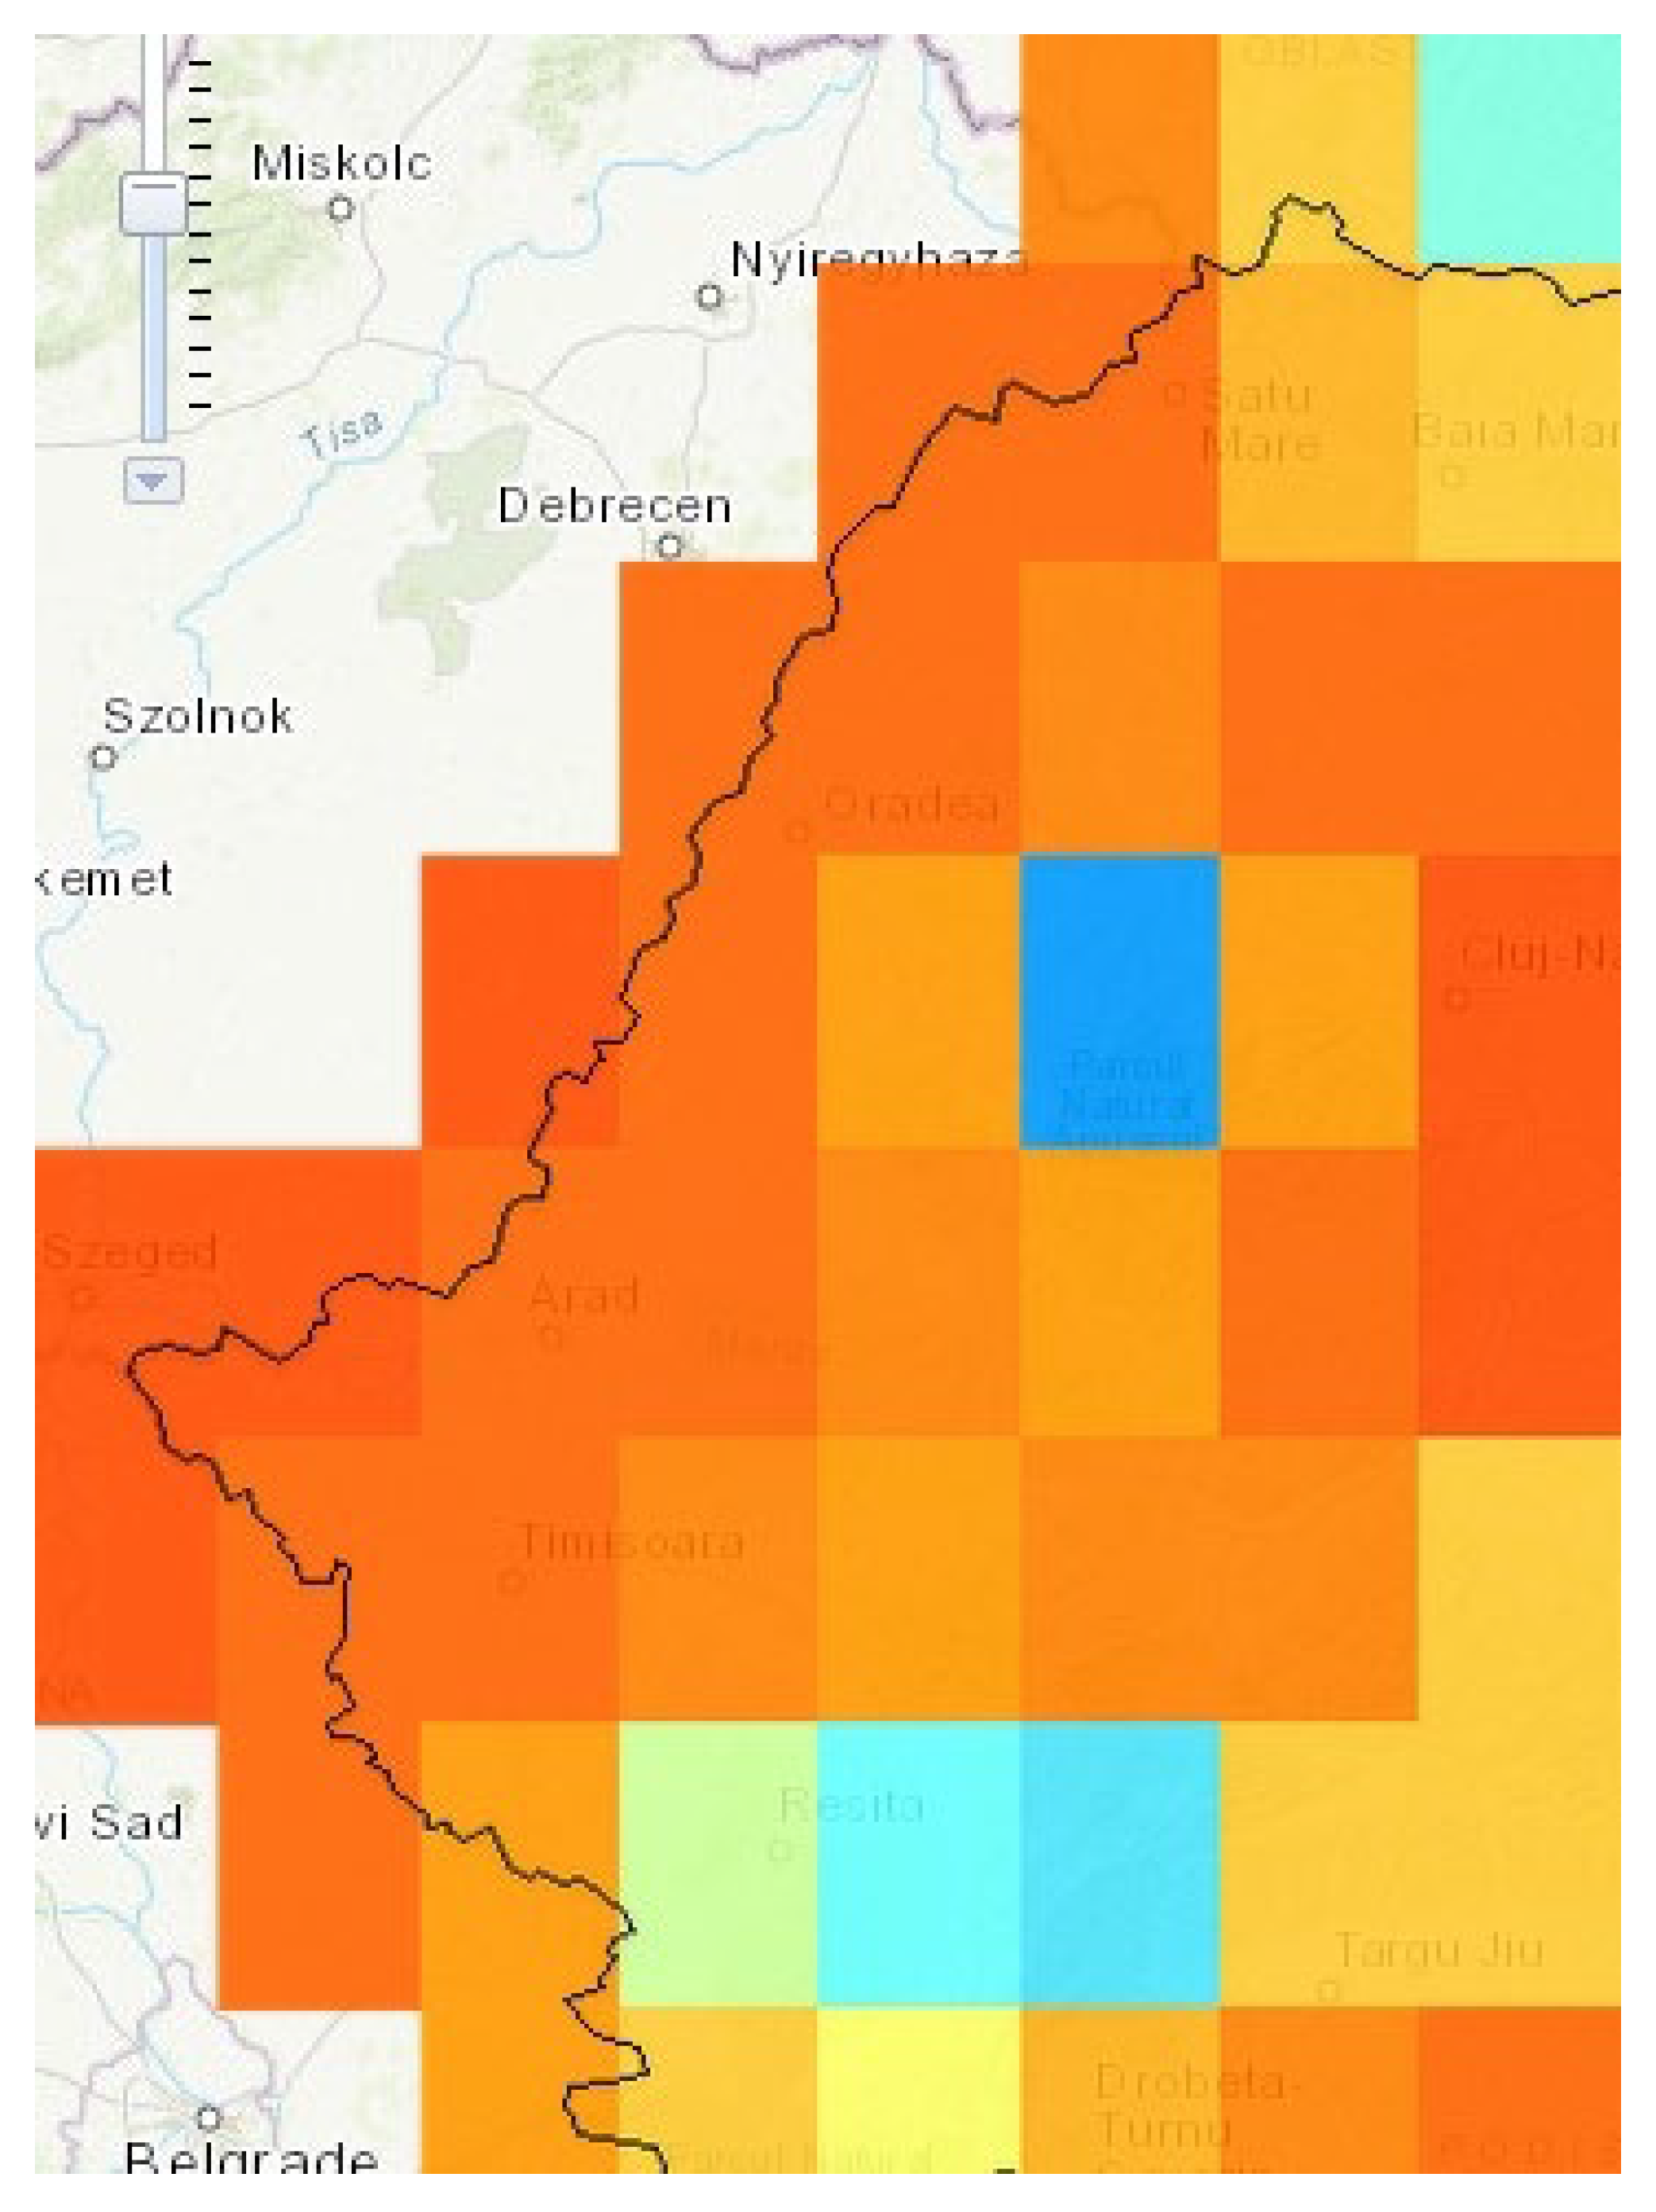
2.9. Desertification
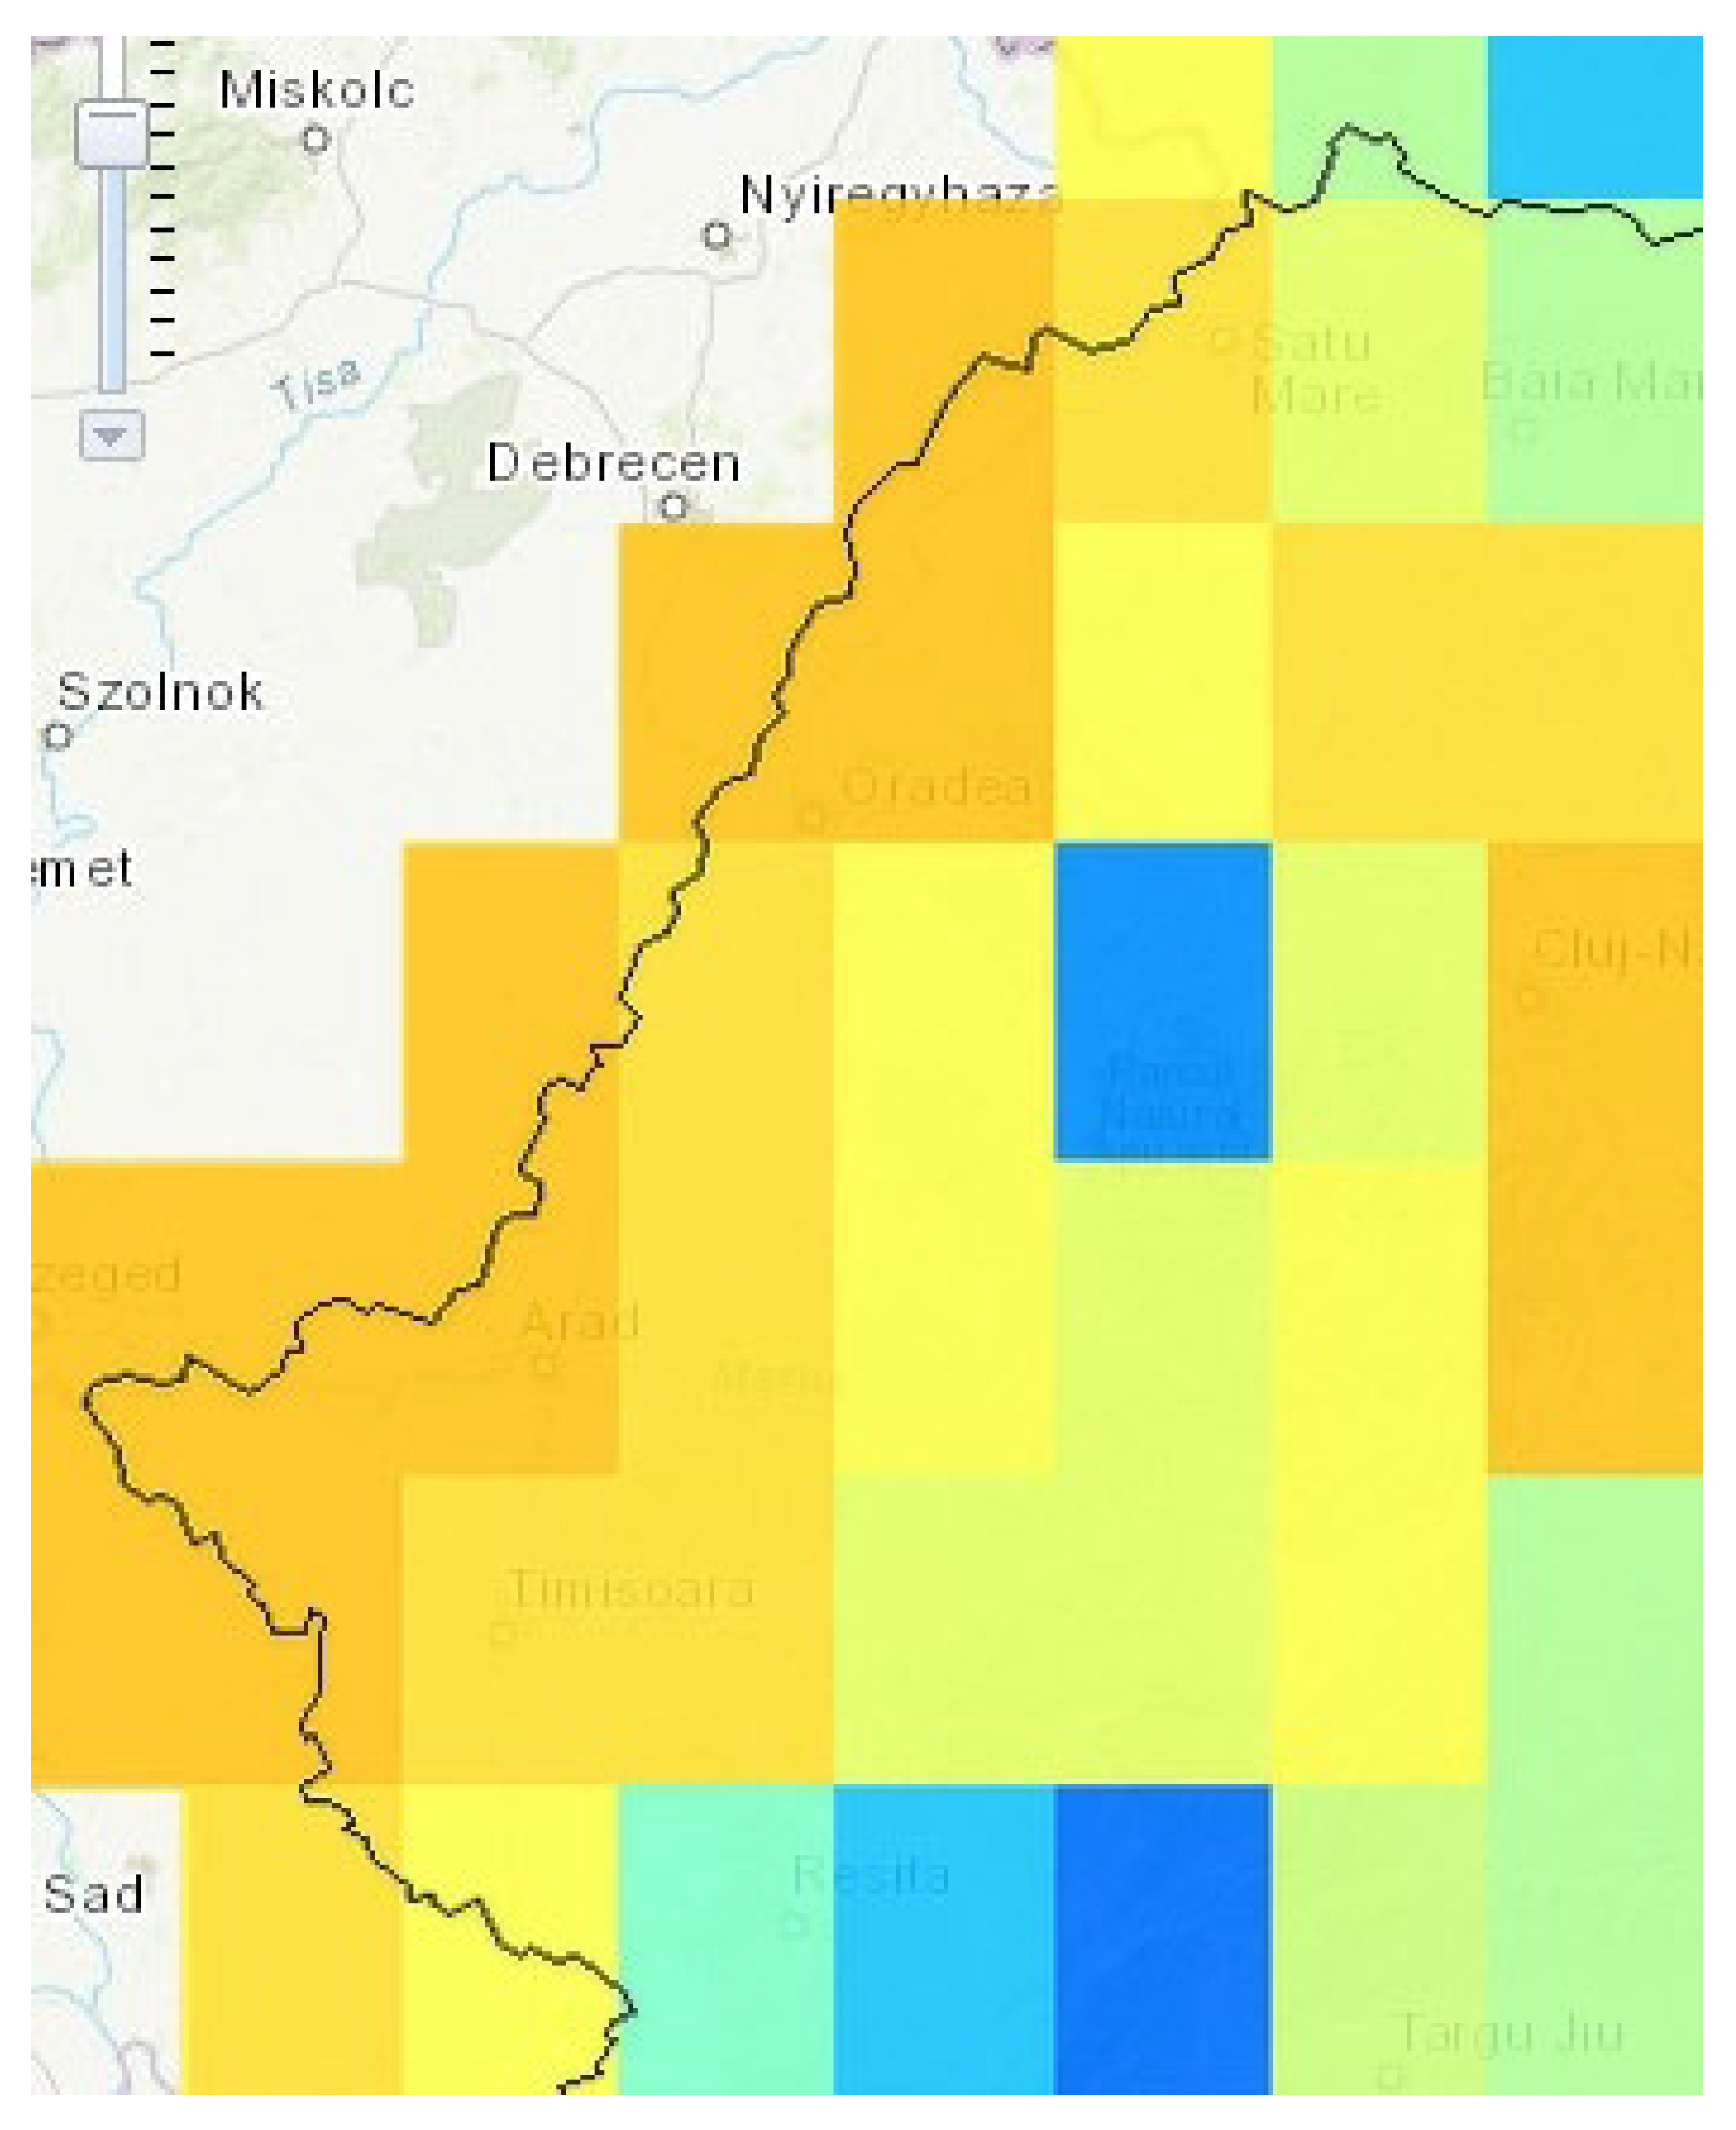
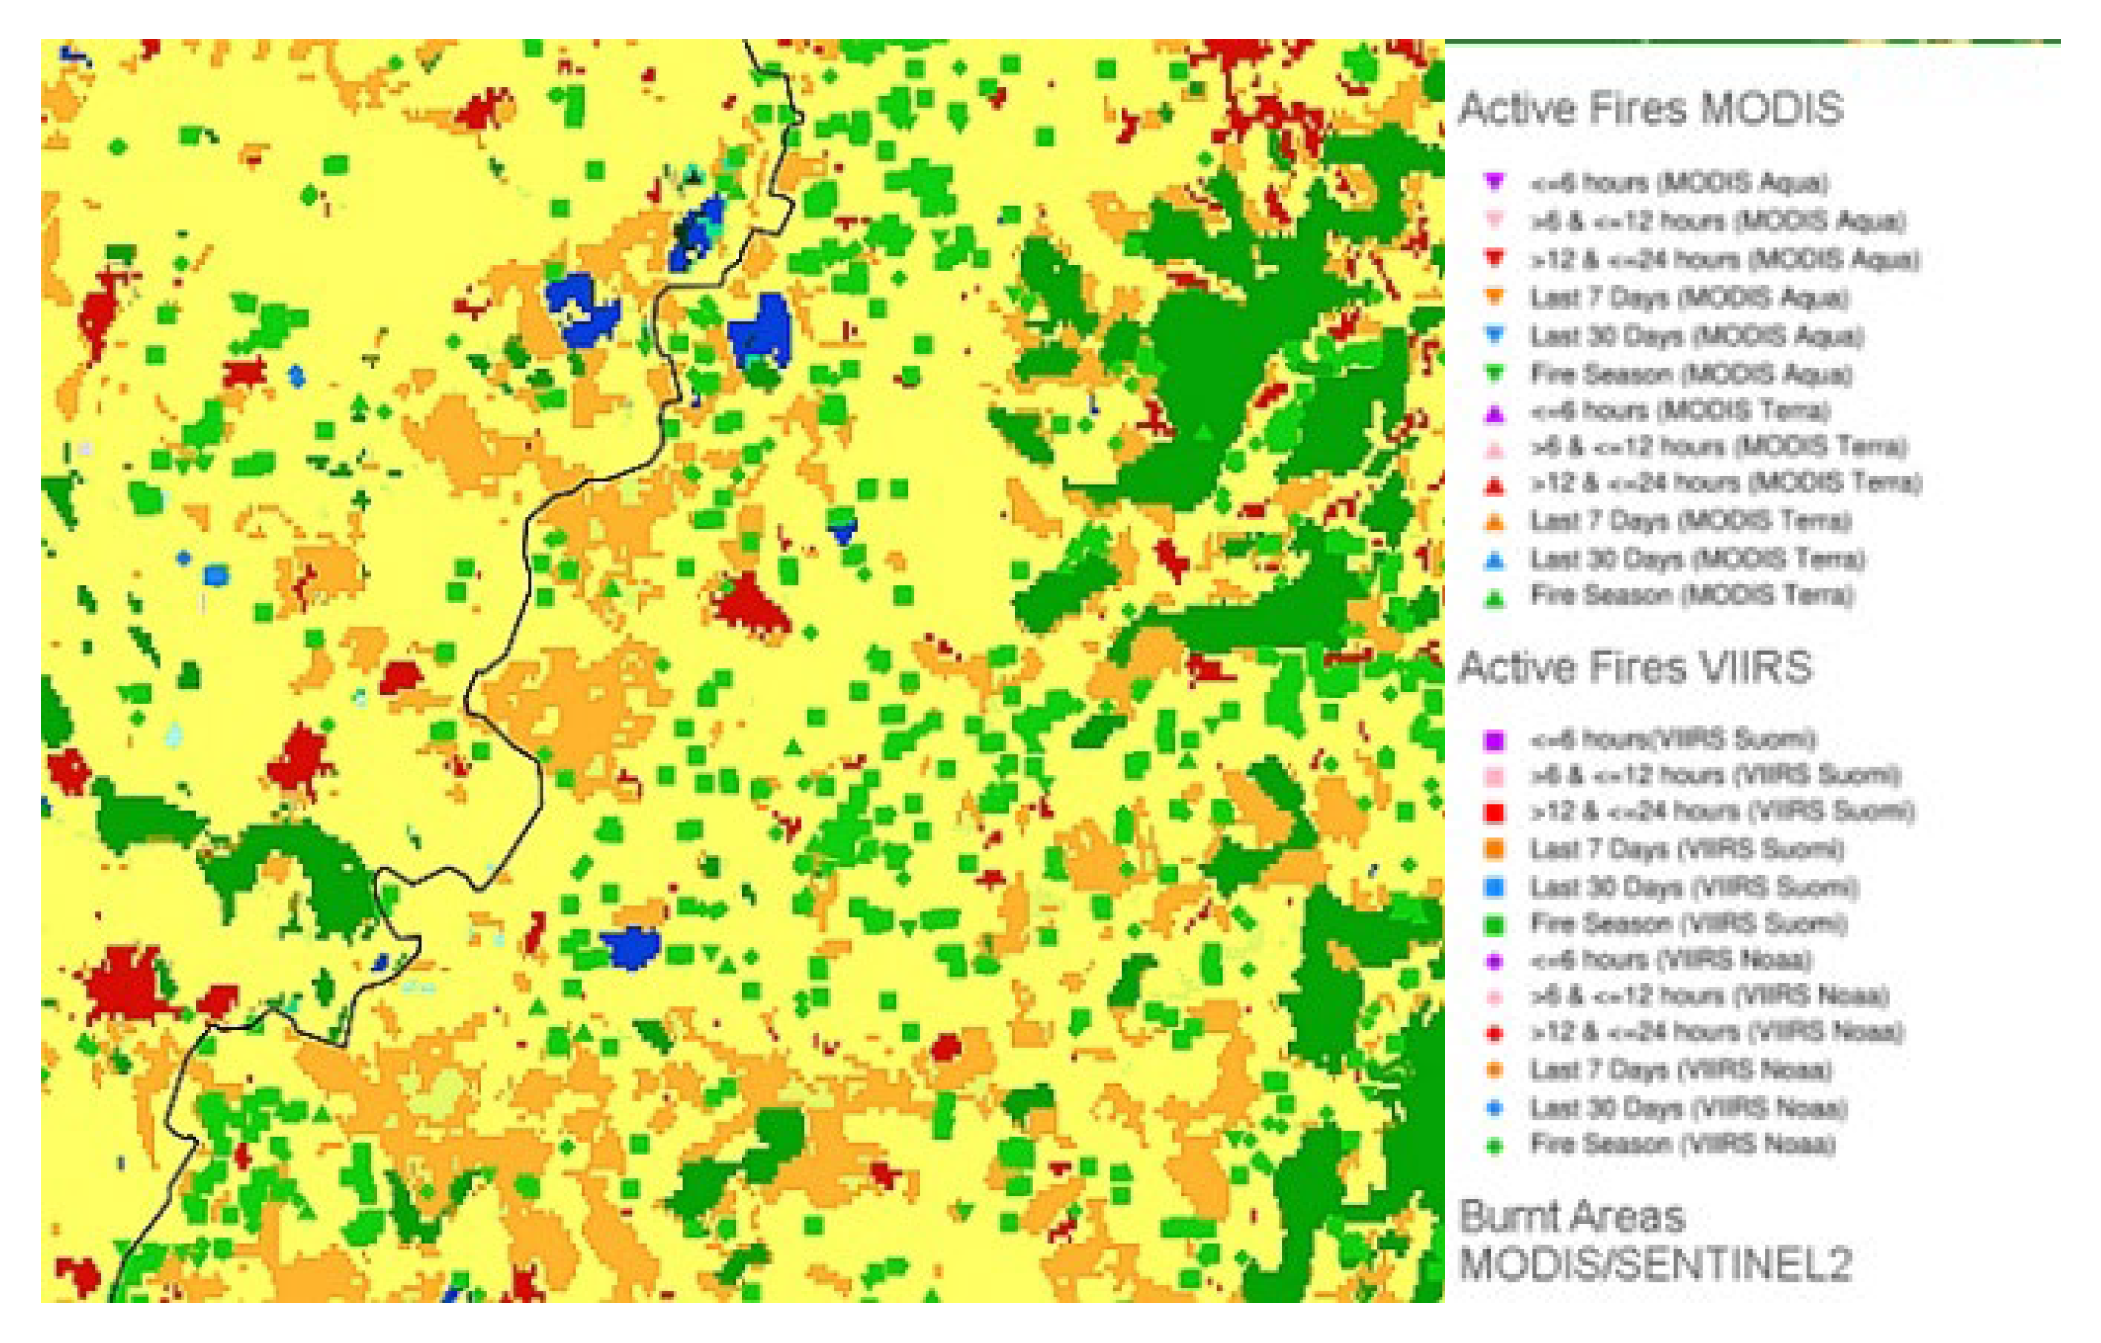
2.10. Risk of Vegetation Fire
3. Results
3.1. Sensitivity Analysis
- Goods and processes: animals, fodder, water, halls, manure storage systems;
- Outings: sacrificial animals, eggs, young animals, manure;
- Transport networks: infrastructure elements (road superstructure, telecommunications systems, water distribution system, sewerage system, gas distribution system).
3.2. Exposure Assessment
3.3. Vulnerability Analysis
3.4. Risk Assessment
4. Discussion
5. Conclusions
Author Contributions
Funding
Institutional Review Board Statement
Informed Consent Statement
Data Availability Statement
Conflicts of Interest
References
- Steinfeld, H.; Gerber, P.; Wassenaar, T.; Castel, V.; Rosales, M.; De Haan, C. Livestock’s Long Shadow; FAO: Rome, Italy, 2006; pp. 85–89. [Google Scholar]
- European Environment Agency. Climate Change Poses Increasingly Severe Risks for Ecosystems, Human Health and the Economy in Europe. 2016. Available online: https://www.eea.europa.eu/highlights/climate-change-poses-increasingly-severe (accessed on 22 April 2022).
- European Commission. Adaptation to Climate Change. Available online: https://ec.europa.eu/clima/eu-action/adaptation-climate-change_en (accessed on 26 March 2022).
- National Institute of Statistics. Available online: http://statistici.insse.ro:8077/tempo-online/#/pages/tables/insse-table (accessed on 22 April 2022).
- Mintas, O.; Vicaș, G. Razvi Farm Environmental Report; Bihor Environmental Protection Agency: Oradea, Romania, 2018; pp. 78–82. [Google Scholar]
- Bihor County Council. County Plan for Maintaining Air Quality; Bihor County Council: Oradea, Romania, 2021; pp. 8–14. [Google Scholar]
- Climate, D.G. Guidelines for Project Managers: Making Vulnerable Investments Climate Resilient. Available online: https://climate-adapt.eea.europa.eu/metadata/guidances/non-paper-guidelines-for-project-managers-making-vulnerable-investments-climate-resilient/guidelines-for-project-managers.pdf (accessed on 24 March 2022).
- CNRM-CM3, Model. Available online: http://climatewizard.ciat.cgiar.org/outputs/SanPedroData1/ (accessed on 28 April 2022).
- Guide on Adaptation to the Effects of Climate Change. Available online: https://climate-adapt.eea.europa.eu/metadata/guidances/guide-to-climate-change-adaptation-in-cities (accessed on 25 April 2022).
- Climate Change, Impacts and Vulnerability in Europe. 2016. Available online: https://www.eea.europa.eu/publications/climate-change-impacts-and-vulnerability-2016 (accessed on 24 April 2022).
- Climate Change—From Physical Bases to Risks and Adaptation. 2014. Available online: https://www.meteoromania.ro/ (accessed on 30 March 2022).
- Impact2C. Available online: https://www.atlas.impact2c.eu/en/climate/extreme-precipitation/ (accessed on 25 April 2022).
- Apele Romane. Available online: http://www.rowater.ro/EPRI/EPRI.aspx (accessed on 10 August 2021).
- Carpat-Clim. Available online: http://www.carpatclim-eu.org/pages/home/ (accessed on 21 April 2022).
- Consortium for Spatial Information. Available online: http://www.cgiar-csi.org/data/global-aridity-and-pet-database (accessed on 22 April 2022).
- National Institute of Hydrology and Water Management. National Administration of Romanian Waters. Available online: https://rowater.ro/ (accessed on 22 April 2022).
- Crisuri Water Basin Administration. Flood Risk Management Plan; Environment Agency: Bristol, UK, 2015; pp. 223–225. [Google Scholar]
- Adab, H.; Kanniah, K.D.; Solaimani, K. Modeling forest fire risk in the northeast of Iran using remote sensing and GIS techniques. Nat. Hazards 2013, 65, 1723–1743. [Google Scholar] [CrossRef]
- Copernicus Emergency Management Service. Available online: https://effis.jrc.ec.europa.eu/apps/effis_current_situation/ (accessed on 21 April 2022).
- European Landslide Susceptibility Map Version 2 (ELSUS v2). Available online: https://esdac.jrc.ec.europa.eu/content/european-landslide-susceptibility-map-elsus-v2 (accessed on 22 April 2022).
- Romanian Maps. Available online: http://www.geotutorials.ro/Harti-Romania/harta-romania-unitati-de-relief.jpg (accessed on 23 April 2022).
- Bojariu, R.; Bîrsan, M.V.; Cică, R.; Velea, L.; Burcea, S.; Dumitrescu, A.; Dascălu, S.I.; Gothard, M.; Dobrinescu, A.; Cărbunaru, F.; et al. Schimbările climatice. In Editura Printech, București; European Commission: Brussels, Belgium, 2015; pp. 68–71. [Google Scholar]
- AR6 Synthesis Report: Climate Change The Intergovernmental Panel on Climate Change. Available online: https://www.ipcc.ch/report/sixth-assessment-report-cycle/ (accessed on 25 April 2022).
- National Meteorological Agency. Anual Report. 2020. Available online: https://www.meteoromania.ro/despre-noi/raport-anual/ (accessed on 22 April 2022).
- National Meteorological Administration. A Guide to Adapting to the Effects of Climate Change. Available online: https://www.meteoromania.ro/anm/images/clima/SSCGhidASC.pdf (accessed on 22 April 2022).
- Donat, M.G.; Leckebusch, G.C.; Pinto, J.G.; Ulbrich, U. European storminess and associated circulation weather types: Future change deduced from multi-model ensemble of GCM simulations. Clim. Res. 2010, 42, 27–43. [Google Scholar] [CrossRef]
- Olimpia, M. The Wind Potential of the Oradea Metropolitan Area at the Level. In Proceedings of the Jubilee Session of the Meteorological Center, Oradea, Romania, 14–16 March 2007. [Google Scholar]
- Mintas, O.; Dalea, A.; Vicas, G. Environmental Report—Update of the General Urban Plan of Salonta Municipality; Bihor Environmental Protection Agency: Oradea, Romania, 2008; p. 23. [Google Scholar]
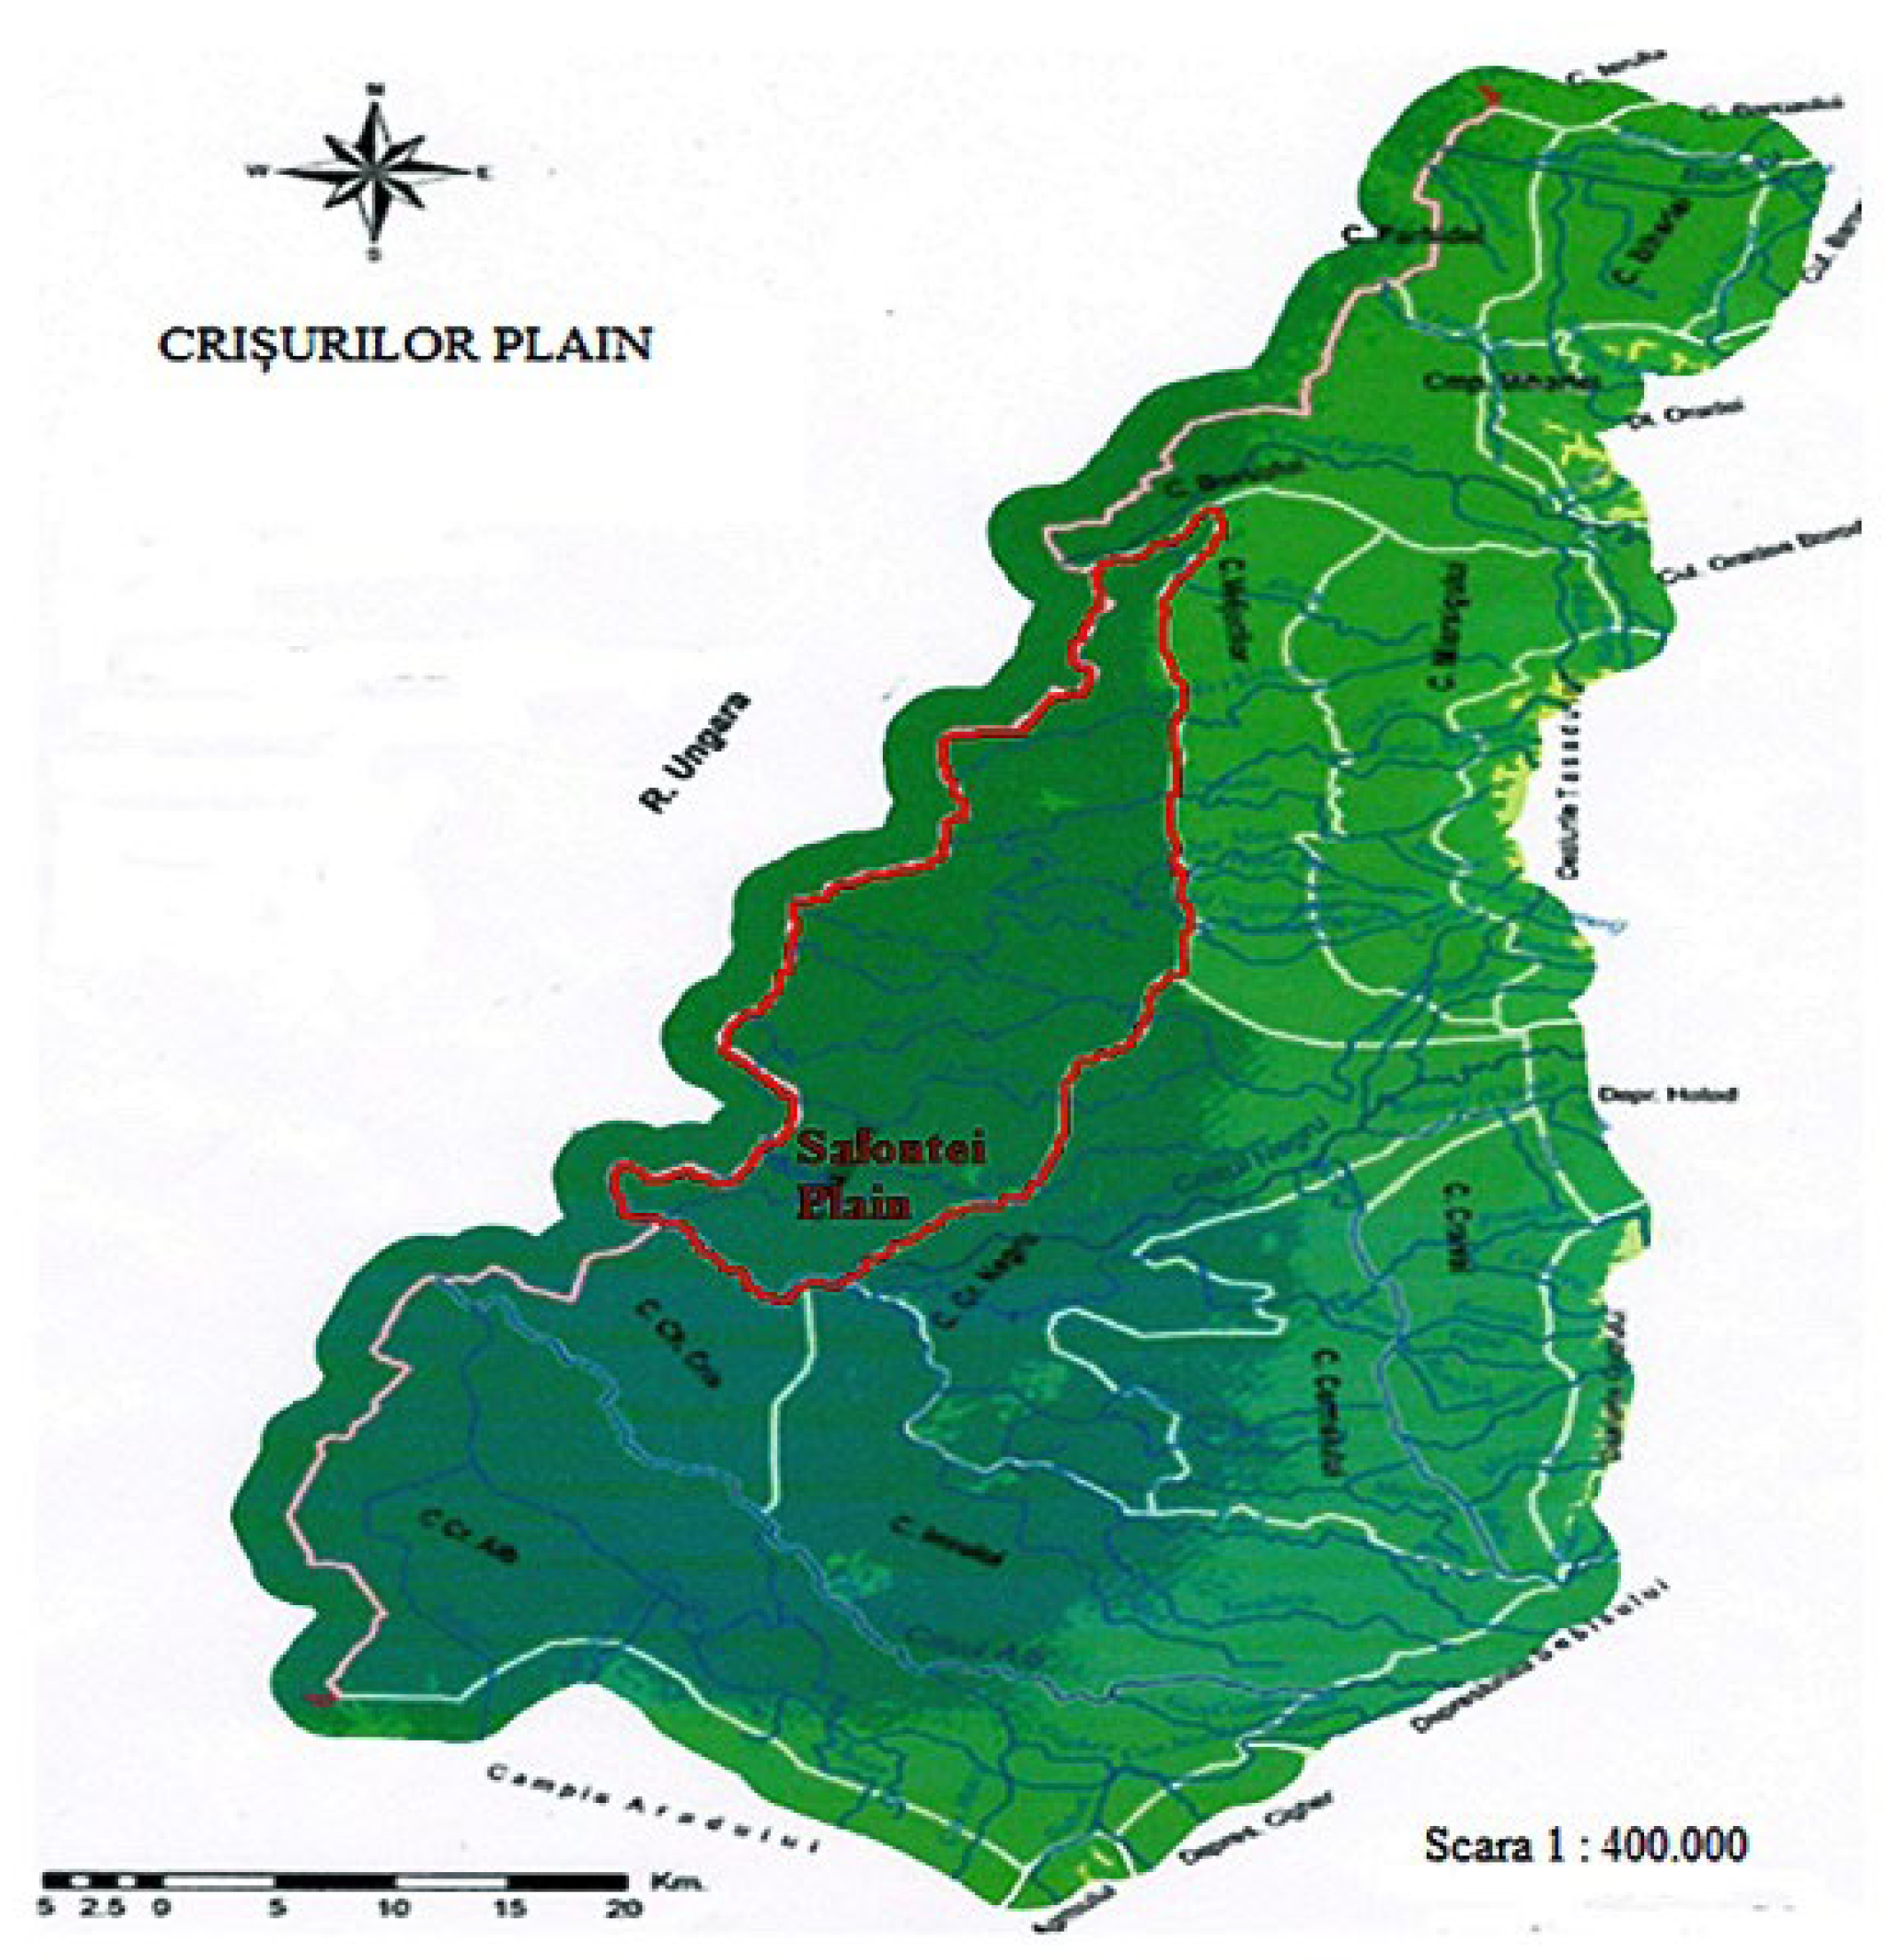
- Berindei, I.O.; Mahara, G.H.; Pop, G.R.P.; Posea, A. Campia Crisurilor. Crisul Repede. Tara Beiușului. Cercetări în Geografia României; Editura Didactica si Pedagogica: Oradea, Romania, 1977; p. 370. [Google Scholar]
- Crisuri Water Basin Administration. Basin Management Plan of the Crișuri River Basin; Crisuri Water Basin Administration: Oradea, Romania, 2022; p. 74. [Google Scholar]
- Pârvu, C. Environmental Encyclopedic Dictionary; Regia Autonomă Monitorul Oficial: Bucuresti, Romania, 2005; p. 36. [Google Scholar]
- Cherlet, M.; Hutchinson, C.; Reynolds, J.; Hill, J.; Sommer, S.; von Maltitz, G. World Atlas of Desertification: Rethinking Land Degradation and Sustainable Land Management; Publications Office of the European Union: Luxembourg, 2018; p. 265. [Google Scholar]
- Spinoni, J.; Barbosa, P.; Dosio, A.; McCormick, N.; Vogt, J. Is Europe at risk of desertification due to climate change? In Proceedings of the 20th EGU General Assembly, Viena, Austria, 4–13 April 2018; p. 9557. [Google Scholar]
- Gareth, R.; Olivier, P.; Katharina, B.; Victoria, G.; Colm, F.; Ramona, B.; Jan, H.; Paulo, B.; Antonio Caruda, R.; Marcos, H.; et al. Combating Desertification in the EU: A Growing Threat that Requires Further Action; European Court: Luxembourg, 2018; Available online: https://op.europa.eu/webpub/eca/special-reports/desertification-33-2018/ro/ (accessed on 10 April 2022).
- National Agency for Environmental Protection. Annual Environmental Report; National Agency for Environmental Protection: Piracicaba, Brazil, 2020. [Google Scholar]


| Land Use by Category | Land Use by Subcategory | Territorial Administrative Unit | Total | |
|---|---|---|---|---|
| Avram Iancu | Ciumeghiu | |||
| ha | ha | ha | ha | |
| Total area of agricultural land 16,732 | Arable | 6088 | 8596 | 14,684 |
| Pasture | 728 | 1120 | 1848 | |
| Finesse | 37 | 145 | 182 | |
| Vineyards | 15 | 0 | 15 | |
| Orchards | 3 | 0 | 3 | |
| Total area of non-agricultural land 2513 | Forests and other forest vegetation | 80 | 284 | 364 |
| Land occupied with surface water | 627 | 265 | 892 | |
| Land occupied by construction | 296 | 389 | 685 | |
| Communications and railways | 185 | 187 | 372 | |
| Degraded and unproductive land | 158 | 42 | 200 | |
| Total | 8217 | 11,028 | 19,245 | |
| Livestock Farm | Total Farm Capacity Heads/Series | Coordinates 70 STEREO | The Area of Agricultural Land Required for Manure Spreading | |
|---|---|---|---|---|
| lat.N | long.E | ha | ||
| Intensive poultry farm Nutripui | 600,000 | 589,566 | 240,222 | 1059 |
| Intensive poultry farm Nutripasăre | 600,000 | 589,535 | 240,099 | 1059 |
| Intensive pig farm Pedagro Ferme | 12,000 | 585,419 | 244,431 | 911 |
| Intensive cattle farm PFA Suciu Viorel | 200 | 586,139 | 240,447 | 103 |
| Pig breeding farm Star Repro | 1200 | 586,011 | 241,759 | 189 |
| Intensive sheep farm PFA Suciu Alina | 400 | 586,139 | 240,559 | 39 |
| Intensive poultry farm AviaFarm | 58,000 | 586,491 | 240,031 | 102 |
| Intensive poultry farm Multiagrofield | 55,500 | 585,323 | 244,687 | 98 |
| Intensive poultry farm Erdenor Fermagro | 58,000 | 585,803 | 242,703 | 102 |
| Intensive poultry farm Razvi-Farm | 58,000 | 586,939 | 240,127 | 102 |
| Breeding laying hens Grupul de producători carne pasăre Nutrientul | 66.000 | 580,554 | 232,366 | 291 |
| Laying hen farm Grupul de producători carne pasăre Nutrientul | 84,000 | 584,219 | 237,022 | 311 |
| Laying hen farm Grupul de producători carne pasăre Nutrientul | 66,000 | 586,843 | 235,278 | 245 |
| Laying hen farm Grupul de producători carne pasăre Nutrientul | 360,000 | 587,563 | 235,358 | 1334 |
| Total | 5945 | |||
| Compound | No Sensitivity (0) | Small (1) | Medium (2) | High (3) |
|---|---|---|---|---|
| input—young animals, water, feeds, treatments | No impact on the analyzed activities | Minor disturbances of production processes | Moderate disturbances in the supply of young animals, feeds and water (not more than 15 min), without a significant decrease (by more than 5% of animal production) | Significant disruptions to the supply chain with a significant decrease in productivity of livestock farms by more than 10% |
| outings—animals for sale/slaughter/eggs/manure | No impact on the analyzed activities | Minor impact on farms—livestock production | Moderate impact on the productivity of livestock activities | Major impact on activity with a significant decrease in productivity of livestock farms by more than 10% |
| transport/infrastructure | No impact on the analyzed activities | Decommissioning of the transport infrastructure for a maximum of 24 h, with a minor impact on the farms in the area | Decommissioning of transport infrastructure for 1 day, with medium impact on livestock farms | Decommissioning of transport infrastructure for more than 1 day, with major impact on the activity of livestock farms |
| Exposure | ||||
|---|---|---|---|---|
| No Exposure (0) | Low (1) | Average (2) | High (3) | |
| Exposure to current conditions | Coincidence never manifested | Coincidence has occurred once in the last 25 years | Coincidence has occurred twice in the last 10 years | Coincidence has manifested itself every year for the past 5 years |
| Exposure to current conditions | The data collected so far do not suggest a negative trend (increase or decrease, as appropriate) | The data collected so far suggest a slight negative trend (increase or decrease, as appropriate) | The data collected so far suggest a negative trend (increase or decrease, as appropriate) | The data collected so far suggest a significant trend of negative evolution (increase or decrease, as the case may be) |
| Exposure to future conditions | The hazard will not occur in the future in the location (s) analyzed due to climate change | Coincidence is unlikely to occur more frequently in the future due to climate change | Coincidence may occur more frequently in the future due to climate change | Coincidence will occur more frequently in the future due to climate change |
| Exposure | |||||
|---|---|---|---|---|---|
| No Exposure (0) | Low (1) | Average (2) | High (3) | ||
| Sensitivity | No sensitivity (0) | 0 | 0 | 0 | 0 |
| Small (1) | 0 | 1 | 2 | 3 | |
| Average (2) | 0 | 2 | 4 | 6 | |
| High (3) | 0 | 3 | 6 | 9 | |
| The legend: | |||||
| Vulnerability | no vulnerability (0) | reduced (1–2) | average (3–4) | high (6–9) |
| Magnitude of Consequences (M) | ||||
|---|---|---|---|---|
| 1 | 2 | 3 | ||
| Probability of occurrence (P) | 1 | 1 | 2 | 3 |
| 2 | 2 | 4 | 6 | |
| 3 | 3 | 6 | 9 | |
| The legend: | ||||
| Risk level | (1–3 Reduced) | (4–6) Moderate | (7–9) High | |
| 1 | 2 | 3 |
|---|---|---|
| Unlikely | Probable | Almost certain |
| Low probability of occurrence | Coincidence has occurred and is likely to occur | The coincidence has appeared before, and it is almost certain that it will appear again |
| 1 | 2 | 3 |
|---|---|---|
| Minority | Moderate | Catastrophic |
| Event with minor adverse effects on normal operation, which can be removed by routine maintenance or by changing operations | Event with moderate negative consequences on normal operation, which requires investment and may require adaptation measures | Disaster that can lead to the interruption of services and/or the destruction of some components of the systems with a major impact on local communities, which requires adaptation measures |
| Variable | Methodology |
|---|---|
| Temperature | GIS analysis: identification of areas with high temperatures and the highest estimated increases in summer and areas with low temperatures in winter and estimated changes [7,8]. |
| Profile literature analysis [9,10,11]. | |
| Rainfall | GIS analysis: the evolution of annual rainfall and extreme rainfall [7,12]. |
| Profile literature analysis [10,13]. | |
| Wind speed | GIS analysis: Identifying areas where high wind speeds are recorded [14]. |
| Profile literature analysis [11]. | |
| Availability of water resources | GIS analysis: identification of aridity index distribution and potential evapotranspiration [15]. |
| Floods | GIS analysis: identification of areas at high risk of flood exposure [16]. |
| Data and information from the responsible authorities [17]. | |
| Risk of vegetation fires | Hybrid Fire Index Calculation [18,19]. |
| Landslides | GIS analysis: identification of areas at high risk of landslide exposure [20]. |
| Land erosion | GIS analysis: identification of areas at high risk of land erosion exposure [21]. |
| Weather Station | Cardinal Direction | |||||||
|---|---|---|---|---|---|---|---|---|
| N | NE | E | SE | S | SW | W | NW | |
| Oradea | 9,0 | 4,8 | 6,7 | 10,9 | 18,3 | 15,4 | 7,0 | 5,4 |
| Chișineu Criș | 12,9 | 4,5 | 5,2 | 6,6 | 12,2 | 9,0 | 6,4 | 4,1 |
| Holod | 13,3 | 12,6 | 12,4 | 2,2 | 5,0 | 12,5 | 8,9 | 3,9 |
| Weather Station | Month | |||||||||||
|---|---|---|---|---|---|---|---|---|---|---|---|---|
| I | II | III | IV | V | VI | VII | VIII | IX | X | XI | XII | |
| Oradea | 3 | 3,1 | 3,3 | 3,4 | 3 | 2,7 | 2,5 | 2,3 | 2,4 | 2,6 | 2,9 | 3,1 |
| Chișineu Criș | 2,1 | 2,3 | 2,4 | 2,7 | 2,5 | 2,1 | 1,9 | 1,6 | 1,7 | 1,8 | 1,9 | 2,2 |
| Holod | 1,8 | 2,3 | 2,7 | 2,7 | 2,4 | 2,2 | 2 | 2 | 1,9 | 2 | 2 | 1,9 |
| Climate Variables | Livestock Farms | ||
|---|---|---|---|
| Goods and Processes | Outings | Transport Networks | |
| Primary effects | |||
| Rising average temperature | 3 | 2 | 1 |
| Rising extreme temperatures | 2 | 2 | 1 |
| Changes in average rainfall | 2 | 1 | 2 |
| Changes in the amount of extreme rainfall | 2 | 1 | 2 |
| Average wind speed | 1 | 1 | 1 |
| Changes in maximum wind speed | 1 | 1 | 1 |
| Moisture | 1 | 1 | 1 |
| Solar radiation | 1 | 1 | 1 |
| Secondary effects | |||
| Hoses (including blizzard) | 1 | 1 | 1 |
| Floods | 1 | 2 | 2 |
| Desertification | 2 | 2 | 1 |
| Soil erosion | 1 | 1 | 1 |
| Vegetation fires | 1 | 1 | 1 |
| Landslides | 1 | 1 | 1 |
| Freeze–thaw | 1 | 1 | 1 |
| The legend: | |||
| Climate sensitivity | Small (1) | Average (2) | High (3) |
| Climate Variable | Trend |
|---|---|
| Average annual temperature |  |
| Extreme temperatures |  |
| Average annual rainfall |  |
| Extreme rainfall |  |
| Wind speed |  |
| Desertification |  |
| Climate Variables | Exposure to Current Conditions | Exposure to Future Conditions | ||
|---|---|---|---|---|
| Primary effects | ||||
| Rising average temperature | 1 | In the period 1906–2005 in Romania, there was an increase in the average air temperature of 0.5 °C. | 2 | In the study area, it is possible that the air temperature in the period 2071–2100 will increase by 3–4 °C compared to the reference period of 1971–2000. |
| Rising extreme temperatures | 2 | Reducing the frequency of very low temperatures and increasing the frequency of very high temperatures. Significant trend of increasing the number of days with heat waves. | 2 | An increase in the maximum temperature of July by 4–5 °C for Bihor County. An increase in the January minimum temperature by 4–4.5 °C. Decreasing the duration and frequency of heat waves. The average annual number of days with episodes of heat waves in the period 2021–2065 compared to the period 1971–2000 will be lower by 0–0.02 days/year. Increase in the number of tropical nights by up to 6 nights/year in the interval 2021–2065 compared to the reference interval of 1971–2000. |
| Changes in average rainfall | 1 | General tendency of decreasing annual precipitation quantities in Romania in the period 1901–2000. | 2 | An increase in the annual precipitation quantities compared to the current level by 0–10 mm/year in Bihor County. |
| Changes in the amount of extreme rainfall | 2 | Extreme rainfall with values of 15–20 mm/day. | 2 | Stagnation of extreme precipitation in Bihor County. Increasing the number of days with rainfall exceeding 20 l/mp in 2021–2065 by 1.5 days. |
| Average wind speed | 1 | The average annual wind speed in the study area is generally 2–4 m/s. No clear trends were identified. | 1 | Reduced increase in average annual wind speed of 1 m/s. |
| Changes in maximum wind speed | 0 | No clear trends were identified. | 1 | Slight increase in the frequency of strong winds (with speeds greater than 10 m/s)—1–2% compared to the current situation. |
| Secondary effects | ||||
| Availability of Water Resources/Drought | 1 | Crisuri River Basin is subject to the phenomenon of hydrological drought. | 2 | The intensification of extreme phenomena (extreme temperatures, heat waves, extreme rainfall, periods of drought) can lead to seasonal variations in water resources and an increase in pressure on them |
| Soil Erosion | 0 | Natural erosion phenomena are not present in the analyzed area. There are only areas marked by weak erosion processes that are influenced by water regimes, crop structures, soil processing technology, other human activities (e.g., overgrazing), etc. | 1 | Increasing variation in the structure and intensity of precipitation can make soils more susceptible to water erosion and increasing aridity can make finely textured soils more vulnerable to wind erosion. However, quantitative estimates are not available. |
| Landslides | 0 | Low risk of landslides in the analyzed area. | 1 | Possible intensification of this phenomenon. |
| Extreme storms/tornadoes | 0 | No clear trends were identified. | 0 | No clear trends were identified. |
| Floods | 1 | An analysis of the current flood risk map in the 3 occurrence scenarios indicates that the analyzed area will become completely floodable in the 5% scenario. | 2 | The study area estimates an increase in the magnitude of floods with values between 20 and 30% by 2080. |
| Desertification | 0 | No clear elements have been reported so far to highlight desertified areas. | 2 | The analysis of the desertification forecast in the two scenarios indicates that in both variants the agricultural surface of the analyzed area on which the mature manure from the activity of the zootechnical farms can be spread decreases. |
| Risk of Vegetation Fire | 0 | The territory of the analyzed area is characterized by a low risk of present fire. | 1 | The territory of the analyzed area is characterized by a low risk of fire in the future. |
| Climate Variable | Sensitivity | Exposure to Current Conditions | Vulnerability to Current Conditions | ||||
|---|---|---|---|---|---|---|---|
| Input | Outputs | Transport/Infrastructure | Input | Outputs | Transport/Infrastructure | ||
| Primary effects | |||||||
| Rising average temperature | 2 | 2 | 1 | 1 | 2 | 2 | 1 |
| Rising extreme temperatures | 1 | 1 | 1 | 1 | 1 | 1 | 1 |
| Changes in average rainfall | 2 | 2 | 1 | 1 | 2 | 2 | 1 |
| Changes in the amount of extreme rainfall | 1 | 1 | 1 | 1 | 1 | 1 | |
| Average wind speed | 1 | 1 | 1 | 1 | |||
| Changes in maximum wind speed | 1 | 1 | 1 | ||||
| Secondary effects | |||||||
| Availability of Water Resources/Drought | 2 | 2 | 2 | 1 | 2 | 2 | 2 |
| Soil Erosion | 1 | 1 | 1 | 1 | |||
| Extreme storms/tornadoes | 1 | 1 | |||||
| Floods | 1 | 2 | 1 | 1 | 1 | 2 | 1 |
| Desertification | 2 | 2 | 1 | 1 | 1 | 1 | 1 |
| Risk of Vegetation Fire | 1 | 1 | 1 | 1 | |||
| The Legend: | |||||||
| Sensitivity | without sensitivity (0) | small (1) | medium (2) | high (3) | |||
| Exposure | no exposure (0) | small (1) | medium (2) | high (3) | |||
| Vulnerability | no vulnerability (0) | small (1) | medium (2) | high (3) | |||
| Climate Variable | Sensitivity | Exposure to Future Conditions | Vulnerability to Future Conditions | ||||
|---|---|---|---|---|---|---|---|
| Input | Outputs | Transport/Infrastructure | Input | Outputs | Transport/Infrastructure | ||
| Primary effects | |||||||
| Rising average temperature | 2 | 2 | 1 | 3 | 3 | 3 | 3 |
| Rising extreme temperatures | 1 | 1 | 1 | 2 | 2 | 2 | 2 |
| Changes in average rainfall | 2 | 2 | 1 | 2 | 2 | 2 | 2 |
| Changes in the amount of extreme rainfall | 1 | 1 | 1 | 1 | 1 | 1 | |
| Average wind speed | 1 | 1 | 1 | 1 | 1 | 1 | |
| Changes in maximum wind speed | 1 | 1 | 1 | 1 | 1 | 1 | |
| Secondary effects | |||||||
| Availability of Water Resources/Drought | 2 | 2 | 2 | 3 | 3 | 3 | 2 |
| Soil Erosion | 1 | 1 | 2 | 1 | 2 | 2 | |
| Extreme storms/tornadoes | 1 | 1 | 1 | 1 | 1 | ||
| Floods | 1 | 2 | 1 | 3 | 2 | 3 | 2 |
| Desertification | 2 | 2 | 1 | 3 | 3 | 2 | |
| Risk of Vegetation Fire | 1 | 1 | 2 | 1 | 1 | 2 | |
| The Legend | |||||||
| Sensitivity | without sensitivity (0) | small (1) | medium (2) | high (3) | |||
| Exposure | no exposure (0) | small (1) | medium (2) | high (3) | |||
| Vulnerability | no vulnerability (0) | small (1) | medium (2) | high (3) | |||
| Climate Variable | Trends in Climate Variable | Possible Impacts/Consequences on Livestock Farms |
|---|---|---|
| Temperature | Temperature change (annual average, extreme), availability of water resources, drought and desertification | Increased operating costs; Decreasing the usable land area for manure spreading; Changing the conditions of emission and dispersion in the atmosphere of air pollutants resulting from the activity of increasing manure (NH3, NO2, NMVOC, TSP, PM10, PM2.5); |
| Rainfall | Changing average annual rainfall and extreme rainfall, floods, availability of water resources, drought | Exceeding the designed capacity of the infrastructure for rainwater collection and pre-treatment; Exceeding the designed capacity of the manure storage infrastructure; Flooding of certain parts of the road with consequences on the supply/delivery chain; Reducing the lifespan of animal husbandry farms; Increasing operating costs (repair costs, emergency services). |
| Compound | Risk | Risk Score | ||
|---|---|---|---|---|
| Probability (P) | Magnitude (M) | P × M | ||
| High vulnerability for livestock farms | Rising average temperature | 3 The data show a clear trend of increasing temperatures and periods of drought in the study area | 2 The consequences may be negative and adaptation measures may be envisaged | 6 |
| Availability of Water Resources/Drought | 3 The data indicate a clear trend of intensification of extreme phenomena (extreme temperatures, heat waves, extreme rainfall, periods of drought) leading to seasonal variations in water resources and increasing pressure on them | 2 The consequences may be negative and adaptation measures may be envisaged | 6 | |
| Floods | 3 An increase in the intensity and frequency of floods is possible due to the increase in the frequency of episodes with extreme rainfall | 2 The consequences may be negative and adaptation measures may be envisaged | 6 | |
| Desertification | 3 The data show a declining trend in agricultural area in the area | 2 The consequences can be negative and adaptation measures can be considered by identifying new waste management techniques | 6 | |
| Medium vulnerability for livestock farms | Rising extreme temperatures | 2 The data show a clear trend of increasing temperatures and the number of dry days in the analyzed area | 2 The consequences may be negative and adaptation measures may be envisaged | 4 |
| Changes in average rainfall | 2 The data estimate a trend of increasing extreme rainfall and decreasing average rainfall | 2 The consequences may be negative and adaptation measures may be envisaged | 4 | |
| Soil Erosion | 2 Increased variation in precipitation structure and intensity may make soils more susceptible to water erosion, and increased aridity may make finely textured soils more vulnerable to wind erosion | 1 Event with minor negative consequences on normal operations | 2 | |
| Risk of Vegetation Fire | 2 The data do not show a clear trend, but an increase in the risk of vegetation fires is possible due to rising temperatures and heat waves | 1 Event with minor negative consequences on normal operations | 2 | |
| Magnitude of Consequences (M) | ||||
|---|---|---|---|---|
| 1 | 2 | 3 | ||
| Probability of occurrence (P) | 1 | 1 | 1 | 1 |
| 2 | Soil Erosion Risk of Vegetation Fire | Rising extreme temperatures Changes in average rainfall | 2 | |
| 3 | 1 | Rising average temperature Availability of water resources/drought Floods Desertification | 3 | |
Publisher’s Note: MDPI stays neutral with regard to jurisdictional claims in published maps and institutional affiliations. |
© 2022 by the authors. Licensee MDPI, Basel, Switzerland. This article is an open access article distributed under the terms and conditions of the Creative Commons Attribution (CC BY) license (https://creativecommons.org/licenses/by/4.0/).
Share and Cite
Mintaș, O.S.; Mierliță, D.; Berchez, O.; Stanciu, A.; Osiceanu, A.; Osiceanu, A.G. Analysis of the Sustainability of Livestock Farms in the Area of the Southwest of Bihor County to Climate Change. Sustainability 2022, 14, 8841. https://doi.org/10.3390/su14148841
Mintaș OS, Mierliță D, Berchez O, Stanciu A, Osiceanu A, Osiceanu AG. Analysis of the Sustainability of Livestock Farms in the Area of the Southwest of Bihor County to Climate Change. Sustainability. 2022; 14(14):8841. https://doi.org/10.3390/su14148841
Chicago/Turabian StyleMintaș, Olimpia Smaranda, Daniel Mierliță, Octavian Berchez, Alina Stanciu, Alina Osiceanu, and Adrian Gheorghe Osiceanu. 2022. "Analysis of the Sustainability of Livestock Farms in the Area of the Southwest of Bihor County to Climate Change" Sustainability 14, no. 14: 8841. https://doi.org/10.3390/su14148841
APA StyleMintaș, O. S., Mierliță, D., Berchez, O., Stanciu, A., Osiceanu, A., & Osiceanu, A. G. (2022). Analysis of the Sustainability of Livestock Farms in the Area of the Southwest of Bihor County to Climate Change. Sustainability, 14(14), 8841. https://doi.org/10.3390/su14148841