1. Introduction
Basil (
Ocimum baliscum) is one of the most important plants of the Lamiaceae family, is an annual herbaceous plant that grows to 20–60 cm in length and its flowers are a purple-white color. Basil originated in India and Iran and is cultivated in Mediterranean countries and regions with temperate, hot, and dry climates [
1]. In addition to having a considerable commercial value, it can be applied in food preparation as a spice, a fresh vegetable, a medicinal plant, an antimicrobial, an antiviral, and as an antioxidant [
2,
3].
In the past, food preservation methods were very inexpensive and these may still be the best option for economically disadvantaged communities. Today, these methods are still utilized in special situations such as during famines, floods, earthquakes, and long-term power outages in natural environments; therefore, with the industrialization of societies, the growth of populations and their distribution throughout the world, specialized agriculture in certain geographic areas, and the prosperity of the global economy, the need for optimal food storage has been doubled to provide the best protection for assuring food quality from the farm during harvest, to transportation, distribution, and finally for utilization at the lowest cost. Since most drying processes are carried out at high temperatures, the quality characteristics of the dried product, such as its texture, nutritional value, taste, color, and aroma, are adversely affected. To minimize these changes, the drying methods and conditions such as temperature, drying time, air velocity, and so on, must be optimized [
2].
The drying process is one of the most essential and common steps in the post-harvest processing of herbal plants such as basil and, therefore, it has a significant impact on the volatile components of the essential essence. Drying reduces the humidity of crops and is the most crucial procedure for safeguarding agricultural products because it has a considerable impact on the condition of parched goods [
4]. In addition to extending the shelf life, drying herbal products can also diminish the activity of enzymes and microorganisms [
5]. As agricultural products have a low thermal conductivity, heat is transferred slowly to their interior; therefore, their drying process consumes a significant amount of energy. Choosing a suitable drying method and shortening the drying time not only achieves economic savings but also reduces undesirable product changes, such as in texture, nutritional value, taste, color, and aroma [
6]. Two traditional methods (e.g., spreading in the sun or shade) and industrial methods (e.g., a hot air-convective dryer with burner heating or electric heaters) are used to dry herbal plants. Generally, these methods have some limitations, such as requiring a long drying time, exposure to dust and rain, a high initial investment cost, high energy utilization (due to the use of fossil fuels), an accumulation of greenhouse gases in the atmosphere followed by global warming, and environmental pollution. Therefore, it seems necessary to dry herbal plants with a dryer that uses the radiant energy of the sun to shorten the drying time and improve the final quality of the dried plants. The utilization of a solar dryer is considered a new solution in this regard and is growing rapidly in popularity. This kind of dryer releases heated air from solar panels over the product and has an energy efficiency comparable to industrial dryers in areas with high solar radiation during the harvesting season. Hence, they can easily be substituted for traditional and industrial drying methods [
7].
Drying represents one of the most extensive processes in energy usage, consuming between 12 and 25% of the total energy in industrial processing. About 30% of the world’s total energy consumption is utilized by the agricultural sector, out of which 3.62% is used for drying agricultural products [
8]. In the last decade, in the face of increasing energy utilization, both energy loss and exergy (the maximum work that can be performed with a given amount of available energy or with a material flow) have gained importance in thermodynamic research [
9,
10]. The main goal of exergy analysis is to determine the location and amount of irreversibility during the different processes in the thermodynamics cycle and to identify the factors that influence this irreversibility. In this way, not only the efficiency of the various components of the thermodynamics cycle is evaluated, but also the opportunities of improving the overall efficiency of the cycle are identified. Golpour et al. [
11] studied the energy and exergy loss of the potato drying process in a convection dryer and found that the exergy losses, exergy efficiency, and rate of improvement potential ranged from 0.006–0.0366 kJ/s and 57.07–85.85%, and 0.0016–0.0046 kJ/s, respectively. In another study, the thermodynamics evaluation of a fluidized bed dryer at different temperatures and bed heights for Kodo millet drying was investigated by Yogendrasasidhar and Pydi Setty [
12]. The results of this study showed that the exergy efficiency increased with an increasing temperature and bed height. Beigi et al. [
13] also analyzed the energy and exergy performance of a semi-industrial dryer for drying paddy samples. According to the results of that study, the energy utilization and energy utilization ratio decreased while the exergy losses and exergy efficiency parameters increased with an increasing drying air velocity and air temperature.
The optimization of thermodynamics parameters is usually undertaken in the manufacturing industry, particularly with dryers, to improve the final product quality while reducing the energy utilization and maximizing the cost-efficiency; therefore, the analysis of the energy and exergy parameters is one of the most important techniques to optimize and improve the efficiency of a dryer [
14]. The optimization of processes leads to energy savings through the development of new dryers and modifications to existing systems. Advanced exergy analysis is used to quantify and characterize the inefficiency of an energy system [
15,
16], and to evaluate the thermodynamics and economic performance of an energy system, its actual potential for improvement and its system parameters must be effectively considered [
17].
Evaluating the optimal performance of the process parameters used in the food industry is a very important task because they directly affect the quality of the final product, production efficiency, energy efficiency, production costs, and the time to a product’s delivery [
14,
18]. The response level method is a set of statistically specific techniques for building models, evaluating the effects of independent factors, and determining the optimal conditions for achieving desired outcomes. Box and Wilson first introduced the response-level method in 1951. The response-level method allows multicomponent experiments to be carried out simultaneously with a minimum experimental time, testing the most important factors and their interactions with each other [
19]. It has been used to optimize the drying process of Laurus Nobilis [
20], mint [
21], pear wedges [
22], tomatoes [
23], lemons [
24], and onions [
25]. Sadeghi, Asl, and Movagharnejad [
26] optimized the quality of kiwifruit slices in a convection infrared dryer using the response surface method with the independent variables of infrared power, kiwifruit slice thickness, the distance between kiwifruit slice and infrared lamps and air velocity, and the dependent variables of drying time, drying rate and shrinkage. Based on their research, all the independent variables had a significant effect on the dependent variables, but the kiwi slice thickness was the most significant. Majdi, Esfahani, and Mohebbi [
27] studied how a convection dryer was optimized for drying apple slices by the response surface method with a maximum desirability function of 0.781. In the study of Jafari, Movagharnejad, and Sadeghi [
28] the effects of an infrared drying process on eggplant slices were evaluated via the surface response technique using the Box–Behnken design (BBD). According to the results of that study, the optimal values for the eggplant slicing were 4.9 cm, air velocity of 1.14 m/s, and infrared power of 1500 W, while the optimal values for the responses of the TPC, ΔE, and Potassium concentrations were 2531.82 mgGA/100 gdm, 21.23 and 1929.85 mg/100 gdm, respectively. Using a hot air convection dryer with pretreatments, a study evaluated the energy, exergy, and sustainability index parameters for drying pumpkin seeds using the surface response method. The results showed that the optimal values for energy and exergy efficiency were 13.40% and 41.77%, respectively; therefore, the values for the sustainability index and improvement potential were related to the exergy losses [
29]. In recent studies, the influence of the drying air temperature and bed thickness drying conditions on changes in the energy and exergy parameters of the basil leaf drying process have not been investigated; hence, to optimize the drying process, the current research focused on modeling the influence of the air temperature bed thickness (as the independent variables) on changes in the moisture content, drying rate (DR), energy utilization, energy utilization ratio, exergy efficiency, exergy loss, improvement potential rate, and sustainability index (as the dependent variables) of a hybrid-solar drying process for basil leaves by using the RSM method.
2. Materials and Methods
2.1. Preparation of Sample
The basil plants used in the present study was purchased in the Miandarband region, Kermanshah. To preserve their freshness, it was washed and stored in a refrigerator at 4 ± 1 °C. As part of the daily test, they were removed from the refrigerator and cleaned (removing the superfluous parts such as unusable leaves and roots). To determine the initial moisture content of the basil, samples of 50 g were randomly taken out of the refrigerator, then the standard oven method was applied for 1 h at 105 °C [
1]. Finally, the average initial moisture of the basil leaves obtained was 83.20 ± 3% (w.b.). The basil leaves drying experiments were performed in three replications.
2.2. Drying Equipment and Empirical Method
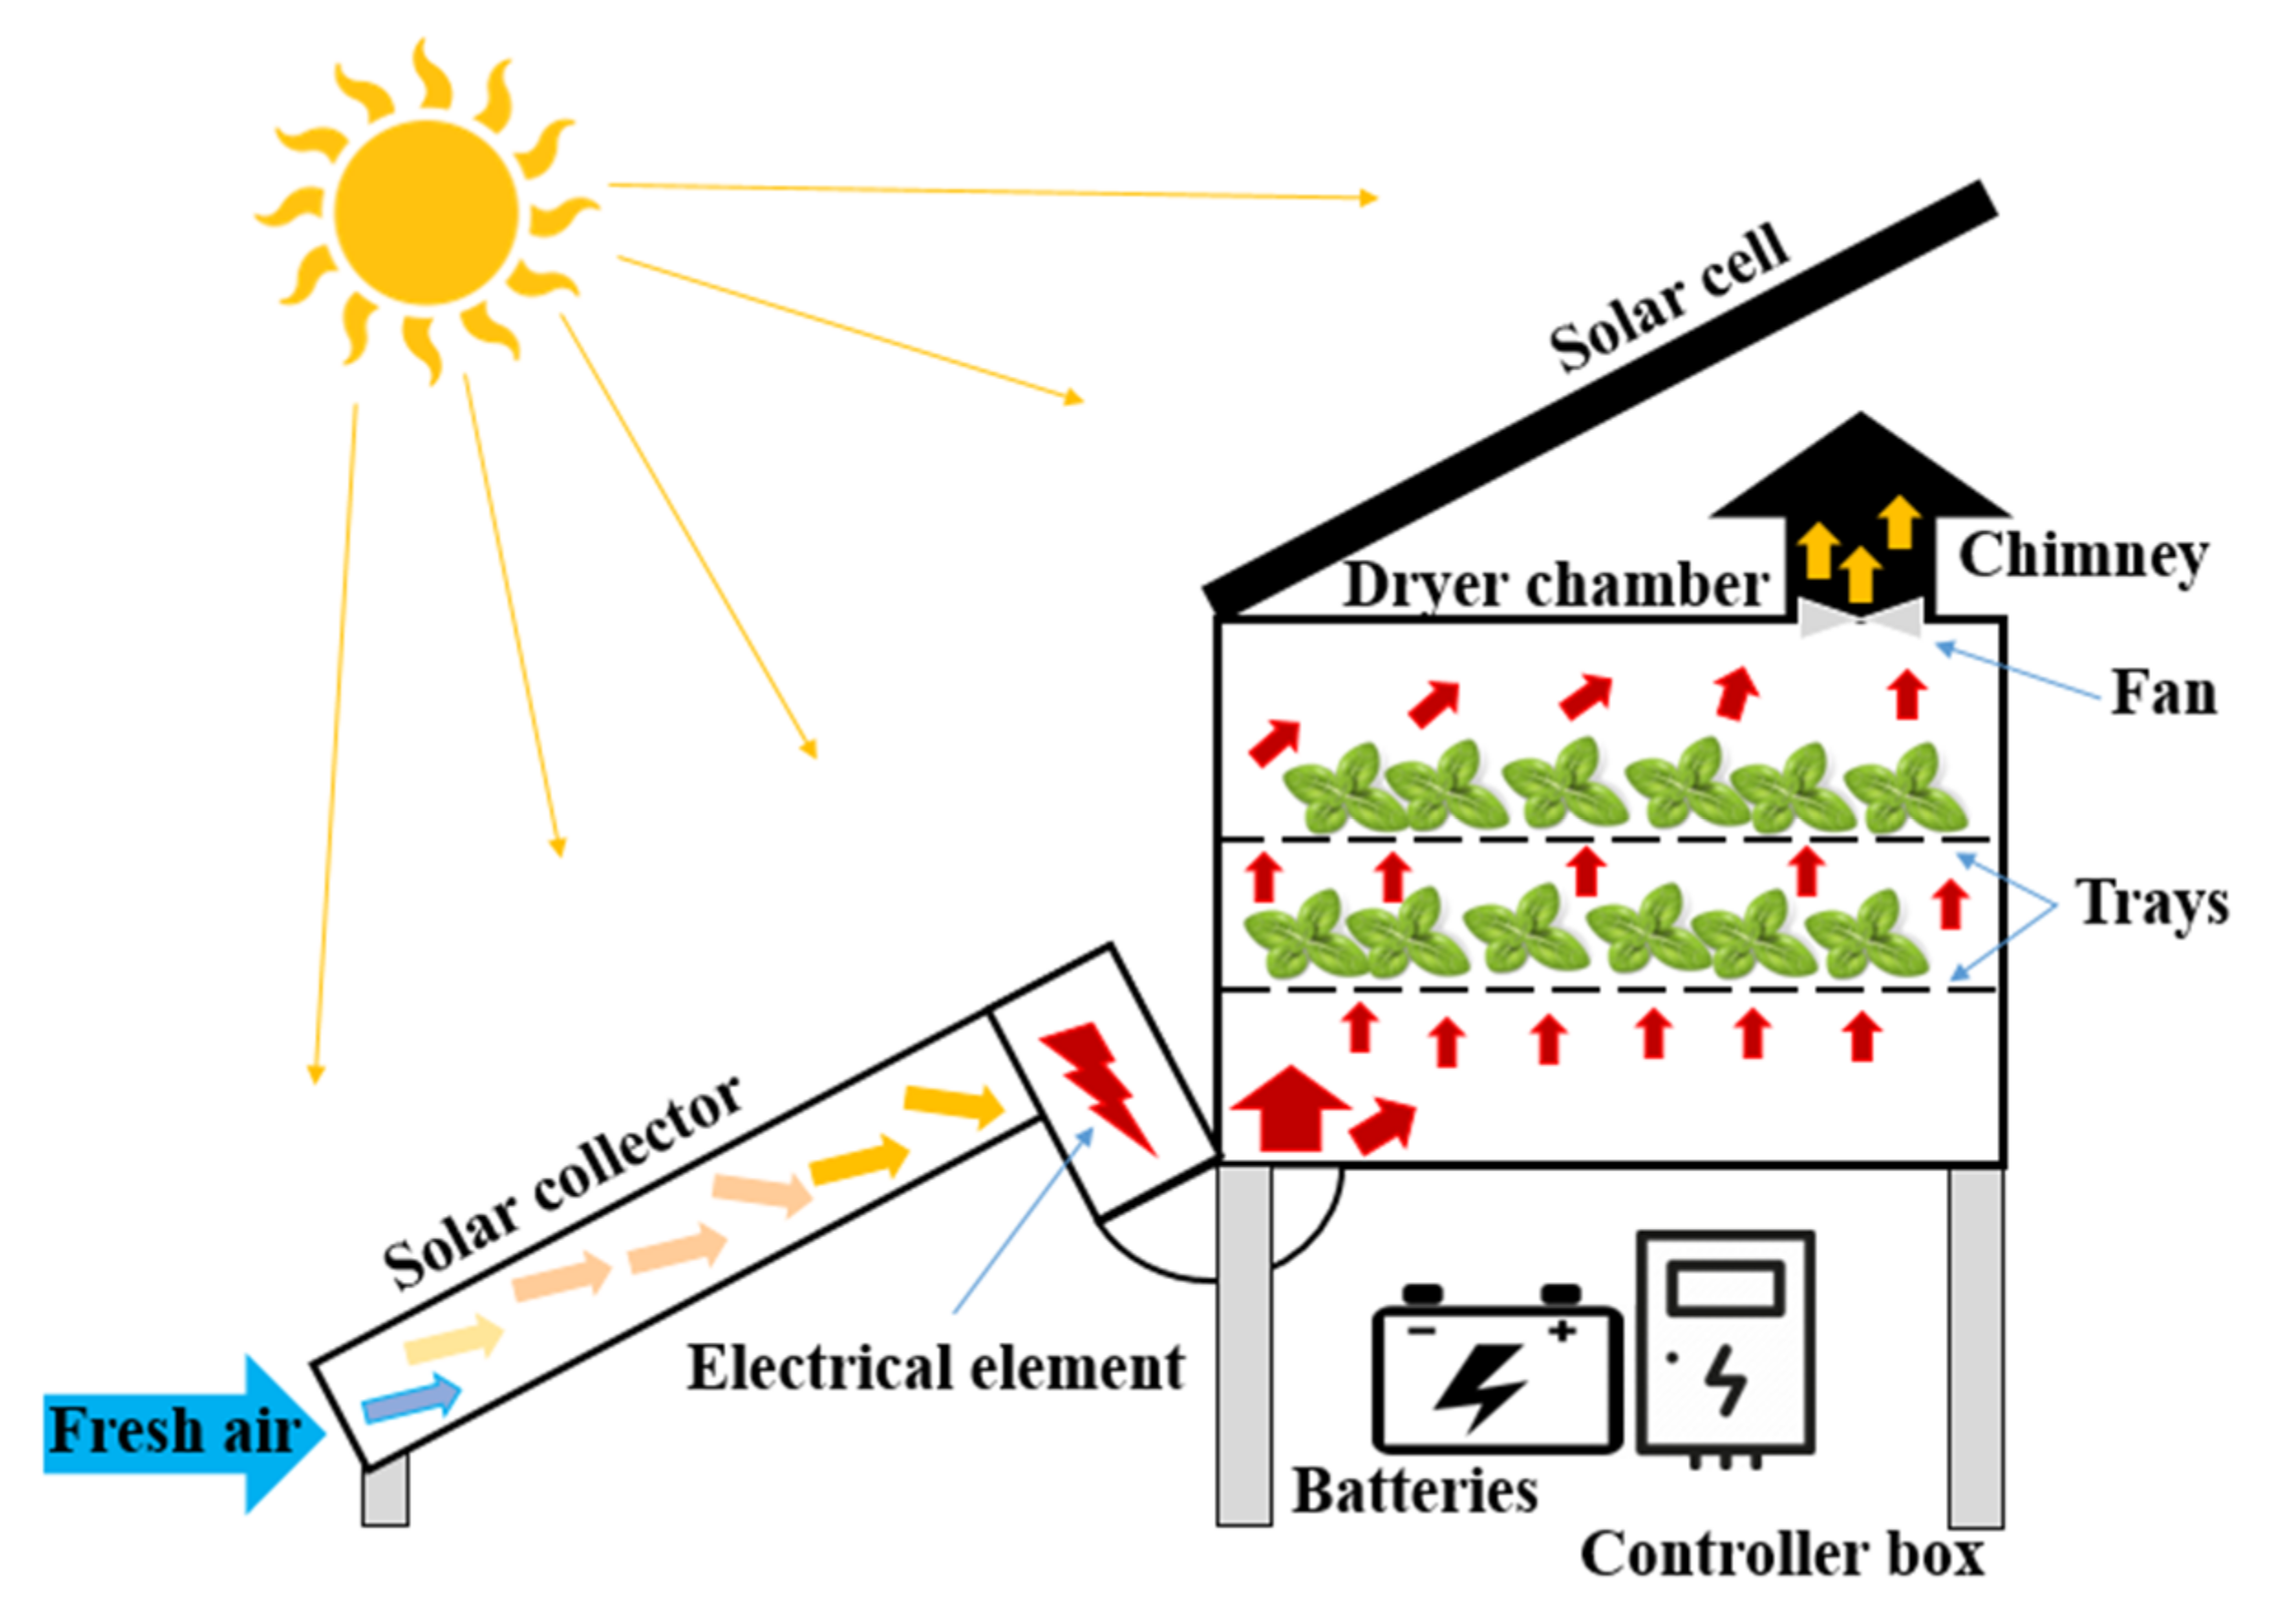
In this study, a hybrid-solar dryer (HSD) with manufactured hot air [
30] was employed to dry the basil leaves in June 2021 as shown in
Figure 1.
In addition to a control system to measure the air temperature, air velocity, and relative humidity, the dryer had a solar collector and a drying chamber with two aluminum perforated trays, in which the volume of the drying chamber was 210 cm3. In this type of dryer, the frame of the solar collector was made of aluminum and black aluminum sheets with air-conducting blades to absorb sunlight. The solar collector was inclined at 34° from the horizontal, with 1.20 m of length, 1 m of width, and 0.07 m of internal height. In addition, a 1000 W electric element heated the inlet air of the dryer chamber, which could be varied by a fan located inside the collector. To measure the velocity of the air entering the dryer chamber, an AVM-07 vane velocity meter made in Taiwan with a measurement accuracy of 0.1 m/s was used. There was also an air outlet at the top of the solar drying chamber to direct the air outside. Additionally, five LM75 sensors (Sigma-Delta, Ann Arbor, MI, USA) with a measurement accuracy of −55 °C to 125 °C (±2 °C), and two HS101 sensors (model HS1101, Apollo Electronics Co., Ltd., Guangdong, China) with a measurement accuracy of ±2% were applied to measure the air circulation temperature and relative humidity, respectively. During the experiments, the solar radiation that reached the absorber plate was in a range between 36–49 MJ/m2, while the relative humidity and the temperature of the ambient air were 17 ± 2%, and 30–35 °C, respectively. Moreover, the relative humidity of the air leaving the dryer was 55% at the beginning of the test and 15% at the end of the process.
The basil dryer was set for 30 min to reach a sustainable state before carrying out the drying experiments. The prepared samples were weighed with a digital scale (A&D model GF3000, Tokyo, Japan) in the value ranges of 200, 400, and 600 g, and then evenly distributed on the drying trays in the sizes of 2, 4, and 6 cm. They were dried at three different temperatures of 40 °C, 55 °C, and 70 °C, whereas a constant air velocity of 1 m/s was used for all the experiments. All the tests were performed in three replicates and all the samples were treated with the same drying conditions.
2.3. Data Analysis
2.3.1. Moisture Ratio and Drying Rate Analysis
Because of the reduction in data dispersion, the drying kinetics are often evaluated using two-parameter indicators of the moisture ratio and drying rate. In the present study, the moisture ratio and drying rate of the basil leaves were calculated using Equations (1) and (2) [
30]:
Energy Utilization
The drying process of the basil was considered as a stable flow process in order to perform an energy analysis using the Equations (3)–(13). The energy balance of the input and output flows of the dryer was analyzed using Equation (5) as a general energy conversion equation. Equations (3) and (4) were used to calculate the air characteristics, i.e., the dry air density and the enthalpy of the dry air [
31,
32]. Additionally, Equation (5) was employed to calculate the energy utilization (EU):
Equation (6) was used to calculate the heat transfer rate within the dryer [
33]:
Energy Utilization Ratio
The enthalpy of the fresh and dry products was calculated by first determining the specific heat of the input or output product. A GM900 laser thermometer was applied to measure the temperature parameters of the inlet and outlet of the product as well as the ambient temperature [
34]:
The following equation was also used to determine the specific heat capacity of the dryer inlet and outlet air [
33,
34,
35]:
The humidity rate was calculated using the following equation [
34]:
Finally, Equations (10)–(13) were utilized to calculate the rate of heat removed from the air leaving the dryer and the heat loss from the dryer body, as well as the energy utilization ratio (EUR) [
31,
33]:
Exergy Evaluation
In general, the exergy analysis was performed according to the first and second laws of thermodynamics, which was evaluated to obtain the specific exergy of air, exergy loss, and exergetic efficiency of the dryer chamber using Equations (14)–(16) [
33,
34]:
When the exergy loss or irreversibility of a system is low, the maximum improvement in exergy efficiency is achieved. The rate of exergy improvement potential was calculated using Equation (17) [
36,
37,
38]:
Finally, the sustainability index (SI) of the drying process was determined by Equation (18) [
39]:
2.3.2. Experimental Design and Statistical Analysis
A regression analysis and analysis of variance (ANOVA) were used to develop a complete second-order model for the drying factors of the basil with the hybrid-solar dryer and to evaluate the adequacy of the model and statistical significance. The statistical analysis of the optimization of the drying process of the basil with a hybrid-solar dryer was carried out through the response surface method (RSM). For this purpose, a face-centered central composite design (CCD) was utilized, so the statistical analysis and optimization of the data was carried out by applying the software of Design Expert (version 13.1.0.1, Minneapolis, MN, USA). In the drying process of the basil samples with this kind of dryer, to investigate the effect of the independent variables on the dependent variables for the experiments, two independent variables of the drying air temperature (40 °C, 55 °C and 70 °C) and three levels of the sample bed thickness (2, 4 and 6 cm), were used on the responses of the drying rate, energy utilization, energy utilization ratio, exergy efficiency, exergy loss rate, exergy improvement potential rate, and sustainability index. The coded levels were (−1), (0), and (1) for the two independent variables of the air temperature and basil bed thickness, each of which was at three different levels, and the dependent variables of the experimental design are listed in
Table 1.
Central composite design (CCD) experiments (13 cases) were obtained to evaluate the effects of the independent variables on the responses, as shown in
Table 2.
A coefficient of determination (R2), adjusted regression coefficient (Adj-R2), predicted regression coefficient (Predicted-R2), and analysis of variance (ANOVA) with statistical and response plots were used to analyze the results and evaluate the significance and accuracy of the model. The specific RSM was used and evaluated in relation to the actual data along with the corresponding F and p values at the 95% confidence level.
After the drying experiments, the data (independent and interactive effects of the variables on responses) were fitted using a second-order polynomial equation [
40,
41]:
The total desirability function (
D) was the evaluation factor to find the optimal points, which was calculated using the geometric mean of eight individual desirability functions as follows [
14]:
Overall, the range and purpose of the responses were determined to maximize the amount of exergy efficiency (d1), exergy improvement potential rate (d2) sustainability index (d3), and drying rate (d4), and to minimize the exergy loss rate (d5), energy utilization (d6), and energy utilization ratio (d7) to perform the optimization process.
3. Results and Discussion
3.1. The Influence of Air Temperature and Bed Thickness on the Drying Rate
Figure 2 illustrates the drying rate (DR) of the basil samples at different drying air temperatures and bed thicknesses during the drying process. As can be seen in
Figure 2, there were two distinct periods in the drying rate curves.
The first period included a sharp acceleration corresponding to the initial temperature. This increase occurred at the beginning of the drying process. It was similar to the process observed by Prashob et al. [
42] at the beginning of drying shrimp at different temperatures. This was attributed to the increased driving force for the migration of moisture inside the material due to higher drying temperatures. During the descending period, a lower rate was observed along with the plot. The moisture movement at a decreasing rate time was determined by molecular diffusion, which was the predominant physical mechanism in this period. As the drying time increased, the moisture content of the samples decreased exponentially until the equilibrium moisture content was reached. In the first few hours of drying, the moisture drop was faster, but later the moisture drop was slower because the moisture moved from the interior of the material to the outer surface and then evaporated [
43]. The lowest drying time for the basil samples was obtained at a temperature of 70 °C and a bed thickness of 2 cm, whereas the highest value was achieved at the temperature of 40 °C and a bed thickness of 6 cm; thus, the drying rate increased as the sample thickness increased. Zheng et al. [
44] reported that the moisture content in all the biological products decreased during the drying process. In other words, the water moved from points with higher moisture to points with lower moisture during the drying time, and the movement of water from the sample to the surface of the product was controlled by molecular diffusion. These results are consistent with the findings of the previous researchers, namely, Karami et al. [
33] for rosemary in a solar- convection dryer, Moussaoui et al. [
45] for apple in a hybrid solar-electrical forced convection dryer and Tagnamas et al. [
46] for carob seeds in a convective solar dryer.
3.2. Drying Rate
Table 3 shows the predicted effects of the independent parameters and their interactions for the ANOVA. The results demonstrate that the linear effects with the value of (
p-value < 0.0001) interactions (
p-value = 0.0001), and the quadratic (
p-value = 0.0006) for the air temperature (
A2) and (
p-value < 0.0030) for the bed thickness (
B2), were significant, and this was in a good agreement with the results of Karami et al., [
7]. In
Table 3, the results of the lack of fit were not significant (
p ≥ 0 0.05). The drying results showed no significant lack of fit, indicating that the model was well fitted. Based on the coefficient of variation (CV) of 2.35%, it can be seen that the selected model has a good signal-to-noise ratio and can be used to move around the design space [
23].
In general, the fit of the models was tested using an ANOVA, and the results showed that the equation adequately represented the true relationship between the two independent variables and responses (
Table 3 and
Table 4).
The results in
Table 4 show that the quadratic model with an R
2 value (0.9964), predicted R
2 (0.9640), adjusted R
2 (0.9939), and PRESS (0.0015) was the best model for the drying rate. Additionally, the cubic model was considered to be over fitted compared to the other evaluated models.
Equation (21) shows the fit of the quadratic polynomial model with the independent parameters to the drying rate:
However, the positive sign of the estimated regression coefficients from the central composite design model indicated the direct effect of the independent parameters on the response variable (
Dr), while the negative sign indicated the reverse effect of these parameters on the drying rate. The coefficients also indicated that the independent variable of the drying air temperature with the highest value (0.0757), had the greatest effect on the dependent variable (drying rate) [
47].
The combined effect of the two factors including the bed thickness and drying air temperature on the drying rate is shown in
Figure 3a as a 3D response surface and contour plot for the quadratic polynomial model.
The drying rate not only increased with an increasing drying air temperature (
A) but also decreased more with a decreasing basil bed thickness when it was less than 4 cm (
Figure 3a,b).
As can be seen in
Figure 3b for the contour plot of the independent and dependent parameters, higher drying air temperatures resulted in the lowest drying time rates. Both the air temperature and bed thickness were found to affect the drying rate simultaneously, but the drying air temperature had a greater effect on the drying rate than the bed thickness. Moreover, the results showed that the drying rate was directly related to the drying air temperature and inversely related to the bed thickness; therefore, the drying rate increased with an increasing drying air temperature and decreasing bed thickness. Similar results were obtained by Golpour et al. [
48] and Demirpolat et al. [
49].
3.3. Energy Utilization
In
Table 5, the results of the statistical analysis parameters resulting from the analysis of variance for the input parameters of bed thickness and drying air temperature on the energy utilization (EU) are reported.
The results showed that the selected model perfectly predicted the response of the energy utilization (
p < 0.05). The values of F for the selected model were 342.42 and the
p-value < 0.0001; therefore, the lack of fit was insignificant showing a significant model (
Table 5). There is only a 0.01% possibility that a high value of F is due to creating noise. In other words, the related model had a good performance for estimating the relevant response based on the factors studied and was statistically significant; however, it is worth noting that the
p-values for the independent variables of the drying air temperature (
A), bed thickness (
B), and their interaction (
AB) were
p < 0.0001, so that the values for the quadrative values of these parameters (
A2 and
B2) were 0.0003 and 0.0047, respectively. This shows that these parameters had a significant effect on the response of the energy utilization at a confidence level of 95% (
p < 0.05) (
Table 5).
An analysis of variance according to
Table 5 showed energy utilization with the lowest value of the variation coefficient (C.V. = 2.86%), indicating that the standard deviation (percentage of the mean) increased the reliability of the experiment [
20,
50].
According to the model developed for energy utilization, the quadratic model with R
2 (0.9960), adjusted R
2 (0.9931), predicted R
2 (0.9598), and a value of PRESS = 0.0000 was significant at
p < 0.01. The selected model had a good fit with no significant lack of fit. The difference between the predicted and adjusted R
2 values was less than 0.20, which was in a reasonable fit (
Table 6).
The results of this study on the optimization of the energy utilization parameter for basil drying showed that the extracted mathematical model (Equation (22) was based on effective coding factors, interactions, and quadrative effects. By default, the high values were coded as +1 and low values as −1. Generally, a coded Equation (22) can be used to determine the relative effect of factors by comparing their coefficients [
51]:
From the high quadratic polynomial model, it can be seen that all the parameters had a positive effect on energy utilization, so that the air temperature had the highest effect with a coefficient of 0.0076 compared to all the factors and terms in the regression model.
This 3D diagram and 2D contour of the response surface of the energy utilization interaction with the drying air temperature and bed thickness for drying basil are shown in
Figure 4a,b.
According to the figures, the maximum value of EU at 70 °C and a bed thickness of 6 cm, and the minimum EU value at 40 °C and a bed thickness of 2 cm were 0.041 and 0.012 kJ/s, respectively. The effects of the drying air temperature and the bed thickness variables on the EU value can be found in this figure.
Figure 4a,b shows that both the drying air temperature and the bed thickness affected the EU simultaneously. In other words, the EU increased with an increasing air temperature and bed thickness; thus, the temperature of the air and the bed thickness were directly related to the EU. In this regard, the increase in energy utilization may be because the enthalpy supplied increased with the increasing drying air temperature and bed thickness, which in turn led to an increase in the energy utilization, since the EU is directly related to enthalpy [
33]. Moreover, these results agreed well with Das et al. [
52] and Pattanayak et al. [
53].
3.4. Energy Utilization Ratio
With respect to
Table 7 for the variance analysis, the F value of the output variable (utilized energy rate) was 1118.73, while the lack of fit of this model with the satisfaction coefficient of determination (R
2) was not significant at all.
As a result, the model was appropriate with a
p-value < 0.0001. At the 95% confidence level, the
p-value of the model was less than 0.05, which means that the model terms were significant (
Table 7). The results showed that air temperature (
A), bed thickness (
B), and their interactions (
AB) (
p < 0.0001) had a significant effect on the EUR. In addition, the quadrative effects of the drying air temperature (
A2) and bed thickness (
B2) were significant at the 95% probability level with
p-values of 0.0004 and 0.0022, respectively (
Table 7). Nevertheless, the experimental data were well expressed by the model, and estimated the energy utilization ratio very closely while the
p-value of the model with a low C.V. value (1.65%) was less than 10% [
54].
The results of the model responses are summarized in
Table 8.
According to the results, the high values of adjusted R
2 and R
2 show that the developed models were suitable for predicting the energy utilization ratio so that the predicted values of R
2 were close to the adjusted R
2; however, the analysis of variance showed that the quadratic model was the best model to explain the energy utilization ratio, as shown in
Table 8. It is important to note that the values of R
2 and adjusted R
2, predicted R
2, and PRESS for the selected model to estimate the response of the energy utilization ratio were 0.9988, 0.9979, 0.9878, and 0.0012, respectively, as shown in
Table 8.
Using the response surface method model and the air temperature and bed thickness parameters, the energy utilization ratio was predicted. Based on this method, all parameters, their interactions, and their quadrative terms are given in the following equation:
The drying air temperature (A), sample bed thickness (B), their interaction effects (AB), and quadratic value of bed thickness (B2) had a direct relation with the EUR and the drying air temperature had the highest effect between the parameters and the terms. In contrast, the quadrative term of the drying air temperature (A2) was inversely related to this response.
Figure 5 showed the three-dimensional curve of the response surface and the contour of the energy utilization ratio of the basil drying process.
Generally,
Figure 5 reports the values of the energy utilization ratio for the test variables of the drying air temperature and bed thickness at each point of the indicated area and their interactions. As shown in
Figure 5b, the maximum EUR value at 70 °C and a bed thickness of 6 cm, and the minimum EUR value at 40 °C and a bed thickness of 2 cm were 0.461 and 0.1181, respectively. According to the reported figures, the air temperature and bed thickness had a significant effect on the EUR values, so that the EUR increased directly with the drying air temperature and bed thickness. The RSM model also supports this claim, but the influence of air temperature was more than the bed thickness on the EUR value, as its coefficient was the highest in the relevant model. These results were similar to Das et al. [
52], and a good agreement was found. Erick César et al. [
8] studied the energy and exergy of a mixed-mode solar dryer for pear slices. They reported a highest average energy utilization ratio of 29.1% in an indirect-mode natural convection.
3.5. Exergy Efficiency
Exergy efficiency can be evaluated using the results of the analysis of variance from
Table 9. As a result, the selected model with a
p-value < 0.0001, and the effects of temperature (
A) and bed thickness (
B) were significant at the 1% and 5% levels, respectively, and the second-degree term of the drying air temperature (
A2) with a
p-value < 0.0001 and the interaction effect of the drying air temperature and bed thickness (
AB) with a
p-value < 0.0064, were significant only at the 5% level, while the second-degree term of the bed thickness (
B2) had a
p-value < 0.0129. The
p-values were obtained for these parameters: 4722.40, 552.42, 186.49, 14.76, and 10.98, respectively (
Table 9). The non-significance of the lack of fit parameter and the low value of the variation coefficient (C.V. = 1.20%) indicated that the chosen model was suitable for the estimation of the exergy efficiency.
In evaluating the significance of all terms of the quadratic model for estimating the exergy efficiency, it was found that the model with a value of R
2 = 0.9987 had a good performance for fitting the experimental and predicted data, which represented only 0.23% of the total changes not accounted for by the RSM model (
Table 10).
For this selected model, adjusted R
2, predicted R
2, and PRESS values were 0.9978, 0.9885, and 35.36, respectively, which were statistically acceptable values for predicting the exergy efficiency (
Table 10).
In Equation (24), the results of the obtained quadratic polynomial model were shown in relation to the response of the exergy efficiency and the independent variables temperature (
A) and sample bed thickness (
B):
Equation (24) shows that all parameters of the independent variables (A) and (B), their interaction effects (AB), and their second-order parameters (A2) and (B2) were significant. Accordingly, the temperature and the thickness of the sample bed and their interactions had a positive effect on the exergy efficiency, while the second-order term had the opposite effect. In general, the drying air temperature had a greater effect on exergy efficiency than the sample bed thickness.
Figure 6 shows the interactions between the parameters of drying air temperature and thickness of the basil sample during the drying process in the form of a 3D reaction surface curve of the quadratic polynomial model and a 2D contour of the exergy efficiency.
The average exergy efficiency values ranged from 31.78% at 40 °C and 2 cm sample bed thickness to 86.56% at 70 °C and 6 cm layer thickness of the sample bed (
Figure 6a,b). In this study, higher exergy efficiency values (31.78–86.56%) were obtained than in the study of Yogendrasasidhar and Setty [
12] on fenugreek seed drying. This difference could have been caused by the application of solar energy to the drying kinetics of the basil. Hybrid-solar drying increased the surface temperature of the basil sample, the moisture diffusion in and on the surface of the samples and a higher moisture pressure, that caused a shorter drying time compared to hot air drying. As a result, more evaporation took place, leading to more exergy and a better energy efficiency. In other words, as the bed thickness increased, so did the inlet exergy flow of the hybrid-solar dryer. As shown in
Figure 6a,b, similar results were obtained for the air inlet temperature parameter. From the figures, it can be seen that both the drying air temperature and the bed thickness affected the exergetic efficiency. In other words, the higher the drying air temperature and bed thickness, the higher the exergy efficiency. Consequently, the air temperature and bed thickness were directly related to the exergy efficiency (
Figure 5a,b). Similar results were obtained by Yogendrasasidhar and Setty [
12] for drying kudu millet and Suherman et al. [
55] for drying cassava starch with a hybrid dryer, where the exergy efficiency increased with an increasing air temperature. Erick César et al. [
8] studied the energy and exergy of a mixed-mode solar dryer for pear slices and they reported that the exergy efficiency values of the dryer chamber were 65.2% in a mixed-mode natural convection, while the lowest were in a mixed-mode forced convection (54.4%).
3.6. Exergy Loss Rate
Table 11 illustrates that the analysis of variance extracted from the response surface optimization method for the exergy loss rate, showing the model chosen for this process for drying basil was highly significant with a
p-value < 0.0001 and an F-value of 172.03, with only a 0.01% probability that the F-value with this high value was due to noise (
p < 0.01).
In this case, only the independent variables of the drying air temperature (
A), bed thickness (
B), and their interactions (
AB) on the exergy losses were highly significant at the 95% confidence level (
p < 0.05); however, the non-significance of the lack of fit indicated a disagreement with the magnitude of the pure error, indicating that the model for basil drying obtained by the response surface method fit the experimental data well. A no significant measure of the lack of fit showed it was a suitable model to predict the related response, which was in agreement with Kumar, Prasad and Murthy [
56], Nwakuba [
57], and Uzoma, Nwakuba and Anyaoha [
58]. After the analysis of variance, the coefficient of variation (C.V.%) for these experimental data was 5.47% (
Table 11).
According to the results of the analysis of variance in
Table 12, the 2FI model with the R
2 of 0.9829, adjusted R
2 of 0.9771, predicted R
2 of 0.9458 and PRESS of 0.0000 showed a suitable fit and a very good correlation with the values of the predicted exergy losses, indicating this parameter could have caused a higher proportion of changes in the experiment.
With a value difference of less than 0.20 between the adjusted R
2 of 0.9771 and the predicted R
2 of 0.9458, the fit of the model shows that it was properly used to predict the exergy loss (
Table 12).
Equation (25) presents a quadratic polynomial model for exergy loss during the hybrid-solar drying of the basil samples with different drying variables:
According to the above equation, the drying air temperature with the highest positive coefficient of 0.0075 was the most effective parameter in reducing the exergy losses, while among the terms, the sample thickness parameter with a positive coefficient of 0.0042 reduced the exergy loss rate with the lowest effect on the loss.
Figure 7 shows the interaction effect of the hybrid-solar dryer input variables (drying air temperature and bed thickness) on the exergy loss rate as a 3D response surface and 2D contour plot.
As the air velocity (1 m/s), drying air temperature (
A), and bed thickness (
B) of the basil drying process increased, the amount of exergy loss increased, indicating that the drying air temperature and bed thickness had a direct influence on the exergy loss in this study (
Figure 7a). The results showed that the lowest amount of exergy loss was 0.0078 kJ/s, obtained at 40 °C and a bed thickness of 2 cm, while the highest values of the same parameter (0.0298) were obtained at 70 °C and a bed thickness of 6 cm, respectively (
Figure 7a,b).
3.7. Exergetic Improvement Potential Rate
Table 13 shows the results of the ANOVA for the exergy improvement potential response rate by the second-order polynomial model (Equation (26)) for all the independent variables and their interactions.
The analysis of variance evaluated by the Design-Expert software using the response level method for the exergy improvement potential rate resulted in an F-value of 4705.99, which determined the variance of the total improvement potential data to the mean (
Table 13). Additionally, the model’s low
p-value < 0.0001 indicated that the selected model was highly significant in predicting this parameter relative to the levels of the independent variables (
p < 0.01). In this case,
A,
B,
AB,
A2, were the significant variables of the model at 95% (
p < 0.05) and 99% (
p < 0.01), confidence levels, respectively, so that the
A2 with the value (
p = 0.0234) was significant only at a 95% confidence level (
p < 0.05) (
Table 13). According to the results,
B2 with a value (
p = 0.8438) was also the only non-significant variable in the model (
p ˃ 0.05). The ANOVA also showed that the lack of fit for the models at the response level of the exergy improvement potential rate was not significant at the 95% confidence level with a coefficient of variation of 1.25%, which also indicated the proper performance of the corresponding model (
Table 13).
The results of the ANOVA for the quadratic model of exergetic improvement potential rate, R
2 of 0.9997, and an adjusted and predicted R
2 of 0.9995 and 0.9971, respectively, are presented in
Table 14.
According to the results, there was a very significant model, so that many experiments were accurate and reliable; therefore, the resulting quadratic model had a good relationship between the set of independent variables and the corresponding response. In this analysis, the values of the standard deviation and PRESS were found to be 0.0144 and 0.0139, respectively (
Table 14).
By evaluating the multiple regression on the experimental data (the variables of the drying process for basil), a quadratic polynomial equation derived from the response surface methodology of Equation (26), was found to express the exergetic improvement potential rate:
According to the above equation and the corresponding coefficients of each parameter, the term of the linear parameter of the drying air temperature (A), the thickness of the sample bed (B) for the drying process, the terms of interaction (AB), and their quadratic (A2) and (B2) were directly related to the exergetic improvement potential rate. Since the coefficients of all the terms were positive, the drying air temperature was more effective than the variable of the sample bed thickness due to a higher coefficient of 0.7982.
A 3D plot and 2D contour curve of the combined effects of the independent variables (the drying air temperature and sample bed thickness) on the dependent variable (exergetic improvement potential rate) were generated. These combined and interactive effects of the independent variables are shown in
Figure 8a,b.
The values obtained from the analysis of the exergetic improvement potential rate using Equation (17) ranged from 0.242 kJ/s (at 40 °C and a 2 cm bed thickness) to 2.549 kJ/s (at 70 °C and a bed thickness of 6 cm), which were less than the same parameter value reported by Afzali et al. [
14] for white mulberry drying; however, the exergetic improvement potential rate increased directly with an increasing drying air temperature and sample thickness. Similarly, Beigi [
59] reported a potential IP of between 12.28–36.39 J/s. Karami et al. [
33] also found that the average IP values varied from 0.321 to 2.141 kJ/s. Beigi et al. [
38] reported that the range of IP values was between 17.27 to 66.04 J/s.
3.8. Sustainability Index
Table 15 and
Table 16 show the results of the regression and variance analyses for the experiments and the evaluation of the corresponding models.
Table 15 shows that the proposed model for predicting the response of the sustainability index was highly significant (
p < 0.0001). The same results showed that the F value for the present model was 358.42. On the other hand, the analysis of variance (ANOVA) and regression revealed that all terms (
A,
B,
AB,
A2) based on the probability (
p < 0.01), except for the quadratic term of sample thickness (
B2) with (
p ˃ 0.05), were highly significant. Reducing the size of a model may be beneficial if it contains many meaningless terms. Based on the results obtained to evaluate the sustainability index, both the drying air temperature and sample bed thickness had a positive effect on this response. In other words, the sustainability index increased when these factors increased. The coefficient of variation in this analysis was 2.73%.
In addition, the statistical parameters for the quadratic SI response-level model were 0.9961, 0.9933, and 0.9612 for R
2, adj-R
2, and predicted R
2, respectively (
Table 16); however, according to the results of the analysis of variance, the quadratic model was the best model for predicting the sustainability index (
SI) according to the relationship between the set of independent variables and the response of SI.
Based on Equation (27), the results showed that increasing the drying air temperature (
A) and the thickness of the sample bed (
B) during the drying process enhanced the sustainability index. The positive values of the interaction terms of the variables (
AB) and their quadratic terms (
A2) and (
B2) showed that higher values of these variables increased this index. Consequently, according to Equation (27), the effect of the drying air temperature (
A) on the sustainability index with a coefficient value (+0.0075) was much greater than the effect of the sample bed thickness (
B) with a coefficient value (+0.0024). On the other hand, the drying air temperature parameter (
A2) had the most positive effect on the sustainability index with a coefficient of 0.0040 (Equation (27)), based on the combined effects.
SI describes the exergy supplied per unit of exergy loss in the drying chamber and is therefore inversely related to the exergy loss. A three-dimensional reaction surface curve and a two-dimensional contour of the changes for the sustainability index (
SI) with the independent variables and their combined effects are shown in
Figure 9a,b.
From the surface plot, the minimum value of SI at an air temperature of 40 °C and a bed thickness of 2 cm was 0.0116, while the maximum value at an air temperature of 70 °C and a bed thickness of 6 cm was 0.0324. (
Figure 9a,b); however, the results showed that the SI increased with an increasing drying air temperature and bed thickness. As a result, the
SI was proportional to the drying air temperature and bed thickness. The higher the SI index, the lower the environmental impact and the higher the exergy efficiency. Similar results were obtained by Beigi, [
59] for drying kiwifruit and Alhanif et al. [
60] for drying papaya.
3.9. Optimization Analysis
In this section, the results of the optimization analysis and the desirability function of the independent parameters and responses for drying basil in a hybrid-solar dryer were evaluated.
Figure 10 shows the desirability values of the drying air temperature, bed thickness, drying rate, energy utilization, energy utilization ratio, exergy efficiency and exergy loss rate, improvement potential rate, and sustainability index.
The RSM desirability function for the control factors (of drying air temperature and bed thickness) was 1, because they were set within the optimization range. Various responses (e.g., drying rate, energy utilization, energy utilization ratio, exergy efficiency, exergy loss rate, improvement potential rate, and sustainability index) were optimized to be tested at their minimum and maximum values. The desirability function values for the drying rate, energy utilization, energy utilization ratio, exergy efficiency, exergy loss rate, exergy improvement potential rate, and sustainability index were 0.774, 0.791, 0.674, 0.620, 0.608, 0.374, and 0.166, respectively (
Figure 10). Finally, the combined suitability for this evaluation for drying the basil samples was 0.548.
Table 17 presents the desired optimal values for all the independent and dependent optimization parameters using the desirability performance.
Optimal values of the control factors were obtained at a drying air temperature of 63.77 °C and a bed thickness of 2 cm. In addition, the optimum values for the drying rate, energy utilization, energy utilization ratio, exergy efficiency and losses, exergy improvement potential rate, and sustainability index parameters under these drying conditions were 0.275 (kg water/kg dry matter min), 0.019 kJ/s, 0.23, 65.75%, 0.016 kJ/s, 1.105 kJ/s, and 0.015, respectively, were obtained using the predicted response level method (
Table 17).
Additionally, future research works could be directed to applying detailed conventional or even advanced exergoeconomic and exergoenvironmental assessments (e.g., integrating exergy and life cycle assessment (LCA) principles) to supplement our understanding from the monetary and environmental issues of the various drying systems in the food industry. It is expected that such comprehensive approaches can decrease the inefficiencies in thermodynamics, the total costs, and the total environmental impacts of food processing plants.
4. Conclusions
In this study, basil samples were dried from an initial moisture content to an equilibrium moisture content of 12% (d.b.) in a hybrid convective solar dryer. Energy and exergy analyses were accomplished by using the first and second laws of thermodynamics. The optimization process approach was undertaken based on the response surface method (RSM) and desirability function (DF) to find the optimal drying conditions for the drying air temperature and sample bed thickness at different surfaces on the drying rate, energy utilization, energy utilization ratio, exergy efficiency, exergy loss rate, exergy improvement potential rate, and sustainability index (SI). An analysis of variance showed that the drying air temperature based on the selected model had a greater effect on most responses than the sample bed thickness when carrying out the experiments. In the statistical regression analysis, it was found that the experimental data were properly fitted with a quadratic polynomial model RSM with a high coefficient of determination. In general, the most important thermodynamic property (exergy efficiency) increased with an increasing drying air temperature and bed thickness. Moreover, the results showed that the optimal conditions for the independent variables—obtained with an air temperature of 63.77 °C and bed thickness of 2 cm that optimized the responses of the drying rate (0.275 kg water/kg dry matter min), energy utilization (0.019 kJ/s), energy utilization ratio (0.230), exergy efficiency (65.75%), exergy loss rate (0.016 kJ/s), exergy improvement potential rate (1.105 kJ/s), and sustainability index (0.015)—were determined with a maximum desirability function of 0.548; therefore, the values of the IP showed that the exergy efficiency for the drying process of basil leaves can be increased. Moreover, the optimal values of these parameters obtained by RSM can help industrial engineers to provide efficient solutions for decreasing the exergy loss and improving the performance of industrial dryers, while decreasing the environmental impacts. As a result, the response surface method (RSM), with the developed models to predict all the responses and the optimization process of the desired parameters, was successful, which is an important technique to improve production in the food industry.


 ,
, 


