Article

Open Innovation Web-Based Platform for Evaluation of Water Quality Based on Big Data Analysis

1
College of Resources and Environment, Huazhong Agricultural University, Wuhan 430070, China
2
School of Environment and Health, Jianghan University, Wuhan 430056, China
3
Donghu Experimental Station of Lake Ecosystems, Cern Sub-Center of Aquatic Ecosystems, Institute of Hydrobiology, Chinese Academy of Sciences, Wuhan 430072, China
4
Computer Engineering Department, San Jose State University, San Jose, CA 95192, USA
*
Authors to whom correspondence should be addressed.
Sustainability 2022, 14(14), 8811; https://doi.org/10.3390/su14148811
Submission received: 21 May 2022 / Revised: 4 July 2022 / Accepted: 5 July 2022 / Published: 19 July 2022
(This article belongs to the Special Issue Wetlands: Conservation, Management, Restoration and Policy)

Abstract

:
There are many models presented that assess water quality. However, the applications of the models are limited due to the difficulty of preparing input data and interpreting model output. In this paper, we developed a Web-based platform to assist researchers in analyzing water quality. The data from sensors can be automatically imported to the platform according to the configured information of data structures. The platform also provides conventional methods and big data methods for the users to analyze water quality. Moreover, the users can choose the water quality parameters according to the water usage. The presented platform can show the model output in a text format and a graphic format, which allows for the analysis to be better understood by the user. The platform integrates the input, analysis, and output together well and brings great convenience to the research on water quality.

1. Introduction

Human activities, such as urbanization, agriculture, etc., often influence water quality. The water sources have been degraded by human and enterprise waste so much that there is a scarcity of fresh water. Water quality refers to the chemical, physical, biological, and radiological characteristics of water [1]. The requirements of water quality are related to the water usage. Thus, many standards on water quality assessment have been published. The most common standards used to assess water quality relate to health of ecosystems, safety of human contact, and drinking water. Although there are many studies related to water quality using conventional methods, there is no proper analysis of water polluting agents and its condition. The main shortcoming of conventional methods is that the methods usually focus on one or several special points on water quality and hardly provide a comprehensive analysis result.
Due to recent technological advancements, especially in big data technology, many new water-quality assessment methods based on big data have been proposed for water management and quality prediction. Researchers have recognized the necessity of integrating water quality models with the best available technology to overcome the barriers that hinder the use of many models. One problem is that the applications of some scientific models are limited due to the difficulty of preparing input data and interpreting model output. In this paper, we developed a Web-based platform to assist researchers in analyzing water quality that automatically imports the input data according to the user configuration. The developed platform uses various suitable technologies that can perform detailed analytics and predictions on water data. We developed a big data engine to efficiently analyze the water quality data. Aided by the platform, environmentalists can find a better solution to improve water quality.
The rest of the paper is organized as follows. In Section 2, the background and related work on water evaluation are reviewed. The system analysis and design on the proposed platform for water evaluation is described in Section 3. Section 4 discusses the analytics module in the platform. In Section 5, the application of the platform is reported. Finally, our conclusions are drawn in Section 6.

2. Background and Related Work

2.1. Background

The most common standards used to assess water quality relate to health of ecosystems, safety of human contact, and drinking water. Table 1 shows the main water quality standards and their usages.
Although different water quality standards select different parameters to evaluate water quality based on water usage, the following parameters are generally used for analyzing the water quality [2].
The water quality index includes chlorophyll A, dissolved oxygen, pH, salinity, turbidity, water temperature, nitrates, phosphates, water level and chlorine. (See supporting information).
The water quality assessment is based on a four-step process: (i) Select water quality evaluation criteria; (ii) Assemble existing water quality data; (iii) Evaluate water quality data for selected parameters; (iv) Draw conclusions. According to the above conventional method, it is easy to determine the current status of water quality. However, we only depend on the traditional methods; it is difficult for us to predict the future condition of water quality and find the potential cause of water quality decline.

2.2. Related Works

A lot of research on water quality has been done in the past years. The methods of analyzing water quality can be divided into two categories: the conventional methods and the big data methods. As we know, different water quality standards should be used to evaluate the water according to its usage. To detect and analyze gradual and abrupt trends in water quality in Huai River, Chemical Oxygen Demand (COD) and ammonia-nitrogen (NH3-N) are selected as the metrics [3]. Mann–Kendall, Theil–Sen and Pettitt tests are used to process the data from the monitor station. In the evaluation of water quality of the Amazon area in Brazil, the statistical technique using principal component analysis is used [4]. The water quality index used here includes chloride, temperature, electrical conductivity, pH, Total Suspended Solids (TSS), ammonia (NH4), nitrate (NO3), chlorophyll, turbidity (Turb.), dissolved oxygen, phosphates (PO4), and upstream water level. Since so much research on water quality evaluation has been proposed, we selected some prototype evaluation models or methods for drinking water, industrial use water and coastal water, etc. The models and the water quality parameters used by them are listed in Table 2.
In recent years, the big data method has been widely applied to many domains. Some researchers also use big data methods to analyze water quality. Table 3 shows some topics on water quality using big data methods.
According to the literary survey on the water quality problem, it is found that K-means, SVM and multiple linear regression (MLR) are the three most-used big data approaches to analyze water quality.
In our preliminary research, we found out that most of the water quality research conducted depends on the traditional or laboratory approach in which a sample of water is tested against one or more tests to evaluate the quality of water. These approaches involve manual collection and assessment of raw data. M. A. Tirabassi [2] formulated a mathematical model using mathematical statistics to predict river water quality without using the chemical, biological, and physical relationships. His work focuses on a “black box” approach where a known input can be used to accurately and reliably predict the output. L. Hu, et al. [3], has talked about Grey Relational Analysis (GRA), which is based on the distance of a point to the interval. It is a simple method that has been used for the assessment of drinking water quality in Jiaozuo River, China. However, these traditional methods are confusing in nature and have several shortcomings such as:
  • The existence of complex mathematical calculations;
  • Equal treatment to the old data and new data;
  • Difficult prediction due to overlap of multiple variables.
To overcome these problems, we developed a Web-based platform to perform analytics on various water data to provide useful and meaningful information. The platform uses various suitable technologies that can perform detailed analytics and predictions on water data. A big data engine is also provided in our platform to efficiently analyze the water quality data. Thus, our platform is a good tool for researchers to find a solution to improve water quality.

3. System Analysis and Design

3.1. System Overview

In this paper, we will develop a Web-based application to analyze water quality. The proposed application combines the traditional method and big data method to evaluate the water quality. The main functions of the system are described as follows:
  • Data Collection: The application can automatically collect data from the configured data source. A configured panel is provided to the system manager to set how to collect data.
  • Data Extraction: The application can extract the corresponding data according to the purpose of analysis. For example, it can extract the data by region, year, and water quality parameters, etc.
  • Data Analysis: The application uses different methods to analyze data. Some traditional methods and big data methods are implemented here, which are provided to the users. Moreover, data analysis can be done from different perspectives, such as water region, time period, and overall water data.
  • Data Visualization: The analysis results should be shown in a friendly way to the users. The data visualization module provides an easy way to show the results and help users better understand the results. For example, if there are some certain points in the area that lead to heavy pollution, they are shown in the map by highlights or a special color.
  • Comparing Different Models: In this application, different models or algorithms are used to evaluate the water quality. Different models would give different analysis results with different accuracy; hence, the application will provide a comparison of these different models.
  • Prediction: This is an additional feature of the application. The application provides prediction results on the tendency or future result based on the current water quality.
  • Finding Causes: The application can help the users to find the cause of the anomalies in the data and the source of pollution.

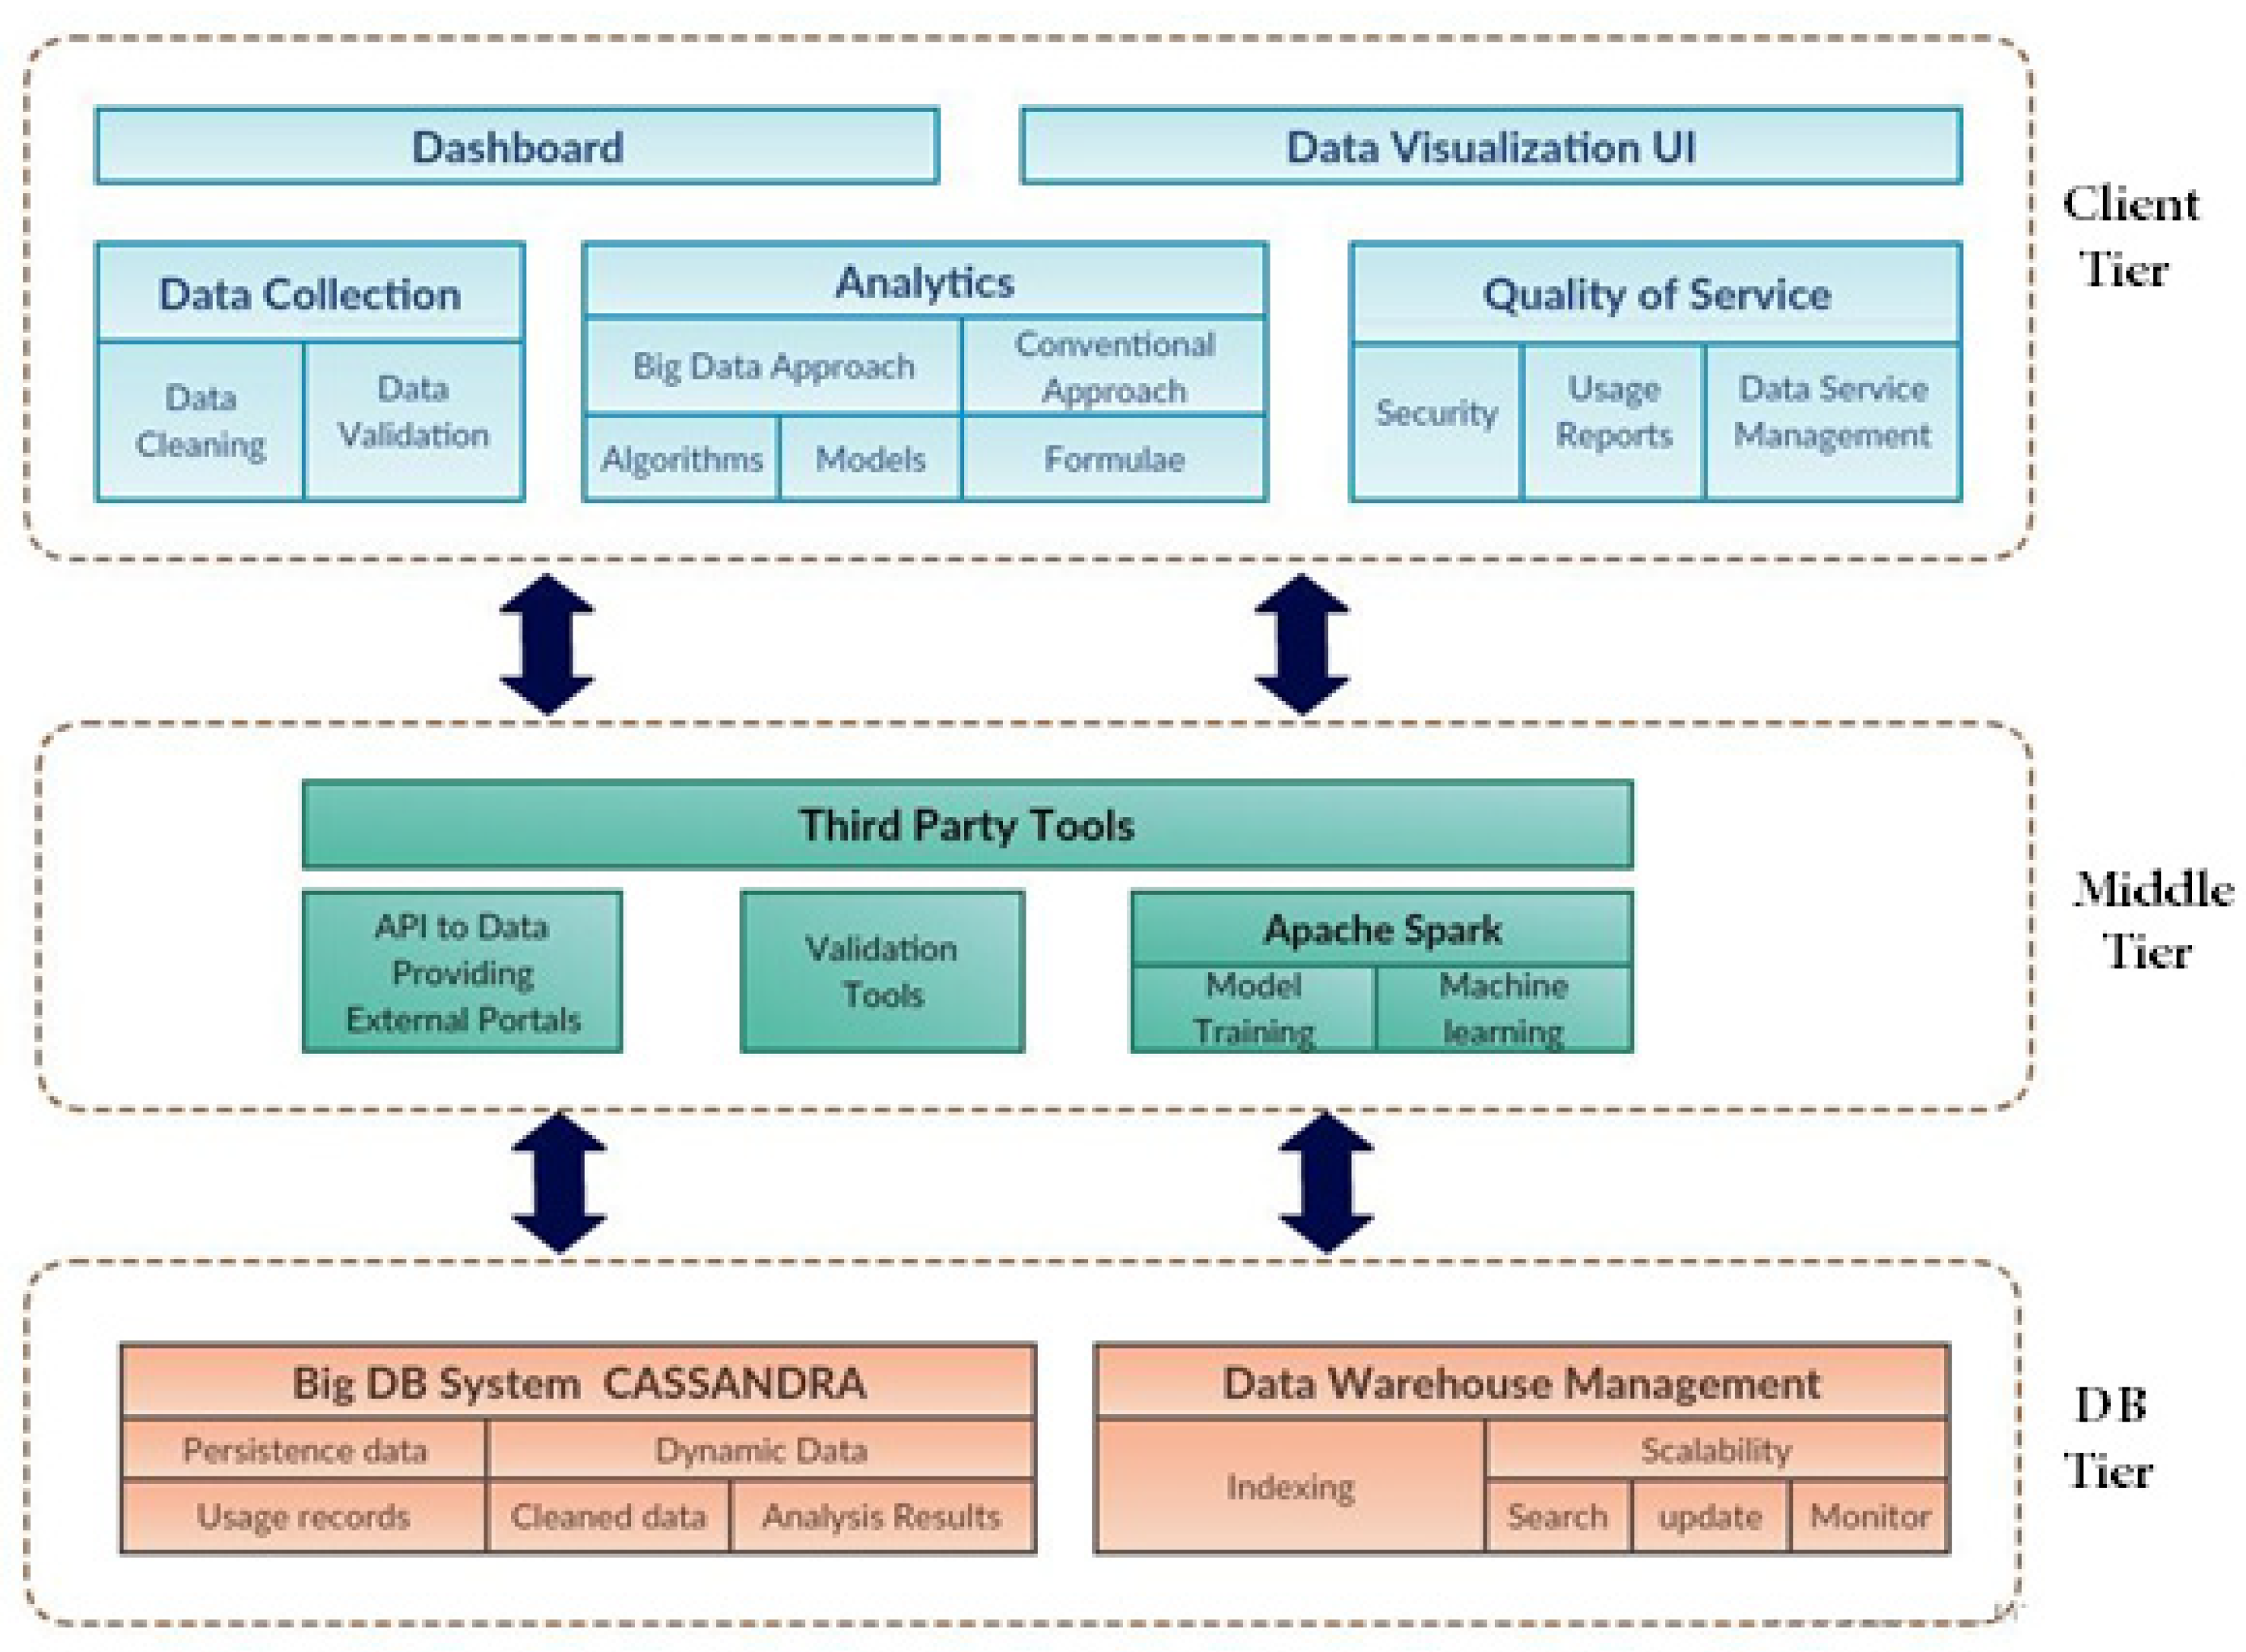
3.2. System Infrastructure

The application system is designed based on a three-tier structure, i.e., client, database, and middle tier. The three-tier architecture is shown in Figure 1.
The client tier consists of the following modules: data collection module, data analysis module, data visualization and service quality module. In the data collection module, users can collect the data from the website by choosing the durations, type of parameters, region, and data sources. Then, the collected data are cleaned and validated. The data analysis module provides two types of approaches for performing data analysis: conventional methods and big data methods. The data visualization module provides maps and different graphs, such as bar graphs and line charts, to visualize the data and analysis results. The service quality module is used to keep track of the product quality. It also stores the user activity records and provides some functions such as data service management and security.
The middle tier is the connection between the client tier and the DB tier. The middle tier provides the logical processing for the data. The middle tier mainly consists of the third-party tools used by the applications, such as the third-party API to external portals, validation tools and Apache Spark. The middle tier can be seen by a third-party tool container. By making full use of the third-party tool, the application obtains many basic functions in data collection, validation, visualization, and analyzing, which provides support effectively to the functions in the client tier.
The DB tier is in the bottom of the system architecture, which is the foundation of the application. The DB tier consists of the database and its management. There are two databases in our application: one is used to store the user analytics data, and the other is the scalable database to keep sensor data. The data warehouse management module is an important part to making the database efficient by using indexing, reference key and search key, etc. It is also responsible for scalability and performance of the warehouse.

3.3. Class Diagram

According to the three-tier structure, we find and define the classes in the three tiers. Then, we detailed the interaction between these classes. Figure 2 shows the class diagram and the interaction between them. The description on the class diagram is as follows:
  • User: User class keeps track of all the users’ login and logout details. A user can extract data and get the analysis results;
  • Collect Sensor Data: User extracts data using this class. Desired request of data is first looked up in the big data database Cassandra using search and reference keys. If not found, third-party APIs are used to extract the data from the data sources. Data is then cleansed using validation tools and stored in the database for further use;
  • Conventional Analysis: User can perform conventional analysis using this class. This provides various formulae to perform the analysis;
  • Big Data Analysis: To see the results of big data analysis, this class is invoked. This provides different models such as the analysis model and predictive model, using a variety of algorithms to perform analysis;
  • Data Visualization: This class provides various libraries to draw different charts on the basis of what chart type the user wants to use for analysis;
  • Spark: Big Data Analysis class uses the third-party tool, Spark. Any functionality and programming associated with the tool Spark are maintained and written in class “Spark;”
  • Admin: Admin class is made for admin-specific functionalities. An admin can add different models, diagnose the applications, modify functionalities related to database and see the user analytics reports;
  • Usage Report: User analytics reports are maintained in this class. This class uses the service database made for the application and stores the regular user activities. This class is mainly accessed by admin to track the activities of the application and user;
  • Validation Record: When data are collected, the raw data are cleansed, and only clean data are kept in the database. The records of the cleaning are kept using this class. It records the results of how much data was missing and truncated from the raw data. This class is useful to find the quality of the data source. For example, for a particular database, 99% of the data is always truncated due to garbage values or missing data, then the admin could decide whether to use that data source in the future or not;
  • Data Service Management: This class provides database-specific activities. All the database operations such as select, update, insert and delete are handled by this class. The application consists of two databases. One is for storing data and the other is for analytics. Both of these databases are maintained in this class.

3.4. System Data and Database Design

In our application, the relational database and big data database are both used for different purposes. The service data, which mainly include the user information and their querying records, are stored in the relational database. The water quality data, which are collected from the sensors, are stored in the big data database.

3.4.1. Big Data Warehouse Database Design

In our application, all data from the sensors include sensor data value, sensor data type, sensor location, and time. The main process of data flow is as follows: the sensor data are automatically collected according to the system manager’s configuration. Then, the collected data are cleaned and stored in the data warehouse. When users require specific data, the application will try to find the data from database and then output the data. If the data cannot be found, the system will call the collection API to obtain the data again. In addition, the data warehouse will also store the data analysis results. The indexed B-tree technique is used when storing the data.
Since the data collected from sensors are the non-structure data, we chose Cassandra database as our big data database warehouse. Figure 3 shows the conceptual data model diagram for Cassandra design. This design is originally from the big data database ER diagram. Then, according to this conceptual data model and mapping rules, the infrastructure for Cassandra is obtained and shown in Figure 4.

3.4.2. Relation Database Design

The relational database in our system is used to store the service data. The service data include the user information and their querying records. Once a user has created a login name and password from the service website, the service database will be automatically assigned a user ID. Then, the users can create their project for evaluating water quality, which will automatically be assigned a project ID. The project table includes what users are querying for, such as duration, location, platform, and its sensor, etc. In addition, one user’s project can have more than one sensor output query result as the user can query different parameters. The detail result will be in the sensor_record table, which has been cleaned and analyzed before putting it in the database. Moreover, an administrator can access the usage report including who was using the service, what water quality parameter has been queried, what the duration is, etc.
According to the above analysis, we designed the infrastructure of the relational database for the service data. Figure 5 shows the database design for the service data.

4. Analytics Module—Water Quality Assess Modeling

The analytics module is an important part of this system where overall water quality is calculated and analyzed. The analytics module consists of some analytics models. The analysis methods used here can be divided into two categories, i.e., conventional approaches and big data approaches.

4.1. Conventional Model

In the conventional approaches, NSF-WQI is the most-used method for evaluating water quality. It was developed by the National Sanitation Foundation (NSF) in 1970. A total of nine water quality parameters such as temperature, pH, turbidity, fecal coliform, dissolved oxygen, biochemical oxygen demand, total phosphates, nitrates, and total solids are used to evaluate water quality. Collected water quality data are transferred to a weighting curve chart, where a numerical value of Qi is obtained. The detailed description on NSF-WQI can be found in [20]. The mathematical expression for NSF-WQI is as follows:
W Q I = i = 1 n Q i W i
where Qi is the ith number of water quality parameter; Wi is the weight associated with ith water quality parameter, n is the total number of parameters.
However, NSF-WQI only represents the general water quality and does not represent specific use of the water. Moreover, it does not provide the method of how to process the lack of data or missing data. To remedy the above shortcomings, we used another water evaluation index from the Canadian Council of Ministers of the Environment (CCME) in our application. In the water evaluation of CCME, the major uses of water include drinking, recreation, agriculture, aquatic life, and industrial use. Following expressions F1, F2, and F3 are used to determine the CCME WQI for our study [21].
F 1 = number   of   failed   variables total   number   of   variables   × 100
F 2 = number   of   failed   tests total   number   of   tests   × 100
F 3 = n s e 0 . 01 n s e + 0 . 01  
Here, F1 (scope) represents the percentage of variables that do not meet their objective at least once during the time period under consideration (“failed variables”). F2 (frequency) represents the percentage of individual tests that do not meet objective (failed tests). F3 (amplitude) represents the amount by which failed test values do not meet their objectives. F3 is calculated by an asymptotic function that scales the normalized sum of excursions from objectives (nse) to yield a range between 0 and 100. nse is calculated as below:
n s e = i = 1 n e x c u r s i o n   i # t e s t s
The number of times by which an individual concentration is greater than (or less than, when the objective is a minimum) the objective is termed an “excursion” and expressed as follows.
e x c u r s i o n   i = objective   j ( Failed   test   value   i ) 1
F3 is then calculated by an asymptotic function that scales the normalized sum of excursions from objectives (nse) to yield a range between 0 and 100.
Finally, the CCME WQI is calculated as below:
W Q I = 100 F 1 2 + F 2 2 + F 3 2 1.732
According to the value of WQI, the water quality is shown in Table 4.
The WQI method is widely used in surface water and groundwater assessment. According to Ahmed M [22], 48 groundwater samples were collected and analyzed for 12 physicochemical parameters. Multivariate statistical approaches, including a correlation matrix, factor analysis, and hierarchical cluster analysis, were applied to differentiate the source of the water quality variation and determine the cause of groundwater deterioration. The WQI was applied according to the chemical drinking-water quality standards of the World Health Organization (WHO) with respect to the 12 parameters measured to evaluate the suitability of the groundwater for human consumption.

4.2. Big Data Modeling and Analysis

Water quality analysis is a classification/clustering problem since we need to find the regions and classify them to find which comes under the ideal recommended conditions, above/below the recommended values, worst conditions regions, etc., on the basis of parameters and time range selected. In the proposed system, some machine learning algorithms are used for the analysis of water quality. Our application provides some frequently used algorithms in big data analysis, i.e., K-means, Support Vector Machine and Multiple Linear Regression.

4.2.1. K-Means Clustering

After comparisons, we found that K-means clustering algorithm is the best for the water quality classification problem. The K-means algorithm is a cluster analysis algorithm used as a classification or partitioning algorithm. The K-means algorithm defines a random cluster centroid at first according to the initial parameters and criteria selected. Every observation is then added to the cluster according to the proximity to the cluster centroid. The clusters are then re-analyzed to determine the new centroid point. This procedure is repeated for each data object. The algorithm is composed of the following steps: [16]
  • Place K point into the space represented by the objects that are being clustered. These points represent initial group centroids;
  • Assign each object to the group that has the closest centroids;
  • When all objects have been assigned, recalculate the positions of the K centroids;
  • Repeat steps 2 and 3 until the centroids no longer move. This produces a separation of the objects into groups from which the metric to be minimized can be calculated.
Here, two parameters have to be decided in terms of mapping general K-means to our problems. One is the centroid. The centroid is the ideal condition for every water quality parameter to be in the safe range. The other is the closeness/proximity metrics. This is the standard deviation from the centroid, i.e., the ideal condition.

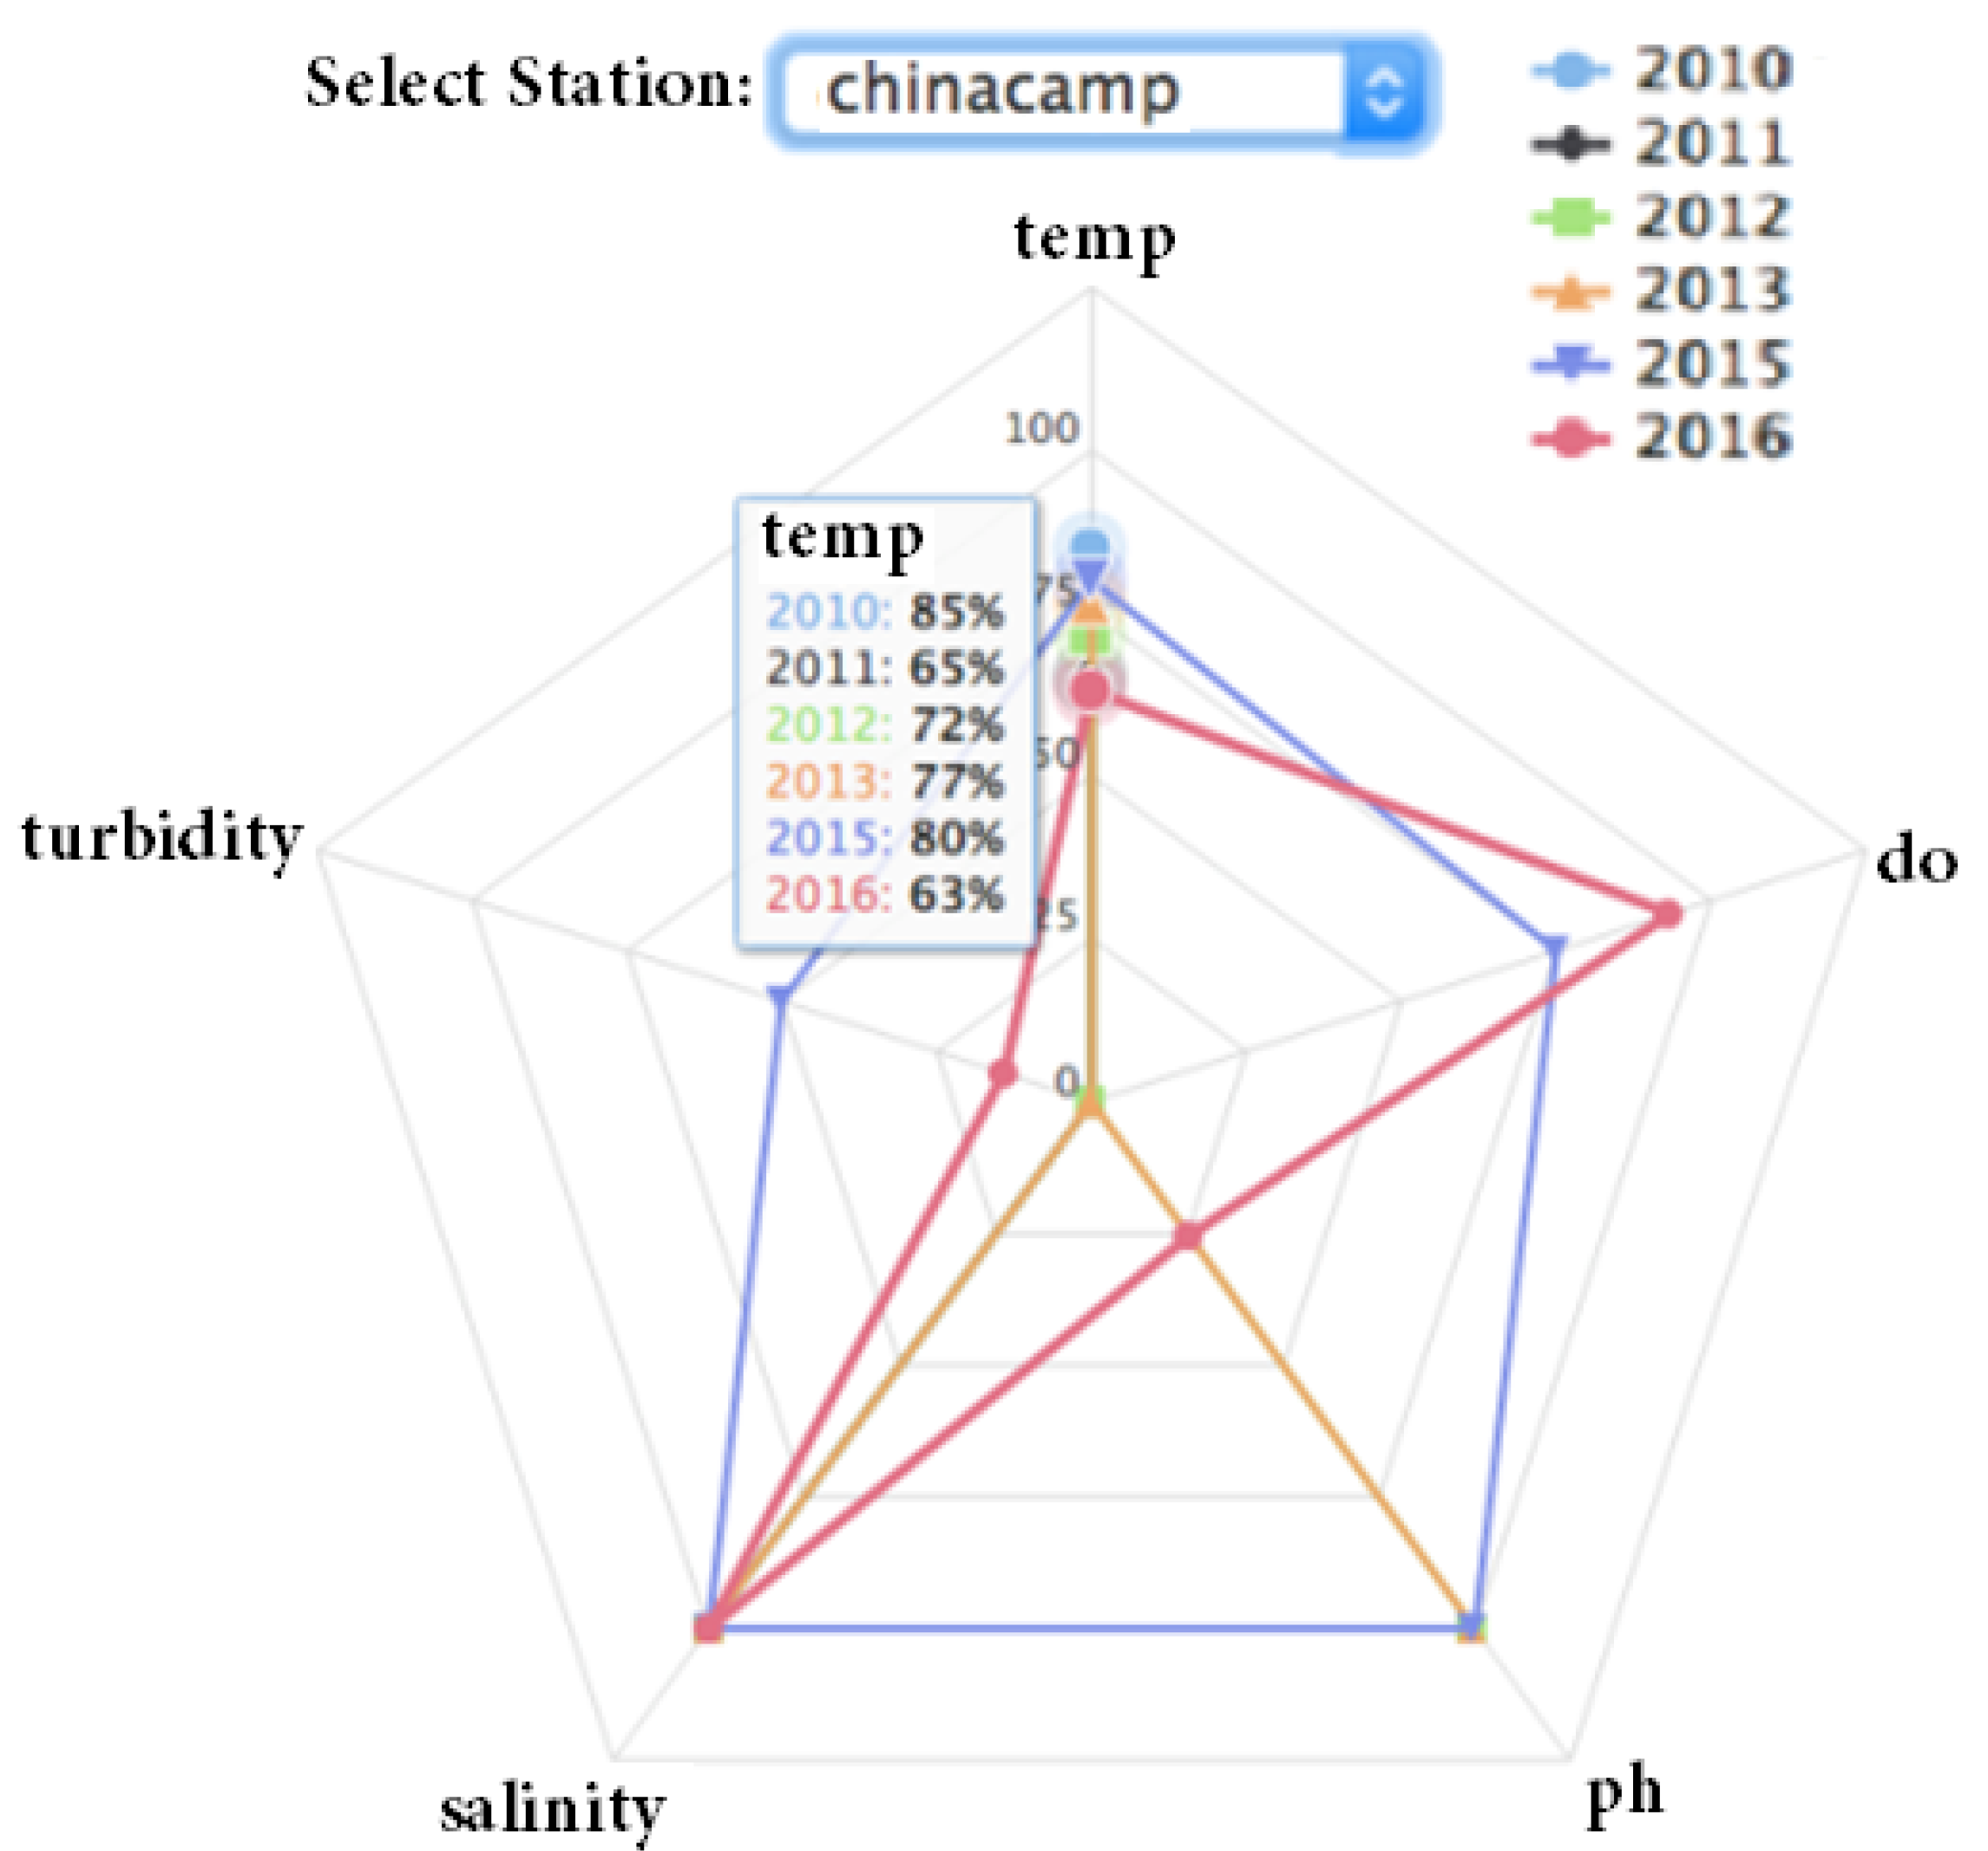
4.2.2. Calculation of Overall Water Quality Using Spider Index

The Spider Index is calculated by using a spider diagram. The quality of each parameter is calculated aggregated by year and station using the formula:
Quality   of   Param = # Observation   Params   in   idea   Range # Total   Observations × 100
Quality can be determined yearly, quarterly, monthly, or daily using this index. To calculate the overall quality index of the station, we can use following method:
  • Mean of Parameter Quality: calculate the average of all the quality parameters to find the overall quality parameter, assuming all the parameters affect water quality equally. The larger the average, the better the quality.
  • Area of Polygon: the area of polygon could be calculated to find the overall quality. A bigger area means better quality.

5. The Application of Platform

Here, we analyze the water quality of the San Francisco Bay area by using data from the sources: COAST and USGS. In our system, the water quality data of various regions of San Francisco Bay area are extracted by selecting the time period of the data [23]. Then we can analyze the data using different big data models and acquire some useful insights from the information. The system can better aid us to find the cause and curb down the pollutants in water.

5.1. Data Collection

Data Sources

USGS and CeNCOOS are the two data sources on water in San Francisco Bay. The station locations of USGS and CeNCOOs are shown in Figure 6. To aggregate the information of both the sources, we establish a mapping from CeNCOOS stations to USGS stations, which is shown in Table 5.
The stations in CeNCOOS and USGS collect the following water quality parameters: chlorophyll, dissolved oxygen, pH, salinity, turbidity, water temperature, and water level.

5.2. Data Extraction and Validation

Data Extraction

Figure 7 shows the sensor information file. This file contains the Station Name, Sensor Type, Latitude, Longitude, Maximum Value, Minimum Value, Average Values and Units.
The data extraction is automated using a BASH script, which will run periodically and then download and clean new data before pushing it into the database for use by the Web dashboard and charts. Data cleaning is also governed by the BASH script after data collection and is done in multiple iterations. The first iteration removes garbage values. These values could be any value that does not satisfy the variable type. The second iteration removes the out-of-range values. The third iteration removes all the duplicate rows. Finally, the redundant data are removed, such as sensor name and station name.

5.3. Data Validation

After cleaning the newly imported data, we use Tableau Desktop 9.3 to validate data collected from CeNCOOS. We used the bubble diagram on a map and the XY Coordinate in Tableau to display the information from stations. An example of the validation results in our system is shown in Figure 8. The bubbles on the map are showing their locations, average values of all their sensors and the number of records. The size and the color of the bubbles are determined by the parameter values of water temperature and salinity. The detailed information on each parameter, such as number of records and maximum/minimum value, is shown on the right-hand side of Figure 8.

5.4. Data Storage

After data validation, the data are stored in the system database. We also use a bubble view to show each year of data, which is shown in Figure 9. The size of the bubble denotes the counts of records available for that year and the color represents the average water temperature for that year. By double clicking the bubble, we can obtain the statistics information of all parameters in all stations ordered by year. The Gantt view is used to illustrate the entire dataset in our system, which is shown in Figure 10. It is a good way to recognize variation in data.

5.5. Data Presentation

A friendly UI in our system is provided to check the sensor location, status, and its data, which is shown in Figure 11. Clicking on a sensor brings up the data available for that sensor, which is shown in Figure 12.
Based on the analysis model, the water quality can be evaluated by different approaches. Figure 13 shows the result according to the Water Quality Index. The result also can be presented by the Sankey chart, which is shown in Figure 14.
Moreover, we can also obtain the analysis results by some methods used in big data analysis. Figure 15 and Figure 16 show the results by using spider index. Figure 17 and Figure 18 show the K-means classification results of the water quality by bubble view.

6. Conclusions

In this paper, we first summarized the water quality index for different uses. Then, we developed a Web-based platform, which provides an open interface to access the water quality data from the sensors. Moreover, both the traditional approaches and big data methods are integrated in this platform. With the aid of the platform, we can analyze the water quality based on not only the traditional methods but also based on big data analysis. Some popular methodologies and technologies used to develop our platform are Cassandra for our big data database, Google High Chart for coloring region mapping, and spider diagrams. The users can better understand and use the analysis results. Therefore, the platform can be a good tool that we can use to analyze water quality.

Author Contributions

Data curation, X.H.; Formal analysis, X.H.; Funding acquisition, H.S.; Methodology, H.S.; Project administration, H.H. and J.G.; Resources, J.G.; Writing—original draft, X.H. All authors have read and agreed to the published version of the manuscript.

Funding

This work was financially supported by the project “CERN long-term observation data mining and annual data report” (Grant KFJ-SW-YW043) and “Community structure of macrobenthos and microbial diversity in sediments of Northwest Lake and Guizi Lake“ (Grant 3015/08210056).

Institutional Review Board Statement

This study does not involve human or animal research.

Data Availability Statement

Data is collected from sensors installed across the San Francisco Bay by Organizations like CeNCOOS (Central and Northern California Ocean Observing System) and USGS’s NWIS (U.S. Geological Survey’s National Water Information System).

Acknowledgments

The authors would like to thank Dolly Gupta, Vincent Poon, Sonam Saini, Madhav Vasudev, Yong Wang and Huiming Cao for their contribution of in designing and developing the water evaluation platform.

Conflicts of Interest

The authors declare no conflict of interest.

References

  1. Diersing, N.; Nancy, F. Water Quality: Frequently Asked Questions; Florida National Marine Sanctuary: Key West, FL, USA, 2009. [Google Scholar]
  2. Abbasi, T.; Abbasi, S.A. Water Quality Indices; Elsevier: Amsterdam, The Netherlands, 2012. [Google Scholar]
  3. He, T.; Lu, Y.; Cui, Y.; Luo, Y.; Wang, M.; Meng, W.; Zhang, K.; Zhao, F. Detecting gradual and abrupt changes in water quality time series in response to regional payment programs for watershed services in an agricultural area. J. Hydrol. 2015, 525, 457–471. [Google Scholar] [CrossRef]
  4. Lobato, T.C.; Hauser-Davis, R.A.; Oliveira, T.F.; Silveira, A.M.; Silva, H.A.N.; Tavares, M.R.M.; Saraiva, A.C.F. Construction of a novel water quality index and quality indicator for reservoir water quality evaluation: A case study in the Amazon region. J. Hydrol. 2015, 522, 674–683. [Google Scholar] [CrossRef]
  5. Newton, A.; Mudge, S.M. Lagoon-sea exchanges, nutrient dynamics and water quality management of the Ria Formosa (Por-tugal). Estuar. Coast. Shelf Sci. 2005, 62, 405–414. [Google Scholar] [CrossRef]
  6. Newton, A.; Mudge, S.M. Temperature and salinity regimes in a shallow, mesotidal lagoon, the Ria Formosa, Portugal. Estuar. Coast. Shelf Sci. 2003, 57, 73–85. [Google Scholar] [CrossRef] [Green Version]
  7. Lattemann, S.; Höpner, T. Environmental impact and impact assessment of seawater desalination. Desalination 2008, 220, 1–15. [Google Scholar] [CrossRef]
  8. Alizadeh, M.J.; Kavianpour M, R. Development of wavelet-ANN models to predict water quality parameters in Hilo Bay, Pacific Ocean. Mar. Pollut. Bull. 2015, 98, 171–178. [Google Scholar] [CrossRef] [PubMed]
  9. Lima, E.; Legey, L.F.L. Water Quality Restoration in Rio de Janeiro: From a Piecemeal to a Systems Approach. J. Environ. Dev. 2010, 19, 375–396. [Google Scholar] [CrossRef]
  10. Shrestha, S.; Kazama, F. Assessment of surface water quality using multivariate statistical techniques: A case study of the Fuji river basin, Japan. Environ. Model. Softw. 2007, 22, 464–475. [Google Scholar] [CrossRef]
  11. Sridhar, R.; Thangaradjou, T.; Kumar, S.S.; Kannan, L. Water quality and phytoplankton characteristics in the Palk Bay, southeast coast of India. J. Environ. Biol. 2006, 27, 561–566. [Google Scholar] [PubMed]
  12. Vega, M.; Pardo, R.; Barrado, E.; Debán, L. Assessment of seasonal and polluting effects on the quality of river water by exploratory data analysis. Water Res. 1998, 32, 3581–3592. [Google Scholar] [CrossRef]
  13. Coskun, H.G.; Tanik, A.; Alganci, U.; Cigizoglu, H.K. Determination of environmental quality of a drinking water reservoir by remote sensing, GIS and regression analysis. Water Air Soil Pollut. 2008, 194, 275–285. [Google Scholar] [CrossRef]
  14. Beck, M.W.; Hagy, J.D., III. Adaptation of a Weighted Regression Approach to Evaluate Water Quality Trends in an Estuary. Environ. Modeling Assess. 2015, 20, 637–655. [Google Scholar] [CrossRef]
  15. Chenini, I.; Khemiri, S. Evaluation of ground water quality using multiple linear regression and structural equation modeling. Int. J. Environ. Sci. Technol. 2009, 6, 509–519. [Google Scholar] [CrossRef] [Green Version]
  16. Modaresi, F.; Araghinejad, S. A Comparative Assessment of Support Vector Machines, Probabilistic Neural Networks, and K-Nearest Neighbor Algorithms for Water Quality Classification. Water Resour. Manag. 2014, 28, 4095–4111. [Google Scholar] [CrossRef]
  17. Areerachakul, S.; Sanguansintukul, S. Clustering Analysis of Water Quality for Canals in Bangkok, Thailand; International Conference on Computational Science and Its Applications; Springer: Berlin/Heidelberg, Germany, 2010; pp. 215–227. [Google Scholar]
  18. Aryafar, A.; Gholami, R.; Rooki, R.; Ardejani, F.D. Heavy metal pollution assessment using support vector machine in the Shur River, Sarcheshmeh copper mine, Iran. Environ. Earth Sci. 2012, 67, 1191–1199. [Google Scholar] [CrossRef]
  19. Liu, M.; Lu, J. Support vector machine―an alternative to artificial neuron network for water quality forecasting in an agricultural nonpoint source polluted river? Environ. Sci. Pollut. Res. 2014, 21, 11036–11053. [Google Scholar] [CrossRef] [PubMed]
  20. Noori, R.; Karbassi, A.; Ashrafi, K.; Ardestani, M.; Mehrdadi, N.; Bidhendi, G.-R.N. Active and online prediction of BOD5 in river systems using reduced-order support vector machine. Environ. Earth Sci. 2011, 67, 141–149. [Google Scholar] [CrossRef]
  21. Kaur, M.; Das, S.K.; Sarma, K. Water quality assessment of Tal Chhapar Wildlife Sanctuary using water quality index (CCME WQI). Acta Ecol. Sin. 2021. [Google Scholar] [CrossRef]
  22. Masoud, A.M.; Ali, M.H. Coupled multivariate statistical analysis and WQI approaches for groundwater quality assessment in Wadi El-Assiuty downstream area, Eastern Desert, Egypt. J. Afr. Earth Sci. 2020, 172, 103982. [Google Scholar] [CrossRef]
  23. Dolly, G.; Vincent, P.; Sonam, S.; Madhav, V. Big Data Based Water Quality Evaluation for San Francisco Bay Based on COAST Data. A Project Report Presented to The Faculty of the Computer Engineering Department. Master’s Thesis, San Jose State University, San Jose, CA, USA.
Figure 1. System architecture of the application.
Sustainability 14 08811 g001
Figure 2. Class diagram. “*”means that it must appear at least once.
Sustainability 14 08811 g002
Figure 3. Conceptual data model diagram for Cassandra.
Sustainability 14 08811 g003
Figure 4. The Cassandra infrastructure for the application.
Sustainability 14 08811 g004
Figure 5. Database design for the service data.
Sustainability 14 08811 g005
Figure 6. Station locations.
Sustainability 14 08811 g006
Figure 7. Sensor data file information.
Sustainability 14 08811 g007
Figure 8. The validation results in our system.
Sustainability 14 08811 g008
Figure 9. Bubble view for data of each year.
Sustainability 14 08811 g009
Figure 10. Gantt view of the entire data set.
Sustainability 14 08811 g010
Figure 11. Location of sensors.
Sustainability 14 08811 g011
Figure 12. The data records in the sensor.
Sustainability 14 08811 g012
Figure 13. Water Quality Index in the San Francisco Bay.
Sustainability 14 08811 g013
Figure 14. Sankey Chart displaying water quality dependencies.
Sustainability 14 08811 g014
Figure 15. Spider diagram showing water quality of a specific station.
Sustainability 14 08811 g015
Figure 16. Spider diagram showing water quality of all stations.
Sustainability 14 08811 g016
Figure 17. K-Means classification using a bubble diagram.
Sustainability 14 08811 g017
Figure 18. Bubble diagram classified for different years.
Sustainability 14 08811 g018
Table 1. Water quality standard and their usages.
Water Quality IndexWater Usage
Brown (NSF-WQI)General
Nemerow and sumitomos index (US Environmental Protection Agency)Human, indirect, remote contact use
Prati’s indexGeneral
DEininger and landwehr’s Public Water Supply (PWS)
McDuffie and Haney’s River pollution index
Dinius’ water quality indexImpact of pollution control efforts
O’Connor’s IndicesFish and Wildlife (FAWL) and PWS
Walski And Parker’s indexrecreation water (swimming and fishing)
Stoner’s indexPWS and irrigation water
Table 2. Some conventional models and methods for water quality evaluation.
Paper IDPurposesModel/MethodsParameters/MetricsData Source
[5]Evaluate coastal waters for ecological and recreational valueEEA 2001NH4+, NO2− and NO3−Historical data
[6]Water deterioration in southern PortugalEvaporation and salinity modeltemperature and salinityData stations
[7]Seawater desalination capacitiesEnvironmental Impact Assessment (EIA)Temperature, Density and SalinityWorld Health Organization
[8]Predict ocean water quality in Hilo BayArtificial neural networkChlorophyll, Dissolved Oxygen, Salinity, Turbidity and TemperatureData station in Hilo Bay
[9]Analyze water quality restoration in Guanabara BayEutrophication modelsChlorophyll, phosphorous, nitrogen, BOD, DC, and PCJapan International Cooperation Agency
[10]Eutrophication and degradation of coastal watersWASP ModelSalinity, Dissolved Oxygen, Nitrogen, Ammonia, Organic Nitrogen, Phosphorus
[11]Analyze water quality of Chesapeake BayHydrodynamic modelDissolved Oxygen, Nitrite, Ammonia, Chlorophyll, Total phosphateChesapeake Bay
[12]Evaluate pollution effects on river water qualitySampling and ClusterIron, Flow rate, hardness, bicarbonate, potassium, magnesiumWater sample
Table 3. Some big data methods for water quality evaluation.
Paper IDPurposeAlgorithms
[13]Determine the environmental quality of a drinking water reservoir by remote sensingmultiple Regression Analysis
[14]Evaluate water quality trends in an estuaryWeighted regression
[15]Evaluate groundwater qualityMultiple linear regression
[16]Water quality classificationMachine leaning algorithms
[17]Evaluate water quality of canals in BangkokK-means
[18]Heavy metal pollution assessment in the Shur RiverSupport Vector Machine
[19]Water quality forecasting in an agricultural nonpoint source polluted riverSupport Vector Machine
[20]Prediction of BOD5 in river systemsSupport Vector Machine
Table 4. CCMI WQI.
Table 4. CCMI WQI.
CCME Index ValueWater Quality
95–100Excellent
80–94Good
60–79Fair
45–59Marginal
0–44Poor
Table 5. Station Mapping.
CeNCOOSGallinas CreekDumbartonSan MateoPier 17/Fort PointAlcatrazChina Camp
USGS13, 12.5, 1136, 29.5, 30, 3227, 2421, 201815
Publisher’s Note: MDPI stays neutral with regard to jurisdictional claims in published maps and institutional affiliations.

