Abstract
The COVID-19 pandemic has created unforeseen effects in public transport and the mobility of people in cities globally. Johannesburg, being a developing city in one of the most affected countries in Africa during the pandemic, has experienced severe changes in traffic management and travel patterns as a result of the restrictions imposed on movement. Hence, this study examined the spatial variations in traffic during the pandemic. The study utilized data obtained from the TomTom Traffic Index for the city of Johannesburg from 2019 to 2021, with 2019 representing the period pre-COVID-19 with no lockdown restrictions, 2020 representing the period with restricted movement to limit spread of COVID-19, and 2021 representing a period of relaxed and minimized restrictions on movement. Our findings revealed that there was a variation in congestion levels between 2019–2021 with year 2020 having the least congestion from the beginning of the COVID-19 restrictions due to regulations enforced in movement and reduced travel. Our findings further revealed that traffic congestion was higher during weekdays than weekends during the three periods, with mini-bus taxis as the major contributors to congestion. Consequently, there is a need to discourage the use of single occupancy vehicles and invest in more sustainable means of transportation to ease the mobility of people and reduce traffic on major roads.
1. Introduction
Cities worldwide have found themselves on the brink of massive traffic expansions which has threatened their ability to manage traffic. The situation has worsened in developing regions due to already prevailing traffic congestion []. Traffic overcrowding refers to a situation where road networks converge and a large amount of traffic needs to traverse through the area, thus inhibiting free traffic flow [,]. Consequently, Jain et al. [] asserted that poor traffic management systems are one of the causes of traffic congestion in most developing and third world countries, thus preventing the free flow of traffic along major roads and massive traffic jams for prolonged time periods.
The optimized interaction between traffic and its infrastructure without interruption is characterized as traffic flow []. Thus, the study of traffic flow is the foundation for understanding the behavior of traffic (pedestrians, public transport, and cargo) in a system. This behavior is primarily influenced by the users of such a system and by external influences. Chief among these is the way in which infrastructure and users interact []. Traffic engineering, therefore, pertains to the analysis of the behavior of traffic and the design of facilities in a bid to facilitate the smooth, safe, and economical operation of traffic [,].
Aging physical transportation infrastructure such as the conditions of roads, highways, or bridges are often blamed as one of the inherent causes of traffic congestion []. However, congestion is also partly responsible for accelerating the physical degradation of transportation infrastructure and consequently for reducing the transportation network performance [,]. According to a study by [], there have been several recovery strategies aimed at improving the damaged network performance, but most of these strategies are not sufficient or even might not be applicable for congested road traffic conditions.
Furthermore, Kumarage [] asserted that traffic congestion is a global issue which challenges the development of a resilient and sustainable transportation system. Therefore, the main thrust of this research paper was to contribute to the development of a sustainable and resilient transportation management system which can minimize the negative impact of congestion and ensure free traffic flow on major roads in Johannesburg. In this paper, we examined the COVID-19 pandemic’s effect on traffic congestion in the city of Johannesburg, comparing the changes in congestion volumes from 2019 to 2021.
Related Work
Due to the incremental challenges of urbanization, there has been a growth in transportation studies to improve the quality of service. Research by [] has revealed that areas in and around central business districts suffer from peak hour traffic congestion. This has now become a common burden that is hardly avoidable for many residents. To mitigate such challenges, experts and scholars have focused on intelligent transportation systems to analyze historical and real-time mobility trends so as to develop reactive systems to improve traffic flow conditions. This is evidenced by the growth in traffic research using geographic information systems [,], traffic sensors [], and traffic control measures []. Research by [] defined traffic flow as the interactions between the travelers (for both commuting and recreational trips) and their surrounding infrastructure which supports travelling. These surroundings include road infrastructure such as buildings, traffic control, stations, and bus stops, and the objective has been to develop an optimal transportation system with efficient movement of traffic. Moreover, the level of traffic flow can also be expressed as a function of free flow and exposure to obstacles that limit free flow (these obstacles can be traffic control measures or congestion). According to [,,], such examples of studies to improve traffic flow have focused on developing prediction and estimation models. From these studies, it is evident that a widely used deterministic model of traffic flow systems utilizes discrete-time meanings, such as time of day [,], month, and season [] or discrete location []. Similar to these studies, we sought in this paper to visualize traffic flow trends during the peak hours and also to assess any seasonal variations. Regarding location, studies have revealed that various locations in the city experience congestion differently [,,]. This has led route planners to develop adaptive response systems that redirect traffic from heavily congested to alternative routes.
Several scholars have identified variables affecting traffic flow conditions, although these vary in relation to the specific area of analysis. For example, Zhang et al. [] outlined a relationship between congestion and land use. This led to urban planners seeking to develop transit-oriented cities to ensure that locations along economic corridors in the city have adequate transportation capacity [,]. Consequently, city authorities have now begun using the nodal approach to planning, as it promotes accessibility between residential areas and workplaces. In Johannesburg, South Africa, the city has invested in Transit Oriented Development (TOD) as a means to improve economic activities along selected corridors in the city []. Research by [] highlighted how these TODs have also been used as tools for addressing spatial inequalities by linking residents with areas of economic opportunities. Land use has been identified as a variable that has a functional relationship with the level of traffic flow. Therefore, planners need to ensure a balance of investment in economic areas and the supporting public transportation infrastructure. However, given the merits of the nodal approach to development, uncertainty still exists as to the possibility of creating adequate nodes that have a critical mass to impact developmental trajectories significantly [,].
COVID-19 has led to researchers tapping into new data collection approaches and analyses. Table 1 outlines the emerging approaches to assess trends that have emerged in transportation planning during to COVID-19 pandemic.

Table 1.
Emerging approaches in transportation planning.
Given the above-mentioned challenges to traffic flow, city authorities during the COVID-19 pandemic shifted to measures that reduced the need for travel as a response to reduce transmission []. This had an impact on how people conduct their work, with more people working from home as compared to the office. This dramatically reduced congestion on major roads in cities []. Lessons learned from this shift revealed some possibility of people traveling at different times to reduce travel demand during the morning and peak hours.
2. Materials and Methods
The metropolitan city of Johannesburg is at the heart of Gauteng, South Africa’s economic hub. Given the recent COVID-19 pandemic, urban mobility has been affected by several restrictions to movement. The paper assessed the impacts of the lockdown regulations on movement, and Table 2 summarizes the COVID-19 movement restriction timeline in South Africa from 2019 to 2021.
Table 2.
Timeline of COVID-19 movement restriction in South Africa.
The paper used the TomTom Traffic Index ϵ for the city of Johannesburg from 2019 to 2021, with 2019 representing the period pre-COVID-19 with no lockdown restrictions, 2020 representing the period with restricted movement to limit the spread of COVID-19, and 2021 presenting a period with relaxed movement restrictions. The TomTom Traffic Index ϵ reflects the extra average travel time which is calculated from the baseline for the city by analyzing free-flow travel times of all vehicles on the entire road network []
where represents the actual travel time, which is calculated from the baseline for the city by analyzing free-flow travel times of all vehicles on the entire road network. To visualize the congestion level in the city, we assumed > 0 as time is discrete. For each road network, we denote the density of vehicles per at time T which results in the state of the road network. It should also be noted the density of vehicles changes dynamically over time. If a model of travel time is available, then one can deduce a trend graph for low, moderate, and high congestion levels. The main assumption of the time series is that an observation at a given time depends only on its previous values and a random noise. Hence, curve fitting with radial basis functions was used for the model for the time series [,].
Level of service (LOS) was determined as the saturation flow rate, expressed between the range 0 to 1 calculated using the below equation.
where, = adjusted saturation flow rate (number of vehicles per hour on road segment), and = adjustment factor for road width (all road widths were taken as 1 as all roads had a standardized width). = adjustment factor for existence of parking activity adjacent to road. = adjustment factor for blocking effect on road such as accident, stationery vehicle, etc. (this was rated based on number of reported blocks on the road and then expressed as a percentage).
To validate traffic data, standard measurement devices for traffic, namely loop detectors, magnetometers, radar traffic detectors, or video detection systems, were used. These were positioned at fixed and predefined positions in the network to monitor a section of road, and they are able to detect and assign a timestamp to the event such as a vehicle crossing the road section. Information is then aggregated in time slots.
3. Results
3.1. Level of Service
A spatial analysis of congestion trends for the city of Johannesburg in 2020 revealed congestion trends during peak hours. Figure 1 shows the average congestion during the morning peak hour from 06:00 to 08:00 and the corresponding average speed limit in the city. During the morning peak hour, most of the freeway roads such as the M1 north, N1 northwestern bypass, and N3, northeastern bypass were highly congested. In Johannesburg, freeways connect commuters from residential areas to places of economic opportunities. An example is the M1 which connects commuters residing in the low-income residences located south of Johannesburg (such as Soweto, Orange farm, and Southgate) with the inner city (Braamfontein CBD and Rosebank CBD) and the northern parts of Johannesburg (Sandton and Midrand) which are characterized as economic nodes with mixed land use. Hence, the M1 south was also heavily congested during the evening peak hour, as commuters were traveling to their homes. Additionally, there was high congestion along major roads in and around the Fourways, Illovo, Midrand, and Sandton suburbs which have a mix of residential and business land uses.
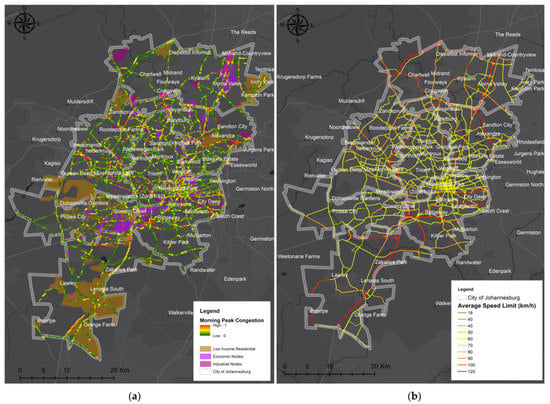
Figure 1.
(a) Average congestion over 12 months during the morning peak hour (06:00 a.m. to 08:00 a.m.) in 2020, (b) average speed limit.
A spatial analysis of congestion trends during the afternoon peak between 12:00 and 14:00 revealed that major roads along business land uses were highly congested (see Figure 2). Notable examples include the Braamfontein CBD, Rosebank CBD, and Sandton CBD areas. Furthermore, access roads from the major freeways (M1, N1, N3, M2, N17, and the M5) were also highly congested. The density of various road classes and the respective speed limits demonstrated some intriguing results. Locations with minor road density that have speed limits ranging from 18 km/h to 40 km/h were associated with lower congestion, while those with a higher road density and higher speed limits from 60 km/h to 120 km/h tended to be associated with more congestion.
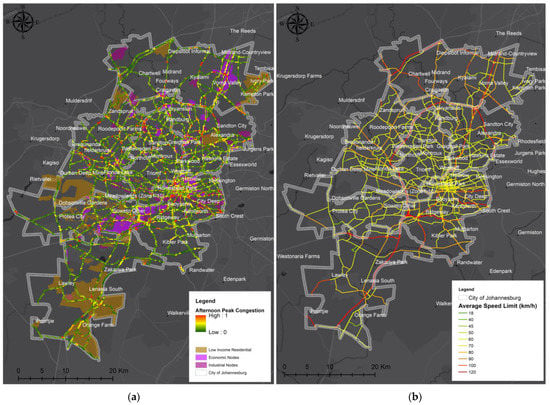
Figure 2.
(a) Average congestion over 12 months during the afternoon peak hour (12:00 p.m. to 14:00 p.m.) in 2020, (b) average speed limit.
During the evening peak hour, the major freeways such as the M1 south; the N1 south, the western bypass; and the N3 south, eastern bypass were heavy congested as commuters traveled from their workplaces to residential areas in the south of the city (see Figure 3). The merging roads (ramps) to these freeways may experience congestion due to the increase in demand to access the freeways. Road segments along residential areas with speed limits between 18 km/h to 40 km/h were less congested. Moreover, major public transportation routes served by mini-bus taxis were also highly congested during the evening. The mini-bus taxi is regarded as part of the informal public transportation system and as such, there has been limited control over their operation. Mini-bus taxi drivers are paid on commission; therefore, they have resorted to making their own decisions on a daily basis as to how they operate so as to make the most money. The result of this freedom regarding operations has been the increased number of mini-bus taxis on the roads, which has led to congestion.
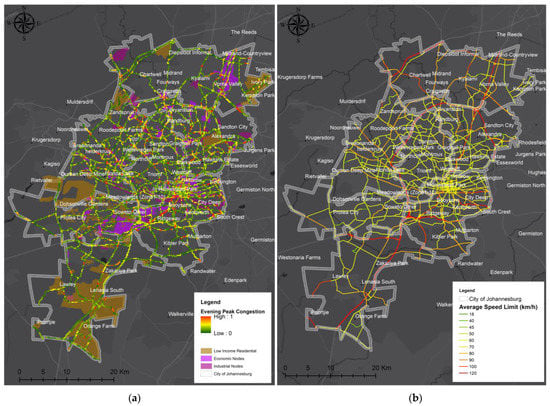
Figure 3.
(a) Average congestion over 12 months during the evening peak hour (166:00 p.m. to 18:00 p.m.) in 2020, (b) average speed limit.
3.2. Analysis of Congestion
Figure 4 depicts the variations in congestion levels for two epochs: the period without movement restrictions or limited restrictions during 2019 and 2021 and the period when movement was restricted in 2020. During the months of January and March for the three periods, there were few variations in congestion levels trends, as these periods had similar traffic with little to no movement restrictions being imposed. Given this similarity, we could assume that the average congestion in a month does not change for different years. We then used the data from the year 2019 as the normal congestion level for the respective months and the data in 2020 to assess whether the movement restrictions had a significant impact on congestion levels in the city. We used the data from 2021 to assess the implications of relaxing movement restrictions. Figure 4 outlines the observed trends. These revealed that movement restrictions led to reduced congestion in the city. However, with continued relaxation of movement restrictions, congestion levels returned to the norm of 2019. Additionally, there was a correlation between an increase in congestion with further relaxation of movement restrictions. The data also revealed that the introduction of movement restrictions alone was not enough to reduce congestion; there is a need to improve public transportation facilities to make them more attractive to the general public.
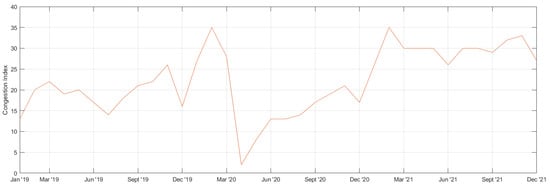
Figure 4.
Average congestion levels per month.
The city of Johannesburg is one of the most populated cities in the Republic of South Africa (RSA) due to the different kinds of opportunities afforded, as the city attracts people from different corners of the Republic and the world. During 2019, when COVID-19 started globally, the RSA was not affected by the pandemic in any way, and everything functioned normally. Specifically, traffic congestion was very high, which was a normal problem throughout the year.
In 2020, the RSA was affected by the COVID-19 pandemic. For the first three months (January, February, and March), the country was still functioning normally as in previous years, and the traffic congestion was at its normal rate which was high. In late March, the Republic was under COVID-19 lockdown where movement was prohibited, and all persons were required to remain home indoors. Any movement from one location to the next required a permit to be produced, and as can be seen in Figure 4, the level of traffic congestion was at 2% which was the lowest rate at any point. From May to December, restrictions on movement were slowly being lifted due to numerous reasons such as opening the economy and allowing some activities. Hence, the graph trends were slowly increasing. However, in 2020, the level of traffic congestion was very low as there were strict regulations put in place.
In 2021, restrictions were lifted as the economy was slowly opening, and there was more movement on roads. Traffic congestion was not the same as in previous months when compared with the same months of different years prior to the COVID-19 pandemic. In 2021, traffic congestion was lower as the government encouraged hybrid working to delineate high public engagement for individuals due to skepticism of the pandemic being deadly. However, it is noted that with the absence and the presence of the pandemic, the city of Johannesburg still suffered high traffic congestion levels per month.
3.3. Comparison of Average Hourly Congestion Level
Traffic congestion differed hourly, as there were different rush hours between the mornings, afternoons, and evenings. This was mostly caused by individuals commuting from home to work or work to home and/or any place of interest. This movement from origin to destination could not be avoided by travelers; hence, the traffic congestion when travelling took place at the same time. Figure 5 shows the average hourly congestion levels from 2019 to 2021.
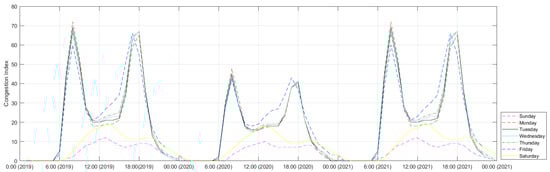
Figure 5.
Average hourly congestion (2019–2021).
The city of Johannesburg traffic congestion levels are not the same for the weekdays and the weekend. In 2019 and early 2020, 2019 representing the period pre-COVID-19 with no lockdown restrictions, the daily patterns during weekdays appeared the same as the weekend patterns. The busiest time on the city of Johannesburg roads was the morning around 7:00 a.m. throughout the week as most individuals are rushing for business, school, work, etc. As can be seen from Figure 5, the morning rush hour had over 70% traffic congestion. This was followed by the afternoon rush hour later in the day around 17:00 p.m. with the traffic congestion around 60% to 68% from Mondays to Thursdays, and on Fridays, the rush hour was around 16:00 p.m.
On Saturdays, the volume of traffic congestion was very low which is evident from Figure 5. The index showed that the traffic congestion was not over 20%, only high early in the afternoon around 12:00 p.m., and kept on dropping every hour. Accordingly, Sundays had lower traffic congestion compared to all the weekdays, as the high traffic congestion was below 14% around 11:00 a.m. Therefore, there were low traffic congestion volumes on weekends as people are not travelling to work, business, or school and these are the factors contributing mostly to travel around the city. A trend was evident of low or high congestion every hour from 5:00 a.m. in the morning, and levels of traffic congestion were noted throughout the afternoon.
During the months of January and February in all the years of 2019, 2020, and 2021, there were few variations in congestion levels, as these periods had similar traffic without any movement restrictions being imposed. Given this similarity, we could assume the average congestion in a month does not change for different years. We then used the data from the year 2019 and 2021 as the normal congestion level for the respective months and used the data in 2020 to assess whether the movement restrictions had a significant impact on congestion levels in the city. Figure 6 and Figure 7 show the observed trends. These revealed that the congestion patterns were similar for all the months, as essential activities still need cars and contribute to congestion. During the commencement of the COVID-19 pandemic, there was an increase in the preference to use private vehicles, as public transportation was viewed as a potential hot spot for contracting the virus. The summary data observed from 2020 and 2021 were below the observed data from 2019; however, the introduction of restrictions alone was not enough to reduce congestion, and there is a need to improve public transportation facilities in order to make them more attractive to the general public.
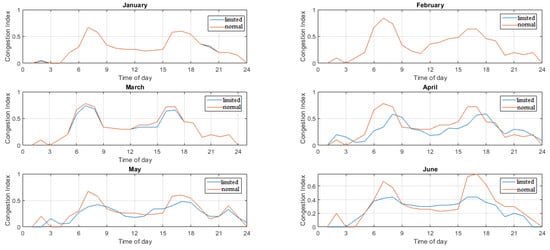
Figure 6.
Congestion Index for period with no restriction (normal) and period with movement restriction (limited) from January to June.
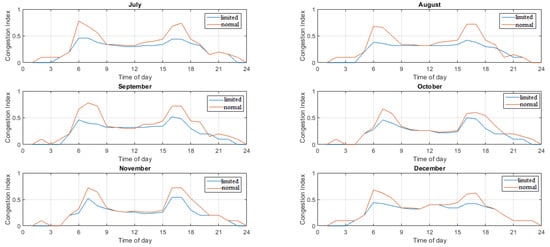
Figure 7.
Congestion Index for period with no restriction (normal) and period with movement restriction (limited) from July to December.
Year 2020 was different in all aspects and experiences in the Republic of South Africa. The general trend of hours with high and low congestion was similar for all the years, with 2020 having lower congestion due to the introduction of movement restrictions. Observations revealed that the restrictions had a great impact with the freeways across the city being empty and with very little traffic congestion in rush hour periods, allowing good flow of movement on the roads. Notably, the major freeways such as the M1 south, the N1 south, western bypass, N3 south, and the eastern bypass which normally have heavy traffic congestion had good flowing traffic throughout the year. Consequently, where traffic congestion took place, the movement on the roads was quicker than normal, resulting in less time wasted on traffic, and traveling across the city was good in the year 2020. Table 3 highlights the trend from 2019 to 2021.
Table 3.
Traffic congestion.
The worst day of the week with the worst traffic congestion was Mondays from 7 a.m. to 8 a.m. Travelling before 7 a.m. on Monday could save someone up to 4 h per year for a 30 min commute. During 2019, 20+ min per 30 min trip was spent on the morning rush hour and 20+ min per 30 min trip was spent during the evening rush. In 2020, 13+ min per 30 min trip was spent on the morning rush hour and 12+ min per 30 min trip was spent during the evening rush. In 2021, 11+ min per 30 min trip was spent on the morning rush hour and 11+ min per 30 min trip was spent during the evening rush. A total of 153 h was lost in traffic congestion in 2019, which is equivalent to 6 days 9 h; 98 h was lost in traffic congestion in 2020, which totals 4 days 2 h. A total of 84 h was lost in traffic congestion in 2021 which is equivalent to 3 days 12 h. The decrease between 2021 and 2019 of hours spent in traffic congestion was 2 days 21 h, while the decrease between 2021 and 2020 of hours spent in traffic congestion was 14 h. The decrease between 2020 and 2019 of hours spent in traffic congestion was 2 days 7 h. Consequently, from Table 3, it can be noted that the morning rush had the highest traffic congestion. Furthermore, the overall traffic congestion for 2021 seemed to be lower than the traffic congestion in 2020. The reason for this was because the first 3 months of the year 2020 had high traffic congestion and the COVID-19 restrictions were not yet enforced, hence the slightly higher overall congestion in 2020. However, the analysis conducted by the authors revealed that the year 2020 had the lowest traffic congestion overall due to the mentioned reason. Using the spatiotemporal region of Johannesburg, the following was used to express variations in low traffic congestion: COVID-19 restrictions and COVID-19 severe restrictions with low traffic congestion. The COVID-19 pandemic’s impact on traffic congestion in the city of Johannesburg is demonstrated further in Table 4 below.
Table 4.
COVID-19 effect on traffic congestion 2020.
Table 4 is a breakdown of the traffic congestion when the COVID-19 pandemic was strongly affecting the city of Johannesburg. It shows the traffic congestion analysis from the time when the pandemic regulatory system was enforced up to the last day of 2020. From the 27th of March 2020 to the first of May 2020, the travelling restrictions were very severe, and the traffic congestion was very low at 2% during the entire month of April. During the period of May, June, July, and August, it can be noted that the restrictions were not as severe, though travelling was still restricted and the percentage of days with low traffic congestion overall was precisely 12%, as indicated by the color green. Further, the grey area indicates that as there were still COVID-19 restrictions, and these days had a slightly higher traffic congestion compared to other days when the restrictions were still active; however, that period experienced precisely 19% of traffic congestion. This was due to the opening of some of the city’s activities to boost the economy. Traffic congestion volume decreased immensely across the city of Johannesburg, and COVID-19 brought about a huge decrease in traffic congestion in many cities globally including the city of Johannesburg. Accordingly, the city had 130 days with very much less congestion in 2020.
3.4. Toward Sustainable Urban Mobility
Sustainable cities require smart policy practices, smart governance, and smart mobility. Placing urban mobility as focus for improving quality of life requires three key phases to be achieved in developing cities. The first phase is identification of points of interest in the city which are hot spots for congestion. This is essential as it navigates us to catchment areas or areas of interest. The analysis of points of interest reveals areas with mixed land uses that have the highest levels of congestion. Harris et al. [] outlined that investment in improving road infrastructure at such hot spots has the potential to also improve overall productivity. The second phase is improving monitoring systems. The literature reveals that investment in location-based services (LBSs) is essential for prediction planning and improving responsiveness to traffic challenges. A lack of coordination and structured information management has significant impacts on the effectiveness of monitoring systems. As such, LBSs avail data-driven assurance and confidence for traffic management. As outlined in the earlier sections, TomTom data captures movement trends with geo-referencing data []. With the growth in big data and Internet of Things, LBSs can provide cities with real-time data that can be used for monitoring and mitigating traffic challenges. The last phase is for cities to tap into machine learning and deep learning. This can bring opportunities of autonomous traffic management either through supervised or unsupervised learning of data obtained through LBSs [,]. Globally digital innovation has proven to be at the heart of transformation and increasing opportunities. It is a driving force for innovative, sustainable growth and facilitating change. However, for many developing cities, there is very little investment in machine learning and deep learning [,]. As such, the shift toward digital transformation should be initiated through raising awareness of the comprehensive capability of machine learning and deep learning.
4. Discussions, Implications, Reflections, and Generalizability of Findings
This work has several implications with regard to new knowledge generation for academic purposes and policy formulation and implementation in the local, provincial, and national spheres. Efficient public transportation systems provide economic and social benefits by improving market accessibility, promoting labor mobility, and connecting communities. However, key factors in the long-term reduction of congestion are dependent on the willingness to adopt new technologies [,]. It must be stressed that urban mobility is essential for the maintenance and well-being of the society and economy. Furthermore, the benefits of reduced congestion levels spread far beyond the transportation sectors since it is essential for economic development and improving the quality of life of people. From the findings, it is clear that limiting movement may yield desired results of reducing overall congestion. However, there is a need to develop plans for the post-COVID-19 period, as the lockdown regulations cannot be sustained indefinitely [,]. It is thus important that more attention be paid to soft and functional factors that can attract commuters to utilize public transportation regularly. This would lead to fewer vehicles being on the roads while also allowing commuters to traverse between their homes, workplaces, and places of interest.
This statistical analysis of traffic congestion provided an insight into traffic congestion between the years 2019 and 2021. It was noted that prior to the COVID-19 pandemic, the level of traffic congestion was very high during rush hours, specifically during the morning and evening rushes on weekdays. The overall traffic congestion of 2019 was 30%, while in 2020 it was 21%; thus, the decrease from 2019 to 2020 was 9%. The overall traffic congestion of 2020 was 21%, with 2021 at 19%, and thus, the decrease from 2020 to 2021 was 2%; furthermore, the decrease from 2019 to 2021 was 11%. The time spent in traffic congestion per day during the morning, afternoon, and the evening rushes had a negative impact on the daily productivity for the economy. During 2020, when the city of Johannesburg was challenged with COVID-19, the volume of the congestion drastically decreased to a very low rate throughout the year. This was due to the strict regulations enforced to control travelling for the management of the COVID-19 pandemic. This clearly indicates that traffic congestion can be controlled by the enforcement of strict regulatory systems for travelling and the use of better technological systems. Globally, there are improvements in reducing traffic congestion []. This is especially true in developed countries, where adaptive traffic signals, real-time traffic monitoring, smart corridors, and pedestrian tracking systems with advanced V2I technologies are deployed, which has drastically reduced congestion []. The developing cities such as Johannesburg can look into initiating such technological systems so as to bring about a positive impact on the challenged roads. As such, this growing interest in the development of resilient cities is bringing the issue of sustainable mobility to the forefront of public discourse. This is because the provision of sound and adequate urban transportation is of paramount importance to achieve such sustainability and economic growth. On a macro level, ecological transportation management facilitates efforts of ecosystem restoration through supporting the area’s physical and social growth. The role of ecosystem restoration is thus critical in managing urban mobility systems.
5. Conclusions
This paper presented the potential of sustainable and resilient transportation management by focusing on two phases, namely, the first phase of identification of points of interest in the city which are hot spots for congestion and the second phase of outlining. This was undertaken through an assessment of congestion levels across three critical periods for the city of Johannesburg. With more and more assessments of urban transportation, transport management authorities can use these trends to guide future policy incentives to enhance the operational performance of mobility systems. In 2020, the reduced congestion levels during the national lockdown revealed that if mobility in the city is restricted, this leads to better air quality. However, introducing a lockdown is not an advisable option to reduce vehicular emissions as this negatively impacts economic activities. The results demonstrated that mining and analyzing traffic data have a significant role for future mobility planning in both the developed and developing worlds, and more generally, for improving the quality of commuting trips in the city.
The results showed a continuous decrease from 2020 to 2021 in traffic congestion in the city due to the COVID-19 pandemic. Traffic congestion is a global challenge and is not easy to be prevented or controlled. Transportation authorities with various stakeholders in the city of Johannesburg work toward implementing strategies to reduce congestion so as to improve the flow of movement on the roads. However, the effort is still challenging as high traffic congestion volumes are still evident because Johannesburg is the city with the third highest traffic congestion on the African continent and second in the Republic of South Africa after the city of Cape Town. This calls for urgent solutions; otherwise, when the country transitions to a developed state, there may be no movement on the roads during rush hours. Lastly, the paper calls for investment in autonomous traffic management in developing cities. This may lead to less hours lost in congestion. Machine learning and deep learning have the potential for ensuring autonomous decision making, which can lead to better regulatory systems on the roads.
Author Contributions
Conceptualization, T.M. and S.M.; methodology, T.M.; software, O.-O.A.; validation, T.G., O.-O.A. and I.M.; formal analysis, T.M. and S.M.; investigation, O.-O.A.; resources, T.G. and I.M.; data curation, O.-O.A.; writing—original draft preparation, T.M., S.M. and O.-O.A.; writing—review and editing, T.G. and I.M.; visualization, T.M. and S.M.; supervision, T.G. and I.M.; project administration, O.-O.A.; funding acquisition, T.G. and I.M. All authors have read and agreed to the published version of the manuscript.
Funding
This research was funded by Centre of Applied Research and Innovation in the Built Environment (CARINBE).
Institutional Review Board Statement
Not applicable.
Informed Consent Statement
Not applicable.
Data Availability Statement
All the supporting data are available in the manuscript.
Acknowledgments
The authors acknowledge the co-operation and data availed by the Johannesburg Metropolitan City Municipality.
Conflicts of Interest
The authors declare no conflict of interest.
References
- Kahachi, H.A.H. Analyzing Public Transportation Plans to Addressing Traffic Congestions in Developing Countries. Iraqi J. Archit. Plan. 2019, 18, 44–57. [Google Scholar] [CrossRef]
- Venkatesham, S.; Kumar, S. Analysis of the Measurable Results of Novel Structure Construction for Road Traffic. In Proceedings of the 2021 7th International Conference on Advanced Computing and Communication Systems (ICACCS), Coimbatore, India, 19–20 March 2021; pp. 1490–1494. [Google Scholar] [CrossRef]
- Sun, L.; Song, R. Improving Efficiency in Congested Traffic Networks: Pareto-Improving Reservations through Agent-Based Timetabling. Sustainability 2022, 14, 2211. [Google Scholar] [CrossRef]
- Jain, V.; Sharma, A.; Subramanian, L. Road traffic congestion in the developing world. In Proceedings of the 2nd ACM Symposium on Computing for Development, Atlanta, GA, USA, 11–12 March 2012; pp. 1–10. [Google Scholar]
- Chen, L.; Zheng, L.; Yang, J.; Xia, D.; Liu, W. Short-term traffic flow prediction: From the perspective of traffic flow decomposition. Neurocomputing 2020, 413, 444–456. [Google Scholar] [CrossRef]
- Khan, N.U.; Shah, M.A.; Maple, C.; Ahmed, E.; Asghar, N. Traffic Flow Prediction: An Intelligent Scheme for Forecasting Traffic Flow Using Air Pollution Data in Smart Cities with Bagging Ensemble. Sustainability 2022, 14, 4164. [Google Scholar] [CrossRef]
- Deng, S.; Jia, S.; Chen, J. Exploring spatial–temporal relations via deep convolutional neural networks for traffic flow prediction with incomplete data. Appl. Soft Comput. 2019, 78, 712–721. [Google Scholar] [CrossRef]
- Harris, N.; Shealy, T.; Klotz, L. Choice architecture as a way to encourage a whole systems design perspective for more sustainable infrastructure. Sustainability 2016, 9, 54. [Google Scholar] [CrossRef] [Green Version]
- Kiunsi, R.B. A Review of Traffic Congestion in Dar es Salaam City from the Physical Planning Perspective. J. Sustain. Dev. 2013, 6, 94–103. [Google Scholar] [CrossRef]
- Olayode, I.O.; Tartibu, L.K.; Okwu, M.O.; Uchechi, U.F. Intelligent transportation systems, un-signalized road intersections and traffic congestion in Johannesburg: A systematic review. Procedia CIRP 2020, 91, 844–850. [Google Scholar] [CrossRef]
- Afrin, T.; Yodo, N. A survey of road traffic congestion measures towards a sustainable and resilient transportation system. Sustainability 2020, 12, 4660. [Google Scholar] [CrossRef]
- Kumarage, A.S. Urban traffic congestion: The problem and solutions. Asian Econ. Rev. 2004, 2, 10–19. [Google Scholar]
- Gubins, S.; Verhoef, E.T. Dynamic bottleneck congestion and residential land use in the monocentric city. J. Urban Econ. 2014, 80, 51–61. [Google Scholar] [CrossRef]
- Ogunbodede, E.F. Assessment of traffic congestions in Akure (Nigeria) using GIS approach: Lessons and challenges for urban sustenance. In Proceedings of the Conference on Whole Life Urban Sustainability, Glasgow, Scotland, 27–29 June 2007; pp. 1–25. [Google Scholar]
- Wang, C. The Relationship between Traffic Congestion and Road Accidents: An Econometric Approach Using GIS. Ph.D. Thesis, Loughborough University, Loughborough, UK, 2010. [Google Scholar]
- Petrovska, N.; Stevanovic, A. Traffic congestion analysis visualisation tool. In Proceedings of the IEEE 18th International Conference on Intelligent Transportation Systems, Gran Canaria, Spain, 15–18 September 2015; pp. 1489–1494. [Google Scholar]
- Jain, N.K.; Saini, R.K.; Mittal, P. A review on traffic monitoring system techniques. In Soft Computing: Theories and Applications; Springer: Cham, Switzerland, 2019; pp. 569–577. [Google Scholar]
- Gerlough, D.L.; Huber, M.J. Traffic Flow Theory; National Research Council: Washington, DC, USA, 1976. [Google Scholar]
- Christidis, P.; Rivas, J.N.I. Measuring Road Congestion; Institute for Prospective Technological Studies (IPTS), European Commission Joint Research Centre: Brussels, Belgium, 2012; Available online: http://ipts.jrc.ec.europa.eu/publications/pub.cfm (accessed on 12 March 2022).
- Yue, J.S.; Mandayam, C.V.; Merugu, D.; Abadi, H.K.; Prabhakar, B. Reducing Road Congestion through Incentives: A Case Study. In Proceedings of the Transportation Research Board 94th Annual Meeting, Washington, DC, USA, 11–15 January 2015. [Google Scholar]
- Yin, Y.; Ieda, H. Assessing performance reliability of road networks under nonrecurrent congestion. Transp. Res. Rec. 2001, 1771, 148–155. [Google Scholar] [CrossRef]
- Zhang, T.; Sun, L.; Yao, L.; Rong, J. Impact analysis of land use on traffic congestion using real-time traffic and POI. J. Adv. Transp. 2017, 2017, 7164790. [Google Scholar] [CrossRef] [Green Version]
- Renne, J.L. From transit-adjacent to transit-oriented development. Local Environ. 2009, 14, 1–15. [Google Scholar] [CrossRef]
- Harrison, P.; Rubin, M.; Appelbaum, A.; Dittgen, R. Corridors of freedom: Analyzing Johannesburg’s ambitious inclusionary transit-oriented development. J. Plan. Educ. Res. 2019, 39, 456–468. [Google Scholar] [CrossRef]
- Ndebele, R.; Aigbavboa, C.; Ogra, A. Urban transport infrastructure development in African Cities: Challenges and opportunities. In Proceedings of the International Conference on Industrial Engineering and Operations Management, Johannesburg, South Africa, 29 October–1 November 2018; p. 833. [Google Scholar]
- Pieterse, E.; Owens, K. Johannesburg: Confronting Spatial Inequality; World Resources Institute: Washington, DC, USA, 2018. [Google Scholar]
- Afrin, T.; Yodo, N. A probabilistic estimation of traffic congestion using Bayesian network. Meas. J. Int. Meas. Confed. 2021, 174, 109051. [Google Scholar] [CrossRef]
- Rahman, M.M.; Paul, K.C.; Hossain, M.A.; Ali, G.G.; Nawaz, M.; Rahman, M.S.; Thill, J. Machine Learning on the COVID-19 Pandemic, Human Mobility and Air Quality: A Review. IEEE Access 2021, 9, 72420–72450. [Google Scholar] [CrossRef]
- Wijnands, J.S.; Zhao, H.; Nice, K.A.; Thompson, J.; Scully, K.; Guo, J.; Stevenson, M. Identifying safe intersection design through unsupervised feature extraction from satellite imagery. Comput. Aided Civ. Infrastruct. Eng. 2021, 36, 346–361. [Google Scholar] [CrossRef]
- Mesgarpour, M.; Abad, J.M.N.; Alizadeh, R.; Wongwises, S.; Doranehgard, M.H.; Jowkar, S.; Karimi, N. Predicting the effects of environmental parameters on the spatio-temporal distribution of the droplets carrying coronavirus in public transport—A machine learning approach. Chem. Eng. J. 2022, 430, 132761. [Google Scholar] [CrossRef]
- Benning, O.; Calles, J.; Kantarci, B.; Khan, S. Transit Networks, Social Contacts, and Open Data Meet Public Transportation Plans for Post-COVID-19: A Canadian Case Study. IEEE Eng. Manag. Rev. 2021, 49, 30–41. [Google Scholar] [CrossRef]
- Nie, Q.; Qian, X.; Guo, S.; Jones, S.; Doustmohammadi, M.; Anderson, M.D. Impact of COVID-19 on paratransit operators and riders: A case study of central Alabama. Transp. Res. Part A Policy Pract. 2022, 161, 48–67. [Google Scholar] [CrossRef]
- Attard, M. Active travel and sustainable transport. Commun. Transp. Res. 2022, 2, 100059. [Google Scholar] [CrossRef]
- Yan, R.; Wang, S.; Zhen, L.; Laporte, G. Emerging approaches applied to maritime transport research: Past and future. Commun. Transp. Res. 2021, 1, 100011. [Google Scholar] [CrossRef]
- Kakderi, C.; Oikonomaki, E.; Papadaki, I. Smart and Resilient Urban Futures for Sustainability in the Post COVID-19 Era: A Review of Policy Responses on Urban Mobility. Sustainability 2021, 13, 6486. [Google Scholar] [CrossRef]
- Arai, I.; El-Tawab, S.; Salman, A.; Elnoshokaty, A. The Effect of COVID-19 on the Transit System in Two Regions: Japan and USA. In Proceedings of the 2021 IEEE Global Conference on Artificial Intelligence and Internet of Things (GCAIoT), Dubai, United Arab Emirates, 12–16 December 2021; pp. 51–56. [Google Scholar]
- Moyo, T.; Musakwa, W. Using crowdsourced data (Twitter & Facebook) to delineate the origin and destination of commuters of the Gautrain public transit system in South Africa. ISPRS Ann. Photogramm. 2016, 3, 143–150. [Google Scholar]
- Nouvellet, P.; Bhatia, S.; Cori, A.; Ainslie, K.E.; Baguelin, M.; Bhatt, S.; Boonyasiri, A.; Brazeau, N.F.; Cattarino, L.; Cooper, L.V. Reduction in mobility and COVID-19 transmission. Nat. Commun. 2021, 12, 1090. [Google Scholar] [CrossRef]
- Nižetić, S. Impact of coronavirus (COVID-19) pandemic on air transport mobility, energy, and environment: A case study. Int. J. Energy Res. 2020, 44, 10953–10961. [Google Scholar] [CrossRef]
- Tomtom. Traffic-Index; Tomtom: Amsterdam, The Netherlands, 2022. [Google Scholar]
- Kibangou, A.Y.; Moyo, T.; Musakwa, W. Dynamic Linear Model for Urban Essential Traffic Congestion and Emissions. IFAC PapersOnLine 2021, 54, 151–156. [Google Scholar] [CrossRef]
- Wan, C.; Yang, Z.; Zhang, D.; Yan, X.; Fan, S. Resilience in transportation systems: A systematic review and future directions. Transp. Rev. 2018, 38, 479–498. [Google Scholar] [CrossRef]
- TomTom/EC Team on Data for Road Safety. 2020. Available online: just-auto.com (accessed on 20 November 2021).
- Wang, C.; Li, X.; Chen, P.; Xie, Y.; Liu, W. Spatial pattern and developing mechanism of railway geo-systems based on track gauge: A case study of Eurasia. J. Geogr. Sci. 2020, 30, 1283–1306. [Google Scholar] [CrossRef]
- Harrou, F.; Zeroual, A.; Sun, Y. Traffic congestion monitoring using an improved kNN strategy. Meas. J. Int. Meas. Confed. 2020, 156, 107534. [Google Scholar] [CrossRef]
- Neu, D.A.; Lahann, J.; Fettke, P. A systematic literature review on state-of-the-art deep learning methods for process prediction. Artif. Intell. Rev. 2021, 55, 801–827. [Google Scholar] [CrossRef]
- Jiang, F.; Ma, X.; Zhang, Y.; Wang, L.; Cao, W.; Li, J.; Tong, J. A new form of deep learning in smart logistics with IoT environment. J. Supercomput. 2022, 78, 11873–11894. [Google Scholar] [CrossRef]
- Akhtar, M.; Moridpour, S. A review of traffic congestion prediction using artificial intelligence. J. Adv. Transp. 2021, 2021, 8878011. [Google Scholar] [CrossRef]
- Jiang, H.; Li, Q.; Jiang, Y.; Shen, G.; Sinnott, R.; Tian, C.; Xu, M. When machine learning meets congestion control: A survey and comparison. Comput. Netw. 2021, 192, 108033. [Google Scholar] [CrossRef]
- Currie, G.; Jain, T.; Aston, L. Evidence of a post-COVID change in travel behaviour–Self-reported expectations of commuting in Melbourne. Transp. Res. Part A Policy Pract. 2021, 153, 218–234. [Google Scholar] [CrossRef]
- Xu, P.; Li, W.; Hu, X.; Wu, H.; Li, J. Spatiotemporal analysis of urban road congestion during and post COVID-19 pandemic in Shanghai, China. Transp. Res. Interdiscip. Perspect. 2022, 13, 100555. [Google Scholar] [CrossRef]
- Farda, M.; Balijepalli, C. Exploring the effectiveness of demand management policy in reducing traffic congestion and environmental pollution: Car-free day and odd-even plate measures for Bandung city in Indonesia. Case Stud. Transp. Policy 2018, 6, 577–590. [Google Scholar] [CrossRef]
- Aleksander, R.; Paweł, C. Recent advances in traffic optimisation: Systematic literature review of modern models, methods and algorithms. IET Intell. Transp. Syst. 2020, 14, 1740–1758. [Google Scholar] [CrossRef]
Publisher’s Note: MDPI stays neutral with regard to jurisdictional claims in published maps and institutional affiliations. |
© 2022 by the authors. Licensee MDPI, Basel, Switzerland. This article is an open access article distributed under the terms and conditions of the Creative Commons Attribution (CC BY) license (https://creativecommons.org/licenses/by/4.0/).