Article

Change in Alpine Grassland NPP in Response to Climate Variation and Human Activities in the Yellow River Source Zone from 2000 to 2020

College of Agriculture and Animal Husbandry, Qinghai University, Xining 810016, China
*
Author to whom correspondence should be addressed.
Sustainability 2022, 14(14), 8790; https://doi.org/10.3390/su14148790
Submission received: 7 June 2022 / Revised: 11 July 2022 / Accepted: 15 July 2022 / Published: 18 July 2022
(This article belongs to the Section Resources and Sustainable Utilization)

Abstract

:
Identifying the relative contributions of climate change and human activities to alpine grassland dynamics is critical for understanding grassland degradation mechanisms. In this study, first, the actual NPP (NPPa) was obtained by MOD17A3. Second, we used the Zhou Guangsheng model to simulate the potential met net primary productivity (NPPp). Finally, the NPP generated by anthropogenic activities (NPPh) was estimated by calculating the difference between NPPp and NPPa. Then, the relative contributions of climate change and human activities to NPP changes in grasslands were quantitatively assessed by analyzing trends in NPPp and NPPa. Thereby, the drivers of NPP change in the Yellow River source grassland were identified. The results showed that the temperature and precipitation in the study area showed a warm-humid climate trend from 2000 to 2020. The NPPp and NPPa increased at a rate of 1.07 g C/m2 and 1.51 g C/m2 per year, respectively, while the NPPh decreased at a rate of 0.46 g C/m2 per year. It can be seen that human activities had a positive effect on the change of NPP in the Yellow River source grassland from the change rate. The relative contribution analysis showed that 55.90% of grassland NPP increased due to climate change, 40.16% of grassland NPP increased due to human activities, and the grassland degradation was not significant. The research results can provide a theoretical basis and technical support for the next step of the Yellow River source grassland ecological protection project.

1. Introduction

Alpine grassland is the most important ecosystem in the Yellow River source zone, accounting for about 80% of the region. As a unique grassland ecosystem in Northwest China, alpine grassland is the most abundant and complete biological gene bank and the largest plateau germplasm bank in the Qinghai-Tibet Plateau and is also an important animal husbandry production base and ecological security barrier in China [1,2,3]. However, because of the high altitude and the complex area of cold terrain, the study area is densely covered with rivers, lakes, marshes, and snow-capped mountains, highly sensitive to environmental changes [4], and is one of the extremely fragile ecological environments in China. In recent decades, the vegetation coverage, water conservation function, runoff, and soil freezing of the Yellow River source have all changed significantly, which directly reduced the stability of the grassland ecosystem. The destruction of the grassland ecosystem will further cause environmental degradation problems, including soil erosion, land desertification, grassland degradation, glaciers melting, rat infestations, etc. The unique sensitive environmental characteristics of the Yellow River source are difficult to restore once they degrade, threatening the water resources and ecology of the middle and lower reaches of the Yellow River, as well as security and regional sustainability [5,6]. Therefore, the condition of alpine grassland in the Yellow River source reflects the ecological health of the area. The study of the temporal and spatial variation characteristics of grassland under the influences of multiple factors such as climate change and human activities in the Yellow River source is helpful for protecting the ecological health of the area. The mechanism of grassland productivity change is more complicated due to the mutual interference and interaction between climate change and human activities. Therefore, quantitative evaluation of the impact of climate change and human activities on grassland productivity change has gradually become a hot spot in the study of grassland productivity change.
Climate is the main factor that affects the temporal and spatial distribution of grasslands [7]. The reason is that the growth environment and growth of grasslands are determined by precipitation and air temperature, and the changes in precipitation and air temperature play a vital role in the change in plant productivity of grasslands all over the world [8]. However, with the increase in population, the influence of human activities such as overgrazing, on grassland becomes more and more obvious [9,10,11,12]. So far, there have been a lot of studies on grassland NPP as an indicator to measure the impact of climate change and human activities on grassland ecosystems. The methods used are mainly divided into two categories: residual trend method and model-based anthropogenic NPP allocation method. The residual trend method was used to estimate the contribution of each factor to the NPP change for each pixel by constructing a function of grassland NPP change with different climatic factors and human activities [13]. Whereas the model-based anthropogenic NPP allocation method used climate-driven models to simulate grassland NPPp, and used remote sensing models to simulate the NPPa, with an artificially generated NPP defined as the difference between the NPPp and NPPa [14]. However, the residual trend method to quantitatively evaluate the impact of climate change and human activities on grassland productivity is affected by data sources, noise and accuracy, but it still has obvious shortcomings [15]. For example, Luo et al. used the residual trend method to analyze the correlation between net primary productivity and climate change and human activities in Qinghai-Tibet Plateau from 2001 to 2015 [13]; Wei et al. simulated climate and NPPa with the Zhou Guangsheng model and CAS A model, respectively, and discussed grassland dynamics and its driving factors in Qinghai Province from 2001 to 2016 [14]. Based on the water use efficiency of vegetation determined by the ratio of carbon dioxide flux equation (equivalent to NPP) to water vapor flux equation (equivalent to evapotranspiration) on the vegetation surface, Zhou Guangsheng and Zhang Xinshi deduced a regional evapotranspiration model linking energy balance equations and water balance equations according to two well-recognized water balance equations and heat balance equations. Meanwhile, the net primary productivity model of natural vegetation is based on plant physiological and ecological characteristics and obtained a model suitable for calculating potential net primary productivity according to the precipitation in China and the net radiation data obtained, which can better reflect the vegetation characteristics in China [16,17,18].
Therefore, based on the research of Feng and Zhao [19,20], this paper takes the alpine grassland at the Yellow River source as the research object, and used the Zhou Guangsheng model and MOD17A3 to simulate the NPPp and NPPa of the alpine grassland from 2000 to 2020. Moreover, we estimated the NPP generated by human activities through the difference between the NPPp and NPPa and compared the trend of the NPPp and NPPa changes with time. Finally, we clarified the contribution of climate change and human activities to the change of NPP in the alpine grassland. The research results provide a theoretical basis for the sustainable utilization of alpine grassland resources and the rational layout of animal husbandry at the source of the Yellow River.

2. Materials and Methods
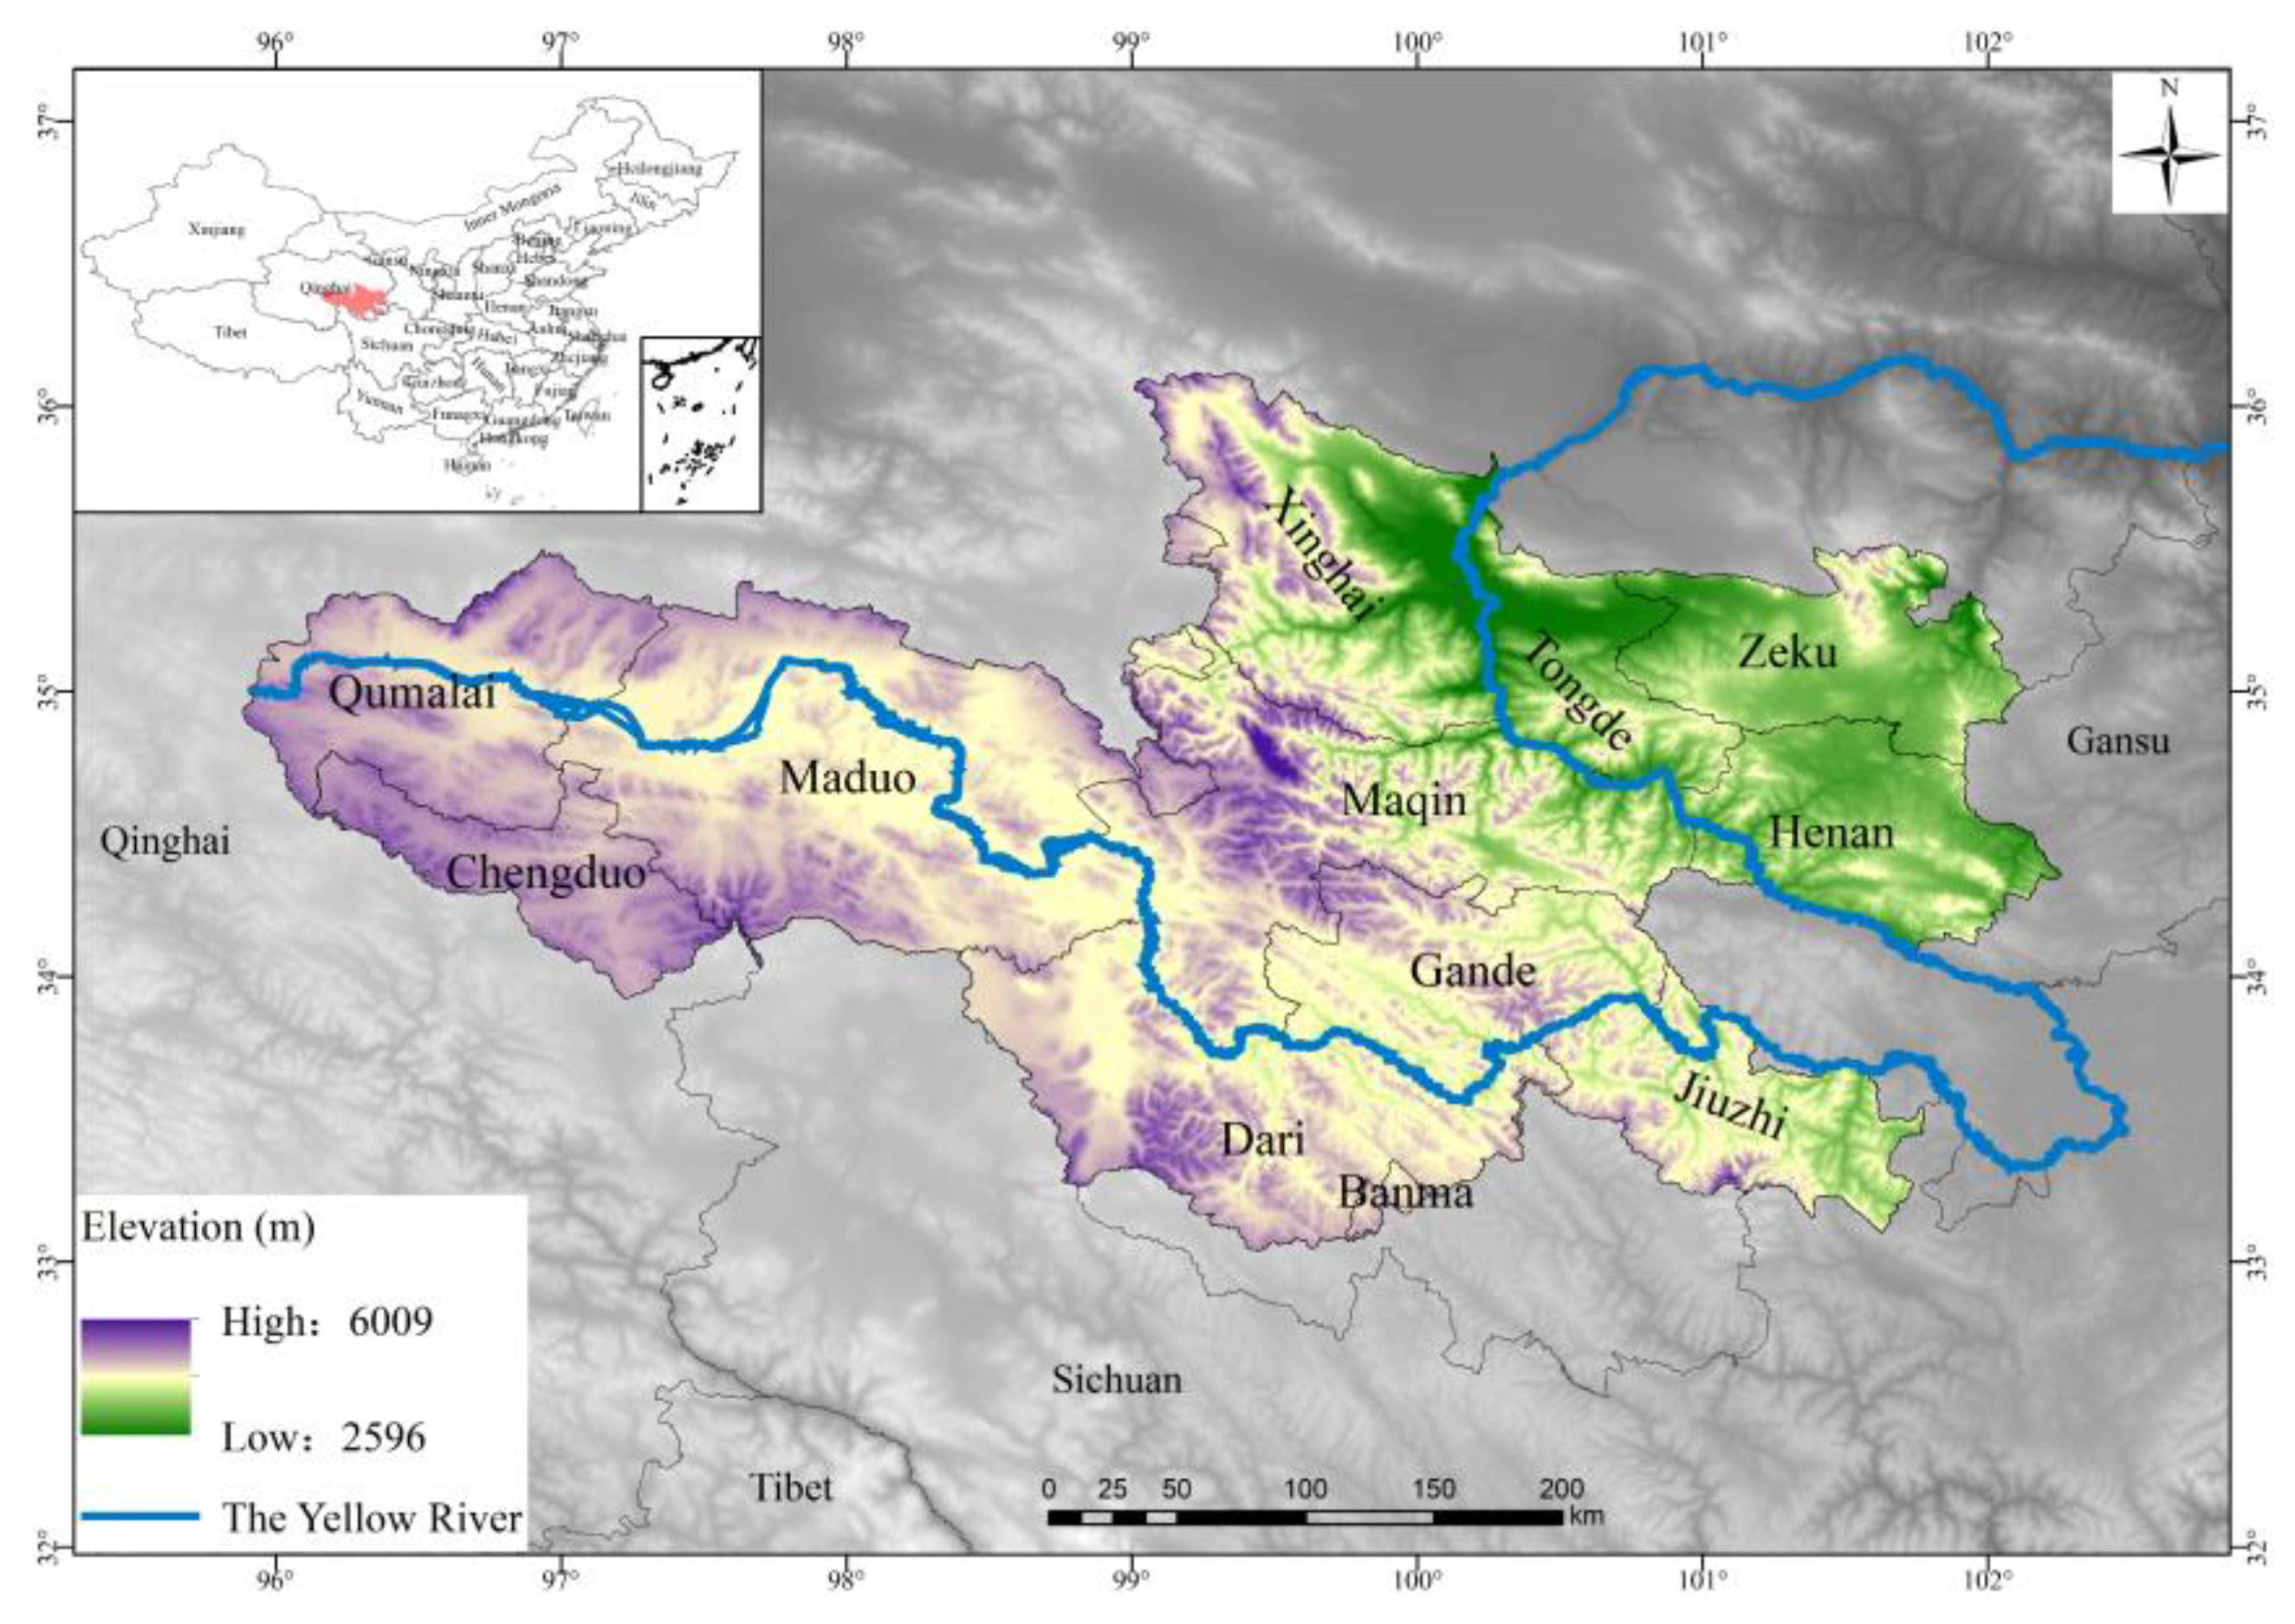
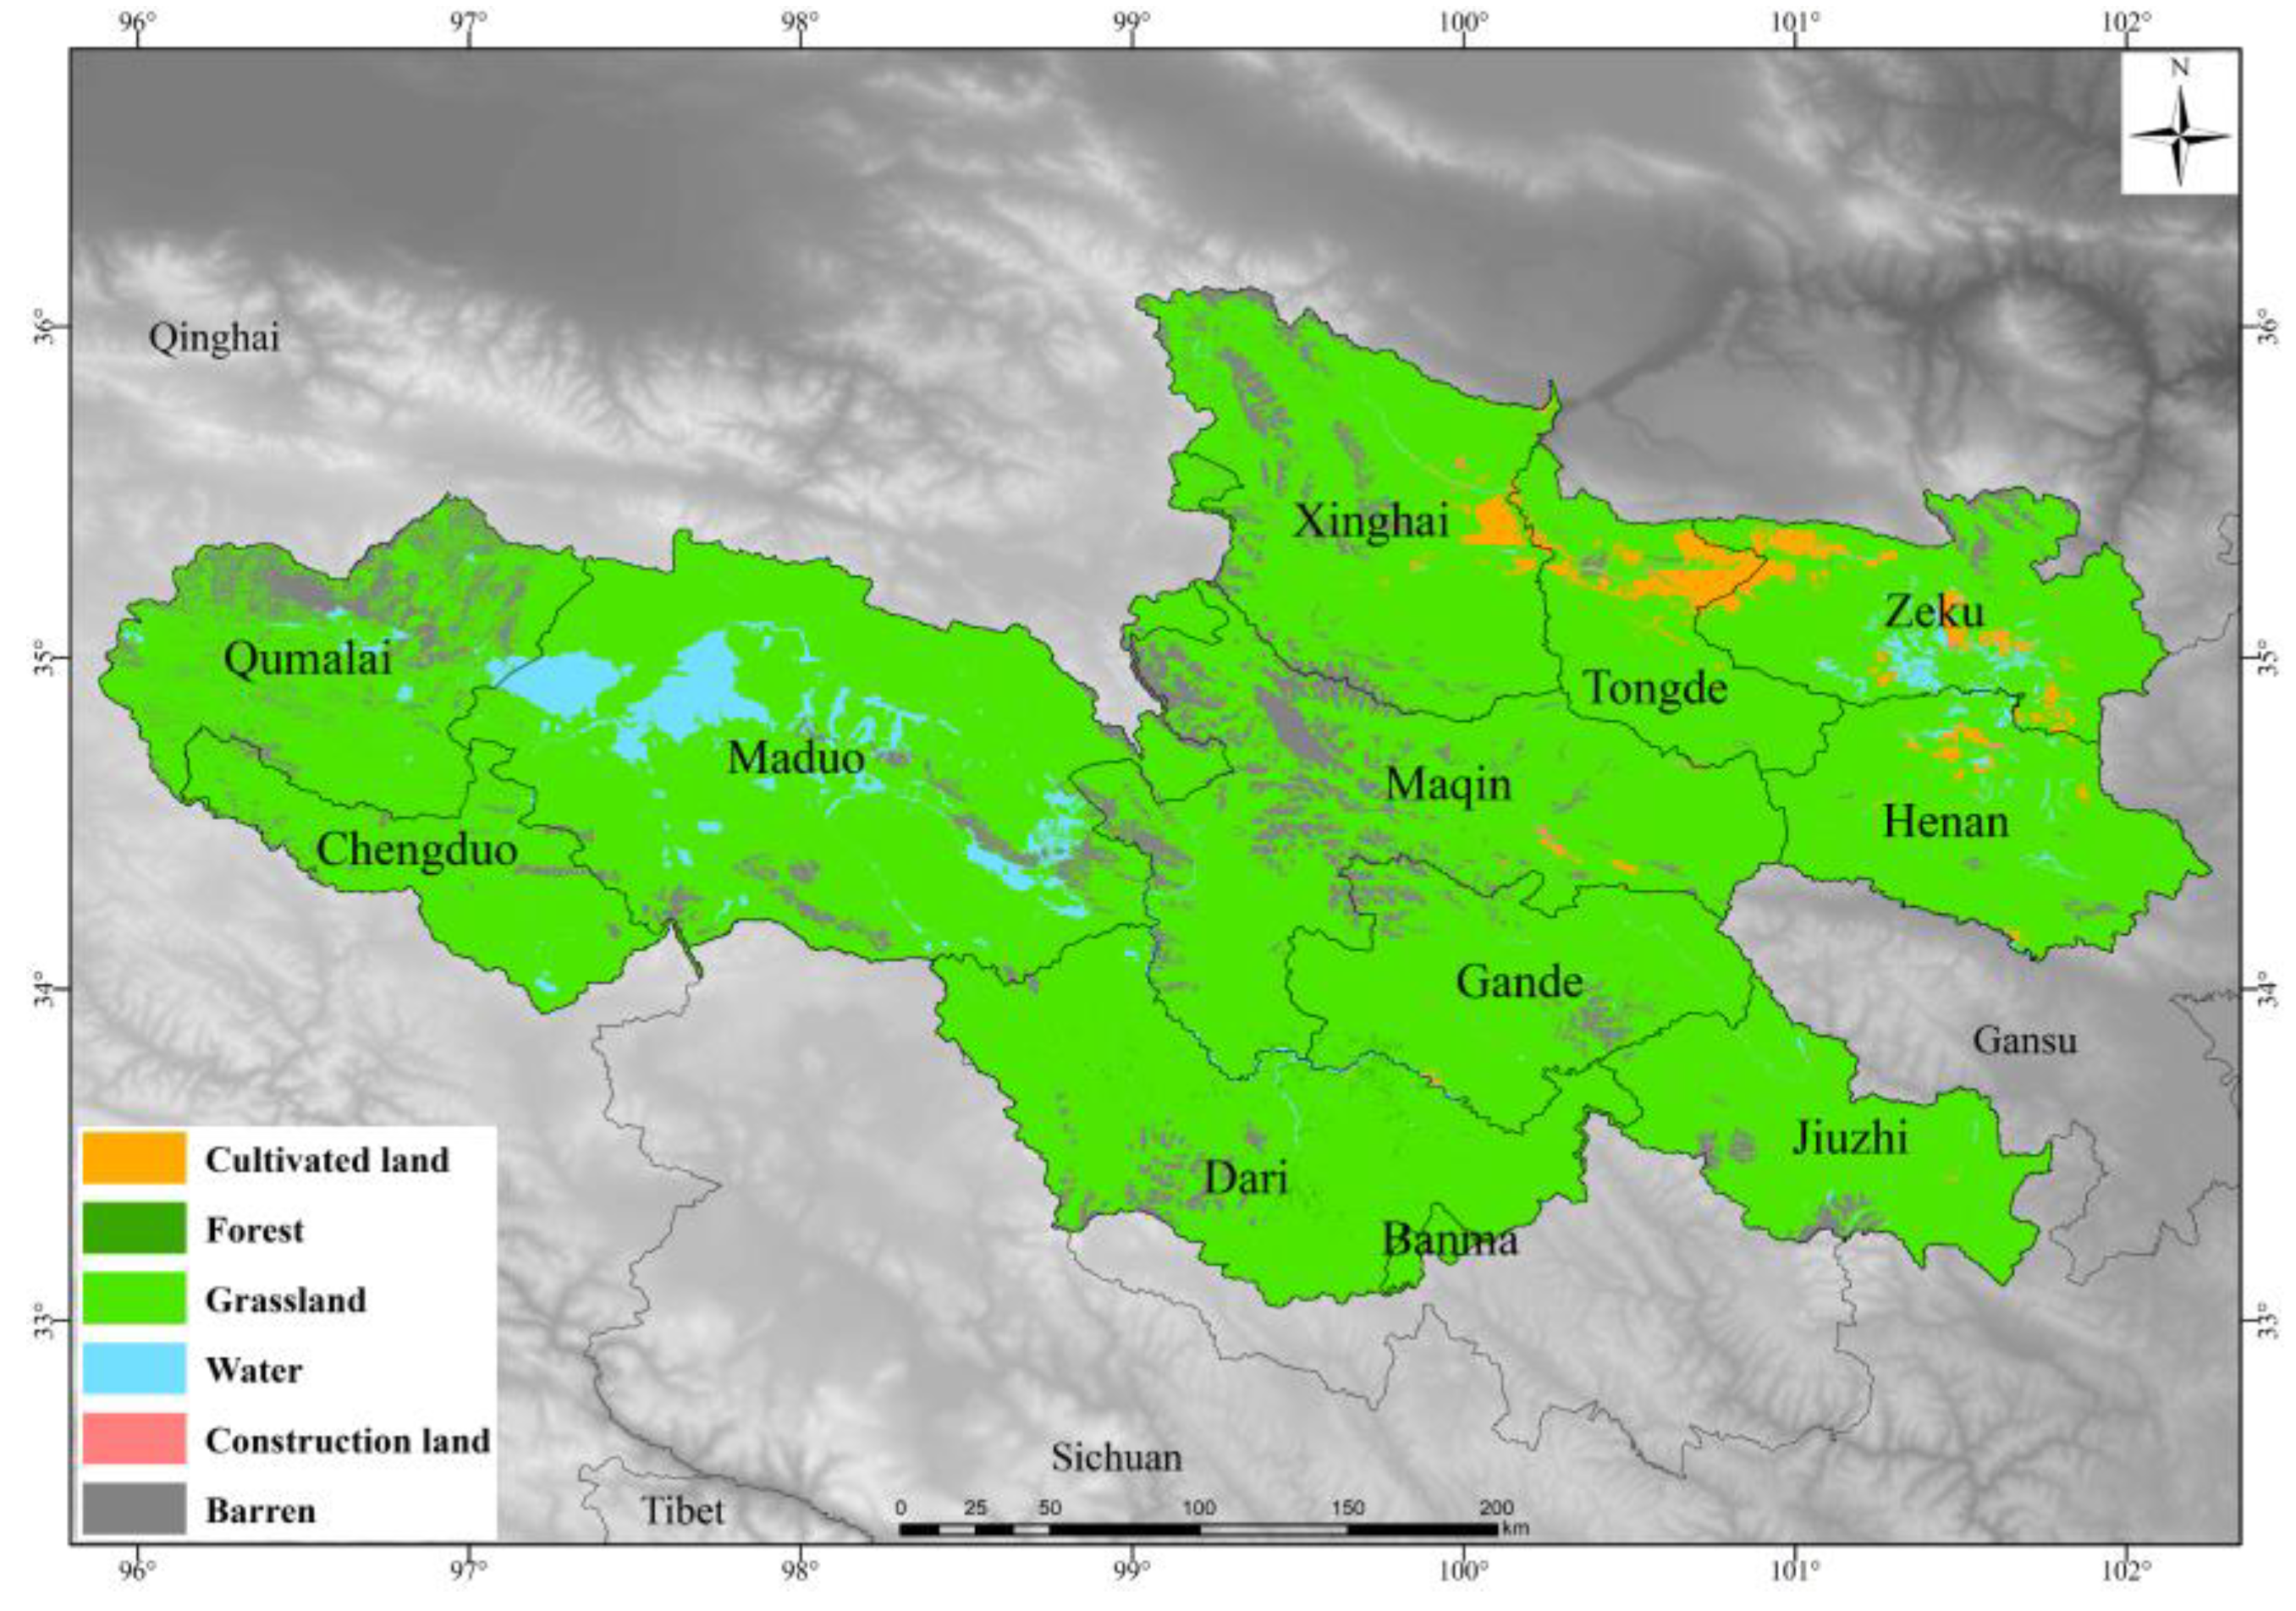
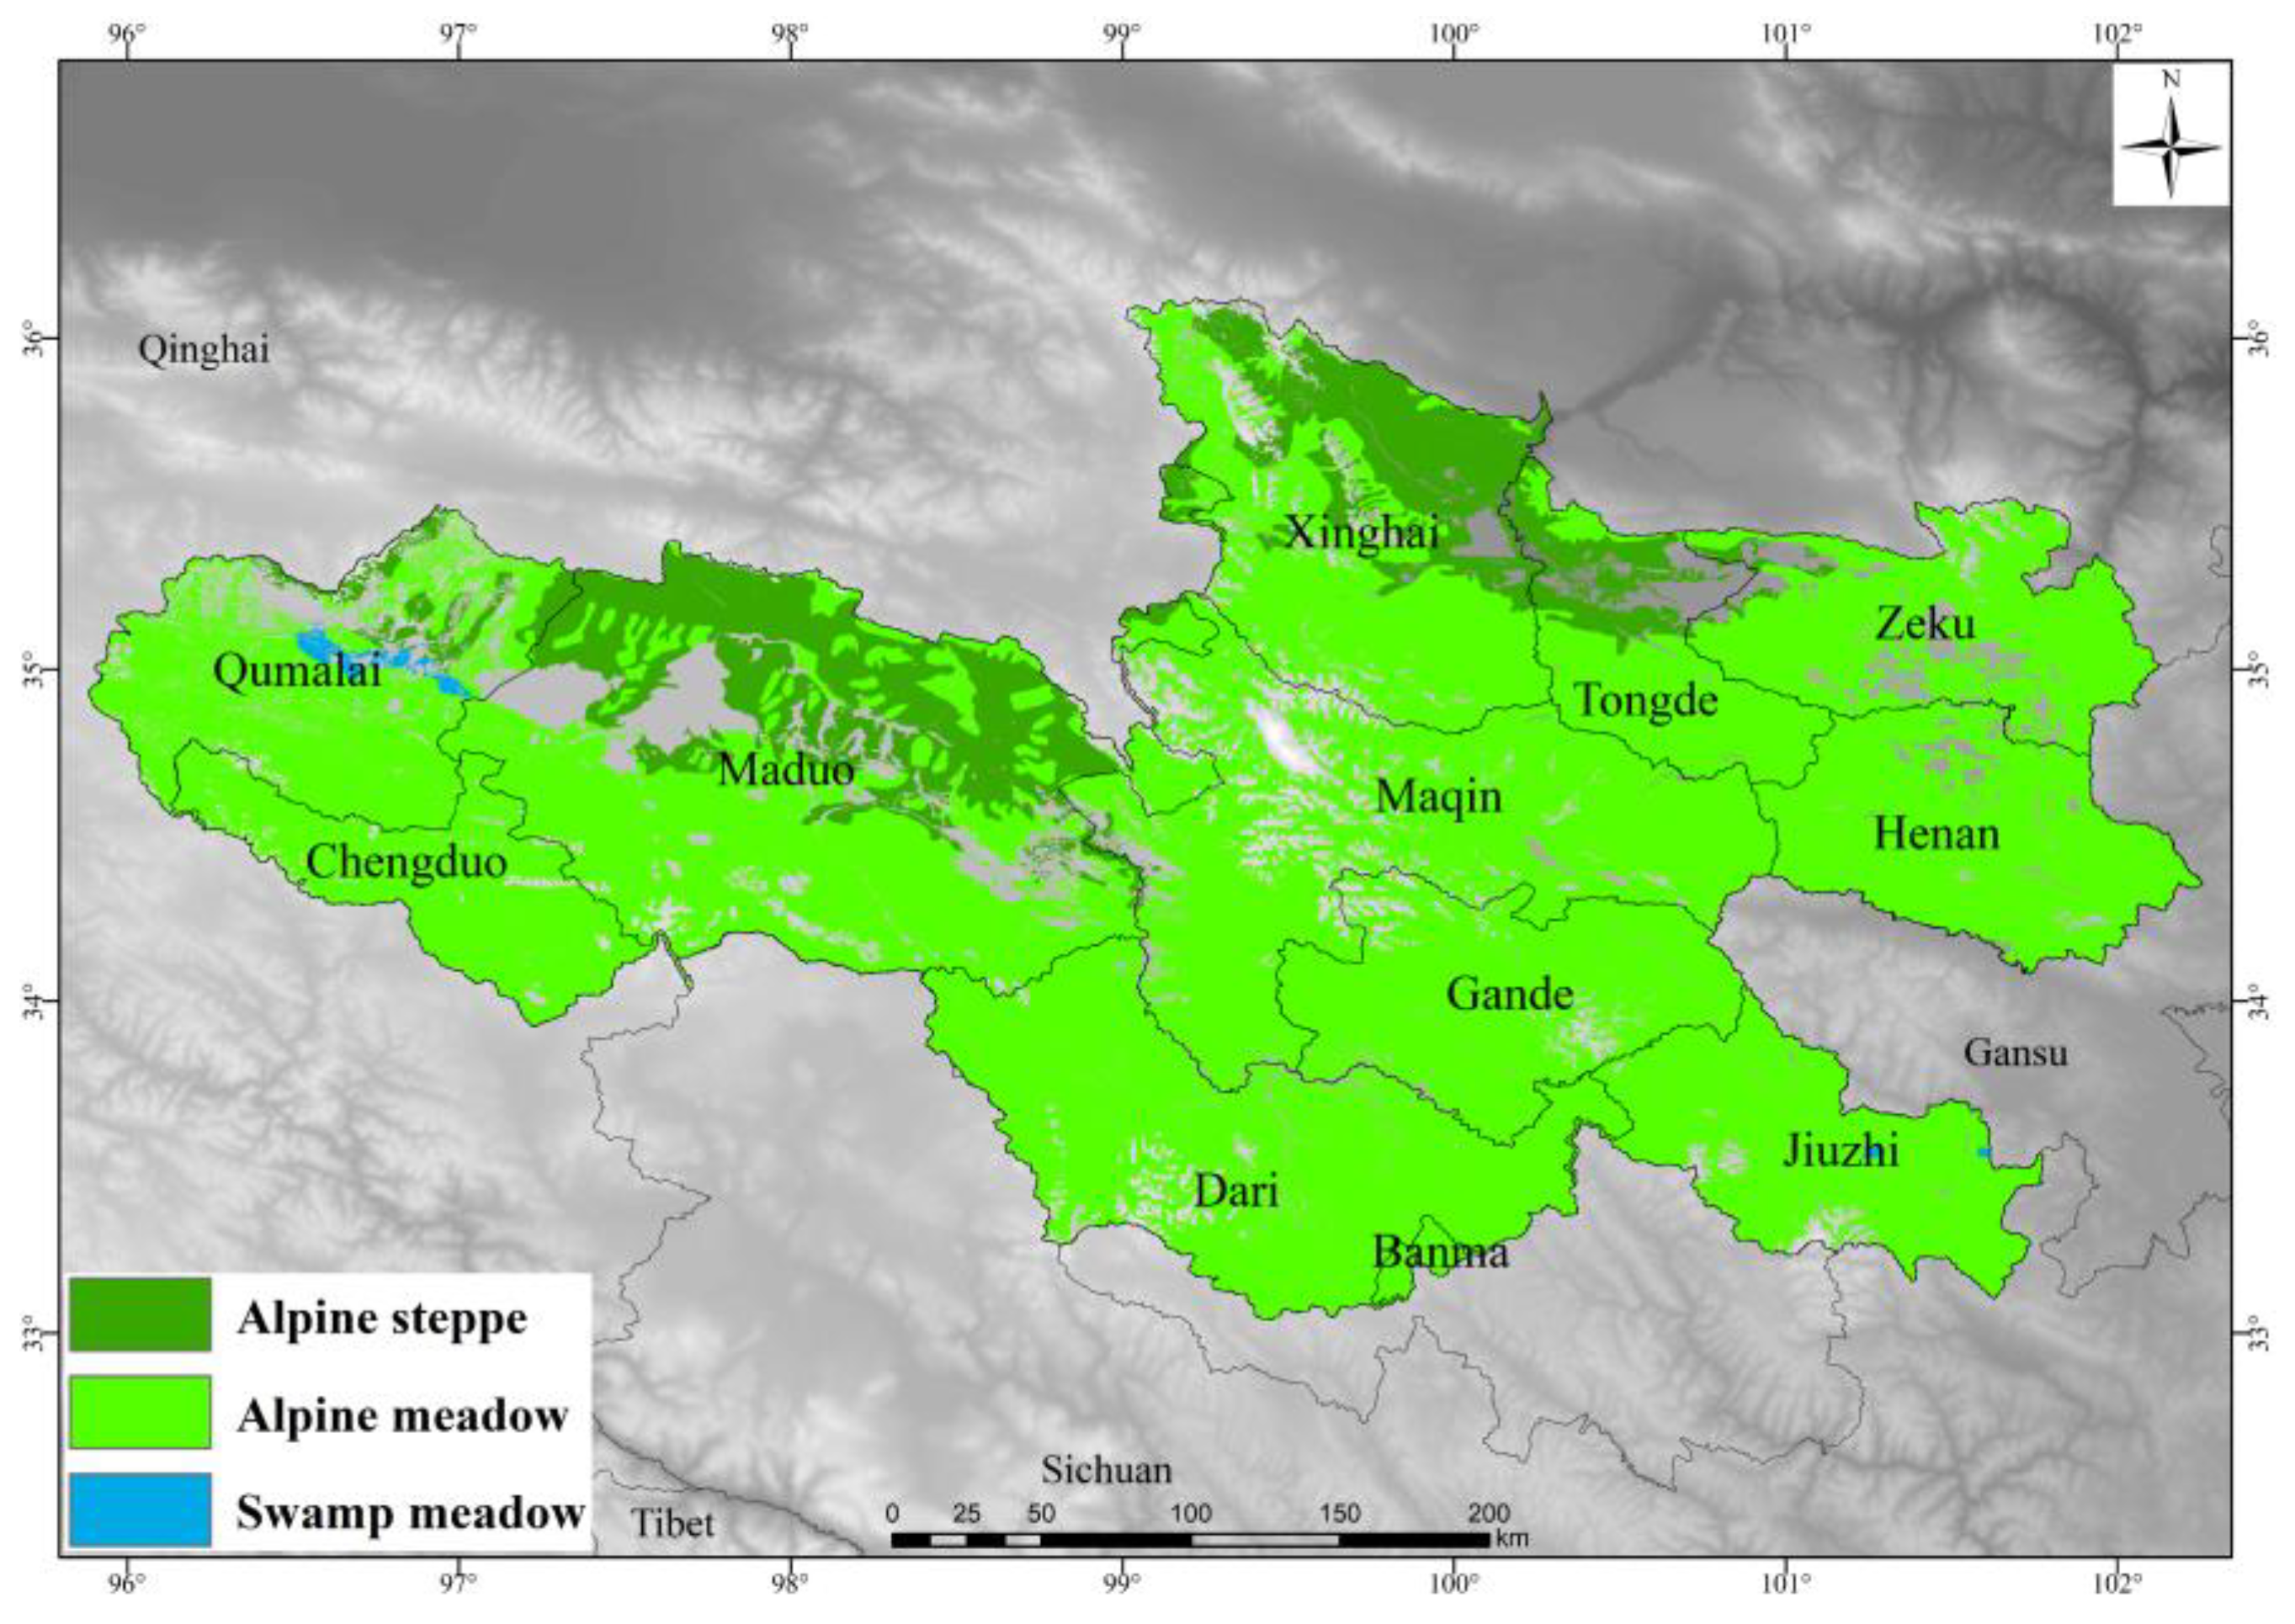
2.1. Study Area

The Yellow River source zone is located in the southeast of Qinghai Province, between 33°0′ N–36°2′ N, 96°2′ E–102°2′ E (Figure 1). The length of the source part of the Yellow River is 1273 km, accounting for approximately 23.28% of the total length of the Yellow River [21]. The Yellow River source zone belongs to Monsoon-Influenced Sub-Arctic Climate and Tundra Climate in the Köppen climate classification. The study area has more rainfalls from July to September each year under the influence of the southwest monsoon, and from October to December, it is gradually dry and cold under the influence of the cold wave high on the Qinghai-Tibet Plateau [22]. The topography of the study area is undulating, and it is generally high in the west and low in the east. The altitude is between 2630–6009 m, and the average altitude is above 4000 m. According to the GlobeLand30 dataset, the main land use type in the study area in 2020 was grassland (Figure 2), accounting for 89.75% of the study area. The grassland types mainly include alpine meadow, alpine grassland, and swamp meadow (Figure 3).

2.2. Data and Processing

The remote sensing image data used in this study were GlobeLand30 and MOD17A3HGF.006. The GlobeLand30 dataset was derived from the 30 m global land cover data released by the Ministry of Natural Resources of China (http://www.globallandcover.com (accessed on 18 January 2022)). The remote sensing images were mainly multispectral images, including Landsat TM, ETM+, OLI, and China Environmental Disaster Mitigation Satellite (HJ-1) images with a spatial resolution of 30 m, andGaofen-1 (GF-1) image with 16 m spatial resolution. The data format was GeoTiff [23,24]. The classification system of the GlobeLand30 dataset includes 10 land types: cultivated land, woodland, grassland, shrub land, wetland, water body, tundra, artificial surface, bare land, glaciers, and permanent snow cover. The land types in the study area were reclassified into six categories: cultivated land, forest land, grassland, water body, artificial surface, and unused land, and then the grassland was spatially analyzed. MOD17A3HGF.006 is a MODIS image with a spatial resolution of 500 m. The NPP is obtained by calculating the net photosynthesis (PSN) every eight days. Net photosynthesis is the difference between the total primary productivity and the maintenance respiration. This research relied on the Google Earth Engine (GEE) platform to calculate the annual NPP data from 2000 to 2020 by calculating the annual total as the final coverage of the study area. The meteorological data from 2000 to 2020 used in this study are derive from the National Earth System Science Data Center, National Science and Technology Infrastructure of China (http://www.geodata.cn (accessed on 28 November 2021)), with a spatial resolution of 1 km [25].

2.3. Method

2.3.1. Meteorological Data Processing Methods

The Mann-Kendall method is a non-parametric statistical test method that has been widely used to study the time series of climate and hydrological elements such as temperature, precipitation, and runoff, as well as the abrupt changes and trends of raster-scale spatiotemporal data [26,27]:
Z s = S 1 Var S , i f   S > 0 0 , i f   S = 0 S + 1 Var S , i f   S < 0 ,
S = i = 1 n 1 j = i + 1 n sgn X j X I ,
Var S = n n 1 2 n + 5 18 ,
sgn X j X i = 1 , X j X i > 0 0 , X j X i = 0 1 , X j X i < 0 ,
where is the length of the time series, i is 2000, 2001, …, 2020. Under a given significance level α, when |Zs| > u1−α/2, the time series data of the study are at the α level. Significant changes are generally taken as α = 0.05. When |Zs| > 1.96, the time series has a significance α < 0.05, and |Zs| < 1.96 means significance α > 0.05.

2.3.2. Grassland NPP Treatment Methods

In this study, the NPPp of grassland was calculated by introducing the Zhou Guangsheng driving model. The NPPh is derived from the difference between the NPPp and NPPa. So as to quantitatively evaluate the relative contribution of climate change and human activities to the change of grassland NPP. The specific algorithm of the Zhou Guangsheng model is as follows [18,20]:
NPP p = RDI 2 × P × 1 + RDI + RDI 2 1 + RDI 1 + RDI 2 × Exp 9.87 + 6.25 RDI ,
RDI = 0.629 + 0.237 PER 0.00313 PER 2 2 ,
PER = BT × 58.93 P ,
BT = T 12 ,
where NPPp is the potential net primary productivity and RDI is the radiation index of dryness. P is the annual precipitation (mm), PER is the potential evapotranspiration rate, BT is the annual average temperature (°C), and T is the monthly mean temperature (°C).
The specific algorithm of NPP affected by human activities is as follows:
NPP h = NPP p NPP a ,
where NPPh is the NPP generated by anthropogenic activities, NPPp is the potential net primary productivity, and NPPa is the actual NPP.
After obtaining the annual NPPp, NPPa, and NPPh of grassland in the study area from 2000 to 2020, the temporal and spatial variation trend of grassland NPP in the study area from 2000 to 2020 was analyzed by means of linear regression. The specific algorithm is as follows [14]:
k = n × i = 1 n i × NPP i i = 1 n i × i = 1 n NPP i n × i = 1 n i 2 i = 1 n i 2 ,
where k is the change trend of NPP, k > 0 means NPP increases, k < 0 means NPP decreases, n = 21, i = 1, 2, 3, …, 21, NPPi refers to the annual average NPP in year i.
According to the changing trends of NPPp, NPPa, and NPPh, four causes for NPP changes are hypothesized, as shown in Table 1 [28,29].

2.3.3. Correlation Analysis

To further analyze the link between climate change and NPP change, this study measures the correlation between climate change and NPP change based on the correlation coefficient, which is calculated as follows [19]:
r = i = 1 n x i x y i y i = 1 n x i x 2 i = 1 n y i y 2 ,
where r is the correlation coefficient; n = 21, representing the time span from 2000 to 2020; xi is the NPP value of the i-th year, yi is the climate value (temperature or precipitation) of the i-th year, and x   is the average annual NPP value, y is the multi-year climatic average. The correlation level is divided into significant negative correlation (r < 0, p < 0.05), a non-significant negative correlation (r < 0, p > 0.05), a non-significant positive correlation (r > 0, p > 0.05), and a significant positive correlation (r > 0, p < 0.05).

3. Results

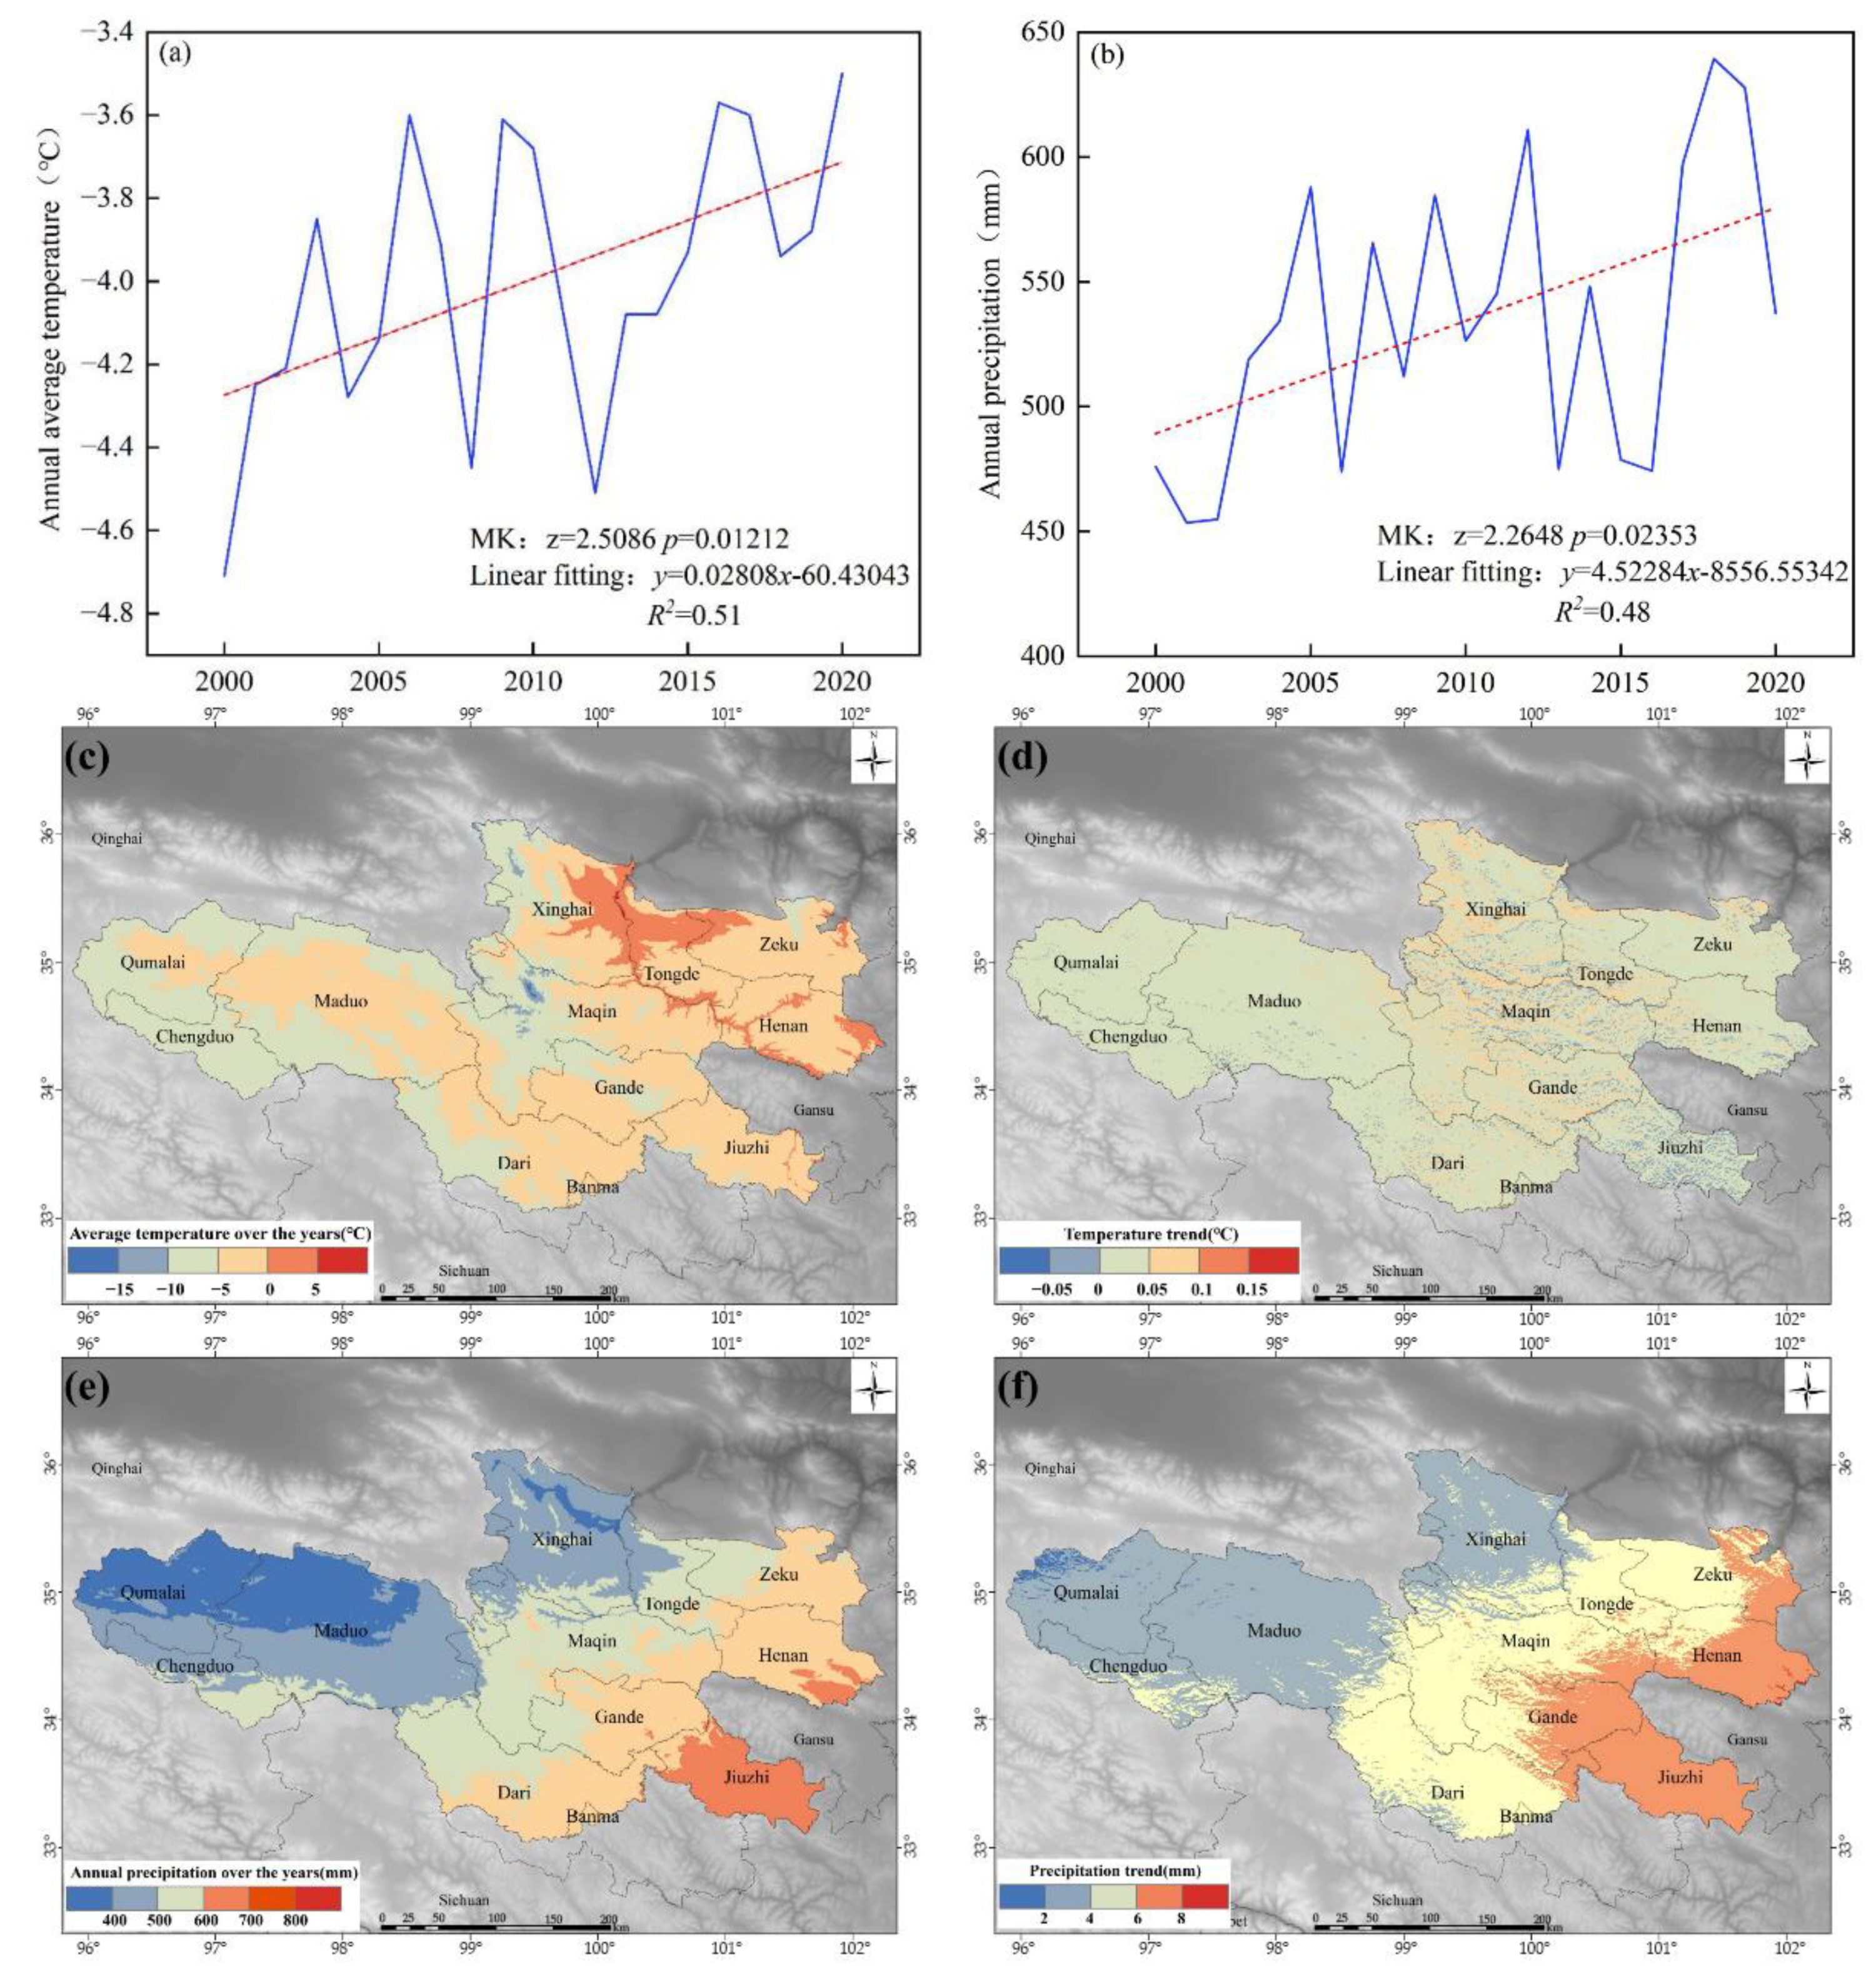
3.1. Climate Change in the Study Area from 2000 to 2020

From 2000 to 2020, the temperature in the study area showed an upward trend (as shown in Figure 4). The annual average temperature was −3.99 °C, the average annual minimum temperature was −4.71 °C (2000), and the maximum temperature was −3.50 °C (2020). The overall fluctuation of the annual average temperature showed an upward trend (z > 0), but it is not a clear trend (p > 0.01). Through linear fitting, the average temperature increase rate in 21 years was 0.28 °C/10 a. From a spatial point of view, the temperature in the northern and eastern regions was higher, and the temperature in the central and western regions was lower. The temperature in most regions showed a trend of increasing temperature. The annual precipitation was 534.36 mm, the annual minimum precipitation was 453.47 mm (2001), and the annual maximum precipitation was 639.22 mm (2018). The overall fluctuation of the annual precipitation shows an upward trend (z > 0), but there is no obvious trend (p > 0.01). Through linear fitting, the average precipitation increase rate over 21 years was 45.22 mm/10 a. From a spatial point of view, precipitation decreased from east to west, with minimum precipitation in the northwest, and maximum precipitation in the southeast. Overall, the study area showed a warm-humid climate trend from 2000 to 2020.

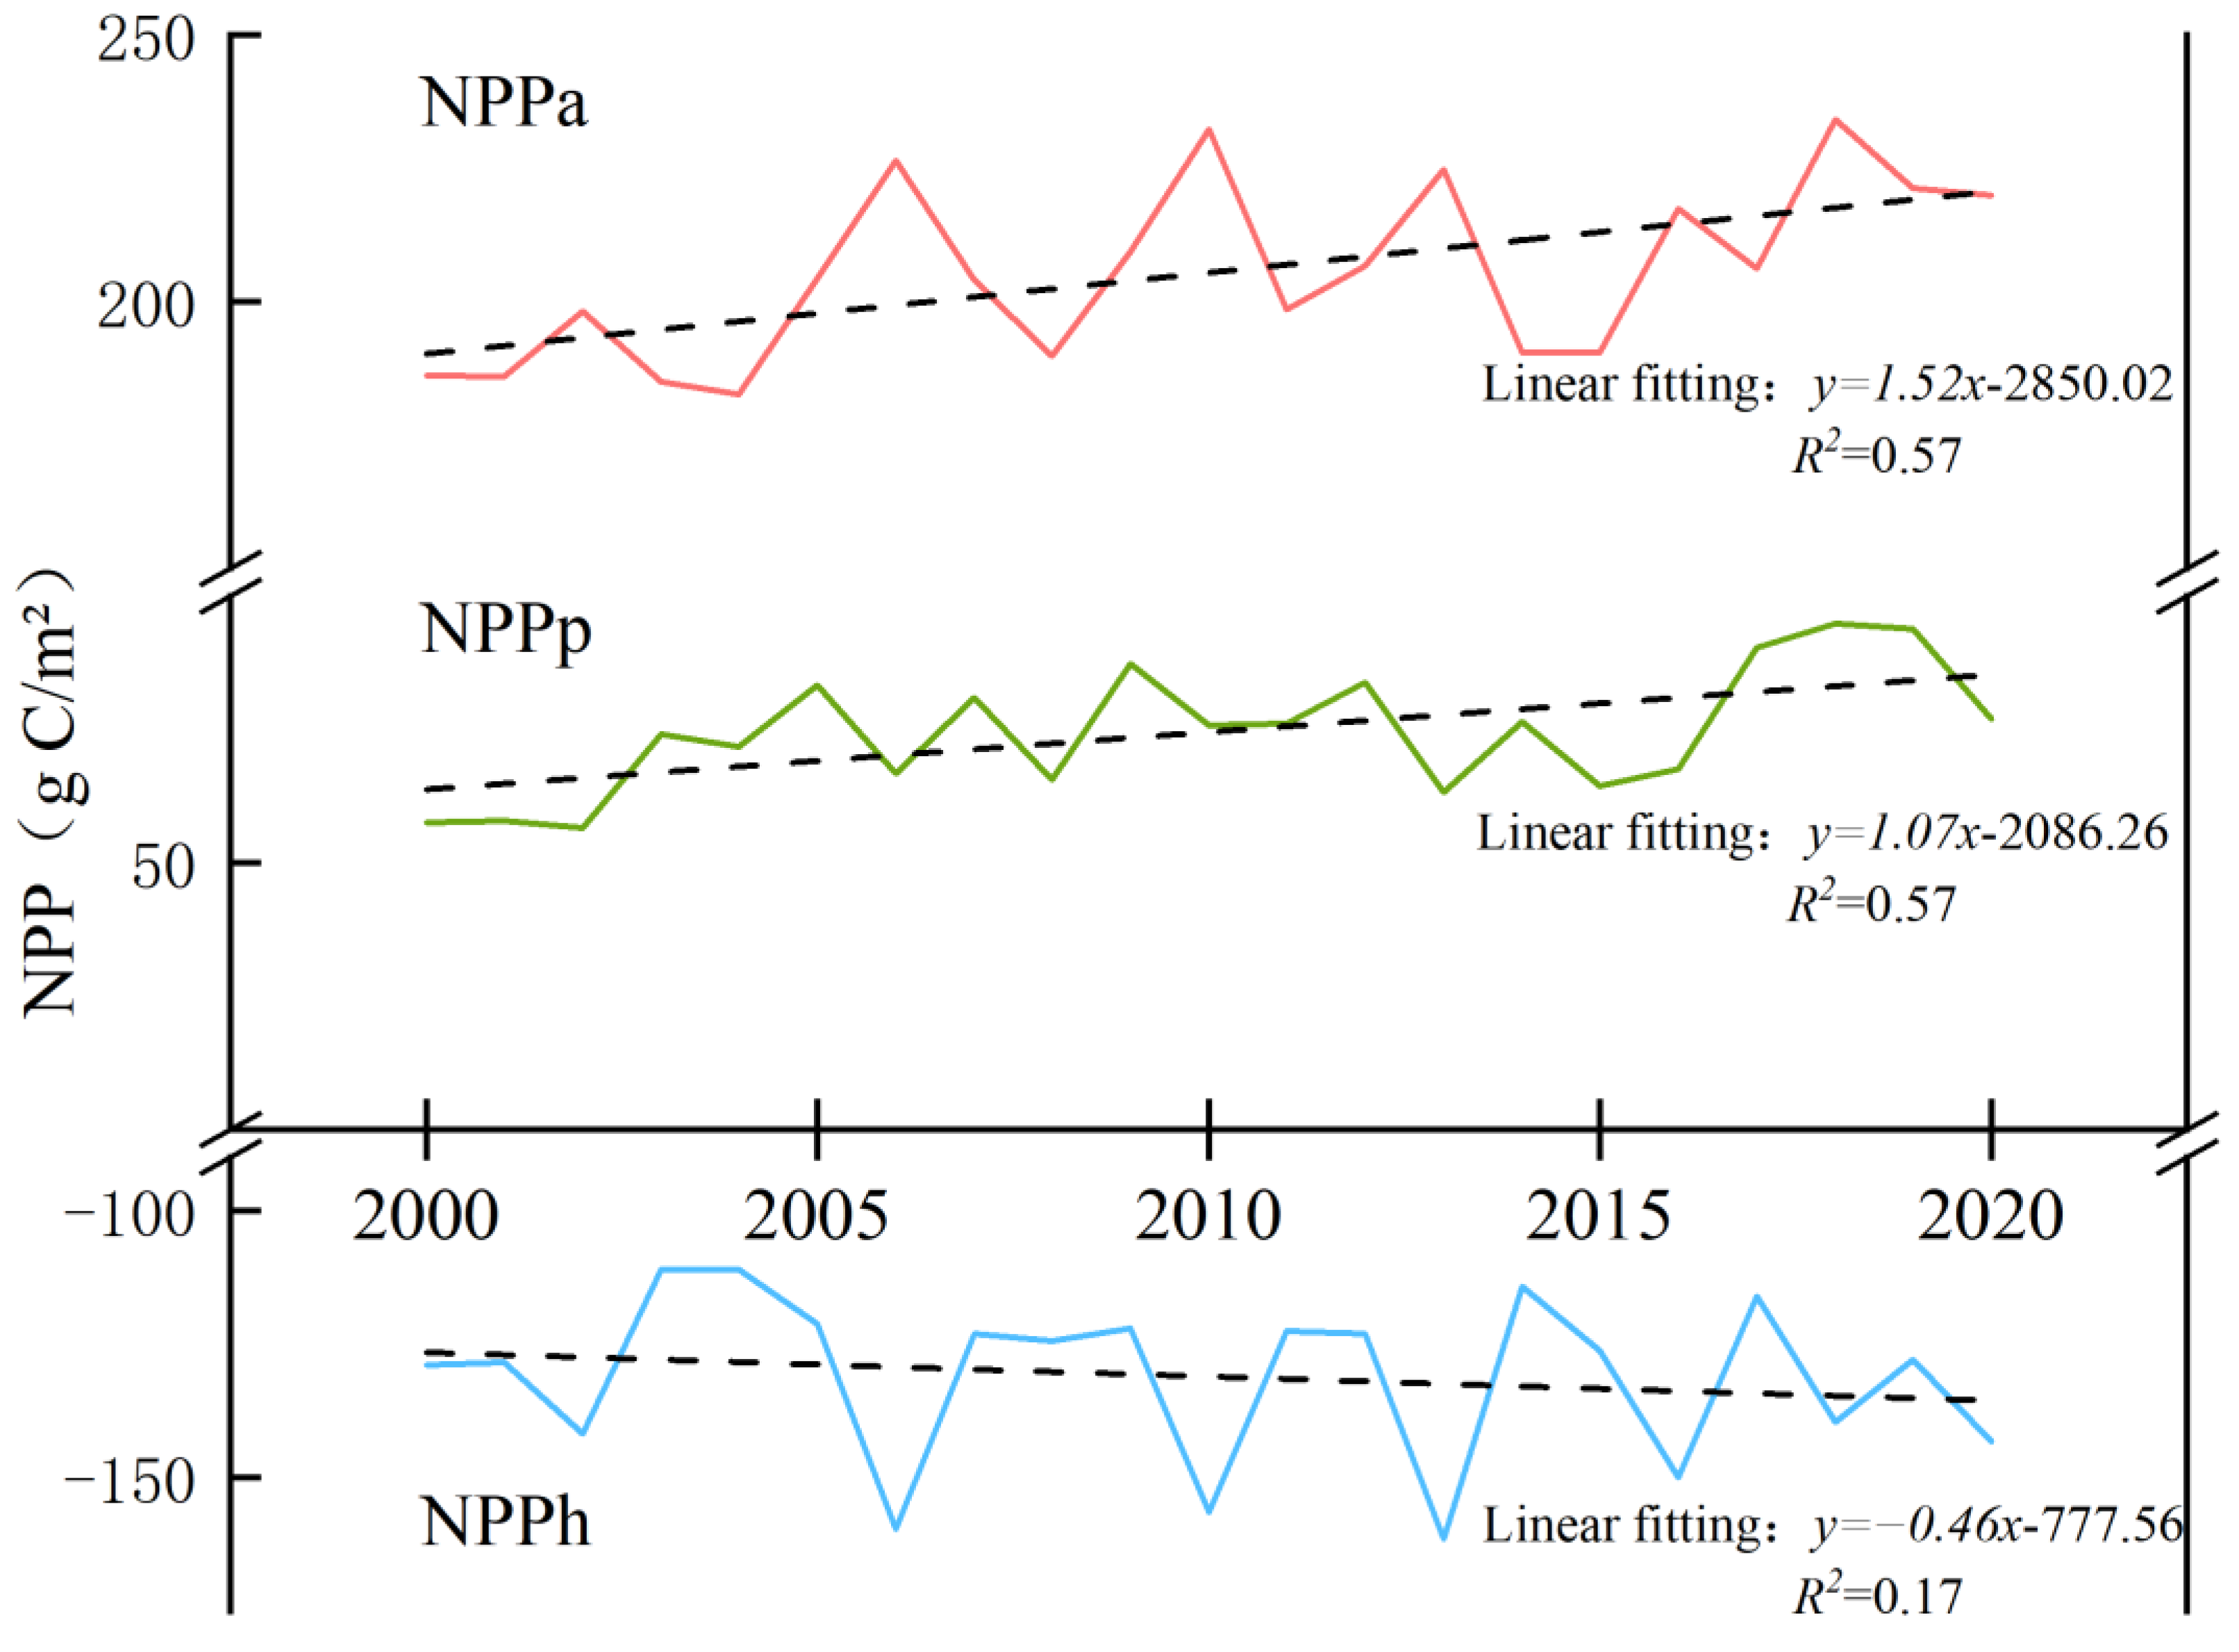
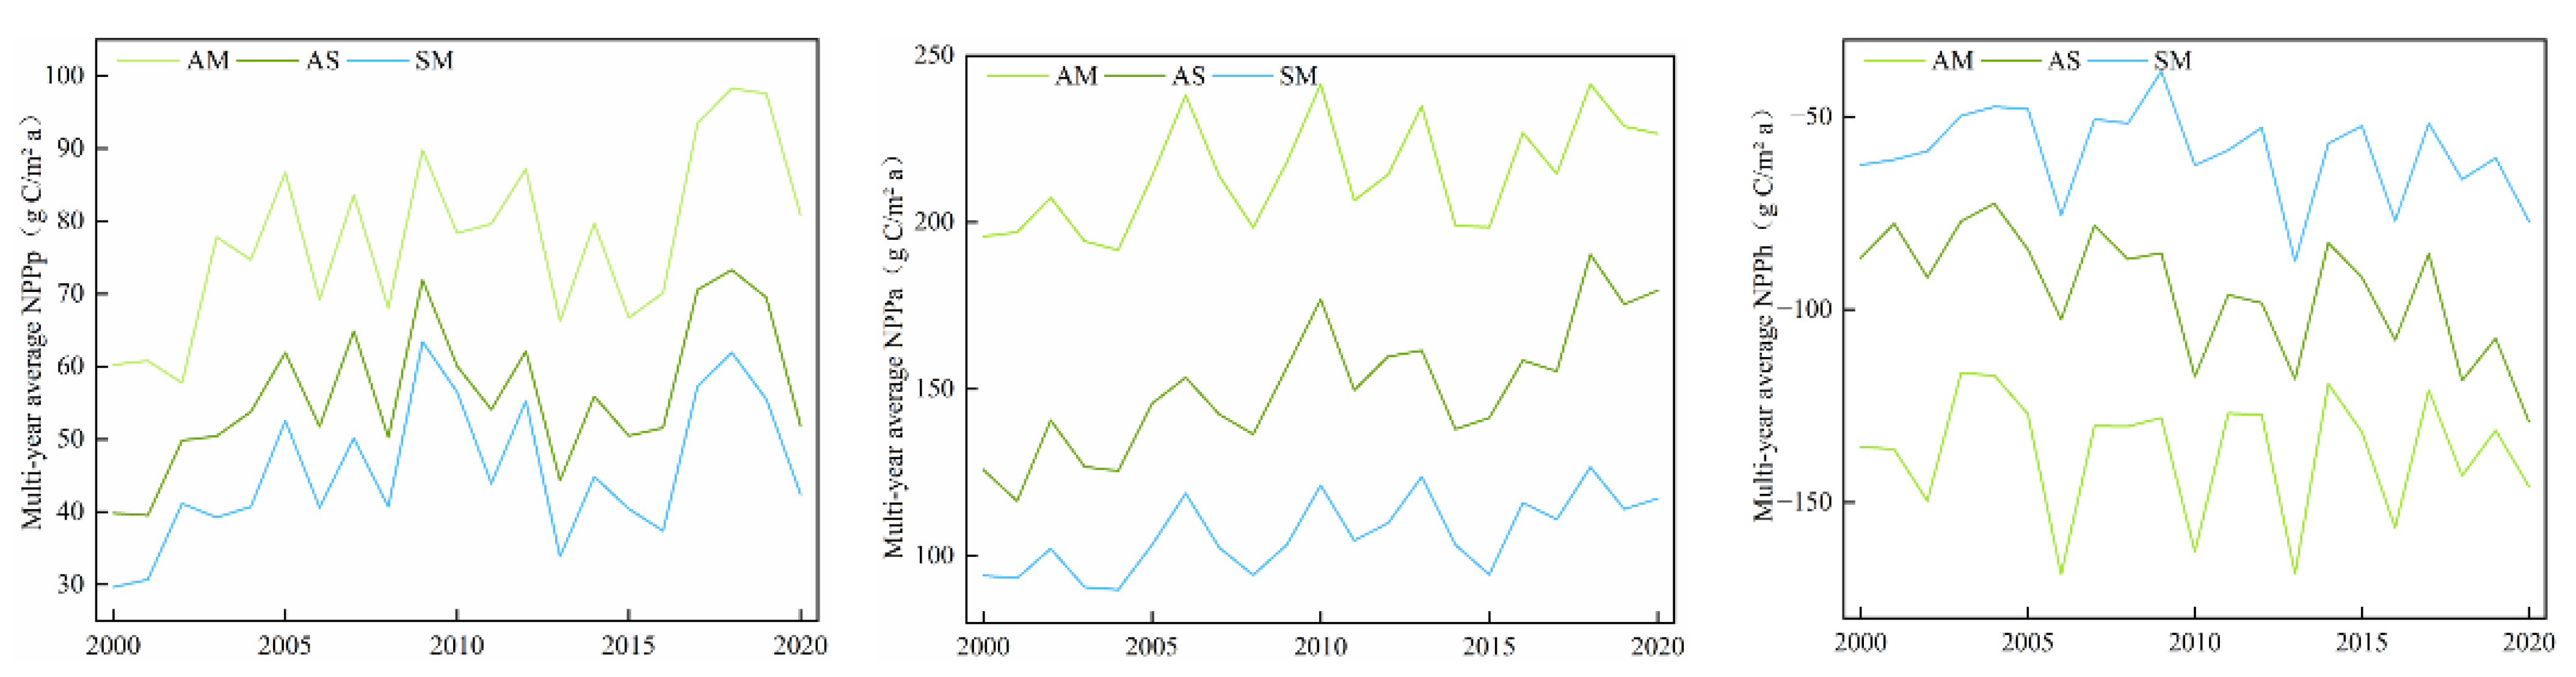
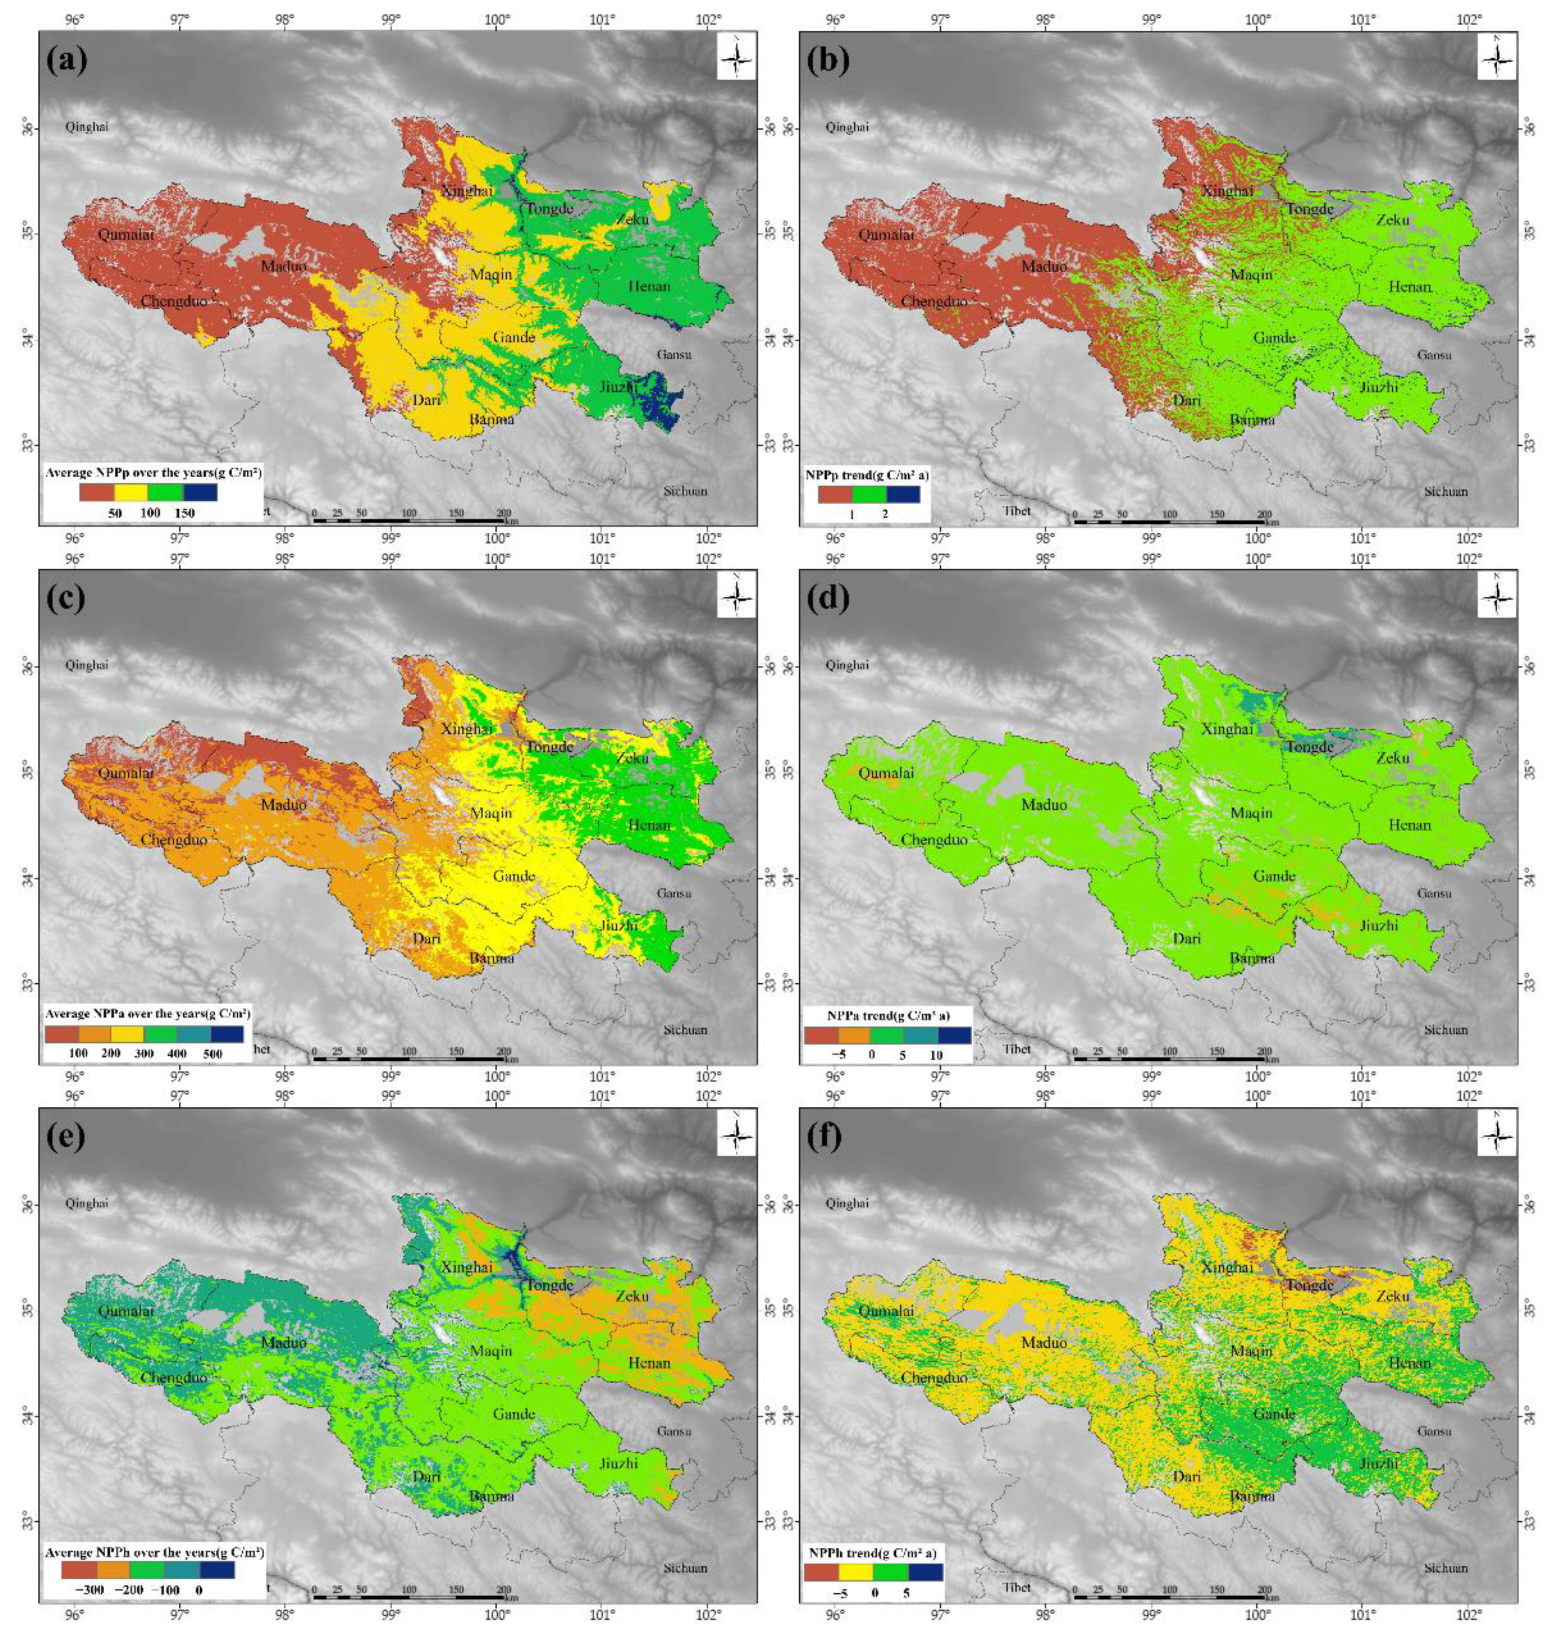
3.2. Variation in NPP in the Study Area Grassland from 2000 to 2020

From 2000 to 2020, the NPPp and NPPa of the Yellow River source grassland showed a steady upward trend (as shown in Figure 5), and NPPh showed a downward trend, but these changes were not significant (R2 were 0.57, 0.57, and 0.17, respectively). The NPPp was the lowest in 2002, at 56.6 g C/m2, highest in 2018 at 94.87 g C/m2, and the multi-year average was 74.51 g C/m2. The NPPa was lowest in 2004 at 182.55 g C/m2, the highest in 2018 at 234.07 g C/ m2, and the multi-year average was 205.40 g C/m2. Moreover, the NPPh was lowest in 2013, at −161.57 g C/m2, highest in 2004, at −110.98 g C/m2, and the multi-year average was −131.09 g C/m2. Overall, the NPPa in the study area was less than NPPp from 2000 to 2020, and the NPP was mostly supplemented by human activities and showed an increasing trend. Thus, the impact of artificial restoration measures on the grassland at the Yellow River source was positive.
There were three dominant types of grassland in the study area: alpine meadow (AM), alpine steppe (AS), and swamp meadow (SM), covering up to 86.88% of the study area (as shown in Figure 6). For alpine meadow, the multi-year average NPPp was 77.48 g C/m2, NPPa was 214.35 g C/m2, and NPPh was −136.81 g C/m2. For alpine grassland, the multi-year average NPPp was 56.09 g C/m2, NPPa was 150.29 g C/m2, and NPPh was −94.99 g C/m2. For swamp meadow, the multi-year average of NPPp was 45.63 g C/m2, NPPa was 106.39 g C/m2, and NPPh was −59.36 g C/m2. The NPPp and NPPa of alpine meadows are higher than those of alpine steppe and swamp meadows, with the greatest contributions from human activities.
The annual average NPPp of the Yellow River source grassland from 2000 to 2020 decreased from the southeast to the northwest (as shown in Figure 7). The distribution trend was consistent with the spatial distribution of the annual average precipitation, indicating that NPPp is closely related to precipitation. From 2000 to 2020, the NPPp of the grassland in the study area increased significantly, with an average increase of 1.07 g C/m2 a, and the increase rate in the eastern part was significantly higher than that in the western area. The spatial distribution of the annual average NPPa from 2000 to 2020 was the same as that of NPPp, with the distribution decreasing from southeast to northwest. From 2000 to 2020, the NPPa of most grasslands in the study area showed an increasing trend, with an average increase of 1.51 g C/m2 a; 4.06% of the grasslands were degraded. The grasslands were mainly located in Qumalai, Dari, Gander, and Jiuzhi. Compared with the increasing trend in NPPp, the increase of NPPa was larger. The grassland restoration projects carried out in the study area over many years have thus achieved good results. The NPPa increased from west to east, especially in the four counties in the north of the study area, due to human activities. From 2000 to 2020, the NPPh of the grasslands in the study area increased and then halved. A total of 63.87% of the grasslands supplemented by human activities showed an increasing trend in primary productivity. Where the primary productivity showed a decreasing trend, and this indicates that the grassland utilization rate is decreasing.

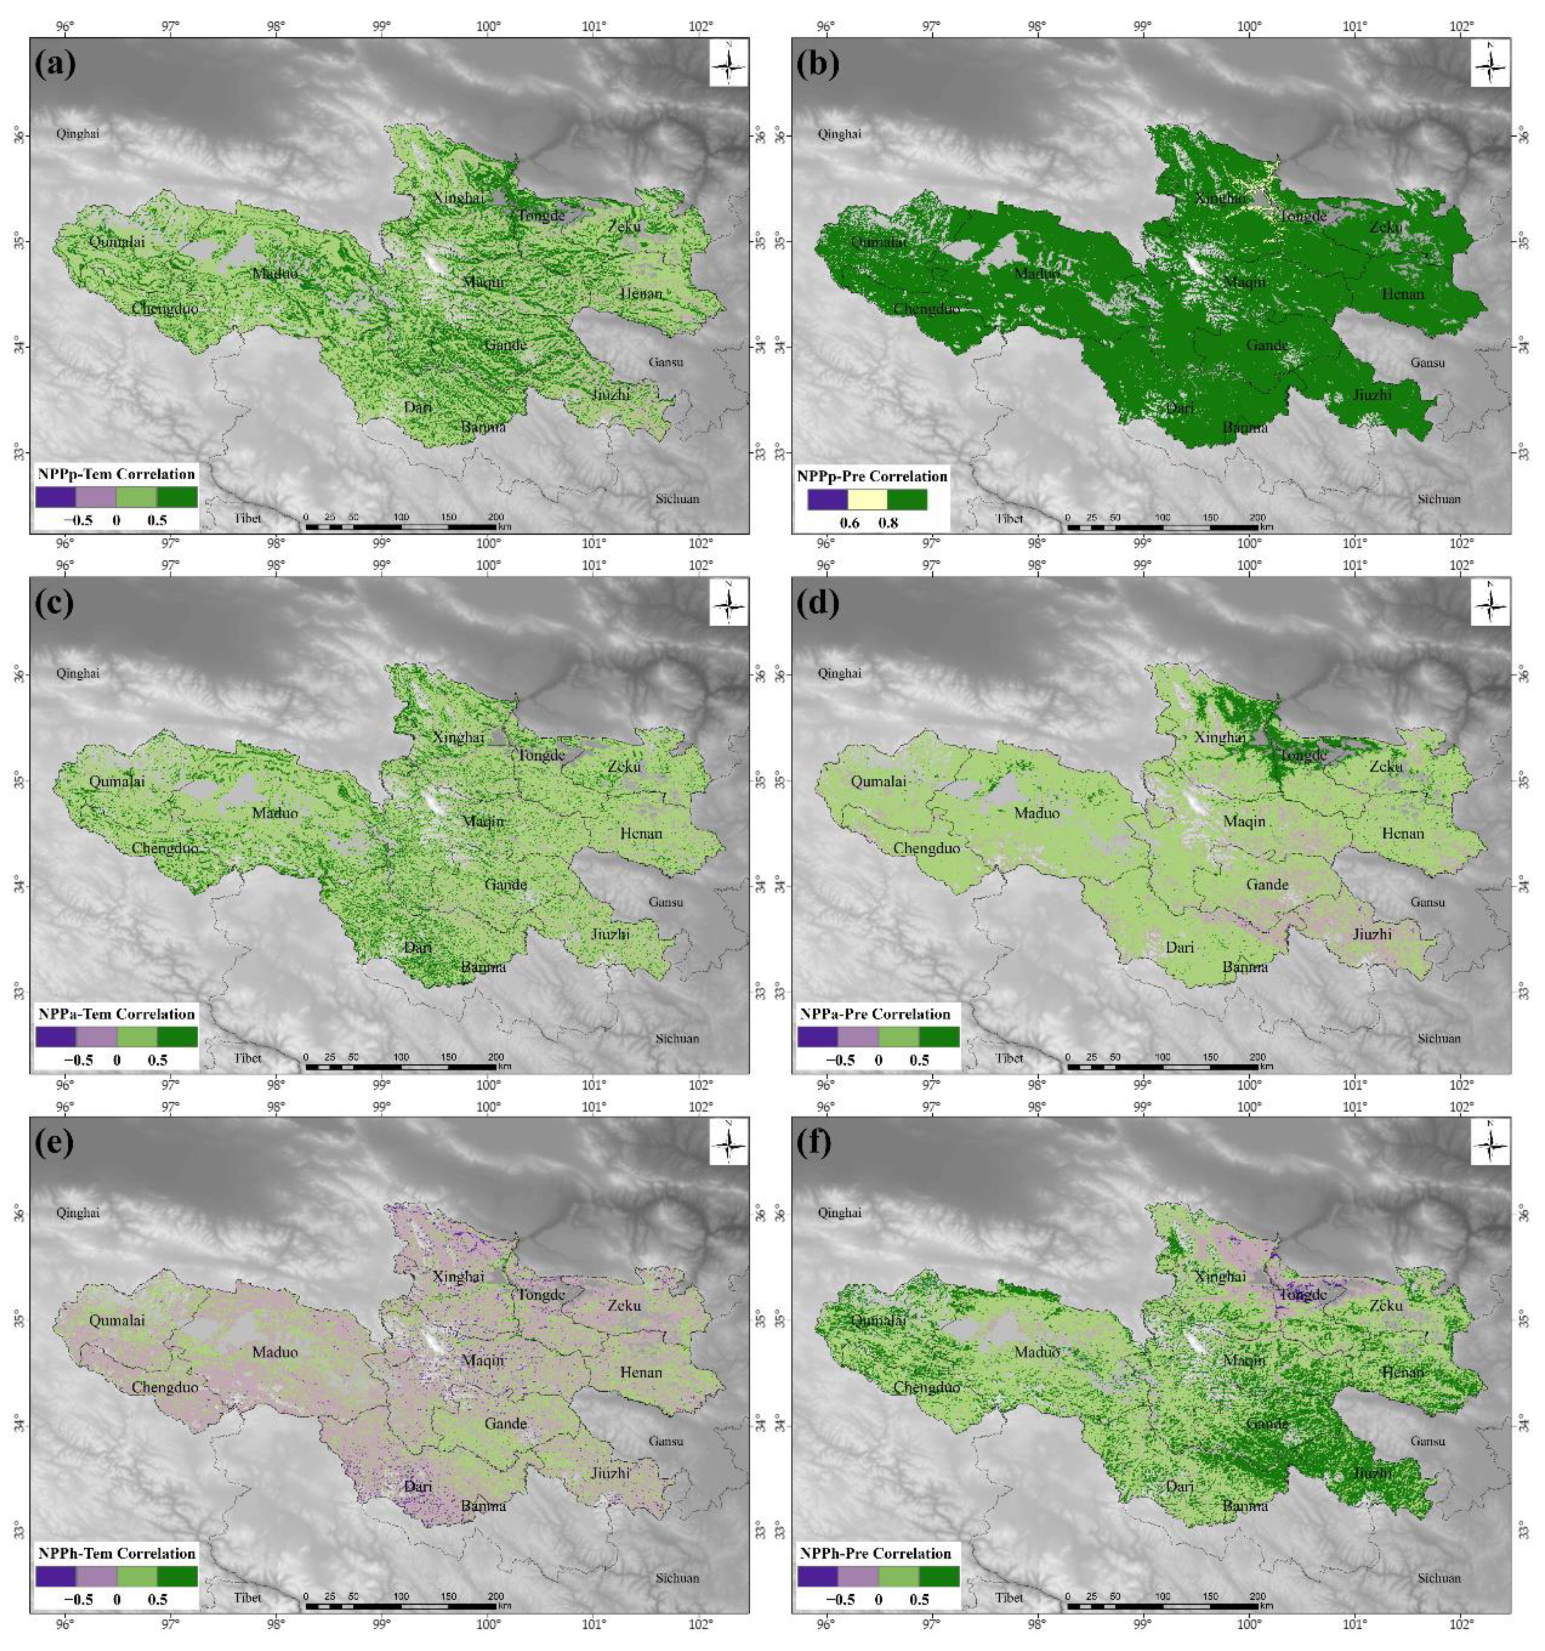
3.3. Correlation between NPP and Climatic Factors in the Grasslands in the Study Area from 2000 to 2020

Through correlation analysis between the NPP in the study area grassland and the precipitation and temperature from 2000 to 2020 (as shown in Figure 8), the correlation coefficient between NPPp and temperature was between −0.68 and 0.88, and 4.08% of the NPPp was negatively correlated with temperature. The NPPp was highly positively correlated with precipitation, and the correlation coefficient between NPPp and precipitation in most grasslands was above 0.8, indicating that precipitation was the main factor affecting grassland NPPp in the study area. The correlation between NPPa and temperature coefficients ranged from −0.60 to 0.89. Among the grasslands, 6.07% had a negative correlation between NPPa and temperature, the average correlation coefficient between NPPa and precipitation was 0.20, and 14.78% of grasslands had a negative correlation between NPPa and precipitation. There was a negative correlation between NPPa and precipitation in 14.78% of grasslands, and the correlation coefficient between NPPa and precipitation was the highest in the region with the largest increase of NPPa in the northern part of the study area. The average correlation coefficient between NPPh and the air temperature was −0.07, 65.19% of grasslands have a negative correlation between NPPh and temperature, and the average correlation coefficient between NPPh and precipitation was 0.34. The grassland NPPh in the area with the largest increase in NPPa in the north was highly negatively correlated with the precipitation, and the grassland NPPh in the area with the largest increase in NPPh in the east was highly positively correlated with the precipitation.

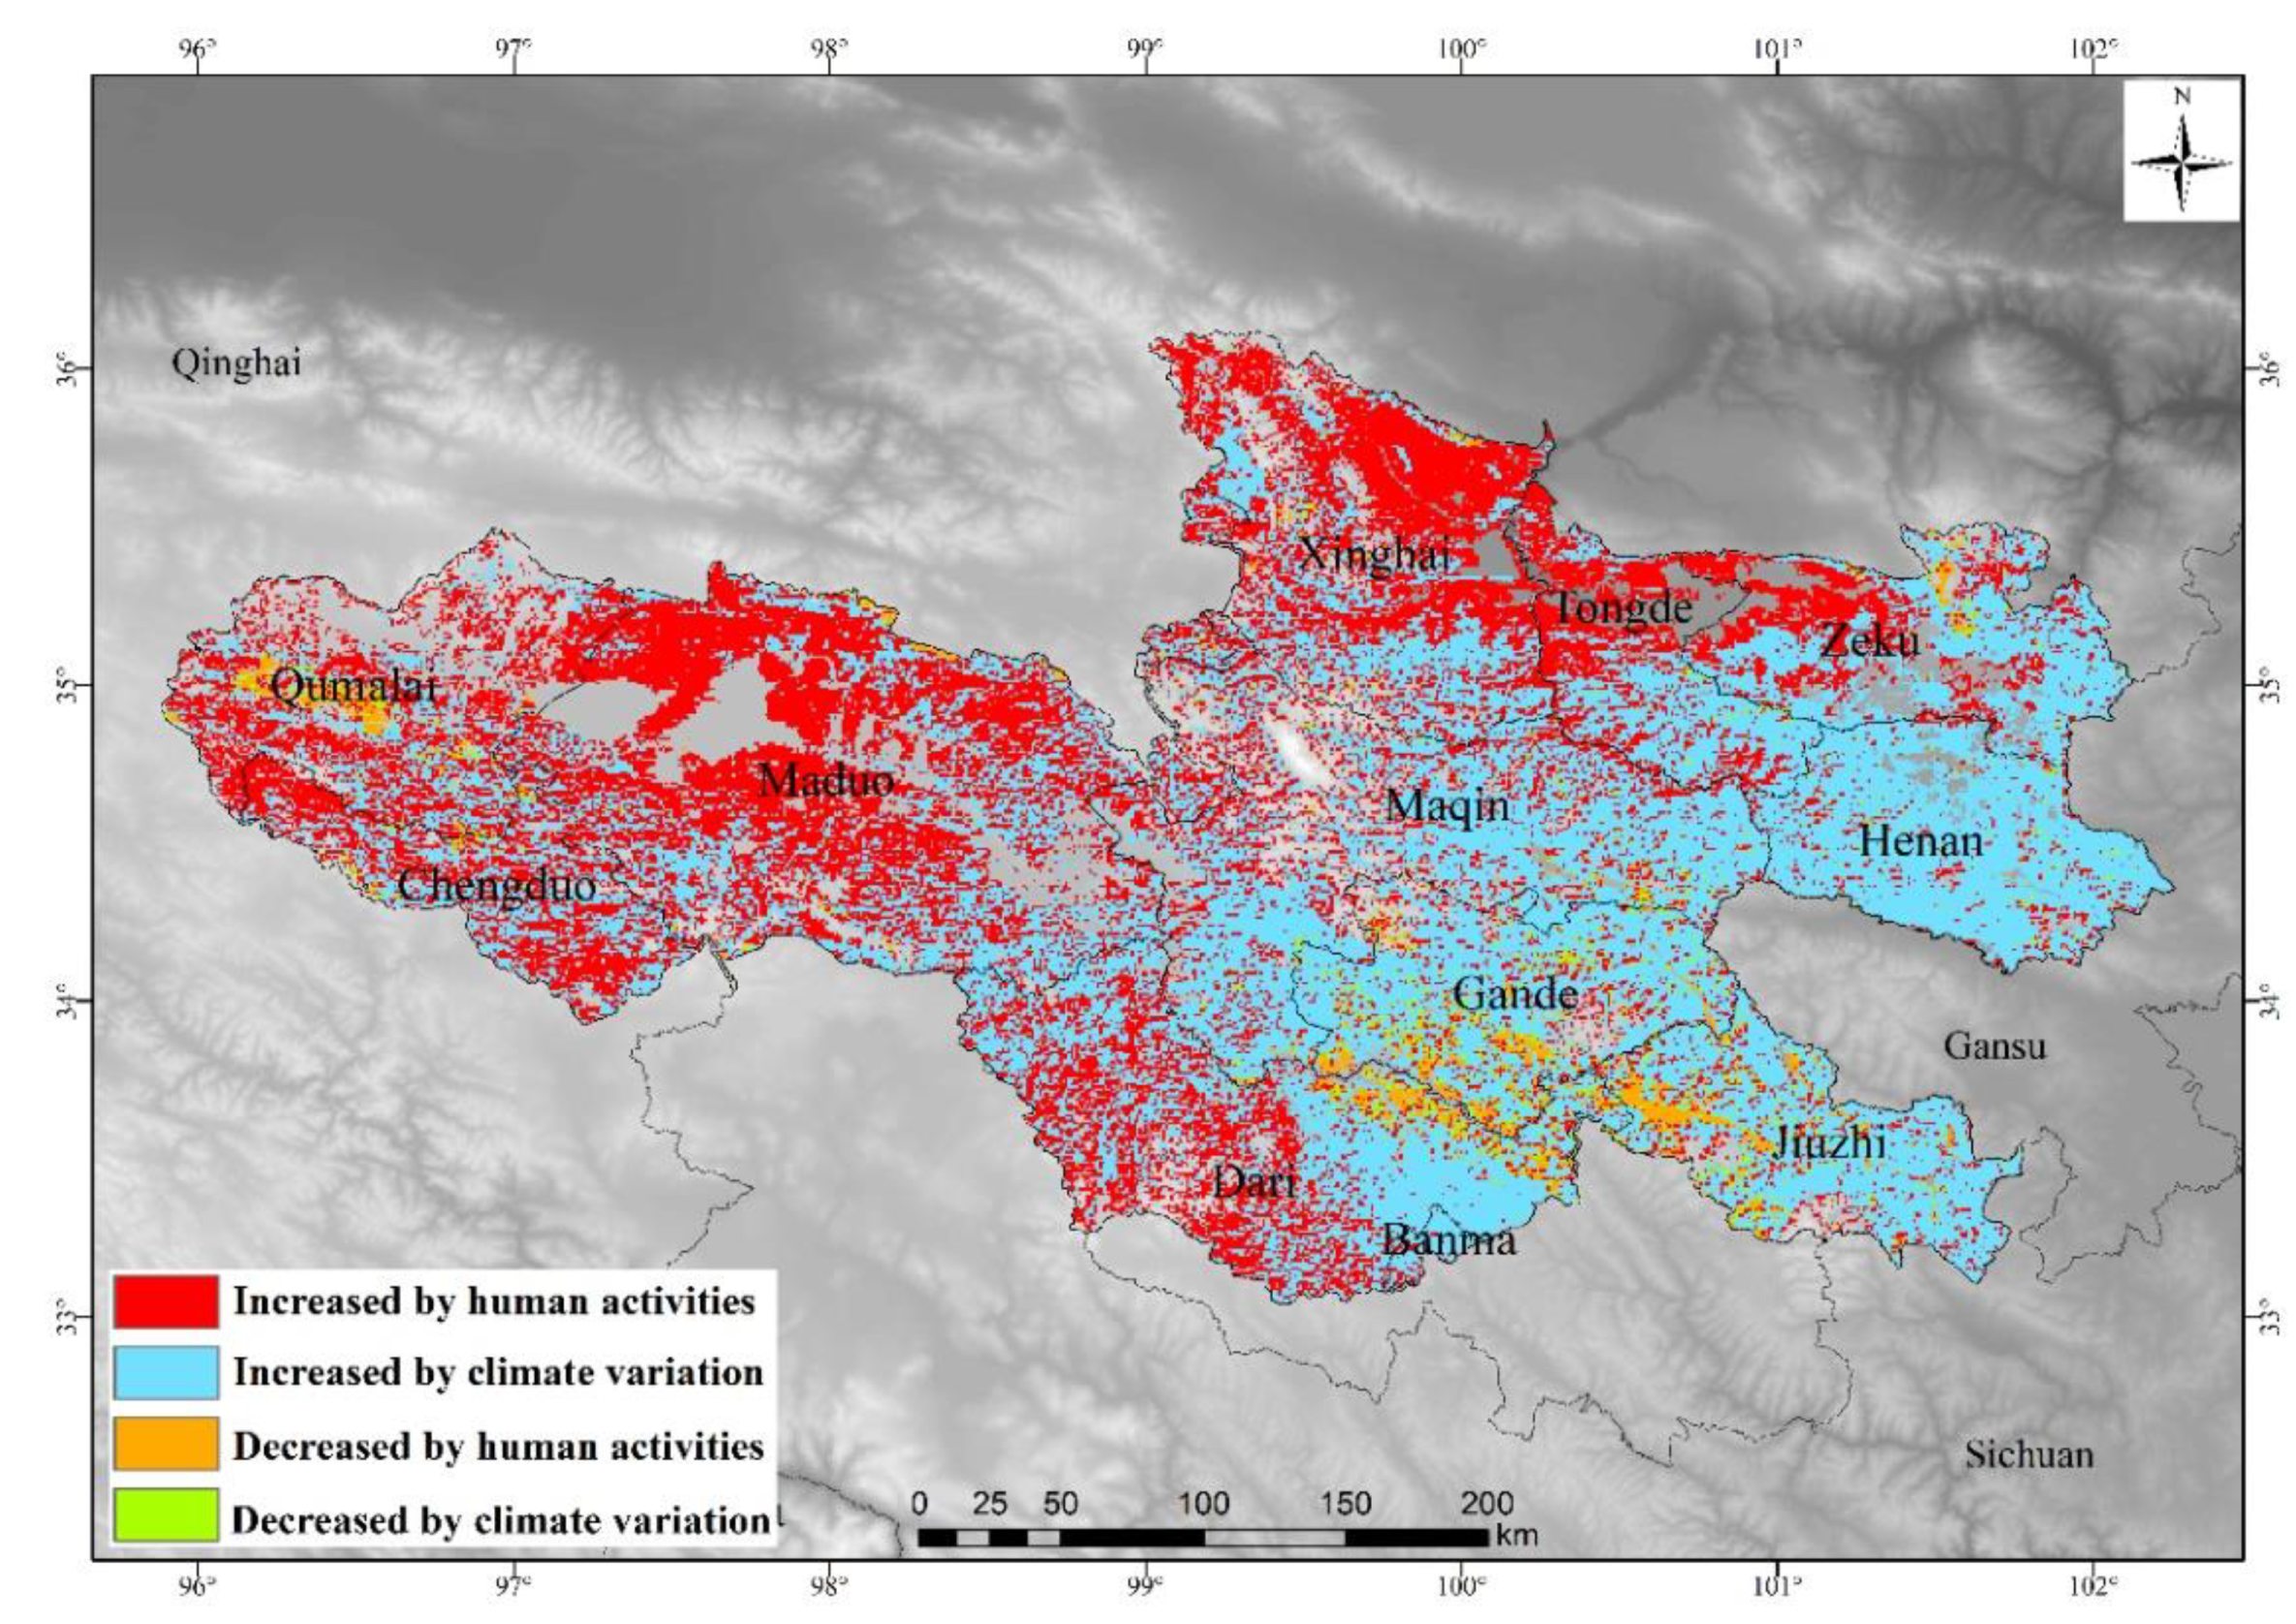
3.4. Relative Contributions of Climate Change and Human Activities to the NPP Changes

The relative contribution of climate change and human activities to grassland NPP changes was quantitatively evaluated by overlaying the variation trends of NPPp, NPPa, and NPPh. As shown in Figure 9, 96.06% of the grassland NPP in the study area showed an increasing trend, of which 55.90% was increased due to the influence of climate change, mainly in the east, an area which had the largest increase in precipitation. The grassland NPP was increased due to the influence of human activities, mainly in the northern and western regions of the study area. The grassland degraded areas were mainly distributed in scattered areas in Qumalai, Dari, Gande, and Jiuzhi. The contribution of human activities in the Yellow River source to grassland restoration was increasing year by year from 2000 to 2020, due to the long-term implementation of returning grazing land to grassland and ecological restoration projects in the Three River Sources.
From the perspective of the different grassland types, 60.51% of the grassland NPP in alpine meadows increased due to climate change, and 35.05% of the grassland NPP increased due to human activities (as shown in Table 2 and Figure 10). Moreover, 73.64% of the grassland in alpine steppe increased due to human activities, and only 25.91% of the grassland NPP increased due to human activities. In addition, the proportion of the swamp meadow NPP increased by climate change and human activities was close to 5:5. The reason for the difference in NPP changes in different grassland types is that alpine meadows, as the main type of grassland at the source of the Yellow River, are affected by climate change and human activities, and the proportion of the increase is close to the whole Yellow River source, while alpine steppe is mainly distributed in the northern region of the source of the Yellow River, especially in Xinghai and Tongde, which are the most densely populated areas at the source of the Yellow River. Swamp meadows are the least distributed grassland type at the source of the Yellow River. The eastern swamp meadows are mostly affected by climate change, and the western ones are mostly affected by human activities.

4. Discussion

The temperature in the study area shows a spatial distribution of high temperatures in the northeast and low in the southwest (Figure 4). The temperature increase area is much larger than the temperature decrease area, and the temperature increase rate also shows a trend of high in the east and low in the west. The spatial distribution of precipitation is higher in the southeast and lower in the northwest, and the increase in precipitation also shows a trend of higher in the east and lower in the west. Jin et al. found that the spatial distribution of temperature in t the Three-River-Source region from 1961 to 2019 shows a warming gradient along the northwest-southeast direction, and the increase in warming temperature and precipitation from west to east is becoming more and more obvious [30]. The annual average temperature in the source region of the Yellow River from 2000 to 2020 is −4.71 °C and the annual temperature is −3.99 °C. According to the linear fitting results, the average temperature increase rate over 21 years is 0.28 °C/10 a. Especially between 2012 and 2020, the temperature increase rate is more obvious. The temperature increase rate at the Three Rivers source was close to 0.40 °C/10 a during the same time period, much higher than the global average temperature increase rate [30]. The precipitation in the Yellow River source from 2000 to 2020 was between 453.47 and 639.22 mm, and the annual precipitation is 534.36 mm. According to the linear fitting results, the average increase rate of precipitation in 21 years is 45.22 mm/10 a, especially between 2016–2020, the precipitation increase trend is more evident. During the same time period, the increase in precipitation in the Three Rivers source was close to 50 mm/10 a, which was higher than the global average, areas at the same latitude, and the whole region of China [31,32]. To sum up, the study area presents a warm-humid climate trend.
The NPPp and NPPa of grassland in the study area tended to increase significantly, showing a spatial distribution of high in the east and low in the west. Related studies have also shown similar conclusions, such as Zhang et al. used Carnegie-Ames-Stanford to estimate the changing trend of vegetation NPP in TRSR from 1982 to 2012, and the results showed that the average NPP increased in 31 years [33]. Zhang et al. found that the Yellow River source grassland showed a recovery trend from 2001 to 2016, and NPP increased significantly [34]. Tang et al. used machine learning to simulate the temporal and spatial trend of aboveground biomass (AGB) in the Yellow River source grassland from 2001 to 2020, and the results showed that 69.51% of the grassland AGB showed an upward trend [35]. This increase in NPPa indicates that the grassland is in a state of recovery as a whole, and the decline of NPPh indicates that the grassland is more and more affected by human activities. The variation in NPPp and NPPa of different grassland types was the same as that for the whole region. As the main grassland type, alpine meadows had the highest NPP levels. The grassland NPPp in the study area had a very high positive correlation with precipitation, but little correlation with air temperature, and 4.08% of the area had a negative correlation with air temperature. The NPPa had no obvious correlation with precipitation and air temperature. A total of 14.78% of the area had a negative correlation with precipitation, and 6.07% of the area had a negative correlation with temperature. The NPPh had a high correlation with precipitation, but the correlation with temperature was not obvious. A total of 65.19% of the area had a negative correlation with temperature. The area of grassland NPP increase affected by climate change (55.03%) is larger than the area affected by human activities (41.05%). From the perspective of spatial distribution, the areas with increasing grassland NPP increase affected by climate change are distributed in the eastern part of the study area, which is affected by human activities. The areas with increasing grassland NPP are concentrated in the northern and western regions of the study area. On the whole, in the study area, grassland degradation caused by human activities has been significantly reduced, and there is a shift towards the restoration of grasslands, such as the construction of ecological barriers on the Qinghai-Tibet Plateau since 2000 [36].

5. Conclusions

This study quantified the relative contributions of climate change and human activities to the changes in NPP and identified the factors driving the change of NPP in the Yellow River source grassland. The results show that temperature and precipitation increased by 0.28°C/10 a and 45.22 mm/10 a, respectively, which showed a warm-humid climate trend. The NPPp showed a significant increasing trend, and the spatial distribution characteristics were consistent with the average precipitation. Comparing different grassland types, it was seen that alpine meadow—as the main grassland types in the study area—have higher NPPp and NPPa than alpine steppe and swamp meadow. In addition, the relative contribution analysis shows that climate change is still the main driving factor for the increase of NPP in the grassland of the Yellow River source, with 55.90% of the grassland NPP increased by climate change. As the main grassland type of the Yellow River source, the increase of NPP in alpine meadow is mainly affected by climate change. With the official establishment of the Three-River-Source National Park, the protection of the grasslands at the Yellow River source has gained extensive attention. The next step will be the implementation of the China Water Tower conservation project, the third phase of conservation and restoration of the Three-River-Source region, and the conservation of mountains, water, forests, fields, lakes, and grasses in the Yellow River Valley of Qinghai Province. With the implementation of projects such as the Thousand Mile Protection Zone Project in the upper reaches of the Yellow River, the NPP of the Yellow River source grassland will continue to increase, and we will consider the influences of such other human activities and add the human population in future work.

Author Contributions

Conceptualization, F.Z. and X.H.; methodology, F.Z. and X.H.; software, J.Z.; validation, C.L. and Y.Z.; investigation, C.L. and Y.Z.; resources, C.L. and Y.Z.; data curation, F.Z., J.Z., C.L. and Y.Z.; writing—original draft preparation, F.Z.; writing—review and editing, F.Z., X.H. and X.L.; funding acquisition, X.H. and X.L. All authors have read and agreed to the published version of the manuscript.

Funding

This research was funded by the National Natural Science Foundation of China (U21A20191), Qinghai Science and Technology Department (2020-ZJ-904), the 111 project of the plan for introducing talents through discipline innovation in colleges and universities (D18013) and Qinghai Science and Technology Innovation and Entrepreneurship Team Project titled ‘Sanjiangyuan Ecological Evolution and Management Innovation Team’.

Institutional Review Board Statement

Not applicable.

Informed Consent Statement

Not applicable.

Data Availability Statement

Not applicable.

Acknowledgments

We are appreciative for the constructive comments and suggestions provided by Panpan Ma during the manuscript preparation.

Conflicts of Interest

The authors declare no conflict of interest.

References

  1. Yang, S.; Feng, Q.; Liang, T.; Liu, B.; Zhang, W.; Xie, H. Modeling grassland above-ground biomass based on artificial neural network and remote sensing in the Three-River Headwaters Region. Remote Sens. Environ. 2018, 204, 448–455. [Google Scholar] [CrossRef]
  2. Xu, K.; Su, Y.; Liu, J.; Hu, T.; Jin, S.; Ma, Q.; Zhai, Q.; Wang, R.; Zhang, J.; Li, Y. Estimation of degraded grassland aboveground biomass using machine learning methods from terrestrial laser scanning data. Ecol. Indic. 2020, 108, 105747. [Google Scholar] [CrossRef]
  3. Zheng, Z.; Zhu, W.; Zhang, Y. Seasonally and spatially varied controls of climatic factors on net primary productivity in alpine grasslands on the Tibetan Plateau. Glob. Ecol. Conserv. 2020, 21, e00814. [Google Scholar] [CrossRef]
  4. Wu, G.L.; Cheng, Z.; Alatalo, J.M.; Zhao, J.; Liu, Y. Climate warming consistently reduces grassland ecosystem productivity. Earth’s Future 2021, 9, e2020EF001837. [Google Scholar] [CrossRef]
  5. Tong, L.; Xu, X.; Fu, Y.; Li, S. Wetland changes and their responses to climate change in the “three-river headwaters” region of China since the 1990s. Energies 2014, 7, 2515–2534. [Google Scholar] [CrossRef] [Green Version]
  6. Bardgett, R.D.; Bullock, J.M.; Lavorel, S.; Manning, P.; Schaffner, U.; Ostle, N.; Chomel, M.; Durigan, G.; Fry, E.L.; Johnson, D. Combatting global grassland degradation. Nat. Rev. Earth Environ. 2021, 2, 720–735. [Google Scholar] [CrossRef]
  7. Raffaelli, D.; White, P.C. Ecosystems and their services in a changing world: An ecological perspective. In Advances in Ecological Research; Elsevier: Amsterdam, The Netherlands, 2013; Volume 48, pp. 1–70. [Google Scholar]
  8. Carlyle, C.N.; Fraser, L.H.; Turkington, R. Response of grassland biomass production to simulated climate change and clipping along an elevation gradient. Oecologia 2014, 174, 1065–1073. [Google Scholar] [CrossRef]
  9. Thebault, A.; Mariotte, P.; Lortie, C.J.; MacDougall, A.S. Land management trumps the effects of climate change and elevated CO2 on grassland functioning. J. Ecol. 2014, 102, 896–904. [Google Scholar] [CrossRef]
  10. Zhou, G.; Luo, Q.; Chen, Y.; He, M.; Zhou, L.; Frank, D.; He, Y.; Fu, Y.; Zhang, B.; Zhou, X. Effects of livestock grazing on grassland carbon storage and release override impacts associated with global climate change. Glob. Chang. Biol. 2019, 25, 1119–1132. [Google Scholar] [CrossRef]
  11. Shahzaman, M.; Zhu, W.; Ullah, I.; Mustafa, F.; Bilal, M.; Ishfaq, S.; Nisar, S.; Arshad, M.; Iqbal, R.; Aslam, R.W. Comparison of multi-year reanalysis, models, and satellite remote sensing products for agricultural drought monitoring over south asian countries. Remote Sens. 2021, 13, 3294. [Google Scholar] [CrossRef]
  12. Ullah, I.; Saleem, F.; Iyakaremye, V.; Yin, J.; Ma, X.; Syed, S.; Hina, S.; Asfaw, T.G.; Omer, A. Projected changes in socioeconomic exposure to heatwaves in South Asia under changing climate. Earth Future 2022, 10, e2021EF002240. [Google Scholar] [CrossRef]
  13. Luo, Z.; Wu, W.; Yu, X.; Song, Q.; Yang, J.; Wu, J.; Zhang, H. Variation of net primary production and its correlation with climate change and anthropogenic activities over the Tibetan Plateau. Remote Sens. 2018, 10, 1352. [Google Scholar] [CrossRef]
  14. Wei, X.; Yan, C.; Wei, W. Grassland dynamics and the driving factors based on net primary productivity in Qinghai Province, China. ISPRS Int. J. Geo-Inf. 2019, 8, 73. [Google Scholar] [CrossRef] [Green Version]
  15. Zhou, W.; Li, H.; Xie, L.; Nie, X.; Wang, Z.; Du, Z.; Yue, T. Remote sensing inversion of grassland aboveground biomass based on high accuracy surface modeling. Ecol. Indic. 2021, 121, 107215. [Google Scholar] [CrossRef]
  16. Guang-sheng, Z.; Xin-shi, Z. Study on NPP of natural vegetation in China under global climate change. Chin. J. Plant Ecol. 1996, 20, 11. [Google Scholar]
  17. Chen, A.; Li, R.; Wang, H.; He, B. Quantitative assessment of human appropriation of aboveground net primary production in China. Ecol. Model. 2015, 312, 54–60. [Google Scholar] [CrossRef] [Green Version]
  18. Ren, H.; Zhou, G. Measuring the impacts of anthropogenic activities on Inner Mongolian temperate grassland. Land Degrad. Dev. 2018, 29, 2942–2950. [Google Scholar] [CrossRef]
  19. Feng, Y.; Wu, J.; Zhang, J.; Zhang, X.; Song, C. Identifying the relative contributions of climate and grazing to both direction and magnitude of alpine grassland productivity dynamics from 1993 to 2011 on the Northern Tibetan Plateau. Remote Sens. 2017, 9, 136. [Google Scholar] [CrossRef] [Green Version]
  20. Zhao, L.; Liu, Z.; Hu, Y.; Zhou, W.; Peng, Y.; Ma, T.; Liu, L.; Li, S.; Wang, L.; Mao, X. Evaluation of Reasonable Stocking Rate Based on the Relative Contribution of Climate Change and Grazing Activities to the Productivity of Alpine Grasslands in Qinghai Province. Remote Sens. 2022, 14, 1455. [Google Scholar] [CrossRef]
  21. Zheng, Y.; Huang, Y.; Zhou, S.; Wang, K.; Wang, G. Effect partition of climate and catchment changes on runoff variation at the headwater region of the Yellow River based on the Budyko complementary relationship. Sci. Total Environ. 2018, 643, 1166–1177. [Google Scholar] [CrossRef]
  22. Yuan, F.; Liu, J.; Berndtsson, R.; Hao, Z.; Cao, Q.; Wang, H.; Du, Y.; An, D. Changes in precipitation extremes over the source region of the Yellow River and its relationship with teleconnection patterns. Water 2020, 12, 978. [Google Scholar] [CrossRef] [Green Version]
  23. Chen, F.; Chen, J.; Wu, H.; Hou, D.; Zhang, W.; Zhang, J.; Zhou, X.; Chen, L. A landscape shape index-based sampling approach for land cover accuracy assessment. Sci. China Earth Sci. 2016, 59, 2263–2274. [Google Scholar] [CrossRef]
  24. Jun, C.; Ban, Y.; Li, S. Open access to Earth land-cover map. Nature 2014, 514, 434. [Google Scholar] [CrossRef] [PubMed] [Green Version]
  25. Peng, S.; Ding, Y.; Liu, W.; Li, Z. 1 km monthly temperature and precipitation dataset for China from 1901 to 2017. Earth Syst. Sci. Data 2019, 11, 1931–1946. [Google Scholar] [CrossRef] [Green Version]
  26. Zhang, R.; Liang, T.; Guo, J.; Xie, H.; Feng, Q.; Aimaiti, Y. Grassland dynamics in response to climate change and human activities in Xinjiang from 2000 to 2014. Sci. Rep. 2018, 8, 2888. [Google Scholar] [CrossRef]
  27. Chen, T.; Bao, A.; Jiapaer, G.; Guo, H.; Zheng, G.; Jiang, L.; Chang, C.; Tuerhanjiang, L. Disentangling the relative impacts of climate change and human activities on arid and semiarid grasslands in Central Asia during 1982–2015. Sci. Total Environ. 2019, 653, 1311–1325. [Google Scholar] [CrossRef]
  28. Liu, Y.; Wang, Q.; Zhang, Z.; Tong, L.; Wang, Z.; Li, J. Grassland dynamics in responses to climate variation and human activities in China from 2000 to 2013. Sci. Total Environ. 2019, 690, 27–39. [Google Scholar] [CrossRef]
  29. Chen, H.; Ju, P.; Zhang, J.; Wang, Y.; Yan, L.; Kang, X.; He, Y.; Zeng, Y.; Hao, Y.; Wang, Y. Attribution analyses of changes in alpine grasslands on the Qinghai-Tibetan Plateau. Chin. Sci. Bull. 2020, 65, 2406–2418. [Google Scholar] [CrossRef]
  30. Jin, Z.; You, Q.; Wu, F.; Sun, B.; Cai, Z. Changes of climate and climate extremes in the Three-Rivers Headwaters’ Region over the Tibetan Plateau during the past 60 years. Trans. Atmos. Sci 2020, 43, 1042–1055. [Google Scholar]
  31. Deng, M.; Meng, X.; Li, Z.; Lyv, Y.; Lei, H.; Zhao, L.; Zhao, S.; Ge, J.; Jing, H. Responses of soil moisture to regional climate change over the three rivers source region on the tibetan plateau. Int. J. Climatol. 2020, 40, 2403–2417. [Google Scholar] [CrossRef]
  32. Li, S.; Yao, Z.; Wang, R.; Liu, Z. Dryness/wetness pattern over the Three-River Headwater Region: Variation characteristic, causes, and drought risks. Int. J. Climatol. 2020, 40, 3550–3566. [Google Scholar] [CrossRef]
  33. Zhang, Y.; Zhang, C.; Wang, Z.; Chen, Y.; Gang, C.; An, R.; Li, J. Vegetation dynamics and its driving forces from climate change and human activities in the Three-River Source Region, China from 1982 to 2012. Sci. Total Environ. 2016, 563, 210–220. [Google Scholar] [CrossRef] [PubMed]
  34. Zhang, Y.; Zhang, C.; Wang, Z.; An, R.; Li, J. Comprehensive research on remote sensing monitoring of grassland degradation: A case study in the Three-River Source Region, China. Sustainability 2019, 11, 1845. [Google Scholar] [CrossRef] [Green Version]
  35. Tang, R.; Zhao, Y.; Lin, H. Spatio-temporal variation characteristics of aboveground biomass in the headwater of the yellow river based on machine learning. Remote Sens. 2021, 13, 3404. [Google Scholar] [CrossRef]
  36. Zhao, X.; Zhao, L.; Li, Q.; Chen, H.; Zhou, H.; Xu, S.; Dong, Q.; Wu, G.; He, Y. Using balance of seasonal herbage supply and demand to inform sustainable grassland management on the Qinghai–Tibetan Plateau. Front. Agric. Sci. Eng. 2018, 5, 1–8. [Google Scholar] [CrossRef] [Green Version]
Figure 1. Location map of the study area.
Sustainability 14 08790 g001
Figure 2. Land use and land cover type map of the study area in 2020.
Sustainability 14 08790 g002
Figure 3. Grassland type map of the study area.
Sustainability 14 08790 g003
Figure 4. Variations in climate factors in the study area from 2000 to 2020: (a) the annual variation in average annual average temperature; (b) the interannual variation of annual precipitation; (c) the spatial distribution of annual average temperature; (d) the spatial distribution of annual average temperature change trend; (e) the spatial distribution of annual precipitation; (f) the spatial distribution of annual precipitation change trend.
Sustainability 14 08790 g004
Figure 5. Interannual variation in grassland NPP in the study area from 2000 to 2020.
Sustainability 14 08790 g005
Figure 6. Interannual variation in NPP of different grassland types in the study area from 2000 to 2020. Light green is alpine meadow. Dark green is alpine grassland. Blue is swamp meadow.
Sustainability 14 08790 g006
Figure 7. Interannual variation of grassland NPP in the study area from 2000 to 2020: (a) the interannual variation of NPPp; (b) the spatial distribution of NPPp change trend; (c) the interannual variation of NPPa; (d) the spatial distribution of NPPa change trend; (e) the interannual variation of NPPh; (f) the spatial distribution of NPPh change trend.
Sustainability 14 08790 g007
Figure 8. Spatial distribution of the correlation between NPP and climate factors in the study area from 2000 to 2020: (a) NPPp and temperature in 2000–2020; (b) NPPp and precipitation in 2000–2020; (c) NPPa and temperature in 2000–2020; (d) NPPa and precipitation in 2000–2020; (e) NPPh and temperature in 2000–2020; (f) NPPh and precipitation in 2000–2020.
Sustainability 14 08790 g008
Figure 9. Spatial patterns of driving factors for NPP changes in the study area from 2000 to 2020.
Sustainability 14 08790 g009
Figure 10. Driving forces of NPP change in different grassland types: (a) alpine meadow; (b) alpine grassland; (c) swamp meadow.
Sustainability 14 08790 g010
Table 1. Causes of changes in NPP.
TypeCauses of Changes in NPP
kNPPa ≥ 0 and kNPPp ≥ kNPPhIncreased by climate variation
kNPPa ≥ 0 and kNPPp < kNPPhIncreased by human activities
kNPPa < 0 and kNPPp ≥ kNPPhDecreased by climate variation
kNPPa < 0 and kNPPp < kNPPhDecreased by human activities
Note: kNPPa, kNPPp, and kNPPh indicate the slope value of the NPPa, NPPp, and NPPh, respectively.
Table 2. Contribution to change in NPP.
Contribution to Change in NPP AMASSM
Increased by human activities35.05%73.64%51.12%
Increased by climate variation60.51%25.91%47.62%
Decreased by human activities2.49%0.32%0.63%
Decreased by climate variation1.95%0.13%0.63%
Publisher’s Note: MDPI stays neutral with regard to jurisdictional claims in published maps and institutional affiliations.

