Abstract
The article deals with current issues of finance and investment planning with a selective focus on financial decision-making processes using sophisticated software tools. The article has a special significance in this period when it is necessary to re-evaluate and consider ways of appropriate and effective investment and financial policy in view of the restrictions in enterprises in Slovakia, which brings with it the global pandemic COVID-19 or another crisis in enterprises. The aim of the article is to propose a methodology as a tool for streamlining the investment activities of companies. The proposed methodology combines the usability of traditional and modern economic methods, making it an important tool for the sustainability and competitiveness of enterprises. Three variants of investment decisions in the enterprise were simulated using simulation in terms of two approaches. The first approach focuses on mathematical–economic calculations of deterministic modeling through traditional software tools. The second stochastic modeling uses the simulation of financial risks using a modern software tool using the Monte Carlo method. The output is the creation of a graphical management model in the form of an algorithm.
1. Introduction
Enterprise development is possible to be evaluated based on the financial analysis and poses a very significant part of the enterprise financial management. The evaluation of an enterprise’s financial situation is performed based on reached goals on one side (feedback principle) as well as, on the other side, it signalizes the relations between an assumed result of future decisions and the reality (principle of feedback forwards). To perform the process of evaluating the enterprise’s financial situation in reality as much as possible, it is also necessary to show and define the significant aspects of enterprise activities as complex as possible.
In current theory and practice, the professional public shows two forms of approach to enterprise management. The first one is the constructivism approach which mostly comes out of applying rational principles in management. This approach tends to solve problems based on analytical thinking with a focus on optimizing inputs and outputs, i.e., maximizing benefits from any entrepreneurial activity performed by the enterprise. The procedures applied within this approach come out of putting the effect of a smaller group (of managers) onto a bigger one (employees). The priority in this approach is a detailed plan that has exactly specified and measurable indicators that serve as the indicator of reaching goals. The other approach is the system-evolutionary approach. This approach is based on the assumption that every enterprise is a complex system, and it is impossible to describe and manage it in an exact way. The main goal of the system is to secure the viability and sustainability of the enterprise, which is also defined as the highest goal of the enterprise. The enterprise viability is possible to be reached based on early identification of threatening factors of the enterprise, signaling of changes, implementation of preventive and corrective measures, and creation of new possibilities for development. By suitably applying these tools, the enterprise itself secures its stability and prevents itself from the existence of imbalanced situations [1,2,3].
In order to reach these goals, it is needed to use financial models that arise from mathematical models. These are the main ones:
- simulations that serve to create assumed alternatives;
- optimation that helps to search for the most effective solution under defined conditions.
Innovations in financial management, together with their digitization, pose a challenge to the financial sector worldwide. The interest in innovation in financial management at the international level is growing dynamically. Changes and the development of new knowledge in financial planning serves the decision-making processes of companies [4]. Innovations bring with them new approaches by using new tools in the form of algorithms, matrices, and others, which enable the use of software technologies in finance [5]. Innovation in finance is a tool for improving the quality of life and socio-economic progress of businesses and increasing their efficiency, competitiveness, and effectiveness [6].
While solving the matter of enterprise financial management and investing, the priority is to carry out swift and effective solutions. The assumption for successful solutions is mostly enough information on risks and future progress of development. To predict and simulate future development is a demanding process that requires a systemic and professional approach. The given article provides a methodology for financial solution-making within which it comes to binding both models, i.e., it connects simulation models with those optimation ones.
The Slovak economy is currently marked by the COVID-19 pandemic, as are the economies of other countries. The pandemic has slowed economic growth and increased corporate indebtedness. Generally, currency crises are very expensive, and they can hinder economic growth. It is based on the idea that there is an elimination of exchange rate risk and currency crisis in the monetary union. This situation brought with it a negative development of the enterprise’s management associated with possible risks of insolvency [7]. The pandemic had a negative impact on all macroeconomic indicators in sectors of the national economy. In 2021, inflation, unemployment, and the consumer price index growth led to a reduction in the solvency of enterprises and an increase in enterprise dependence on loans provided to the banking sector. This fact has led to a change in the ratio of own and foreign sources of financing in enterprises, as well as to an increase in interest rates in the financial market [8,9].
2. Literature Review
2.1. Financial Management of Companies
The question of what the optimal financial structure of an enterprise should look like is the one that is currently dealt with by the majority of enterprises in a market environment. Current research shows that there are several approaches to defining the optimal financial structure of an enterprise. The most known approaches to defining the optimal financial structure of an enterprise are:
- The approach of applying the vertical rules of financing the enterprise is possibly placed among the simplest approaches to defining the optimal financial structure of an enterprise. The fundamental basis of this approach is to regulate the mutual ratio between the own and foreign assets of an enterprise. In general, the requirement applied in reality is that the amount of used foreign capital to finance the enterprise needs is close to the number of owned enterprise resources that the enterprise possesses. In the case of enterprises operating within the financial sector, the enterprise itself faces a higher entrepreneurial risk, which means that the value of foreign capital not overreaching half of the value of the owned capital of the enterprise is required.
- The other way of reaching the optimal financial structure of an enterprise is balancing the advantages that are based on constantly increasing foreign capital with marginal costs ensuing from financial difficulties being bound to the growth of this foreign capital.
- Professionals dealing with this problem worldwide also show even the so-called M-M model, which is based on the principle that the total market value of the enterprise and costs of its capital are independent of the financial structure of the enterprise [10,11]. Authors of this model come out of the opinion that all securities and their combinations are equally profitable in the perfect market. The market value of the enterprise based on this model is not dependent on the enterprise’s finances and structure but is influenced mostly by the development of total capital and the ratio of yields from this capital.
The practice has proved that, to secure enterprise sustainability, it is very important for enterprises to perform the decisions on optimal financial structure mostly based on assessing the factors that have a direct impact on the financial structure of the enterprise. With regard to the fact that the goal of every enterprise is to reach market growth and profit, it is possible to consider the growth of enterprise market value to be the most complex criterion for evaluating the optimal ratio of enterprise indebtedness [12,13,14].
However, current market conditions force the enterprises to react to the market situation by effective financing of innovation activities based on which the enterprise secures its market sustainability. Financing the current knowledge-based society leads to the creation of new tools for financing and securing the enterprise’s needs. Applying financial innovations in finances is the most dynamic factor in improving the quality of financial management [10].
Financial innovations have been recently connected with the agenda of financial engineering. In general, in financial theory, financial innovations are defined as “presenting new products resp. procedures to the market”. Another definition defines them as “applying known products and procedures in new combinations or areas of use” [15]. As a result, there is room to create new methodologies and procedures to secure enterprise sustainability.
Depending on the distribution of resources for financing the enterprise investment processes into the owned and foreign ones, there are several basic principles that directly influence the management’s decision-making on finances. The principles are possibly summed up into a few statements as follows:
- The costs ensuing from the usage of foreign resources of financing are, at last, lower than the costs ensuing from the joint-stock capital. The reason is the fact that the stockholders require a higher appreciation of financial means because of higher risk.
- If, for investment processes, the enterprise uses foreign resources, then the impact of these activities has a positive effect on the tax base of income tax. Given costs bound with the usage of foreign resources are transformable into lower tax duties which leads to savings related to the enterprise expenditures.
- The indebtedness growth causes that having reached a certain level, the total costs of foreign (debted) resources start to increase as a result of the existence of costs of financial emergency and higher risk, which leads to pressing the positive effect of the activity of foreign resources onto the capital structure of the enterprise. In this relation, even the total average costs of financial resources—capital is increased [16].
Having the increasing enterprise indebtedness in place, even the costs of debt as well as the costs of owned (joint-stock) capital increase. It ensues from the increase in the risk of increasing credit indebtedness. Based on these listed statements, it is obvious that the enterprise development plans focused on reaching financial sustainability are under the influence of the capital structure of enterprise finances. The literature defines cash flow as a “basic measure of a enterprise’s health”, which is defined as a cycle of increases and decreases in funds, the output of which is an assessment of the enterprise’s solvency [17,18]. The cash flow indicator indicates the enterprise’s liquidity and cash flow, giving information on the enterprise’s ability to realize full self-financing at positive available flows or at negative flows [10]. In practice, the value of cash flow is determined by two approaches. The first approach is the direct method, where cash flow is defined as the difference between the total value of all revenues (revenues for the reference period) and the total value of costs that are due in the reference period. The second approach is the indirect method, where the calculations are based on operating profit, which is adjusted for income and expense items that do not enter the movement of funds in the period [10]. The cash flow, modeled in this way, is suitable for the proposed framework methodology, mainly due to the dependence of profitability on the cash flow indicator. Unless the enterprise achieves a positive cash flow value in a given year and, at the same time, the projected value of the cumulative cash flow in the future, it cannot be profitable. Cash flow curves are highly sensitive to change in an enterprise’s investment conditions and can therefore act as an early warning system in the event of problems. In this way, it is possible to set the right scale or strategy.
Cash flow and current profit components have a significantly greater predictive power for future cash flows than several aggregate profit delays. The conclusions are resilient to alternative specifications, including cash flow control and industry membership.
However, research suggests that analysts’ cash flow forecasts are less accurate and more diffuse than profit forecasts [19].
For this reason, the proposed methodology is supplemented by another software tool based on the Monte Carlo method, which eliminates these inaccuracies.
Each enterprise has to take the management’s approach to managing the enterprise processes into account if it relies on the requirement for a complex approach within the process of defining goals of enterprise activities having in mind the fact that the enterprise is being looked at as the social–economic system.
2.2. Modern Methods in Financial Management
For effective financial management, it is important to choose an appropriate method for assessing performance and financial demands. Several authors are of the opinion that for modern methods, it is necessary to identify not one criterion for assessing financial performance but to use multicriteria tools and methods [20,21]. According to Hyranek et al. [22], each performance measurement and prediction model uses different mathematical tools and works with different indicators.
The issue of financial planning with investment financing is currently a current but neglected area. Rapid and dynamic development requires investment, and there is a very intense discussion among experts from academia and science on how to reduce risk in this segment. The consequences of incorrect decisions in the financial planning of investments lead to high damages, which have a negative impact not only on companies as such but on the entire business segment. The internship incorporates the possibilities of computer simulations into the decision-making process of companies in the field of financial management. Corporate finance and treasury management have achieved an intersection that becomes salient when planning the role of a treasurer in the dynamic career of treasury management for the near future. Digitization is changing all areas of economic and social life, as it covers several technologies that can be used for the optimization of existing processes and services as well as the creation of completely new system approaches. Some of these technologies are also applicable at different operating levels of the enterprise [23].
Many authors analyze and compare business indicators to the current time point, such as comparing the indicators Economic Value Added (EVA), Return on Equity (ROE), Return on Investment (ROI), Return on Assets (ROA), Return On Capital Employed (ROCE), Net Operating Profit after Taxes (NOPAT). However, these indicators are stochastic in nature and do not take into account the effect of time. For this reason, we have supplemented these indicators with deterministic values taking into account a time factor, such as the Net Present Value (NPV) [24].
The choice of an appropriate method can indicate the key risks that may affect the financial stability of the enterprise. Therefore, it is necessary to consider all the specifics when using modern methods [25]. One of the methods used is the Monte Carlo method.
Although the Monte Carlo method dates back to the 20th century, it is currently considered one of the most advanced methods today. The reason is its modification to current conditions and the usability of modern software tools, which leads to its wide applicability in various scientific disciplines. The Monte Carlo method is currently used in the field of physics and electrical engineering [26,27,28,29], chemistry [30,31], safety assessment [32], industry [33,34], public sector [35], economy [36,37,38,39], and others. We most often encounter the Monte Carlo method in simulations in economics, e.g., in option pricing, financial decision-making, etc. Numerical examples show that the use of the Monte Carlo method leads to a significant reduction in variance as well as a reduction in computational time [40,41]. For this reason, the Monte Carlo method was chosen even if the goals of our research were met. We focused on solving the issues of financial planning and investment decisions in terms of time. The use of the Monte Carlo method enabled us to apply the modern software tool Crystal Ball from Oracle for simulation purposes. At the same time, this method was integrated into the methodology we proposed in the form of a management algorithm.
3. Materials and Methods
The aim of the article is to create a methodology for analysis and assessment of modern methods within the process of investment and financial decision-making and modeling of financing of this investment in the environment of enterprises being active in the business segment. Based on the data used in decision-making processes in legislative and operational conditions in the business segment, it is necessary to define the model approach to identify the financial risks in investment processes and, thus, prevent possible entrepreneurial and economic risks in future period based on suitably proposed process steps. The outcome of this methodology is the elaboration of process procedure of evaluating resources for financing the investment activities of enterprises under the conditions in Slovakia. Based on this process, there is the elaborated frame methodology that comes out of the Monte Carlo software tool simulations. The given methodology also serves as the tool to minimize the already existing financial credit interest rate or investment risks and to identify the weak points within the area of enterprise financial structure based on which the enterprise acquires the advantage resulting in decreasing the impacts of arising or future crisis and threat.
The frame methodology works based on economic variables that pose basic inputs into simulation processes in each phase of identification and risk analysis. Individual variables are organized into an apparatus via mathematical relations and statistical-mathematical dependabilities. Based on the vast amount of data and creation of alternative investment decisions of the enterprise that the frame methodology provides, the interpretation of analyzed status is defined not only by mathematical characteristics and definitions but it is also transformed into possible alternative decisions enabling the enterprise management to select the proper investment strategy supported by a suitable form of financing. The methodology of the article is available in Figure 1.
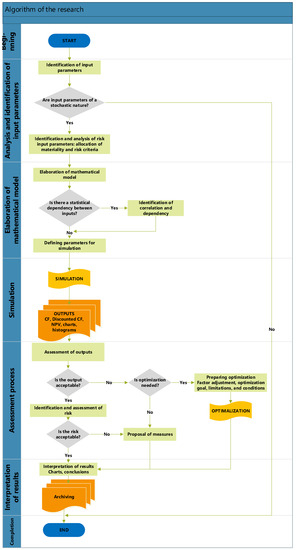
Figure 1.
Algorithm of process steps of research.
The practical verification of created methodology was realized via a case study that simulates three variants of investment decisions of the enterprise within the transportation segment of the territory in Slovakia. As for the simulation, two ways of applying the methodology were used:
- The deterministic way that comes out of mathematical calculations whereas only static economic magnitudes without respecting possible risk inputs are taken into account.
- The Stochastic way counts with a certain level of risk when calculating. For these needs, the applied Monte Carlo method uses the Crystal Ball software tool as the integrated part of MS Excel when calculating.
The mathematical apparatus of frame methodology to solve the financing of the enterprise investment activities presents the deterministic way of modeling the financing of the enterprise investment activities, which does not take risk factors into consideration during the modeling process. For its creation, it was needed to identify the input parameters. The mathematical apparatus works in two dimensions.
The first dimension is focused on modeling the credit risk. The basis for this modeling is the determination of the amount of investment that comes out of current recalculations and estimates according to current prices valid during the time of simulating of steps necessary for the investment realization. The important aspect of mathematical apparatus is defining the financing of the investment from the viewpoint of owned and foreign resources. Various settings of this part enable to simulate various financing of the investment and, at the same time, identify that part which is the most favorable for the enterprise.
The second dimension with which the frame methodology in the mathematical apparatus works is focused on the particular calculations posing the output values of mathematical apparatus and whole simulating process. The output value which is simulated within the frame methodology is the Net Present Value (NPV). This method is these days rated among the best methods for assessment and evaluation of investments that take discontinuity into account. NPV is possibly be defined as the sum of discounted net cash flows ensuing during the whole period of project existence, in other words, during the realization as well as operation of the project. Its value can be calculated by the formula [42]:
where:
CFi—net cash flow in i-year of project existence
i—selected year of project operation
n—last year of assumed project lifetime
r—selected discount rate in %/100
For its calculation, it is necessary to identify and calculate the following indicators: Cash flow (CF), cumulated cash flow, cash flow updated with discount future value interest factor, and cumulated updated cash flow. The basic relation for the operating CF calculation is:
This relation, however, does not inform the investors about the enterprise, its operations, or sources of finance. Therefore, it was needed to adjust this relation in a way that the net revenue is updated with changes in all cash-free accounts on balance-sheet, depreciation and amortization are added to the net income, whereas they are updated with changes in receivables and supplies. Finally, it comes to:
It was necessary to take the impact of time into account when elaborating the mathematical apparatus. The tool to incorporate the time into the mathematical calculations was the discontinuity principle, where the discount rate is possible to be understood as the expected yield of an alternative investment opportunity, on the other side, as the costing of sources used for financing the given investment which poses the minimum yield percentage the enterprise expects from the investment [42]. Mathematically, it is defined as the following:
where:
Ip—current value of investment required for future value to be reached
If—future value reached at certain value of update
i—interest rate (update)
The investment cost of transportation segment is characterized by the long-term character of investment decisions, and, as a result, it is necessary to identify the current and future value for more periods at the same time. Mathematically, it is expressed as follows [43,44]:
where:
n—number of periods
With respect to the fact that such methodology presents a demanding process, it was needed for it to integrate some other professional methods that are rated among the methods of economic assessment of risk factors in the enterprise. By using and interacting with these methods, the frame methodology has gained more precise outputs and adequate final value. The basic methods used within the frame methodology belong to sensitivity analysis, simulation, algorithm, and Monte Carlo method [45].
4. Monte Carlo Simulation Using Crystal Ball Software Tool
The Monte Carlo method (known under this name since 1949) is a statistical method whose substance is to use random numbers while simulating random variables. This method is used not only to solve mathematical but also, e.g., physical, social, and economic problems [46].
Under this method, it is understood the procedure which uses the sequencing of random numbers in calculations. Using this method, we can have an approximate solution for various variations of problem tasks. It is used for simulations that are typical for stochastic (random) characters and are defined by probability functions. It is also applied when solving deterministic problems where the function of the density of probability is used. Such an example might be the solution of integrals or a set of equations. In the case of deterministic tasks, the Monte Carlo method was carried out based on generating random numbers [47].
The first reference to the Monte Carlo method is usually the famous needle experiment by the French biologist Comte de Buffon [48]. He performed the experiment by repeatedly throwing the needle of the “L” length at a sheet of paper with stripes of the “d” width. During the experiment, there was the precondition that the width of stripes was larger than the needle length. He assumed during the experiment that the needle would fall down in a way it crosses two stripes. He also calculated the probability, which he defined by the relation (6). His calculation was later on used by Laplace, who derived the relation for the “π” calculation in 1886 [47,49].
where:
p—probability of cutting two stripes
L—length of needle
d—width of stripes
The name itself was given to the Monte Carlo method by the end of World War II when a team of the Manhattan Project named it after the center of hazardous games, i.e., the town of Monte Carlo. The motivation was the similarity with the randomness of hazardous games. Presently, the Monte Carlo method is used while solving complex problems of multidimensional nature.
The substance of the Monte Carlo simulation is to generate a huge amount of scenarios (hundreds up to thousands) and to recalculate values of criteria for each scenario.
The Monte Carlo simulation can be divided into several steps that create [45]:
- The creation of the mathematical model of risk analysis and its elaboration in an available software tool. In the case of the article, the mathematical model is elaborated in MS Excel with the support of the Crystal Ball software tool integrated into this program. Crystal Ball poses the program add-in of this program. Because of the given issue, this model has a form of cash flows and net present value NPV and relations to calculate the indicators of investment projects.
- The determination of key risk factors comprises the identification of those input magnitudes that significantly influence the uncertainty of simulation output in the form of financial indicators. Among these factors will be those that are considerably uncertain and, if changed, those in which the simulation outputs are subject to high sensitivity. To select these key risk factors, the sensitivity analysis described in previous chapters of this article is used.
- Another step is to determine the distribution of the probability of key risk factors. In the case of discreet risk factors, this probability distribution is in a chart form; in the case of lined risk factors, the distribution type is chosen, and its parameters are entered. It is possible to enter the uncertainty for lined risk factors via the Crystal Ball tool based on the probability distribution. In general, the determination of these distributions is demanding. If historical data of a certain factor exists, then it is possible to use these data in order to determine the distribution via the approximation. Should this not be the case, then, when determining, the knowledge and experts’ experience from the relevant segment is taken into account.
- The next step is the determination of the statistical dependence of risk factors. It is important to respect larger and smaller dependences and to generate them for individual factors independently. In case there is statistical dependence between input variables of the mathematical apparatus, i.e., if one input magnitude’s change causes some change of other magnitudes’ value, it is necessary to define such dependence via the correlation matrix.
- The process of the simulation by starting the Crystal Ball software tool.
The simulation using the Monte Carlo method is a useful tool within the risk analysis process. Via this method, the quality of significant decisions under the conditions of risk and uncertainty in various areas of management is increased. One of the greatest advantages of this method is the fact that it forces managers’ responses to other subjects by analyzing and evaluating certain factors, to think profoundly, and to analyze these factors from the viewpoint of individual risk factors. Thus, it leads to a more profound knowledge of the risk side of objects and factors and to better decision-making, mostly in the case of investment projects.
The proposed frame methodology elaborated with the aim to identify and evaluate risks connected with financing of investment activities of enterprises is built on fundamental economic characteristics of the analyzed type of enterprise. The frame methodology concerns all specific factors and processes of these enterprises. All conditions applied and used within the frame methodology are based on the principles valid in Slovakia.
5. Results
When elaborating the methodology, even the outputs of this methodology equally consist of two variants. The outputs of mathematical apparatus, preferably using the MS Excel environment, are displayed via column and line graphs. These graphs reflect the time and provide investors with information on the return of investments and on the future value of CF during simulated years. The graphical example is shown in Figure 2.
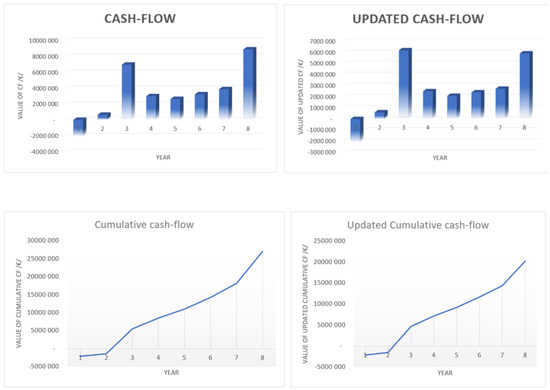
Figure 2.
Example of graphical outputs of mathematical apparatus.
The output of the Monte Carlo simulation is a series of graphs that enable the user to select any graphical display for interpretation. In each graph, the Crystal Ball program environment enables the setting of any statistical indicators, which are integrated into the graphs. At the same time, it enables the creation of histograms and line histograms.
The first outputs of the Monte Carlo simulation are diagrams of assumptions that display the probability and frequency of incidence of the simulated variable. Diagrams are divided based on assigned distribution functions within the preparation process of the Monte Carlo simulation.
By applying the input data of the simulation, we gather the assumed outputs at the selected distribution function via histograms. An example is shown in Figure 3.
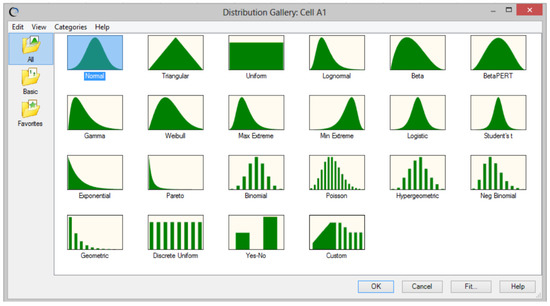
Figure 3.
Selected assumptions from Monte Carlo simulation.
The primary result of the Monte Carlo simulation is a histogram of numerousnesses of criteria magnitude and its automatic recalculation—scaling in probability distribution (right and left axis of the graph). The histogram of NPV is shown in Figure 4.
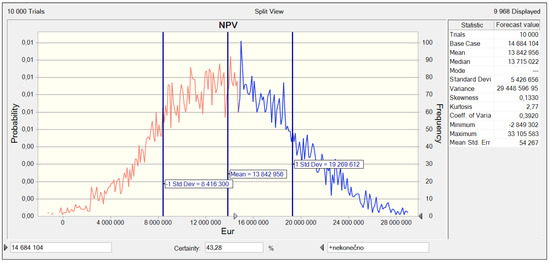
Figure 4.
Probable distribution of NPV.
As the simulation provides the whole probability distribution for the criteria magnitude of NPV, it is possible to calculate even lots of statistical data from the simulation. From the viewpoint of risk analysis, the main meaning of histogram is the overall view of possible values of simulated magnitude and its numerousness and probability. Based on the graph, it is possible to see the middle value of simulation, i.e., the middle value in a practical study at the enterprise is, according to the simulation, worth EUR 13,842,956, which is EUR 841,148 less than the value of the most probable scenario. The projected loss (Minimum) in this version of simulation realization reaches the highest value of EUR 2,849,302, and profit (Maximum) reaches the highest value of EUR 33,105,583. The probability distribution of NPV is approximately symmetrical; the graph displays little skewness (Skewness) worth 0.1330, which comprises moderate skewness to the right direction, i.e., towards higher values of NPV, which is also visible from the probability distribution graph in the left part of Figure 4. The distribution of kurtosis (Kurtosis) is of a value of 2.77, which means that this kurtosis reflects the normal distribution (that one is of kurtosis 3). As seen in the graph, the probability (Certainty) that NPV reaches a lower value than the deterministically calculated value within the mathematical apparatus is worth EUR 14,684,104, which is 43%. Or analogically said, NPV reaches a higher value than the deterministically calculated value within the mathematical apparatus, which is probable for 57%. The standard deviation shows how different typical cases within the array of evaluated numbers are; in other words, how much the values are distributed or deviated from the average of evaluated values. The standard deviation (Standard Deviation) ensuing from the graph is worth EUR 5,426,656 in both directions from the middle value. The variation coefficient is of interest as well as it measures the portion of the middle value of the criteria magnitude of NPV at its standard deviation and, thus, somewhat “yield” falling on the unit of risk. The variance (Variance) is a rate of variability, large-scale of some measured values. The greater the variance is, the more the values deviate from the average. The program enables various graphical displays of outputs; the basic ones are shown in Figure 5.
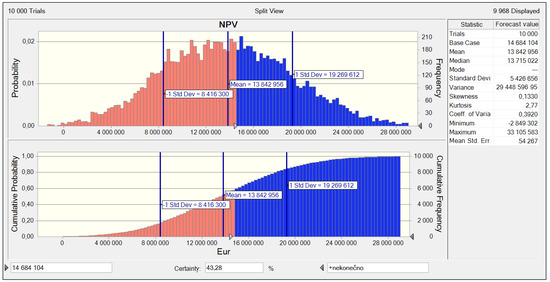
Figure 5.
Normal and cumulative distribution of probability of NPV.
Having the simulation performed and results gathered, it was necessary to interpret and evaluate individual outputs. The methodology creates a place for the implementation of several versions of simulations. As for solution-making of financing the investment activities of the enterprise, we needed to interpret the outputs in all three versions of performed simulations. The outputs interpretation is carried out based on comparativeness. The Crystal Ball software tool provides an option to create comparative graphs to be compared. The comparative outputs for three versions of simulations are displayed in Figure 6, where the outputs of the first version are colored in blue, the outputs of the second version are colored in red, and the outputs of version three are green.
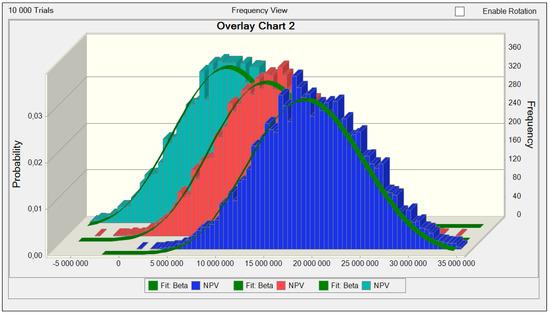
Figure 6.
Comparatory graph of NPV with ideal distribution display.
In order to be capable of using the rule of middle value and variance when selecting the risk versions, it was necessary to elaborate the comparison of statistical data out of individual versions of the criteria value of NPV.
According to the rule of decision-making on versions of the investment activities in the form of the rule of middle value and variance, version one is the most profitable based on data displayed in Table 1. In this version, the middle value of NPV is the highest compared to other versions of NPV.

Table 1.
Example of comparing statistical data of individual versions of criteria value of NPV.
In case the enterprise decides to take even the probability of reaching a lower value of NPV than the deterministically calculated value of NPV into consideration when decision-making, it is necessary to perform the comparing of this indicator (Table 2) as well.
Table 2.
Example of comparing of probability of reaching NPV in individual versions.
Based on the given data, version one is more profitable than other versions of financing the investment.
The aim of the methodology was to integrate modern methods of enterprise decision-making processes. For simpler added value, overview and readiness, the methodology is added with an algorithm that in itself integrates all process steps from the managerial apparatus to the Monte Carlo simulation outputs. Such a complex algorithm presents a detailed manual of the proposed methodology for the realization of investment and financial decisions applied in the transportation enterprise. The graphical display is in Figure 7.
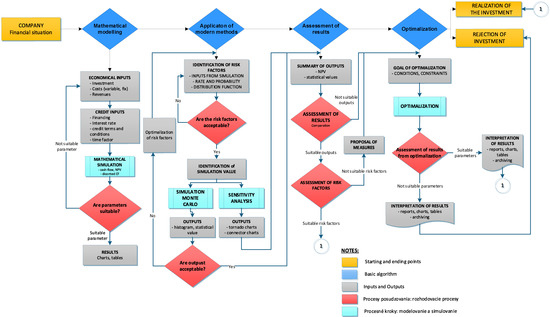
Figure 7.
Algorithm of proposed methodology.
The benefit of such a display of the methodology is its flexibility when applying minor modifications and mathematical relations as well, and it is possible to gain an algorithm applicable to any enterprise, even in other segments that can be used by the top management as the tool for decision-making processes on investments and financial operations.
Figure 7 shows the four basic process steps for assessing an investment. In the first step, it is necessary to develop a mathematical apparatus that is based on traditional economic indicators and their calculations (cash flow calculation, interest rate modeling, modeling of the share of owned and external resources, and discounting the values of indicators). For the purposes of these calculations, it is necessary to use the available economic reports of the enterprise and use traditional software tools (MS Excel). The output of this step is static graphs.
The second step is the application of new software tools that allow the monitoring of dynamic variables and take into account the time factor. The methodology is an application of the Monte Carlo method. The outputs from the first step represent the parameter entering the Monte Carlo simulation. The second method is sensitivity analysis, which evaluates the output variable based on the change in the input parameter. Modern software tools (Crystal Ball, @RISK) are used in this step. If the outputs from the simulation are not acceptable for the investment decision, it is necessary to go back and set a new input parameter to the simulation.
In the third step, the methodology assesses the outputs of the previous two steps. In case of acceptable output, the investment will be accepted. In case of unfavorable output, it is possible to optimize the investment in the next step.
The fourth step of the methodology assesses the outputs of the optimization. Based on their evaluation, the investment is accepted or rejected.
The proposed methodology is based on research of conditions in companies in Slovakia and fills the gap in insufficient and inefficient financial decision-making of managers. For this reason, the methodology is highly topical and important, especially in the current period, when it is necessary to reconsider and consider ways to conduct appropriate and effective investment and financial policy in the corporate constraints of the global COVID pandemic but also any corporate crisis.
6. Discussion and Conclusions
The elaborated frame methodology focused on solution-making of financing the investment activities within the transportation enterprises where simulations and calculations in the MS Excel software environment were chosen as the tool to fulfill this goal. The simulation tool used was the Crystal Ball simulation software, which is an integral part of MS Excel and is based on the Monte Carlo method. The methodology integrates two approaches for analyzing and evaluating the financial approaches to investments. On the one hand, the methodology provides a deterministic view of the evaluation of a given issue while using the mathematical apparatus via the mathematical relations and correlations in the MS Excel chart environment.
The other methodology approach lies in the stochastic approach in the form of simulation using the Monte Carlo method that is based on modeling in more versions of approaches towards investment financing. Individual steps of the frame methodology are, except for the theoretical and mathematical procedure, added with algorithms that pose the added value and enable a simpler understanding of the issue being solved. The simulation comes out of modeling the criteria value of NPV in the future while taking the risk factors defined as the distribution functions of input variables into consideration. The proposed methodology integrates modern methods and is unique in Slovakia. Such a methodology has not yet been created in Slovakia. Its uniqueness lies in the integration of various multicriteria approaches. At the same time, the methodology would serve as a support tool for business decision-making processes. Its verifiability will be realized in the years 2022–2024 in the VEGA project.
The issue of financial planning with a focus on investment financing within the business segment is highly up-to-date. With regard to fast and dynamic development during the last decades, the business segment is marked as demanding investment, and among the professionals in academic and science areas, it is very intensively discussed the question of how to mitigate the risks in this segment. The consequences of wrong decisions in the financial planning of the investments lead to high damages that have a negative impact not only on the enterprises as such but on the whole business segment.
The methodology integrates the options of computer simulations into the decision-making process of the enterprises within the business segment. Despite the benefits that the computer simulations do have, it is needed to point at possible threats ensuing from using them, too. Neither knowledge and management of the software environment nor adherence to progressiveness do have to guarantee the quality of the output. The base for the effective operation of simulations is the proper definition of distribution functions of input variables, properly elaborated mathematical apparatus with correlations and dependences among variables, and proper selection of criteria value that is about to be evaluated by the simulation. The source of information for these steps is the results of expert estimates and detailed analyses of numerous data.
Although the frame methodology presents only a simpler model to solve the issue of financing the investment activities of the enterprises, its usage in practice is much broader than the given article states. It is the development within the business segment and computer technologies segment that creates the prerequisites to extend the application usage of software tools for the simulation in risk management.
The article is focused on solving the question of financing the investment activities of the enterprises. The text is devoted to the application of modern methods into the process of financial planning of investments in enterprises. The primary goal was to elaborate the frame methodology, which would evaluate the risks tied with financing the investment activities of the enterprises using modern methods. In order to solve this question, the simulation using the Monte Carlo method was applied.
Author Contributions
Conceptualization, A.T., A.S. and R.R.; methodology, A.T. and A.S.; software, A.T. and R.R.; validation, R.R.; formal analysis, A.T. and A.S.; investigation, A.T., A.S. and R.R.; resources, A.T., A.S. and R.R.; data curation, A.T., A.S. and R.R.; writing—original draft preparation, A.T., A.S. and R.R.; writing—review and editing, A.T., A.S. and R.R.; visualization, A.T.; supervision, R.R.; project administration, A.T.; funding acquisition, A.T. and R.R. All authors have read and agreed to the published version of the manuscript.
Funding
This research was funded by project VEGA, grant number 1/0770/22.
Institutional Review Board Statement
Not applicable.
Informed Consent Statement
Not applicable.
Data Availability Statement
Not applicable.
Conflicts of Interest
The authors declare no conflict of interest.
References
- Fabianova, J.; Kacmary, P.; Janekova, J. Operative production planning utilising quantitative forecasting and Monte Carlo simulations. Open Eng. 2019, 9, 613–622. [Google Scholar] [CrossRef]
- Janošková, M.; Csikósová, A.; Čulková, K. Fiscal Reforms and National Competitiveness (the Case Study of Slovakia). EUrASEANs J. Glob. Socio-Econ. Dyn. 2017, 6, 58–68. [Google Scholar] [CrossRef]
- Gavurova, B.; Kelemen, M.; Polishchuk, V. Expert model of risk assessment for the selected components of smart city concept: From safe time to pandemics as COVID-19. Socio-Econ. Plan. Sci. 2022, 82, 101253. [Google Scholar] [CrossRef] [PubMed]
- Abad-Segura, E.; González-Zamar, M.-D.; López-Meneses, E.; Vázquez-Cano, E. Financial Technology: Review of Trends, Approaches and Management. Mathematics 2020, 8, 951. [Google Scholar] [CrossRef]
- Feng, Z. Financial risks from three dimensions and risk identification model of enterprise. Int. J. Manag. Sci. Eng. Manag. 2013, 6, 71–80. [Google Scholar] [CrossRef]
- Hinson, R.; Lensink, R.; Mueller, A. Transforming agribusiness in developing countries: SDGs and the role of FinTech. Curr. Opin. Environ. Sustain. 2019, 41, 1–9. [Google Scholar] [CrossRef]
- Kulhánek, L.; Dvoroková, K. Real Convergence in the European Union: An Empirical Analysis. Modeling Economic and Social Behavior; Nova Science Publishers: Hauppauge, NY, USA, 2020; pp. 151–183. [Google Scholar]
- Morvay, K.F.-K. Economic Development of Slovakia in 2020; Institute of Economic Research of Slovak Academy of Sciences: Bratislava, Slovakia, 2021; ISBN 978-80-7144-326-1. Available online: https://ekonom.sav.sk/uploads/journals/411_hv_2020_anglicka_verzia_sr-final.pdf (accessed on 25 April 2022).
- Kelemen, M.; Polishchuk, V.; Gavurová, B.; Rozenberg, R.; Bartok, J.; Gaál, L.; Gera, M.; Kelemen, M., Jr. Model of Evaluation and Selection of Expert Group Members for Smart Cities, Green Transportation and Mobility: From Safe Times to Pandemic Times. Mathematics 2021, 9, 1287. [Google Scholar] [CrossRef]
- Kassay, Š. Riadenie: Finančné Riadenie Podniku; Šiesta Časť; Veda, Vydavateľstvo Slovenskej Akadémie Vied: Bratislava, Slovakia, 2015; p. 186. [Google Scholar]
- Modigliani, F.M.M. The cost of Capital, Corparation Finance and the Theory of Investment. Am. Econ. Rev. 1958, 48, 261–297. [Google Scholar]
- Kráľovič, J. Financial Management; IURA Edition: Bratislava, Slovakia, 2002; p. 118. [Google Scholar]
- Kráľovič, J. Financial Management, 3rd ed.; IURA Edition: Bratislava, Slovakia, 2011; p. 468. [Google Scholar]
- Vlachynský, K. Finance of Enterprise, 5th ed.; IURA Edition: Bratislava, Slovakia, 2006. [Google Scholar]
- Schneider, D.G.K. Finanzinnovationen; Verlag C.E.Poeschel: Stuttgart, Germany, 1989. [Google Scholar]
- Csikosova, A.; Culkova, K.; Weiss, E.; Janoskova, M. Evaluation of Market with Accommodation Facilities Considering Risk Influence—Case Study Slovakia. J. Risk Financ. Manag. 2021, 14, 208. [Google Scholar] [CrossRef]
- Hwee, N.G.; Tiong, L.K. Model on cash flow forecasting and risk analysis for contracting firms. Int. J. Proj. Manag. 2001, 20, 351–363. [Google Scholar] [CrossRef]
- Turner, J. Project Management: Future Development for the Short and Medium Term. Int. J. Proj. Manag. 1994, 12, 3–4. [Google Scholar] [CrossRef]
- Yoo, C.Y.; Pae, J. Estimation and Prediction Tests of Cash Flow Forecast Accuracy. J. Forecast. 2013, 32, 215–225. [Google Scholar] [CrossRef]
- Vochozka, M.; Rowland, Z.; Vrbka, J. Financial analysis of an average transport company in the Czech Republic. Our Sea 2016, 63, 227–236. [Google Scholar] [CrossRef]
- Onuferová, E.; Čabinová, V.; Dzurov Vargová, T. Analysis of modern methods for increasing and managing the financial prosperity of businesses in the context of performance: A case study of the tourism sector in Slovakia. Oecon. Copernic. 2020, 11, 95–116. [Google Scholar] [CrossRef] [Green Version]
- Hyranek, E.; Grell, M.; Nagy, L.; Durinova, I. The economic-mathematical nature of the HGN model concept as a tool for measuring per-formance of enterprises. J. Econ. 2018, 66, 309–325. [Google Scholar]
- Polak, P.; Masquelier, F.; Michalski, G. Towards treasury 4.0/The evolving role of corporate treasury management for 2020. Management 2018, 23, 189–197. [Google Scholar] [CrossRef] [Green Version]
- Blendinger, G.; Michalski, G. Value add financial measures used by German DAX30 Corporations as part of highly professionalized corporate governance management. Rev. Innov. Compet. 2018, 4, 73–98. [Google Scholar] [CrossRef]
- Kozena, M.; Jelinkova, L. Specifics of performance measurement and management manufacturing company. In Proceedings of the SGEM 2014 Conference on Political Sciences, Law, Finance, Economics and Tourism, Albena, Bulgaria, 17–26 June 2014; Volume 2. [Google Scholar] [CrossRef]
- Di Nitto, A.; Davide, F.; Vardaci, E.; Bianco, D.; La Rana, G.; Mercogliano, D. The New Physics in LILITA_N21: An Improved Description of the Reaction 190 MeV 40 Ar + 27Al. Appl. Sci. 2022, 12, 4107. [Google Scholar] [CrossRef]
- Loffredo, F.; Vardaci, E.; Bianco, D.; Di Nitto, A.; Quarto, M. Protons Interaction with Nomex Target: Secondary Radiation from a Monte Carlo Simulation with Geant4. Appl. Sci. 2022, 12, 2643. [Google Scholar] [CrossRef]
- Yang, Y.; Zhuo, W.; Zhao, Y.; Xie, T.; Wang, C.; Liu, H. Estimating Specific Patient Organ Dose for Chest CT Examinations with Monte Carlo Method. Appl. Sci. 2021, 11, 8961. [Google Scholar] [CrossRef]
- Kaiser, W.; Popp, J.; Rinderle, M.; Albes, T.; Gagliardi, A. Generalized Kinetic Monte Carlo Framework for Organic Electronics. Algorithms 2018, 11, 37. [Google Scholar] [CrossRef] [Green Version]
- Radosz, W.; Pawlik, G.; Mituś, A.C. Characterization of Monte Carlo Dynamic/Kinetic Properties of Local Structure in Bond Fluctuation Model of Polymer System. Materials 2021, 14, 4962. [Google Scholar] [CrossRef] [PubMed]
- Pawlik, G.; Mitus, A.C. Photoinduced Mass Transport in Azo-Polymers in 2D: Monte Carlo Study of Polarization Effects. Materials 2020, 13, 4724. [Google Scholar] [CrossRef] [PubMed]
- Lu, Z.; Zhuang, L.; Dong, L.; Liang, X. Model-Based Safety Analysis for the Fly-by-Wire System by Using Monte Carlo Simulation. Processes 2020, 8, 90. [Google Scholar] [CrossRef] [Green Version]
- Koroteev, M.; Romanova, E.; Korovin, D.; Shevtsov, V.; Feklin, V.; Nikitin, P.; Makrushin, S.; Bublikov, K.V. Optimization of Food Industry Production Using the Monte Carlo Simulation Method: A Case Study of a Meat Processing Plant. Informatics 2022, 9, 5. [Google Scholar] [CrossRef]
- Jones, H.G.; Lee, A.M. Monte Carlo Methods in Heavy Industry. J. Oper. Res. Soc. 1995, 6, 108–116. [Google Scholar] [CrossRef]
- Foa, R.; Howard, M. Use of Monte Carlo Simulation for the Public Sector: An Evidence-Based Approach to Scenario Planning. Int. J. Mark. Res. 2006, 48, 27–48. [Google Scholar] [CrossRef]
- Züst, S.; Huonder, M.; West, S.; Stoll, O. Life-Cycle Oriented Risk Assessment Using a Monte Carlo Simulation. Appl. Sci. 2022, 12, 8. [Google Scholar] [CrossRef]
- Zhang, Y. The value of Monte Carlo model-based variance reduction technology in the pricing of financial derivatives. PLoS ONE 2020, 15, e0229737. [Google Scholar] [CrossRef]
- Mucha, V.; Páleš, M.; Sakálová, K. Calculation of the Capital Requirement Using the Monte Carlo Simulation for Non-life Insurance. Ekon. Čas. J. Econ. 2016, 64, 878–893, ISSN 0013-3035. [Google Scholar]
- Arenas, D.J.; Lett, E.; Klusaritz, H.; Teitelman, A.M. A Monte Carlo simulation approach for estimating the health and economic impact of interventions provided at a student-run clinic. PLoS ONE 2017, 12, e0189718. [Google Scholar] [CrossRef] [PubMed] [Green Version]
- Ross, S.M.; Ghamami, S. Efficient Monte Carlo Barrier Option Pricing When the Underly-ing Security Price Follows a Jump-Diffusion Process. J. Deriv. 2010, 17, 45–52. [Google Scholar] [CrossRef]
- Fleming, P.J.; Schaeffer, D.; Simon, B. Efficient Monte-Carlo simulation of a product-form model for a cellular system with dynamic resource sharing. ACM Trans. Model. Comput. Simul. 1995, 5, 3–21. [Google Scholar] [CrossRef]
- Kassay, Š. Riadenie: Investičná Stratégia a Investičné Projekty; Ôsma Časť; VEDA, Vydavateľstvo Slovenskej Akadémie Vied: Bratislava, Slovakia, 2015. [Google Scholar]
- Rybár, P.; Cehlár, M.; Tréger, M. Oceňovanie Ložísk Nerastných Surovín; Štroffek: Košice, Slovakia, 2000. [Google Scholar]
- Cipra, I. Finanční a Pojistné Vzorce; Grada Publishing: Bratislava, Slovakia, 2006. [Google Scholar]
- Hnilica, J. Aplikovaná Analýza Rizika ve Finančním Managementu a Investičním Rozhodávání; Grada Publishing: Praha, Czech Republic, 2009; p. 262. [Google Scholar]
- Mateides, A. Manažérstvo Kvality: História, Koncepty, Metódy; Epos: Ruzomberok, Slovakia, 2006; p. 752. [Google Scholar]
- Kolková, M. Metóda Monte Carlo na Hodine matematiky. In IM Preprint, Series A; Faculty of Science Institute of Mathematics: Kosice, Slovakia, 2009. [Google Scholar]
- Marek, P. Probalistic Assessment of Structures Using Monte Carlo Simulation; Background, Exercises and Software; Institute of Theoretical and Applied Mechanics Academy of Sciences of the Czech Republic: Prague, Czech Republic, 2001. [Google Scholar]
- Reiter, D. The Monte Carlo Method, an Introduction. In Computational Many-Particle Physics; Springer: Cham, Switzerland, 2007; pp. 63–78. [Google Scholar]
Publisher’s Note: MDPI stays neutral with regard to jurisdictional claims in published maps and institutional affiliations. |
© 2022 by the authors. Licensee MDPI, Basel, Switzerland. This article is an open access article distributed under the terms and conditions of the Creative Commons Attribution (CC BY) license (https://creativecommons.org/licenses/by/4.0/).