The Spatial Spillover Effects of Environmental Regulation and Regional Energy Efficiency and Their Interactions under Local Government Competition in China
Abstract
:1. Introduction
2. Literature Review
3. Mechanism Analysis on Environmental Regulation and Energy Efficiency
4. Data and Measures
4.1. Data Sources
4.2. Estimation of Regional Energy Efficiency in China
5. Empirical Models
6. Empirical Results and Discussion
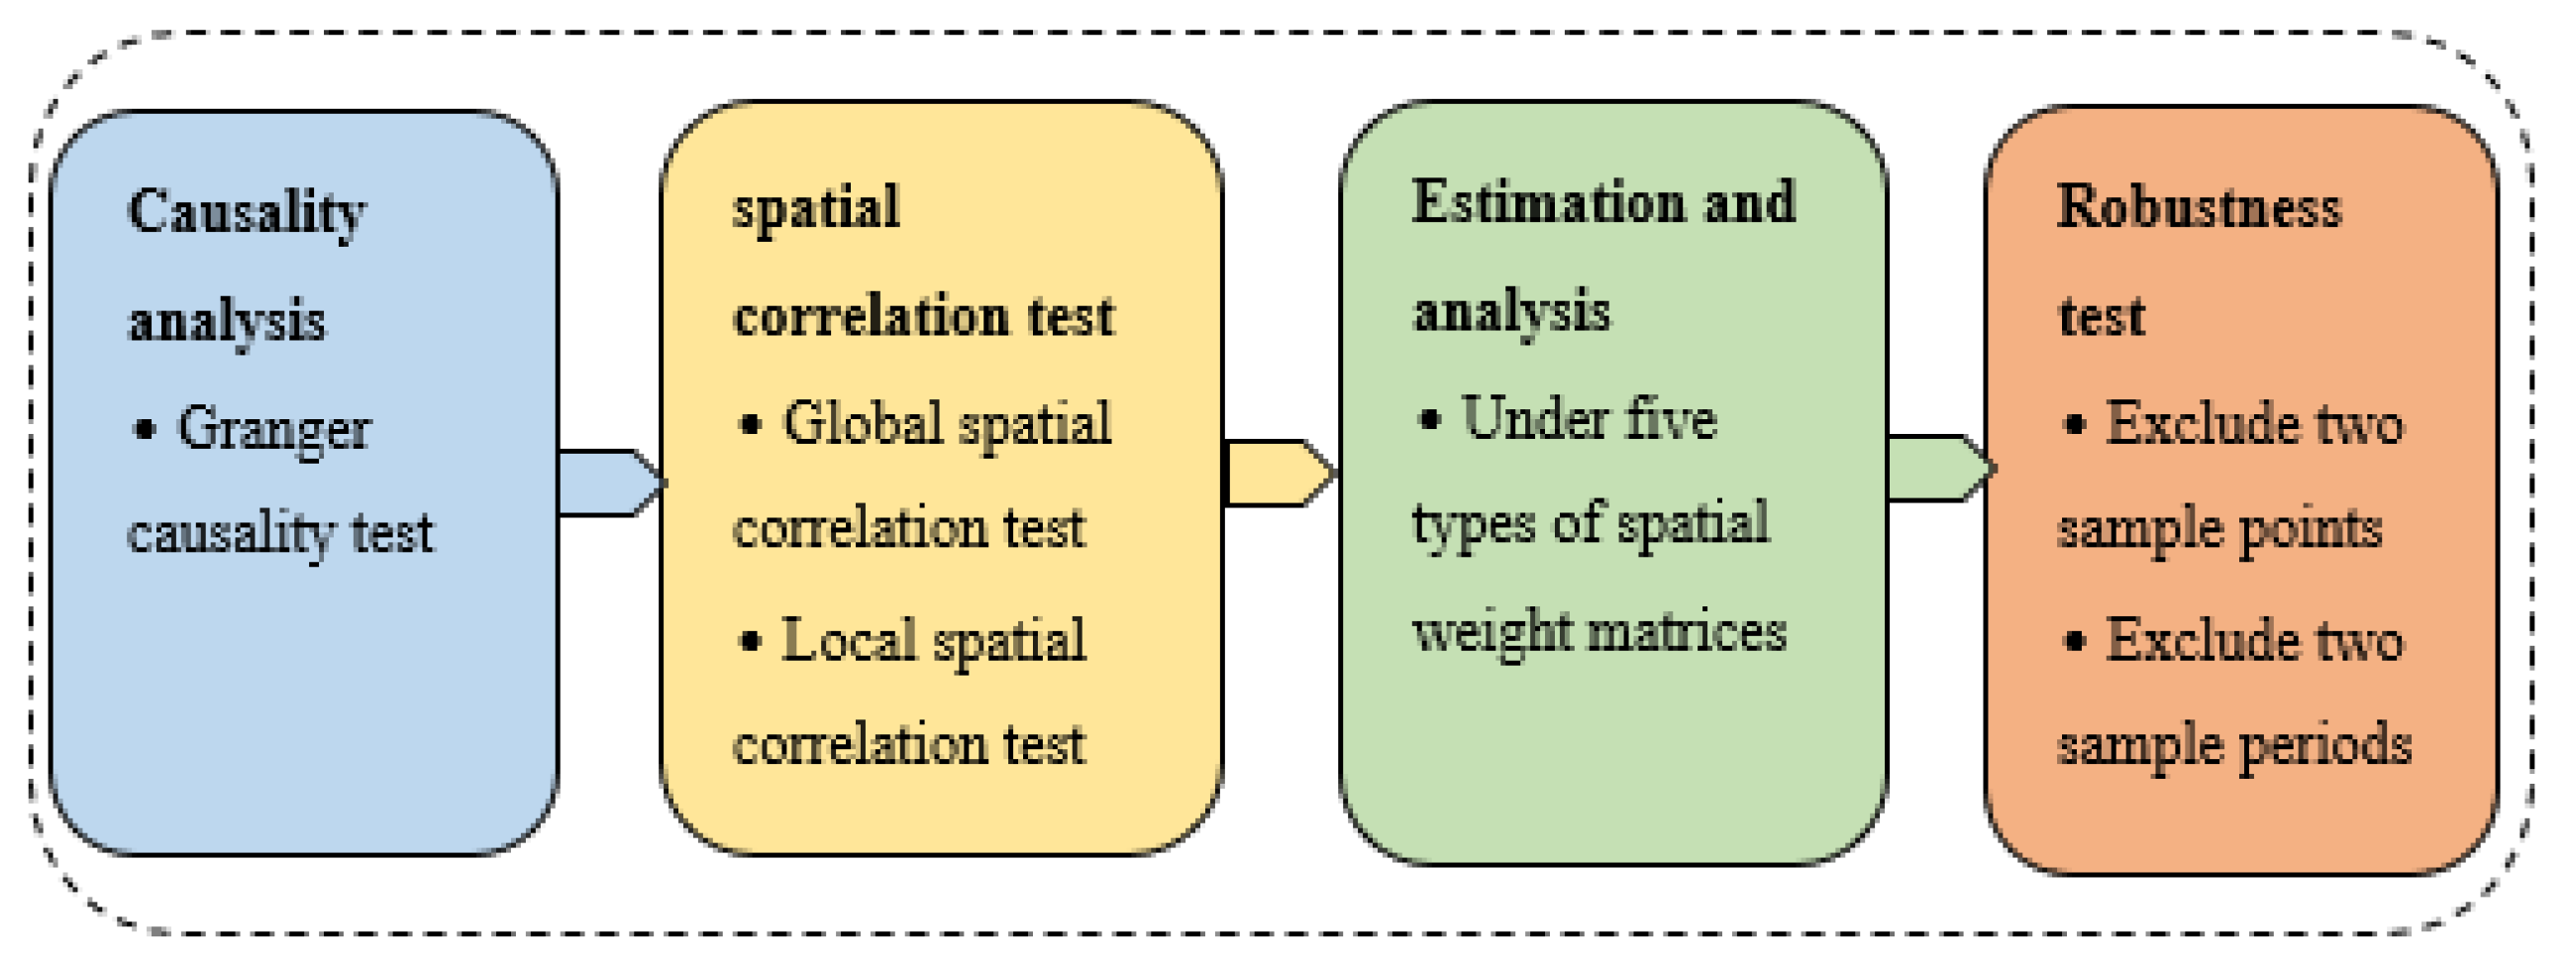
6.1. Causality Analysis
6.2. Global Spatial Correlation Test
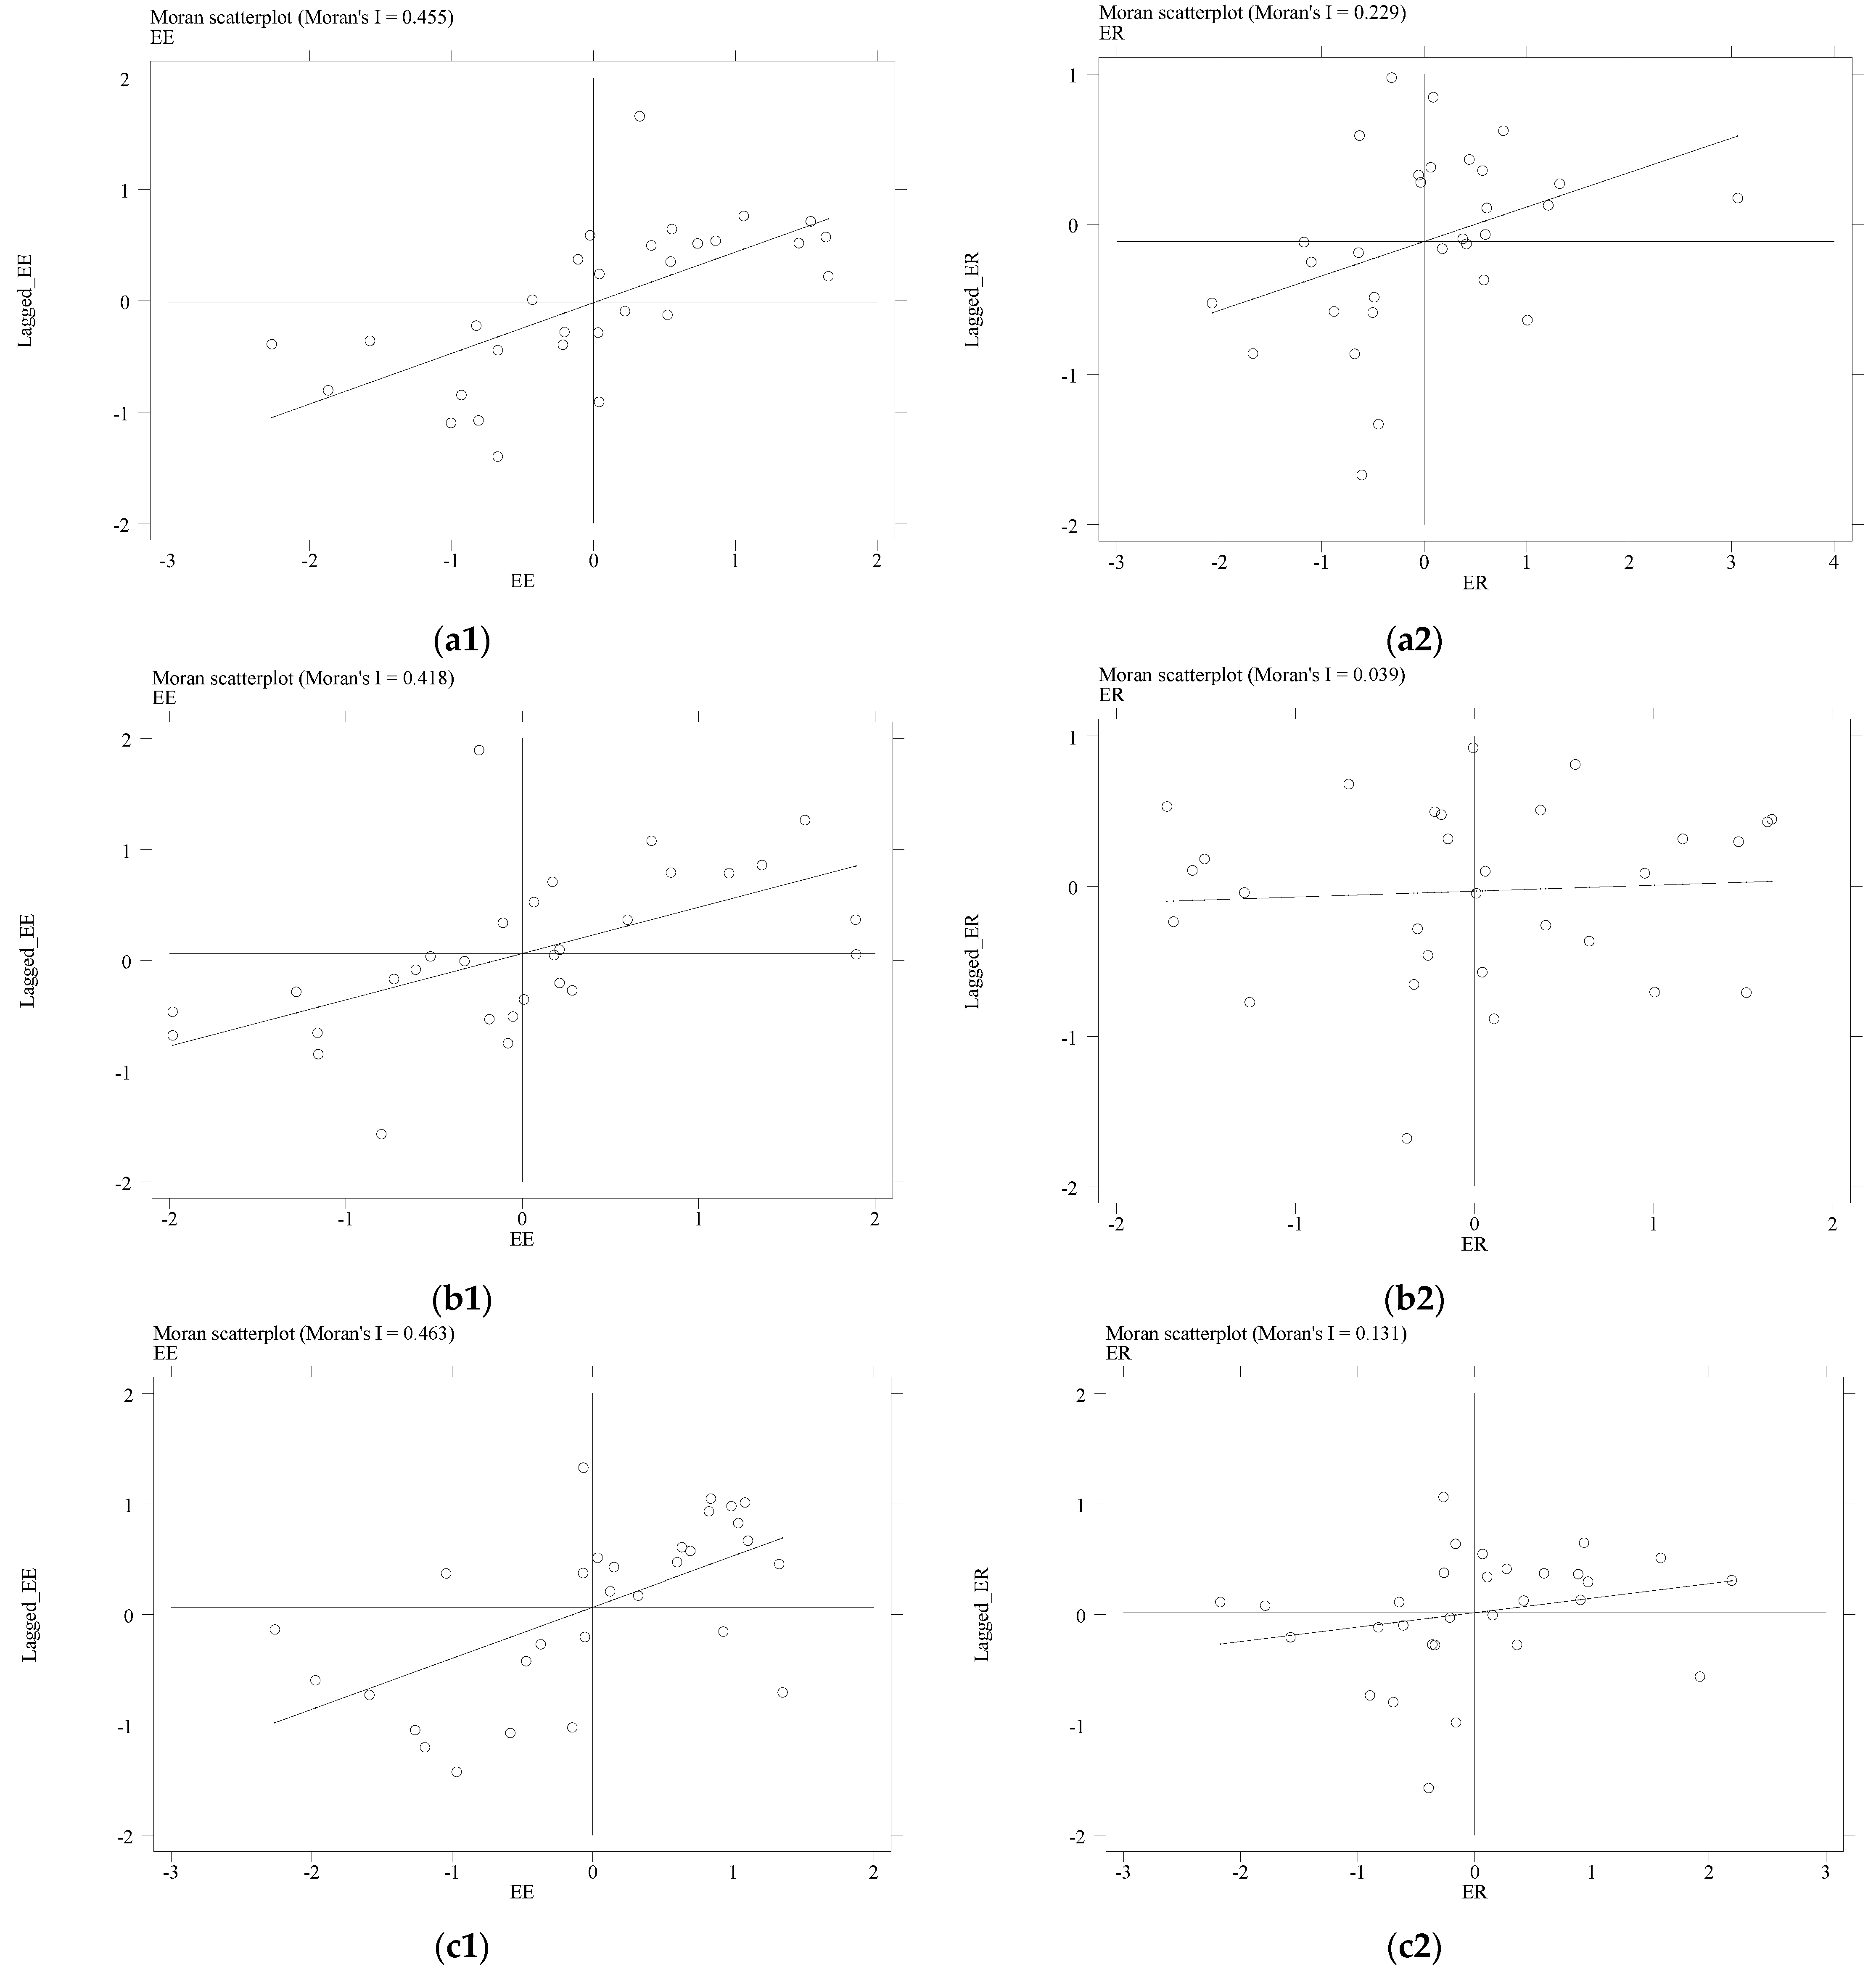
6.3. Local Spatial Correlation Test
6.4. Estimation Results and Analysis
6.5. Robustness Test
6.6. Discussion
7. Conclusions and Policy Recommendations
7.1. Conclusions
7.2. Managerial Implication
7.3. Limitations and Prospects
Author Contributions
Funding
Institutional Review Board Statement
Informed Consent Statement
Data Availability Statement
Conflicts of Interest
References
- Rehman, A.; Ma, H.; Ozturk, I.; Murshed, M.; Dagar, V. The dynamic impacts of CO2 emissions from different sources on Pakistan’s economic progress: A roadmap to sustainable development. Environ. Dev. Sustain. 2021, 23, 17857–17880. [Google Scholar] [CrossRef]
- Davis, S.J.; Caldeira, K.; Matthews, H.D. Future CO2 Emissions and Climate Change from Existing Energy Infrastructure. Science 2010, 329, 1330–1333. [Google Scholar] [CrossRef] [Green Version]
- Alvarado, R.; Ortiz, C.; Jiménez, N.; Ochoa-Jiménez, D.; Tillaguango, B. Ecological footprint, air quality and research and development: The role of agriculture and international trade. J. Clean. Prod. 2021, 288, 125589. [Google Scholar] [CrossRef]
- Ortiz, C.; Sarrias, M. Estimating the non-pecuniary benefit of engaging in pro-environmental behaviors: Incorporating both heterogeneous preferences and income endogeneity. J. Environ. Manag. 2022, 302, 114040. [Google Scholar] [CrossRef]
- Irfan, M.; Elavarasan, R.M.; Ahmad, M.; Mohsin, M.; Dagar, V.; Hao, Y. Prioritizing and overcoming biomass energy barriers: Application of AHP and G-TOPSIS approaches. Technol. Forecast. Soc. Chang. 2022, 177, 121524. [Google Scholar] [CrossRef]
- Li, H.; Zhang, J.; Wang, C.; Wang, Y.; Coffey, V. An evaluation of the impact of environmental regulation on the efficiency of technology innovation using the combined DEA model: A case study of Xi’an, China. Sustain. Cities Soc. 2018, 42, 355–369. [Google Scholar] [CrossRef]
- Wu, J.; Yang, J.; Zhou, Z. How does environmental regulation affect environmental performance? A case study of China’s regional energy efficiency. Expert Syst. 2020, 37, e12326. [Google Scholar] [CrossRef]
- Zhu, Y.; Wang, Z.; Qiu, S.; Zhu, L. Effects of environmental regulations on technological innovation efficiency in China’s industrial enterprises: A spatial analysis. Sustainability 2019, 11, 2186. [Google Scholar] [CrossRef] [Green Version]
- Li, K.; Fang, L.; He, L. How urbanization affects China’s energy efficiency: A spatial econometric analysis. J. Clean. Prod. 2018, 200, 1130–1141. [Google Scholar] [CrossRef]
- Zhao, H.; Guo, S.; Zhao, H. Provincial energy efficiency of China quantified by three-stage data envelopment analysis. Energy 2019, 166, 96–107. [Google Scholar] [CrossRef]
- Lin, J.; Xu, C. The impact of environmental regulation on total factor energy efficiency: A cross-region analysis in China. Energies 2017, 10, 1578. [Google Scholar] [CrossRef] [Green Version]
- Ma, D.; Xiong, H.; Zhang, F.; Gao, L.; Zhao, N.; Yang, G.; Yang, Q. China’s industrial green total-factor energy efficiency and its influencing factors: A spatial econometric analysis. Environ. Sci. Pollut. Res. 2022, 29, 18559–18577. [Google Scholar] [CrossRef] [PubMed]
- Cao, Y.; Wan, N.; Zhang, H.; Zhang, X.; Zhou, Q. Linking environmental regulation and economic growth through technological innovation and resource consumption: Analysis of spatial interaction patterns of urban agglomerations. Ecol. Indic. 2020, 112, 106062. [Google Scholar] [CrossRef]
- Zhou, L. Governing China’s local officials: An analysis of promotion tournament model. Econ. Res. J. 2007, 7, 36–50. [Google Scholar]
- Fredriksson, P.G.; Millimet, D.L. Strategic Interaction and the Determination of Environmental Policy across U.S. States. J. Urban Econ. 2002, 51, 101–122. [Google Scholar] [CrossRef]
- Konisky, D.M. Regulatory competition and environmental enforcement: Is there a race to the bottom? Am. J. Polit. Sci. 2007, 51, 853–872. [Google Scholar] [CrossRef]
- Woods, N.D. Interstate competition and environmental regulation: A test of the race-to-the-bottom thesis. Soc. Sci. Q. 2006, 87, 174–189. [Google Scholar] [CrossRef]
- Ching-Cheng, L.; Liang-Chun, L. Evaluating the energy efficiency of European Union countries: The dynamic data envelopment analysis. Energy Environ. 2019, 30, 27–43. [Google Scholar]
- Rakshit, I.; Mandal, S.K. A global level analysis of environmental energy efficiency: An application of data envelopment analysis. Energy Effic. 2020, 13, 889–909. [Google Scholar] [CrossRef]
- Liu, W.; Lin, B. Analysis of energy efficiency and its influencing factors in China’s transport sector. J. Clean. Prod. 2018, 170, 674–682. [Google Scholar] [CrossRef]
- Masuda, K. Energy efficiency of intensive rice production in Japan: An application of data envelopment analysis. Sustainability 2018, 10, 120. [Google Scholar] [CrossRef] [Green Version]
- Hafiz Muhammad Abrar, I.; Majeed, S.; Alison, B.; Sara, R.; Azeem, K. Energy efficiency outlook of New Zealand dairy farming systems: An application of data envelopment analysis (DEA) approach. Energies 2020, 13, 251. [Google Scholar]
- Babazadeh, R.; Razmi, J.; Rabbani, M.; Pishvaee, M.S. An integrated data envelopment analysis–mathematical programming approach to strategic biodiesel supply chain network design problem. J. Clean. Prod. 2017, 147, 694–707. [Google Scholar] [CrossRef]
- Cook, W.D.; Tone, K.; Zhu, J. Data envelopment analysis: Prior to choosing a model. Omega 2014, 44, 1–4. [Google Scholar] [CrossRef]
- Yang, H.; Shi, D. Energy-Efficiency methods and comparing the energy efficiencies of different areas in China. Econ. Theory Bus. Manag. 2008, 3, 12–20. [Google Scholar]
- Aigner, D.; Lovell, C.A.K.; Schmidt, P. Formulation and estimation of stochastic frontier production function models. J. Econom. 1977, 6, 21–37. [Google Scholar] [CrossRef]
- Battese, G.E.; Corra, G.S. Estimation of a production frontier model: With application to the pastoral zone of eastern Australia. Aust. J. Agric. Econ. 1977, 21, 169–179. [Google Scholar] [CrossRef] [Green Version]
- Meeusen, W.; van den Broeck, J. Technical efficiency and dimension of the firm: Some results on the use of frontier production functions. Empir. Econ. 1977, 2, 109–122. [Google Scholar] [CrossRef]
- Greene, W.H. Maximum likelihood estimation of econometric frontier functions. J. Econom. 1980, 13, 27–56. [Google Scholar] [CrossRef]
- Battese, G.E.; Coelli, T.J. A model for technical inefficiency effects in a stochastic frontier production function for panel data. Empir. Econ. 1995, 20, 325–332. [Google Scholar] [CrossRef] [Green Version]
- Wang, H.-J.; Ho, C.-W. Estimating fixed-effect panel stochastic frontier models by model transformation. J. Econom. 2010, 157, 286–296. [Google Scholar] [CrossRef] [Green Version]
- Al-Gasaymeh, A. Bank efficiency determinant: Evidence from the gulf cooperation council countries. Res. Int. Bus. Financ. 2016, 38, 214–223. [Google Scholar] [CrossRef]
- Ferreira, M.D.P.; Féres, J.G. Farm size and Land use efficiency in the Brazilian Amazon. Land Use Policy 2020, 99, 104901. [Google Scholar] [CrossRef]
- Miao, C.; Meng, X.; Duan, M.; Wu, X. Energy consumption, environmental pollution, and technological innovation efficiency: Taking industrial enterprises in China as empirical analysis object. Environ. Sci. Pollut. Res. 2020, 27, 34147–34157. [Google Scholar] [CrossRef]
- Mandal, S.K. Do undesirable output and environmental regulation matter in energy efficiency analysis? Evidence from Indian Cement Industry. Energy Policy 2010, 38, 6076–6083. [Google Scholar] [CrossRef]
- Bi, G.-B.; Son, W.; Zhou, P.; Liang, L. Does environmental regulation affect energy efficiency in China’s thermal power generation? Empirical evidence from a slacks-based DEA model. Energy Policy 2014, 66, 537–546. [Google Scholar] [CrossRef]
- Kneller, R.; Manderson, E. Environmental regulations and innovation activity in UK manufacturing industries. Resour. Energy Econ. 2012, 34, 211–235. [Google Scholar] [CrossRef]
- Wang, X.; Du, L. Analysis of China’s total-factor energy efficiency and its convergence under environmental regulation. J. Inf. Comput. Sci. 2015, 12, 4281–4289. [Google Scholar] [CrossRef]
- Zhang, C.; He, W.D.; Hao, R. Analysis of environmental regulation and total factor energy efficiency. Curr. Sci. 2016, 110, 1958–1968. [Google Scholar] [CrossRef]
- Pan, X.; Ai, B.; Li, C.; Pan, X.; Yan, Y. Dynamic relationship among environmental regulation, technological innovation and energy efficiency based on large scale provincial panel data in China. Technol. Forecast. Soc. Chang. 2019, 144, 428–435. [Google Scholar] [CrossRef]
- Barbera, A.J.; McConnell, V.D. The impact of environmental regulations on industry productivity: Direct and indirect effects. J. Environ. Econ. Manag. 1990, 18, 50–65. [Google Scholar] [CrossRef]
- Jorgenson, D.W.; Wilcoxen, P.J. Environmental regulation and US economic growth. RAND J. Econ. 1990, 21, 314–340. [Google Scholar] [CrossRef]
- Lanoie, P.; Patry, M.; Lajeunesse, R. Environmental regulation and productivity: Testing the porter hypothesis. J. Product. Anal. 2008, 30, 121–128. [Google Scholar] [CrossRef]
- Yang, H.; Wang, X. Is Environmental Regulation an Effective Way to Prevent Energy Rebound Effect? J. Manag. 2021, 34, 74–91. [Google Scholar]
- Yu, B.; Jin, G.; Cheng, Z. Economic effects of environmental regulations: “emission reduction” or “efficiency enhancement”. Stat. Res. 2019, 36, 88–100. [Google Scholar]
- Peng, S. China’s total factor energy efficiency evaluation: Based on three stage global undesirable-hybrid-slack-based-model. Econ. Probl. 2020, 1, 11–19. [Google Scholar]
- Gao, Z.; You, J. The intensity of environmental regulation and the total factor energy efficiency of China. Comp. Econ. Soc. Syst. 2015, 111–123. Available online: https://kns.cnki.net/kcms/detail/detail.aspx?FileName=JJSH201506012&DbName=CJFQ2015 (accessed on 1 June 2022).
- Li, Y.; Xu, X.; Zheng, Y. An empirical study of environmental regulation impact on China’s industrial total factor energy efficiency: Based on the data of 30 provinces from 2003 to 2016. Manag. Rev. 2019, 31, 40–48. [Google Scholar]
- Sinn, H.-W. Public policies against global warming: A supply side approach. Int. Tax Public Financ. 2008, 15, 360–394. [Google Scholar] [CrossRef]
- Porter, M.E.; van der Linde, C. Toward a new conception of the environment-competitiveness relationship. J. Econ. Perspect. 1995, 9, 97–118. [Google Scholar] [CrossRef] [Green Version]
- Li, S.; Chu, S.; Shen, C. Local government competition, environmental regulation and regional ecological efficiency. World Econ. 2014, 37, 88–110. [Google Scholar]
- Shan, H. Re-estimating the capital stock of China:1952~2006. J. Quant. Tech. Econ. 2008, 25, 17–31. [Google Scholar]
- Zhang, N.; Deng, J.Q.; Ahmad, F.; Draz, M.U. Local government competition and regional green development in China: The mediating role of environmental regulation. Int. J. Environ. Res. Public Health 2020, 17, 3485. [Google Scholar] [CrossRef] [PubMed]
- Yu, H. The influential factors of China’s regional energy intensity and its spatial linkages: 1988–2007. Energy Policy 2012, 45, 583–593. [Google Scholar] [CrossRef]
- Kelejian, H.H.; Prucha, I.R. Estimation of simultaneous systems of spatially interrelated cross sectional equations. J. Econ. 2004, 118, 27–50. [Google Scholar] [CrossRef] [Green Version]
- Wooldridge, J.M. Introductory Econometrics: A Modern Approach, 5th ed.; Cengage Learning: Mason, OH, USA, 2013; pp. 484–492. [Google Scholar]
- Levinson, A. Environmental regulations and manufacturers’ location choices: Evidence from the Census of Manufactures. J. Public Econ. 1996, 62, 5–29. [Google Scholar] [CrossRef]
- Xie, R.; Yuan, Y.; Huang, J. Different types of environmental regulations and heterogeneous influence on “green” productivity: Evidence from China. Ecol. Econ. 2017, 132, 104–112. [Google Scholar] [CrossRef]
- Ma, B. Does urbanization affect energy intensities across provinces in China? Long-run elasticities estimation using dynamic panels with heterogeneous slopes. Energy Econ. 2015, 49, 390–401. [Google Scholar] [CrossRef]
- Rafiq, S.; Salim, R.; Nielsen, I. Urbanization, openness, emissions, and energy intensity: A study of increasingly urbanized emerging economies. Energy Econ. 2016, 56, 20–28. [Google Scholar] [CrossRef]
- Yang, S.; Shi, L. Prediction of long-term energy consumption trends under the New National Urbanization Plan in China. J. Clean. Prod. 2017, 166, 1144–1153. [Google Scholar] [CrossRef]
- Zhao, H.; Lin, B. Impact of foreign trade on energy efficiency in China’s textile industry. J. Clean. Prod. 2020, 245, 118878. [Google Scholar] [CrossRef]
- Sheng, J.; Zhou, W.; Zhu, B. The coordination of stakeholder interests in environmental regulation: Lessons from China’s environmental regulation policies from the perspective of the evolutionary game theory. J. Clean. Prod. 2020, 249, 119385. [Google Scholar] [CrossRef]
- Elliott, R.J.R.; Sun, P.; Zhu, T. The direct and indirect effect of urbanization on energy intensity: A province-level study for China. Energy 2017, 123, 677–692. [Google Scholar] [CrossRef]
- Bailey, C.J. Environmental protection at the state level: Politics and progress in controlling pollution. Environ. Polit. 1994, 3, 251–252. [Google Scholar]
- Potoski, M.; Woods, N.D. Dimensions of state environmental policies. Policy Stud. J. 2002, 30, 208–226. [Google Scholar] [CrossRef]
- Hafstead, M.A.C.; Williams, R.C. Unemployment and environmental regulation in general equilibrium. J. Public Econ. 2018, 160, 50–65. [Google Scholar] [CrossRef] [Green Version]
- Madariaga, N.; Poncet, S. FDI in Chinese cities: Spillovers and impact on growth. World Econ. 2007, 30, 837–862. [Google Scholar] [CrossRef] [Green Version]
- Du, L.; Tian, M.H.; Cheng, J.G.; Chen, W.Z.; Zhao, Z.Y. Environmental regulation and green energy efficiency: An analysis of spatial Durbin model from 30 provinces in China. Environ. Sci. Pollut. Res. 2022. [Google Scholar] [CrossRef]
- Zhou, A.; Li, J. Investigate the impact of market reforms on the improvement of manufacturing energy efficiency under China’s provincial-level data. Energy 2021, 228, 120562. [Google Scholar] [CrossRef]
- Guo, R.; Yuan, Y.J. Different types of environmental regulations and heterogeneous influence on energy efficiency in the industrial sector: Evidence from Chinese provincial data. Energy Policy 2020, 145, 111747. [Google Scholar] [CrossRef]
- Svensson, A.; Paramonova, S. An analytical model for identifying and addressing energy efficiency improvement opportunities in industrial production systems—Model development and testing experiences from Sweden. J. Clean. Prod. 2017, 142, 2407–2422. [Google Scholar] [CrossRef]
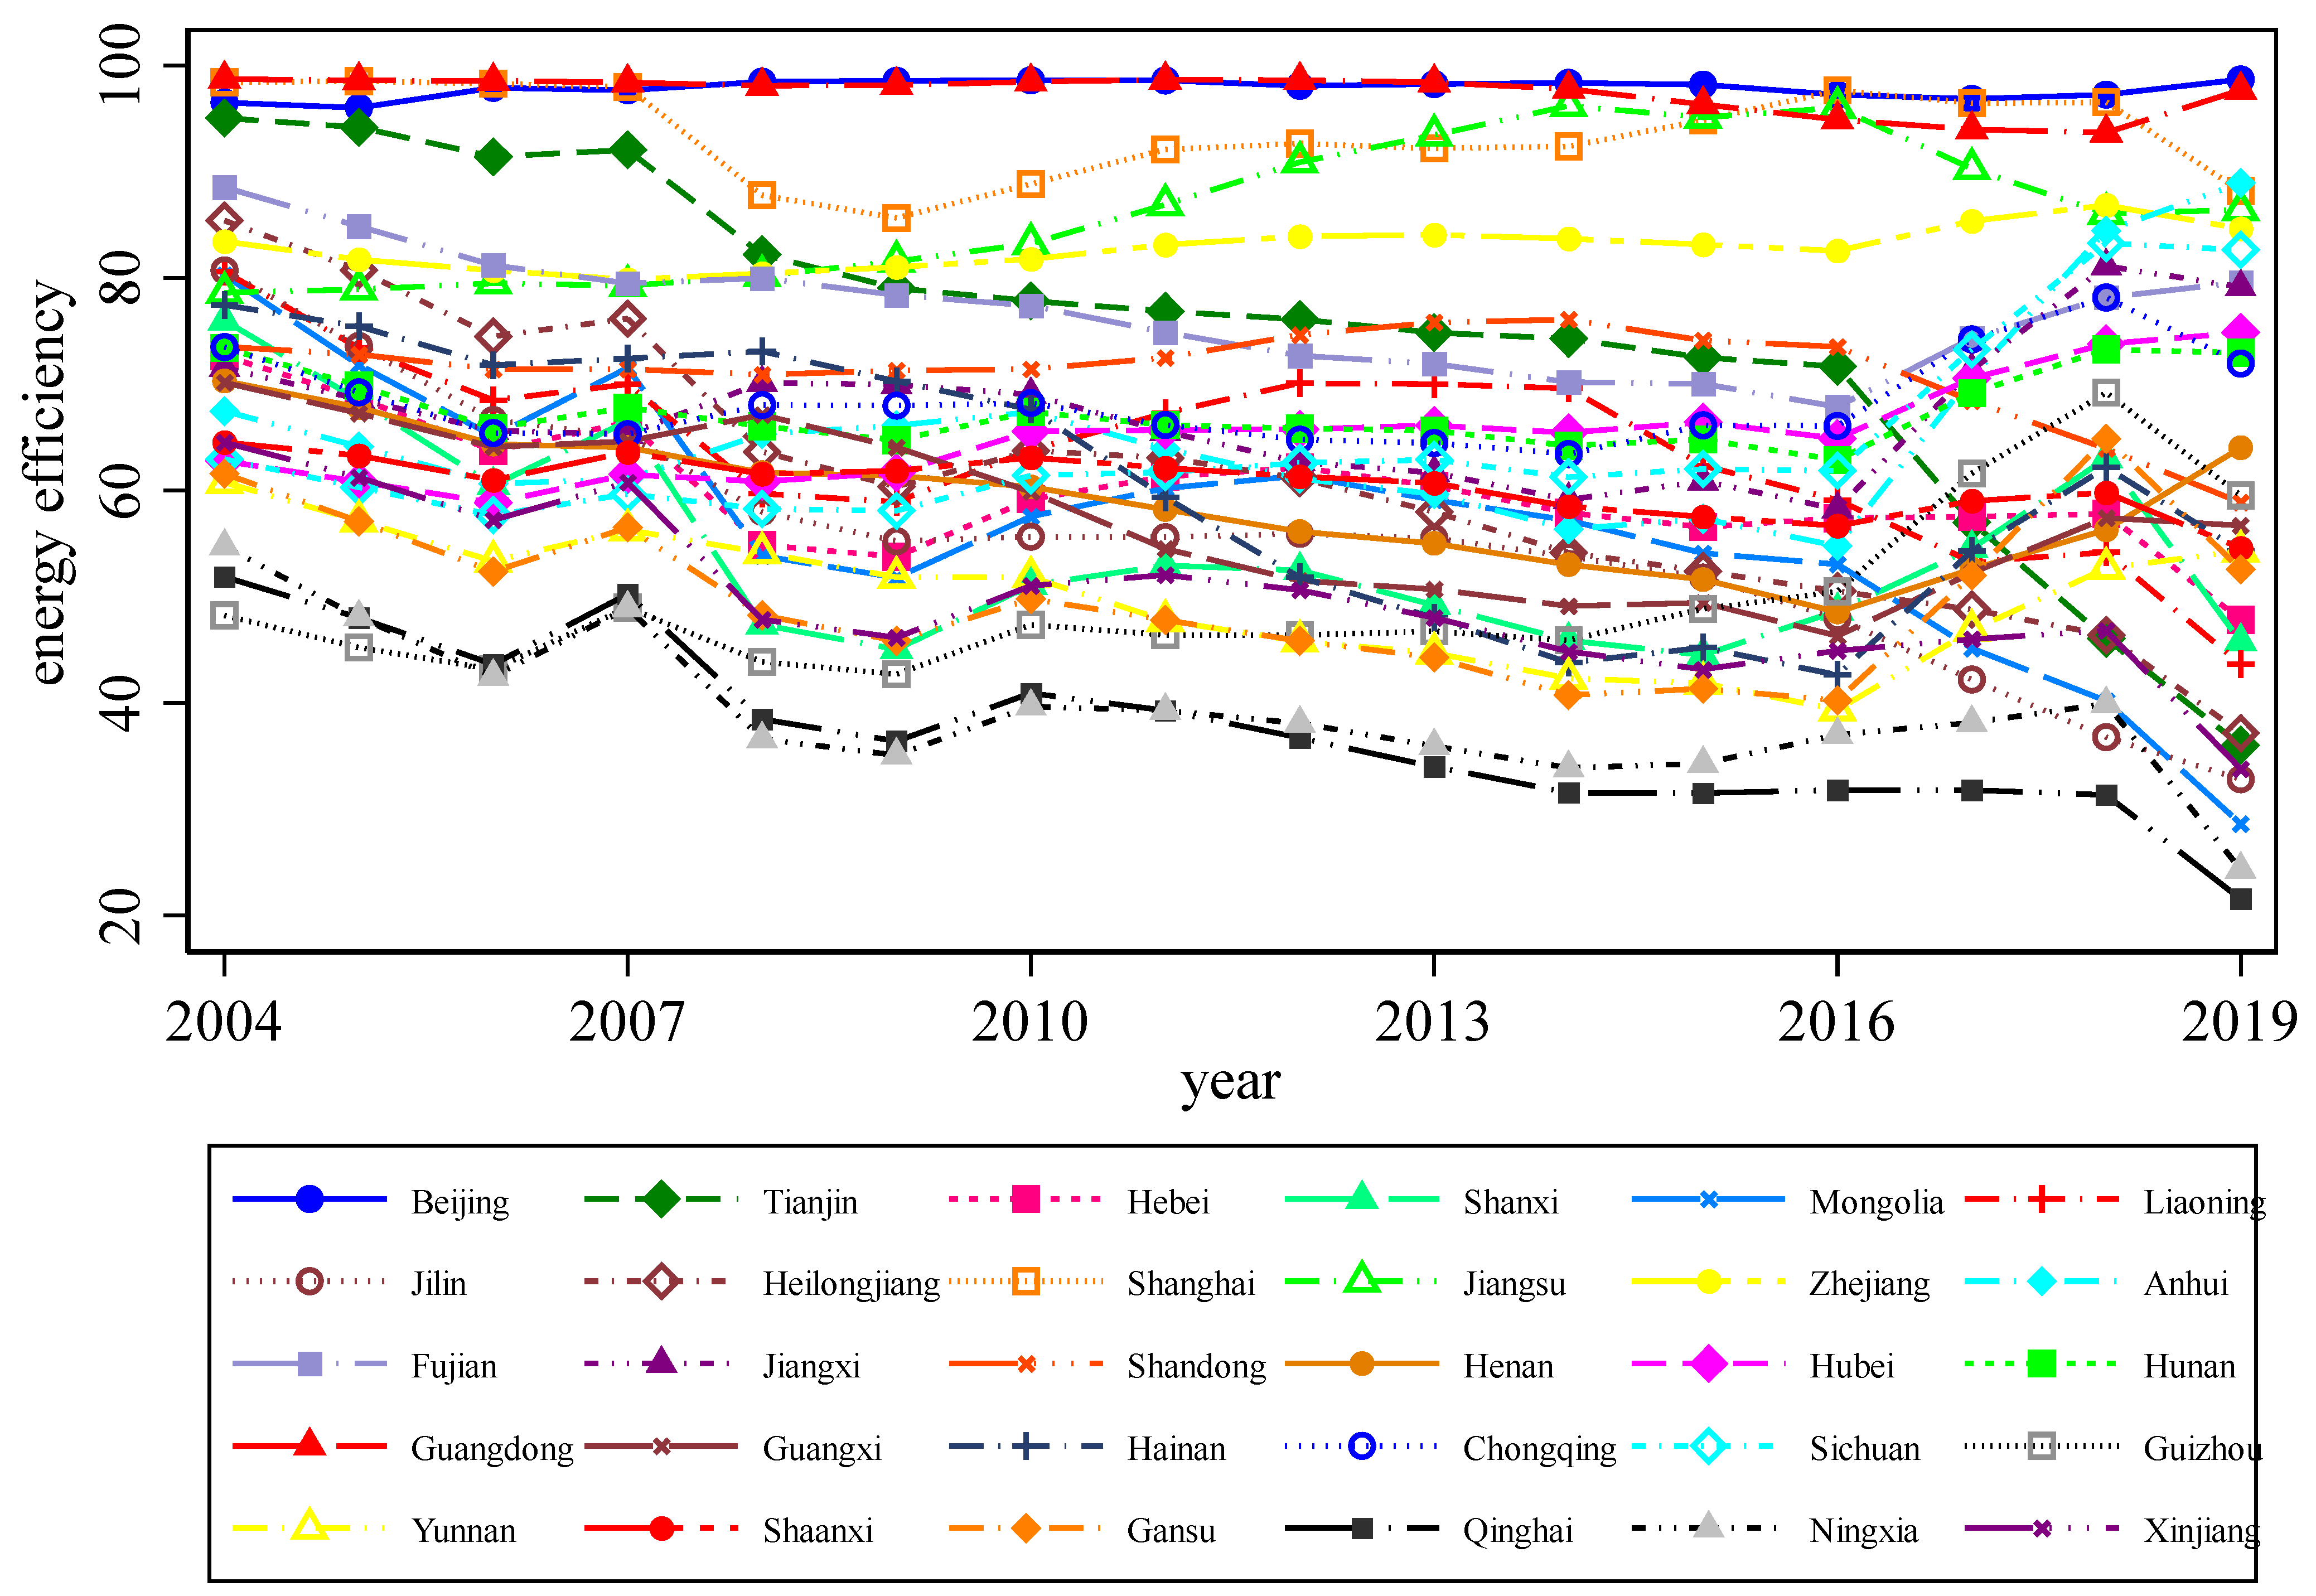
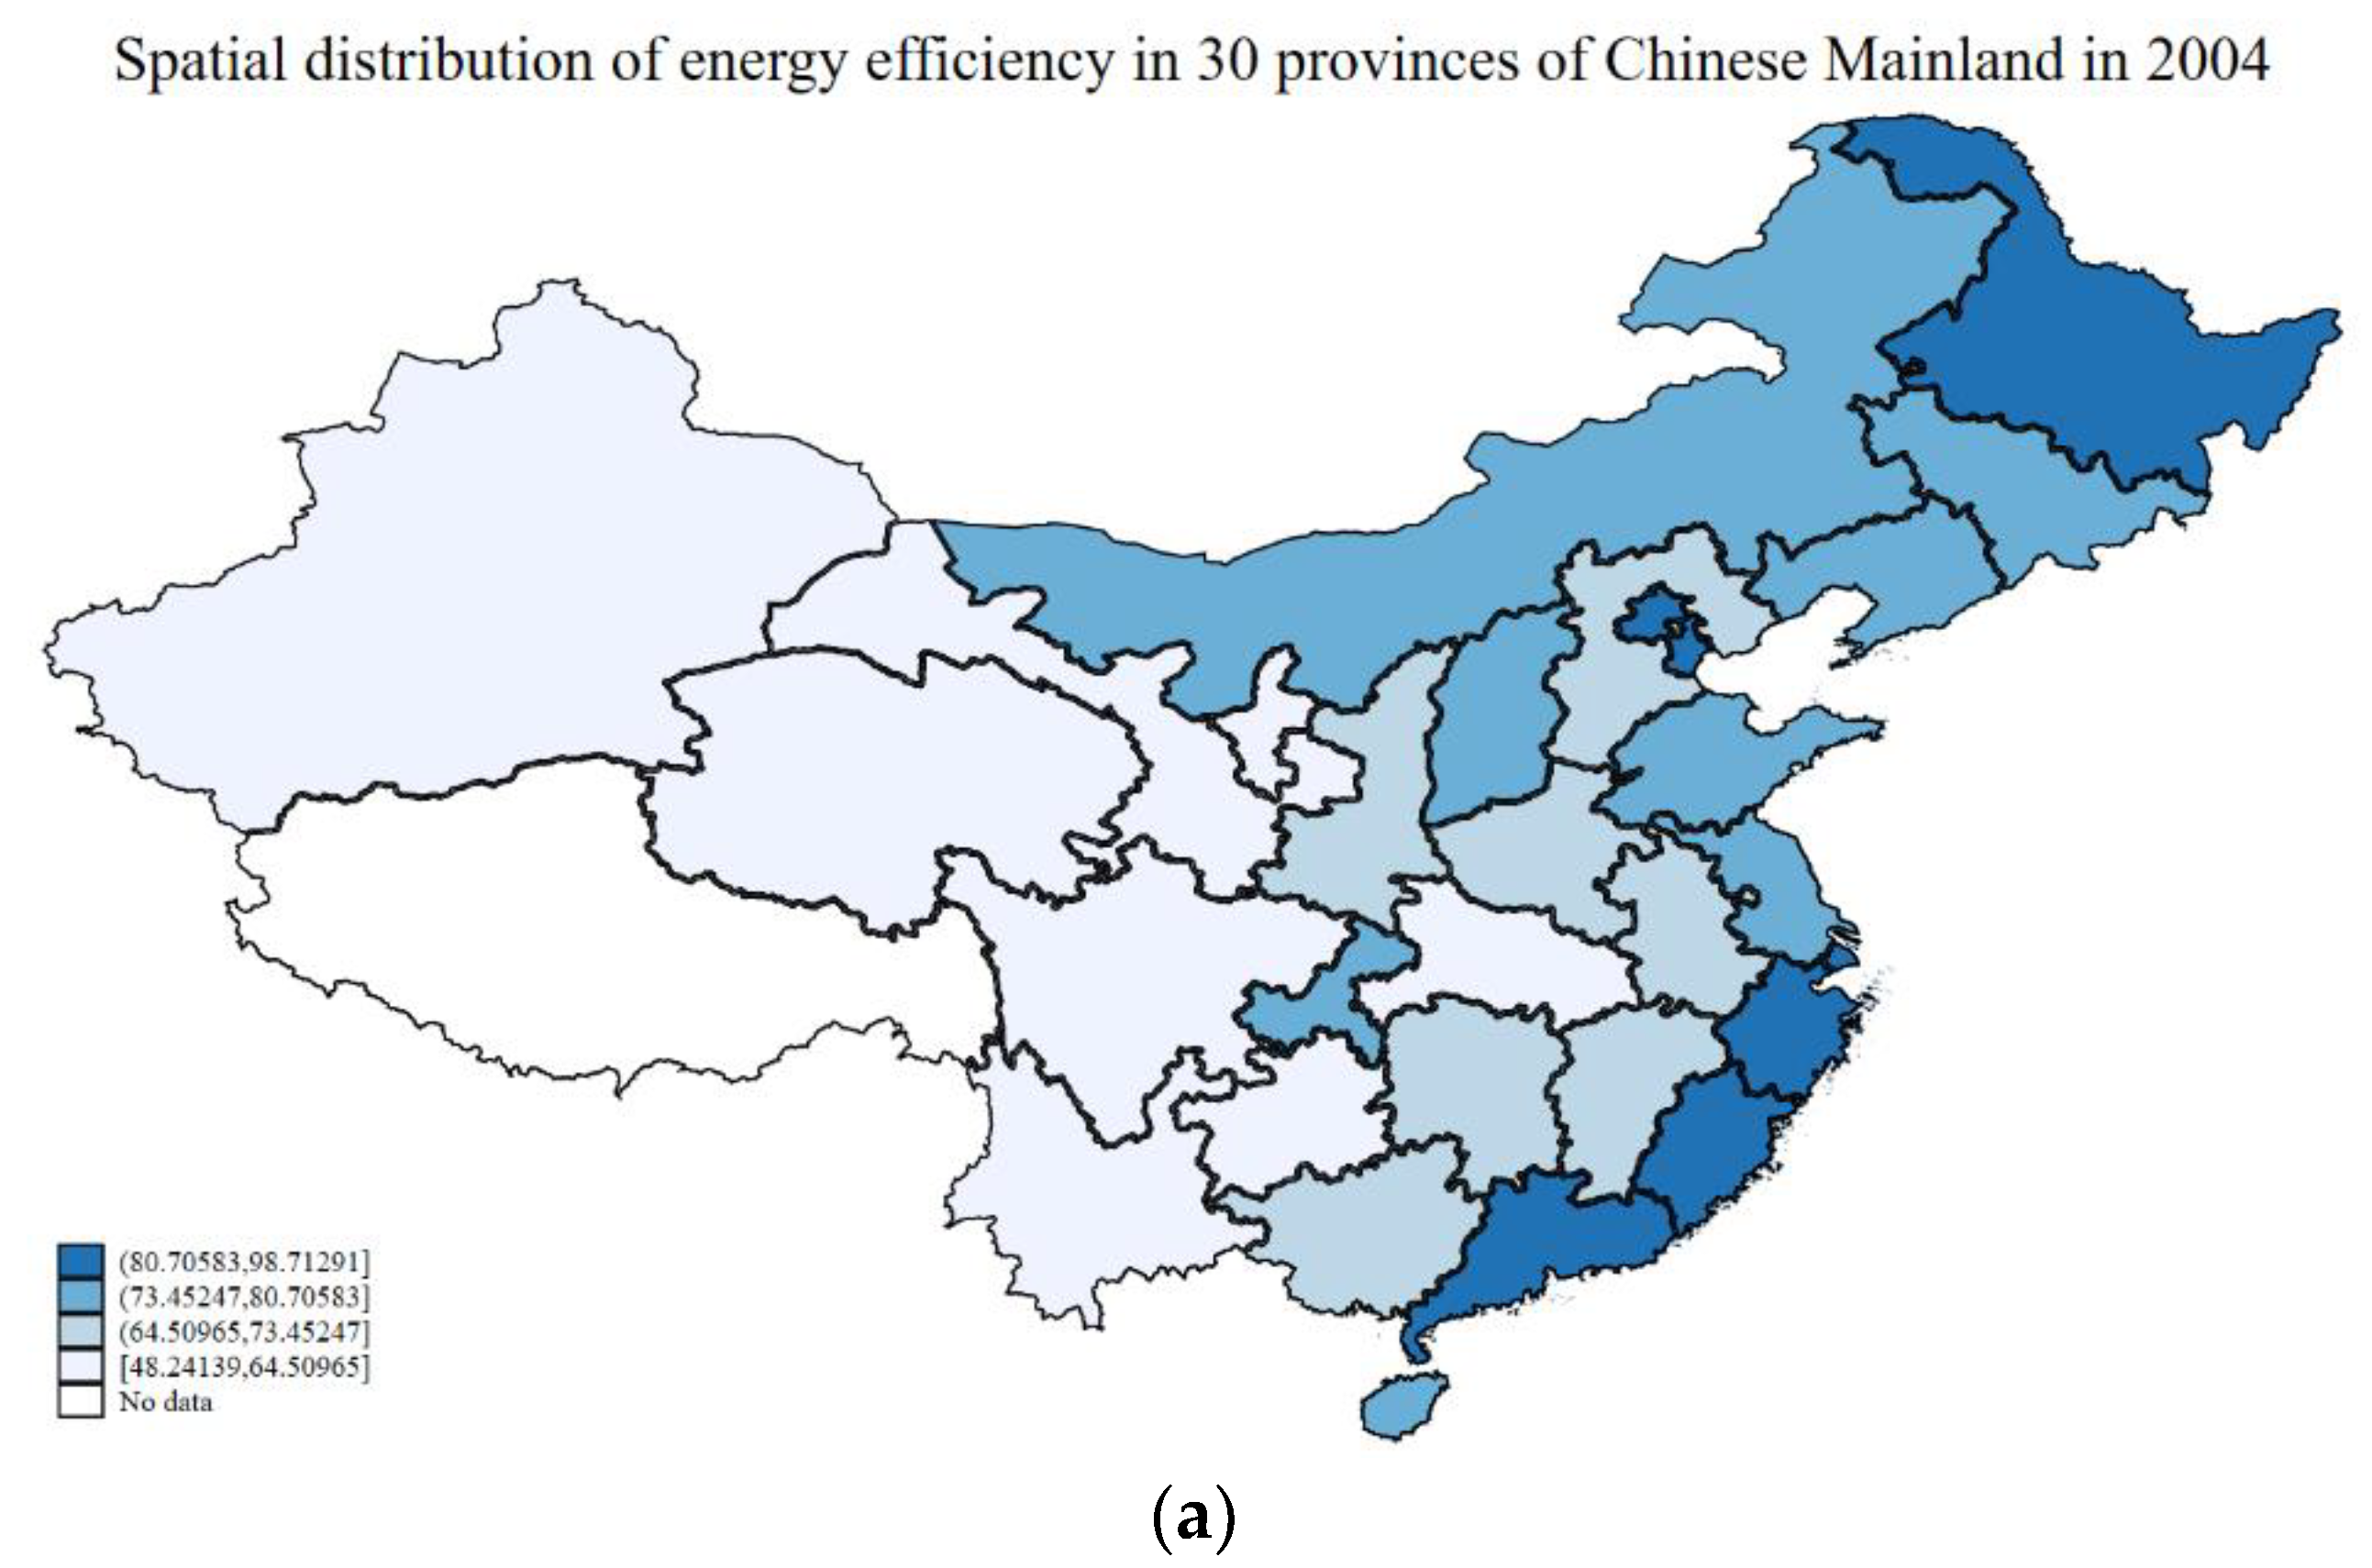
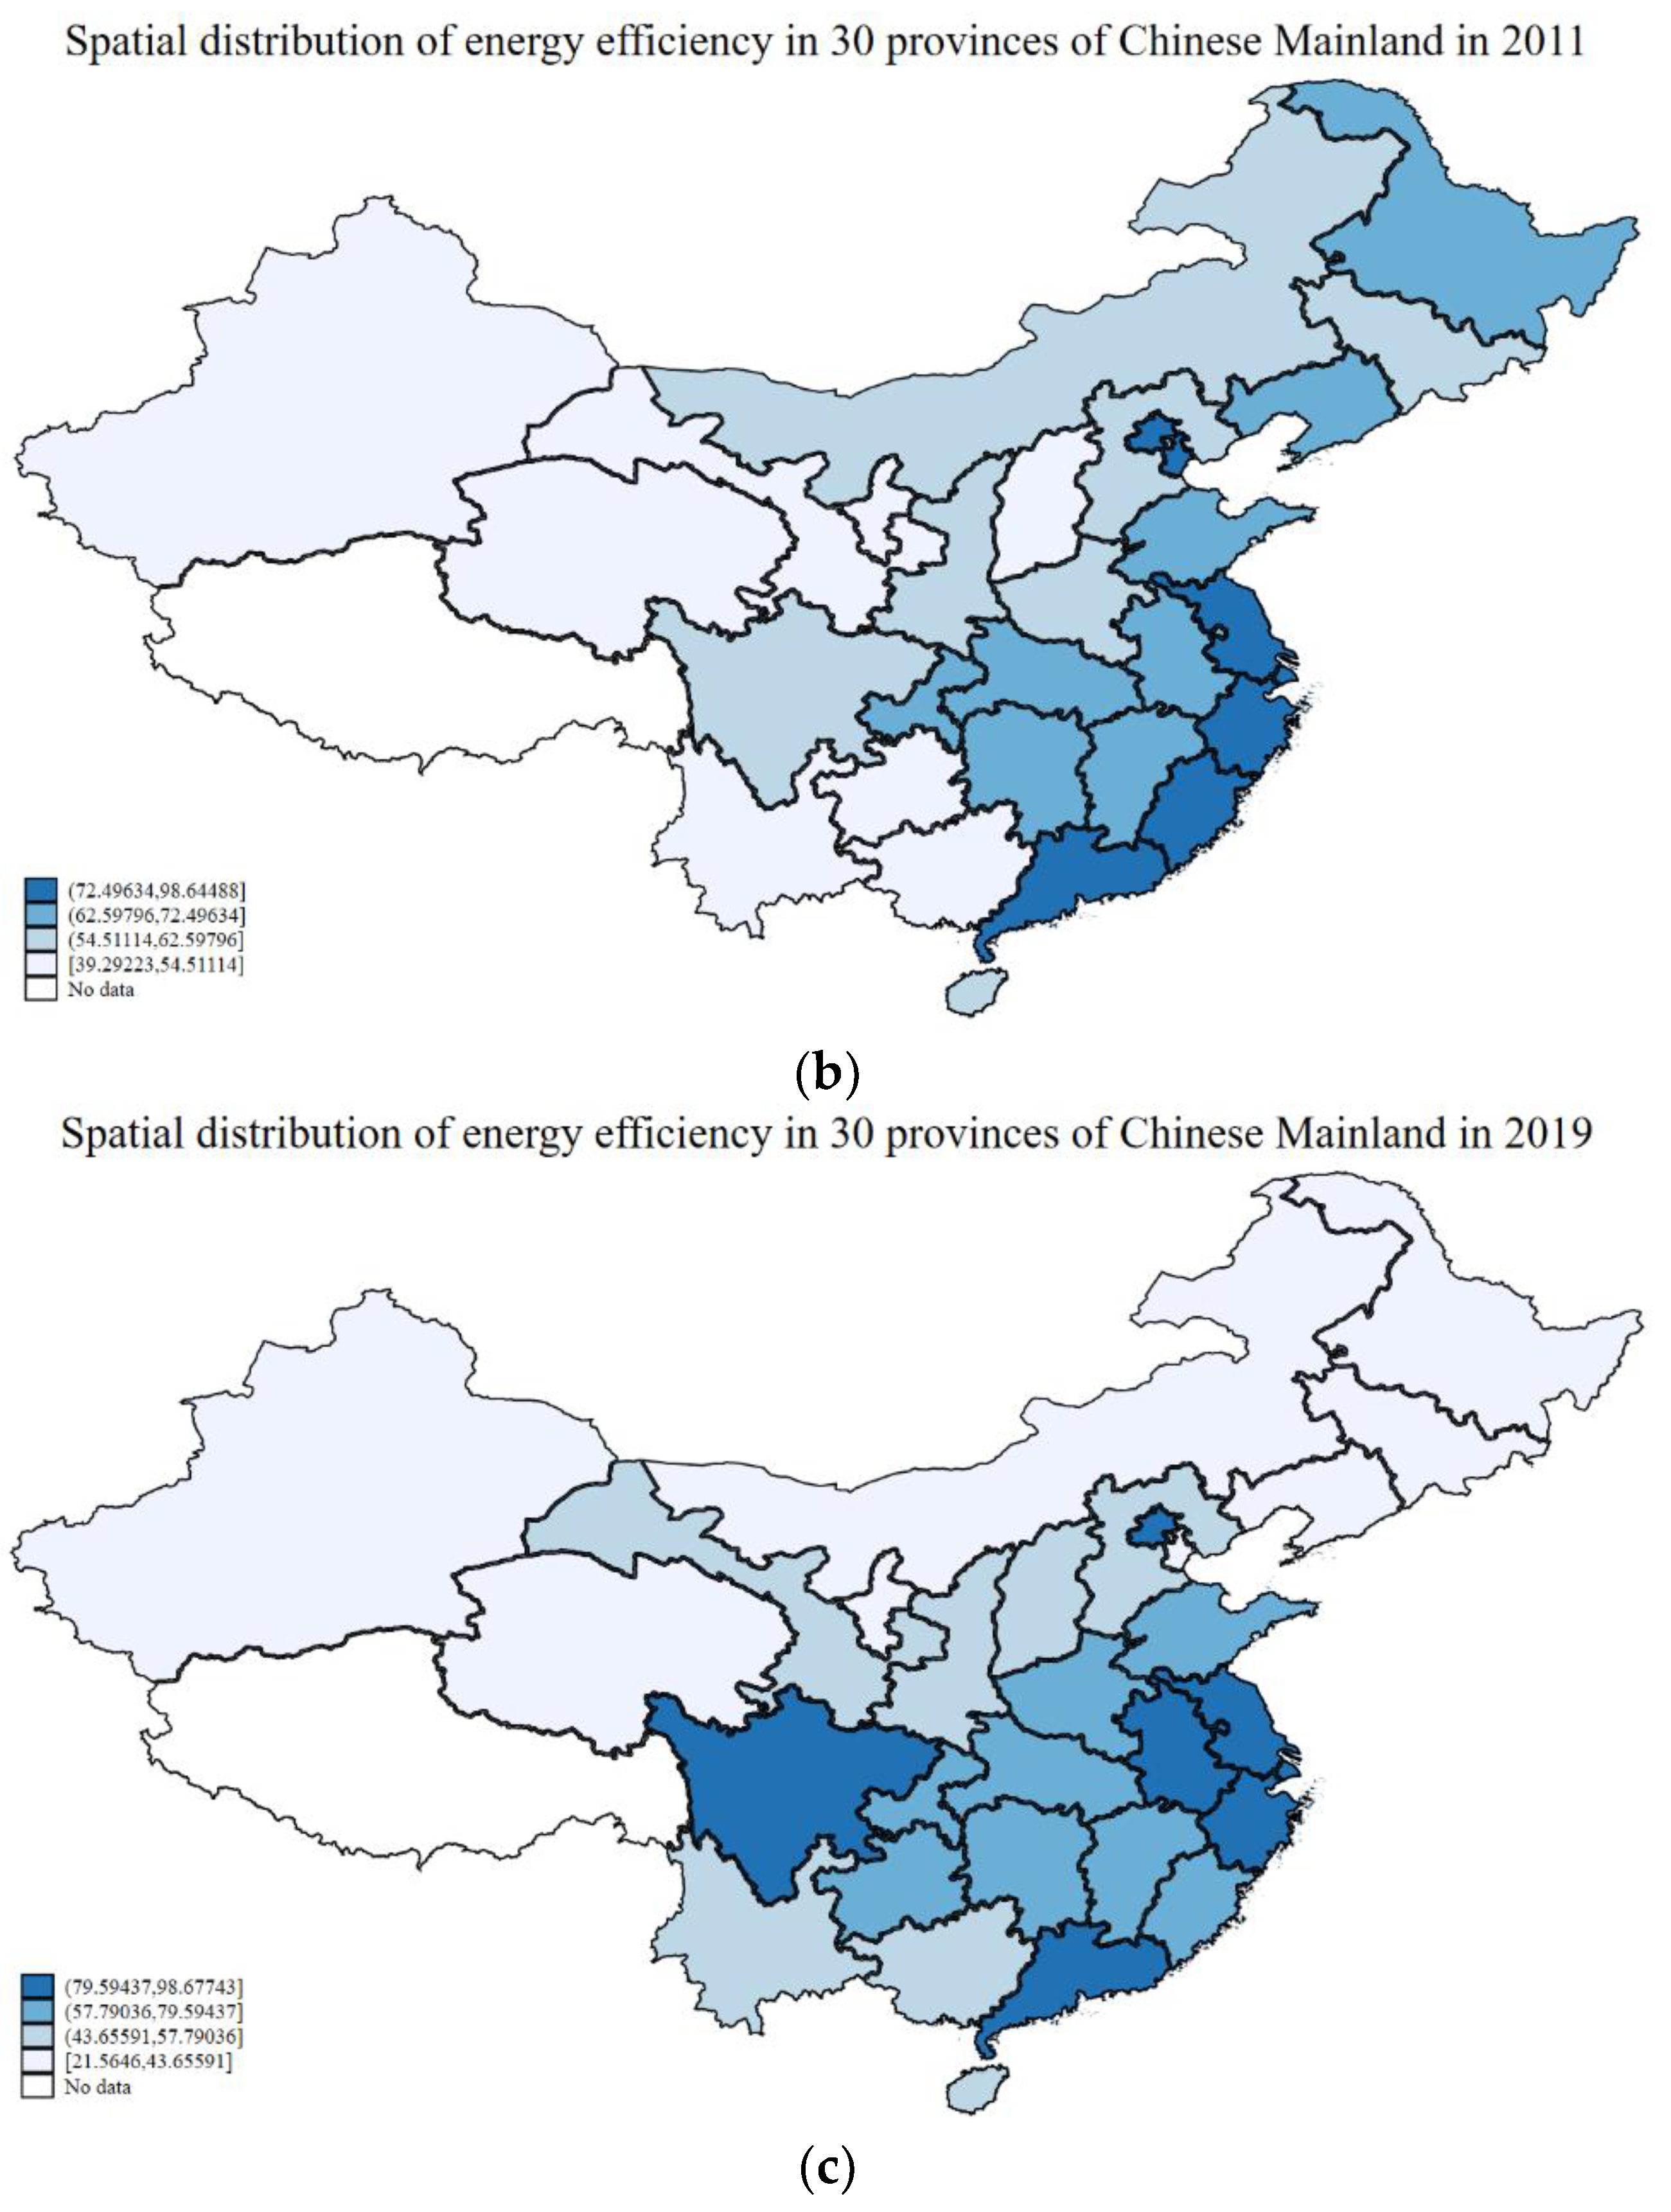
| Year | Energy Efficiency (%) | Year | Energy Efficiency (%) | Year | Energy Efficiency (%) | Year | Energy Efficiency (%) |
|---|---|---|---|---|---|---|---|
| 2004 | 74.134 | 2008 | 64.555 | 2012 | 63.927 | 2016 | 60.163 |
| 2005 | 70.862 | 2009 | 63.431 | 2013 | 62.992 | 2017 | 62.933 |
| 2006 | 67.515 | 2010 | 65.305 | 2014 | 61.369 | 2018 | 65.385 |
| 2007 | 69.296 | 2011 | 64.664 | 2015 | 60.949 | 2019 | 60.407 |
| Province | Energy Efficiency (%) | Province | Energy Efficiency (%) | Province | Energy Efficiency (%) |
|---|---|---|---|---|---|
| Beijing | 97.818 | Zhejiang | 82.890 | Hainan | 60.611 |
| Tianjin | 74.819 | Anhui | 65.580 | Chongqing | 68.315 |
| Hebei | 59.888 | Fujian | 76.842 | Sichuan | 64.366 |
| Shanxi | 54.504 | Jiangxi | 67.493 | Guizhou | 49.671 |
| Inner Mongolia | 56.933 | Shandong | 71.294 | Yunnan | 50.065 |
| Liaoning | 64.032 | Henan | 59.089 | Shaanxi | 60.569 |
| Jilin | 55.462 | Hubei | 65.345 | Gansu | 50.073 |
| Heilongjiang | 61.014 | Hunan | 67.503 | Qinghai | 37.453 |
| Shanghai | 93.646 | Guangdong | 97.431 | Ningxia | 39.164 |
| Jiangsu | 86.410 | Guangxi | 57.821 | Xinjiang | 49.939 |
| Abbreviation | Variables | Sample Size | Mean | Std. Dev. | Min | Max |
|---|---|---|---|---|---|---|
| EE (%) | Energy efficiency | 480 | 64.868 | 16.930 | 21.565 | 98.713 |
| ER (‰) | Environmental regulation | 480 | 12.580 | 6.672 | 2.020 | 42.400 |
| PGDP (Ұ) | GDP per capita | 480 | 28,094.3 | 16,411.9 | 4317.0 | 97,260.9 |
| CSPW (Ұ) | Capital stock per worker | 480 | 155,016.9 | 104,929.5 | 18,148.8 | 559,975.1 |
| URB (%) | Urbanization rate | 480 | 53.685 | 14.223 | 26.260 | 89.600 |
| SFC (%) | Self-financing capacity | 480 | 50.901 | 19.207 | 14.826 | 95.086 |
| OWS (%) | Ownership structure | 480 | 41.271 | 19.061 | 9.589 | 83.746 |
| GOV (%) | Government involvement | 480 | 28.915 | 14.921 | 7.918 | 96.012 |
| OFI (%) | Openness to foreign investment | 480 | 41.388 | 50.060 | 4.733 | 570.538 |
| TRO (%) | Trade openness | 480 | 29.740 | 33.903 | 1.146 | 166.816 |
| ENS (%) | Energy structure | 480 | 52.362 | 15.328 | 1.773 | 80.721 |
| IND (%) | Industry | 480 | 45.196 | 8.373 | 15.989 | 59.045 |
| SER (%) | Service industry | 480 | 43.897 | 9.398 | 28.303 | 83.688 |
| GROW (%) | Economic growth rate | 480 | 10.077 | 2.935 | 0.500 | 19.600 |
| UEM (%) | Unemployment rate | 480 | 3.487 | 0.693 | 1.200 | 6.500 |
| Number of Lags | Null Hypothesis | Wald Test Statistic | p-Value | Conclusion |
|---|---|---|---|---|
| 1 | EE does not Granger-cause ER | 9.9162 | 0.0016 | reject |
| 1 | ER does not Granger-cause EE | 17.8381 | <0.0001 | reject |
| Period | EE | ER | Period | EE | ER |
|---|---|---|---|---|---|
| Moran’s I | Moran’s I | Moran’s I | Moran’s I | ||
| 2004 | 0.455 *** (4.046) | 0.229 ** (2.264) | 2012 | 0.364 *** (3.294) | 0.062 (0.798) |
| 2005 | 0.458 *** (4.085) | 0.202 * (1.947) | 2013 | 0.349 *** (3.165) | 0.271 ** (2.508) |
| 2006 | 0.461 *** (4.111) | 0.263 ** (2.526) | 2014 | 0.345 *** (3.130) | 0.339 *** (3.099) |
| 2007 | 0.437 *** (3.910) | 0.212 ** (2.140) | 2015 | 0.381 *** (3.430) | 0.225 ** (2.151) |
| 2008 | 0.501 *** (4.428) | 0.151 (1.535) | 2016 | 0.359 *** (3.242) | 0.158 (1.592) |
| 2009 | 0.504 *** (4.455) | 0.081 (0.950) | 2017 | 0.429 *** (3.825) | 0.085 (0.988) |
| 2010 | 0.477 *** (4.235) | −0.091 (−0.471) | 2018 | 0.399 *** (3.567) | −0.069 (−0.292) |
| 2011 | 0.418 *** (3.747) | 0.039 (0.605) | 2019 | 0.463 *** (4.093) | 0.131 (1.381) |
| Variable | Contiguity Weights | Geographical Distance Weights | Contiguity and Economic Distance Weights | Economic Distance Weights | Geographical and Economic Distance Weights |
|---|---|---|---|---|---|
| W_EE | 0.3415 *** (4.66) | 1.0296 *** (9.67) | 0.2685 *** (3.65) | 1.0498 *** (9.07) | 1.0404 *** (9.88) |
| W_ER | 0.0059 (0.16) | −0.0865 ** (−2.01) | −0.0433 (−1.22) | 0.0794 (1.31) | −0.0869 * (−1.93) |
| ER | 0.2149 *** (6.68) | 0.2783 *** (7.99) | 0.2524 *** (8.40) | 0.1187 * (1.89) | 0.2777 *** (7.22) |
| PGDP | 0.4093 *** (6.97) | 0.4180 *** (7.55) | 0.3881 *** (6.74) | 0.6287 *** (9.40) | 0.4254 *** (7.59) |
| CSPW | −0.3044 *** (−6.96) | −0.2372 *** (−6.24) | −0.2889 *** (−6.78) | −0.4270 *** (−8.79) | −0.2363 *** (−6.02) |
| URB | 0.0085 *** (3.42) | 0.0052 ** (2.11) | 0.0081 *** (3.12) | 0.0113 *** (4.34) | 0.0050 ** (2.02) |
| OWS | 0.0011 (1.36) | 0.0006 (0.75) | 0.0012 (1.42) | −0.0003 (−0.36) | 0.0004 (0.49) |
| GOV | −0.0083 *** (−9.08) | −0.0075 *** (−8.33) | −0.0086 *** (−9.01) | −0.0076 *** (−7.54) | −0.0075 *** (−8.19) |
| OFI | 0.0003 ** (2.41) | 0.0002 (1.32) | 0.0003 * (1.89) | 0.0004 ** (2.45) | 0.0002 (1.38) |
| TRO | −0.0005 (−1.16) | −0.0008 * (−1.83) | −0.0006 (−1.34) | −0.0010 * (−1.73) | −0.0008 * (−1.72) |
| ENS | −0.0018 * (−1.74) | −0.0033 *** (−3.29) | −0.0021 ** (−1.97) | −0.0030 *** (−2.97) | −0.0032 *** (−3.23) |
| IND | −0.0062 ** (−2.15) | −0.0065 ** (−2.47) | −0.0052 * (−1.85) | −0.0053 * (−1.71) | −0.0068 *** (−2.58) |
| SER | −0.0026 (−0.82) | −0.0035 (−1.24) | −0.0024 (−0.77) | −0.0009 (−0.26) | −0.0038 (−1.36) |
| CONSTANT | 1.8541 *** (3.73) | −1.4744 ** (−2.25) | 2.2120 *** (4.40) | −1.9477 *** (−2.60) | −1.5594 ** (−2.41) |
| Variable | Contiguity Weights | Geographical Distance Weights | Contiguity and Economic Distance Weights | Economic Distance Weights | Geographical and Economic Distance Weights |
|---|---|---|---|---|---|
| W_ER | 0.4465 *** (4.60) | 0.5968 *** (5.49) | 0.4578 *** (4.63) | 0.6730 *** (6.22) | 0.6075 *** (5.62) |
| W_EE | −0.8941 *** (−3.49) | −1.6817 *** (−3.61) | −0.7942 *** (−3.25) | −0.6546 (−1.44) | −1.8166 *** (−4.00) |
| EE | 1.6562 *** (7.23) | 1.6044 *** (6.70) | 1.7868 *** (8.41) | 0.7925 *** (3.58) | 1.5981 *** (6.78) |
| PGDP | −0.2149 * (−1.64) | −0.3415 ** (−2.45) | −0.2435 * (−1.85) | −0.2022 (−1.38) | −0.3563 ** (−2.55) |
| URB | −0.0014 (−0.19) | 0.0061 (0.84) | 0.0003 (0.04) | 0.0090 (1.25) | 0.0064 (0.90) |
| SFC | 0.0055 (1.48) | 0.0030 (0.89) | 0.0044 (1.22) | 0.0076 * (1.95) | 0.0031 (0.92) |
| OWS | −0.0047 * (−1.70) | −0.0035 (−1.26) | −0.0054 * (−1.94) | −0.0017 (−0.62) | −0.0028 (−1.03) |
| GOV | 0.0191 *** (5.87) | 0.0166 *** (5.24) | 0.0202 *** (6.18) | 0.0124 *** (3.76) | 0.0159 *** (5.01) |
| OFI | 0.0001 (0.12) | 0.0003 (0.65) | <0.0001 (−0.05) | 0.0007 (1.41) | 0.0003 (0.61) |
| ENS | 0.0030 (0.88) | 0.0067 ** (2.01) | 0.0024 (0.70) | 0.0043 (1.31) | 0.0064 * (1.95) |
| GROW | 0.0125 * (1.68) | 0.0127 * (1.89) | 0.0095 (1.32) | 0.0215 *** (2.82) | 0.0130 * (1.93) |
| UEM | 0.0070 (0.16) | 0.0019 (0.05) | 0.0044 (0.10) | 0.0347 (0.74) | 0.0018 (0.04) |
| CONSTANT | −0.5289 (−0.36) | 3.4209 (1.54) | −1.1819 (−0.79) | 0.5056 (0.20) | 4.1088 * (1.87) |
| Variable | Contiguity Weights | Geographical Distance Weights | Contiguity and Economic Distance Weights | Economic Distance Weights | Geographical and Economic Distance Weights |
|---|---|---|---|---|---|
| Adjusted R-squared | 0.8939 | 0.9296 | 0.9162 | 0.8098 | 0.9306 |
| Variable | Contiguity Weights | Geographical Distance Weights | Contiguity and Economic Distance Weights | Economic Distance Weights | Geographical and Economic Distance Weights |
|---|---|---|---|---|---|
| Estimation results of the model (6) | |||||
| W_EE | 0.5135 *** (6.58) | 0.8768 *** (7.08) | 0.4445 *** (5.62) | 0.8573 *** (7.30) | 0.8803 *** (7.28) |
| W_ER | 0.0693 * (1.93) | −0.1023 * (−1.90) | 0.0570 (1.64) | −0.0730 (−1.20) | −0.1216 ** (−1.98) |
| ER | 0.1157 *** (4.04) | 0.2082 *** (6.41) | 0.1100 *** (4.07) | 0.1637 *** (3.47) | 0.2133 *** (4.62) |
| Estimation results of the model (8) | |||||
| W_ER | 0.2583 * (1.87) | 0.7332 *** (4.30) | 0.0932 (0.69) | 0.8322 *** (4.92) | 0.8166 *** (4.76) |
| W_EE | −1.2061 *** (−3.33) | −1.1266 ** (−2.21) | −1.1629 *** (−3.36) | −0.8655 * (−1.72) | −1.1076 ** (−2.19) |
| EE | 1.3521 *** (4.64) | 1.3170 *** (5.10) | 1.2946 *** (4.72) | 0.8164 *** (2.72) | 1.1182 *** (3.96) |
| Adjusted R-squared | 0.7725 | 0.8267 | 0.7680 | 0.7623 | 0.8157 |
| Variable | Contiguity Weights | Geographical Distance Weights | Contiguity and Economic Distance Weights | Economic Distance Weights | Geographical and Economic Distance Weights |
|---|---|---|---|---|---|
| Estimation results of the model (6) | |||||
| W_EE | 0.4353 *** (6.07) | 1.0081 *** (9.78) | 0.3138 *** (4.27) | 1.0409 *** (9.10) | 1.0174 *** (10.21) |
| W_ER | −0.0934 ** (−2.31) | −0.1311 *** (−2.76) | −0.0916 ** (−2.32) | 0.0501 (0.85) | −0.1256 ** (−2.54) |
| ER | 0.2521 *** (7.67) | 0.2764 *** (7.79) | 0.2354 *** (7.51) | 0.1046 * (1.88) | 0.2683 *** (7.05) |
| Estimation results of the model (8) | |||||
| W_ER | 0.6140 *** (5.47) | 0.7086 *** (5.95) | 0.6164 *** (5.37) | 0.7397 *** (6.39) | 0.7299 *** (6.16) |
| W_EE | −1.2186 *** (−4.58) | −2.0870 *** (−4.89) | −1.0060 *** (−3.83) | −1.1607 *** (−2.58) | −2.1671 *** (−5.22) |
| EE | 1.9742 *** (9.03) | 1.8915 *** (9.10) | 1.9115 *** (8.73) | 1.1208 *** (5.49) | 1.8810 *** (9.16) |
| Adjusted R-squared | 0.9417 | 0.9514 | 0.9246 | 0.8367 | 0.9494 |
Publisher’s Note: MDPI stays neutral with regard to jurisdictional claims in published maps and institutional affiliations. |
© 2022 by the authors. Licensee MDPI, Basel, Switzerland. This article is an open access article distributed under the terms and conditions of the Creative Commons Attribution (CC BY) license (https://creativecommons.org/licenses/by/4.0/).
Share and Cite
Ju, F.; Ke, M. The Spatial Spillover Effects of Environmental Regulation and Regional Energy Efficiency and Their Interactions under Local Government Competition in China. Sustainability 2022, 14, 8753. https://doi.org/10.3390/su14148753
Ju F, Ke M. The Spatial Spillover Effects of Environmental Regulation and Regional Energy Efficiency and Their Interactions under Local Government Competition in China. Sustainability. 2022; 14(14):8753. https://doi.org/10.3390/su14148753
Chicago/Turabian StyleJu, Fangyu, and Mengfan Ke. 2022. "The Spatial Spillover Effects of Environmental Regulation and Regional Energy Efficiency and Their Interactions under Local Government Competition in China" Sustainability 14, no. 14: 8753. https://doi.org/10.3390/su14148753
APA StyleJu, F., & Ke, M. (2022). The Spatial Spillover Effects of Environmental Regulation and Regional Energy Efficiency and Their Interactions under Local Government Competition in China. Sustainability, 14(14), 8753. https://doi.org/10.3390/su14148753


