1. Introduction
1.1. Background
Globally, it has become a trend for companies to consider ESG factors in management [
1,
2]. ESG, an abbreviation for environment, social, and governance, is a corporation evaluation index that scrutinizes a company’s non-financial performance. It is closely related to solving various problems regarding social inequality, corporate governance problems, climate change, working environment, and sustainability that humanity faces [
3,
4]. The importance of the ESG was elevated in the COVID-19 era [
5,
6,
7]. According to a report by BlackRock, people have concentrated more on how companies responded to the crisis, such as dealing with employees or customers [
8]. In the COVID-19 pandemic, people have comprehended the concept of ESG through direct experience, and this experience also affected the view of the investors [
6,
7]. The ESG index is now vital for both companies and investors since investors consider it as an important factor in investment decisions [
9,
10], which influences the future performance of the companies.
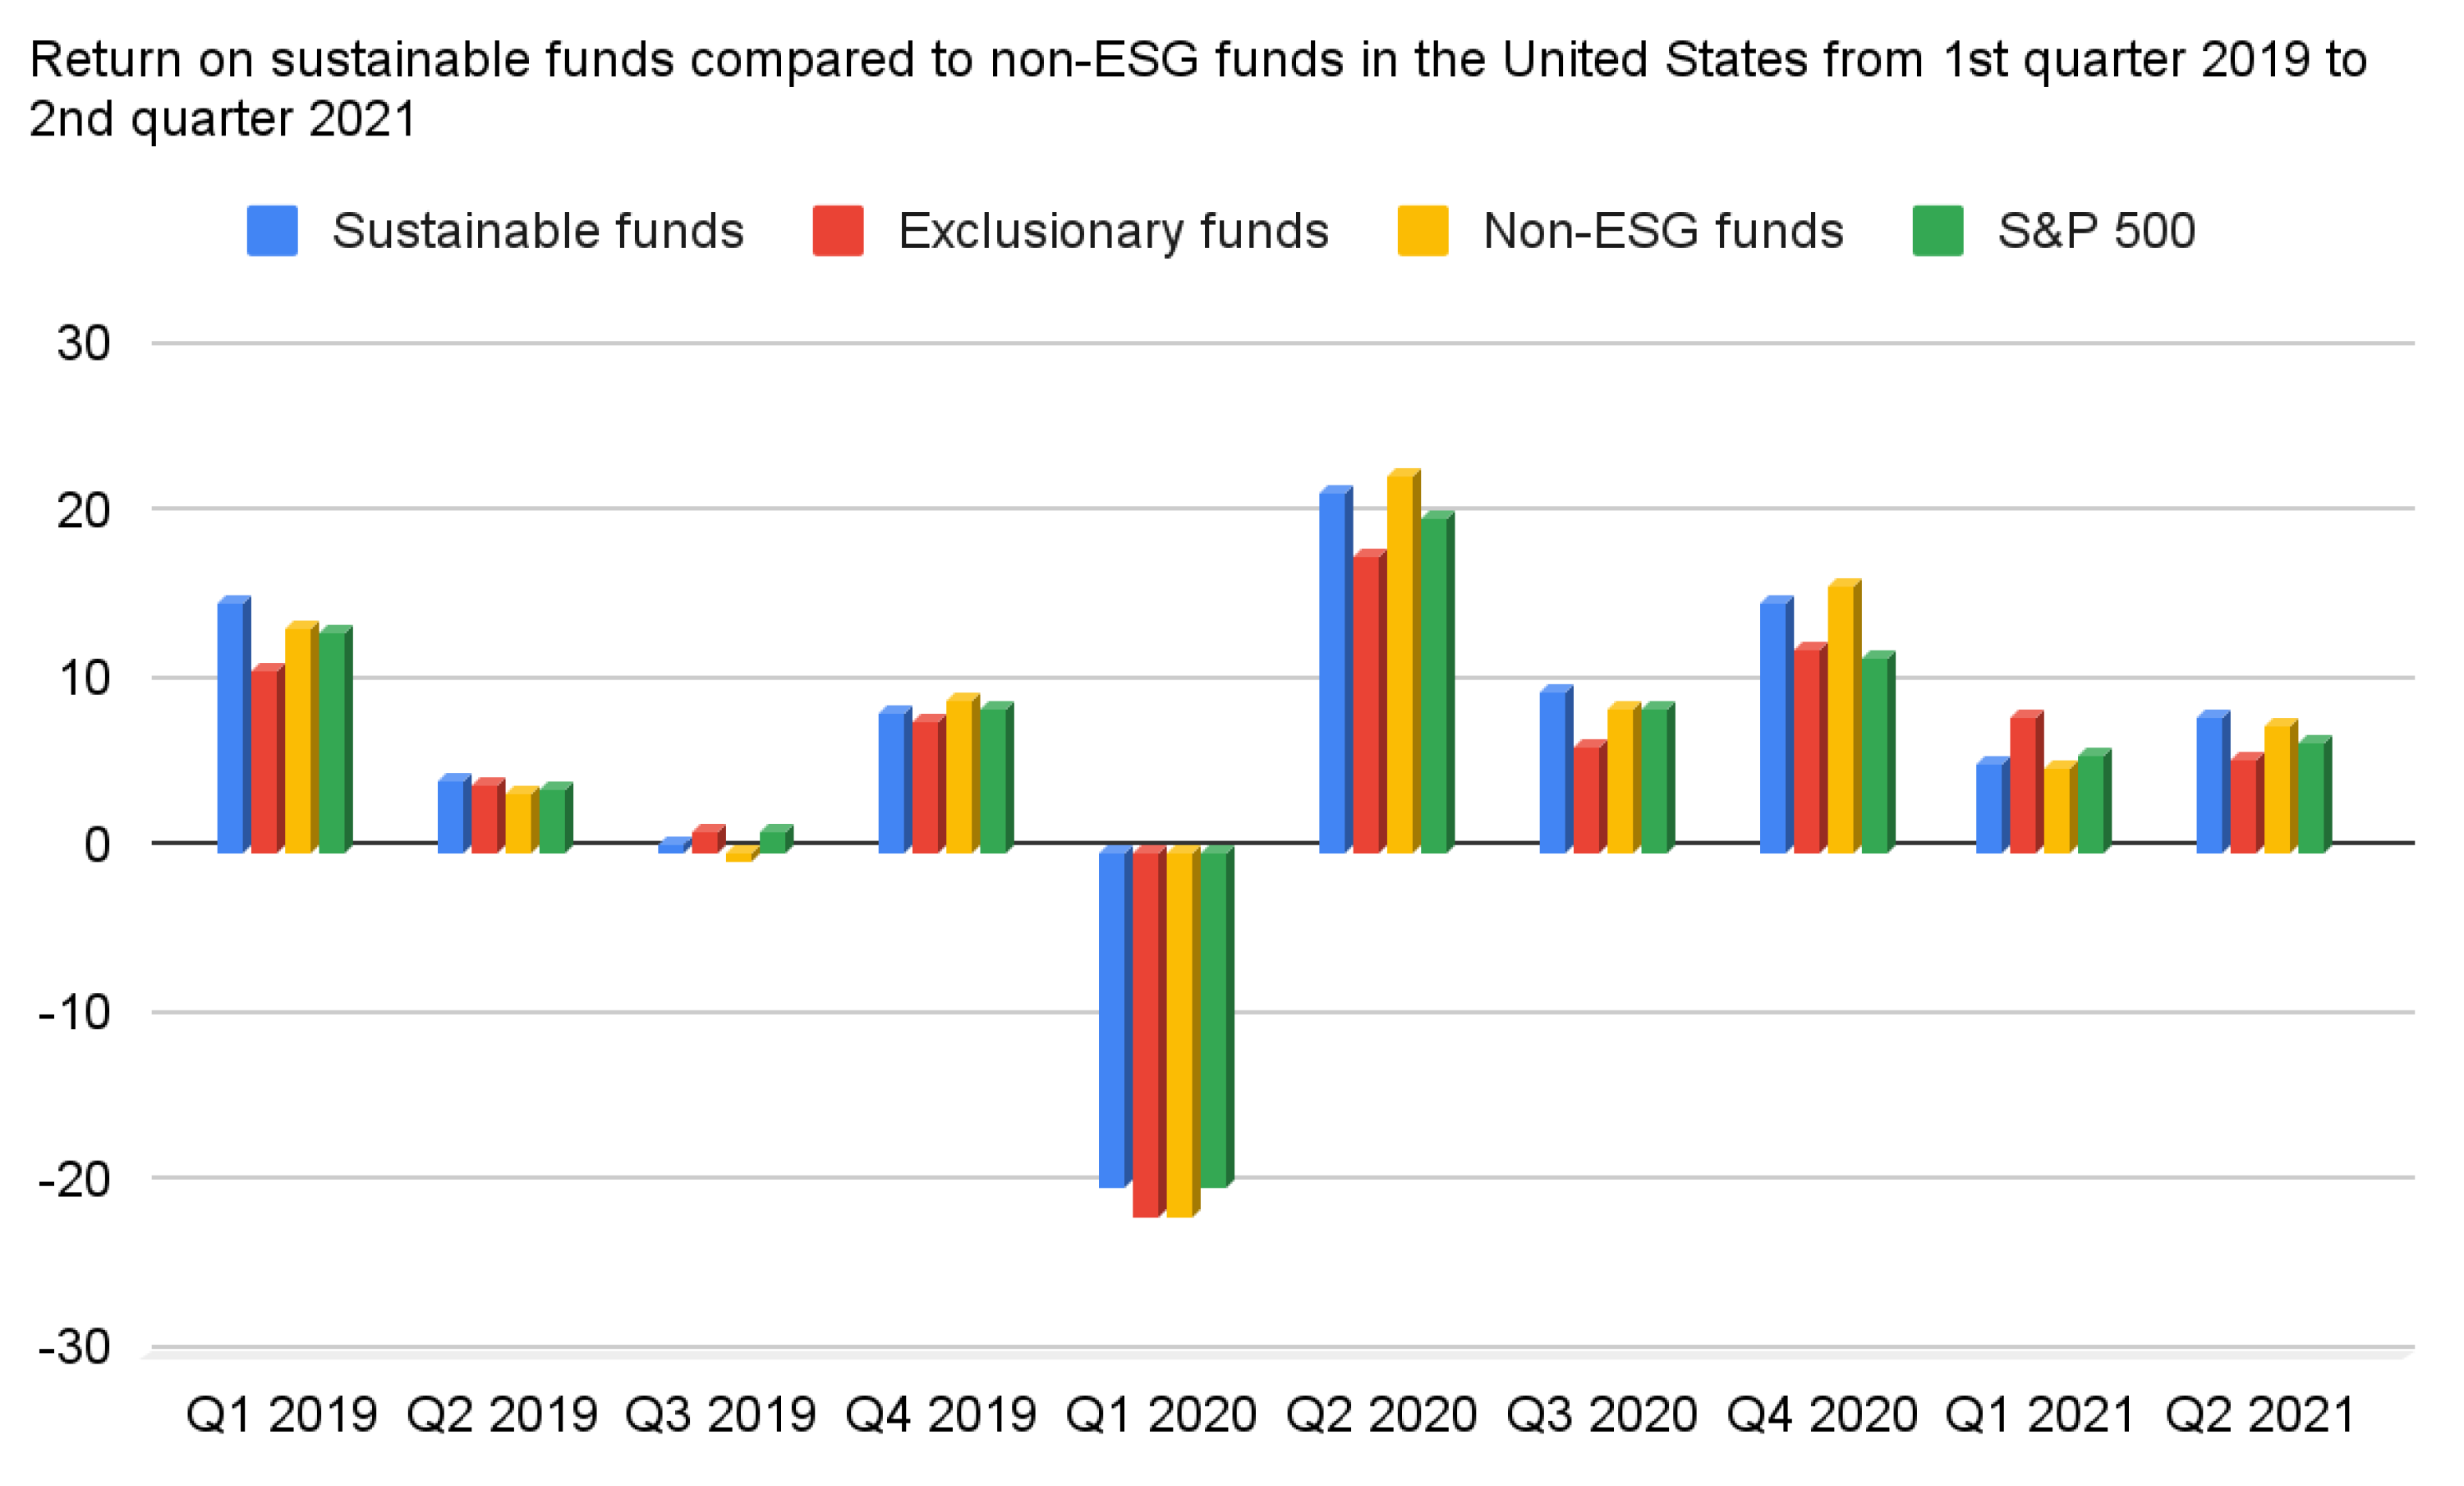
Figure 1 compares the return on investment of ESG-related funds and non-ESG funds. It shows that the return of ESG-related funds is higher than non-ESG funds, which implies the importance of ESG in investments.
However, since interest in ESG has advanced rapidly [
11], the absolute index for ESG has not yet been established [
12], and evaluation criteria differ within the agencies [
13,
14]. The absence of absolute criteria brings chaos to companies and investors [
12], thus the role of ESG experts is being emphasized [
15]. Some researchers suggest AI algorithms [
16,
17,
18] including machine learning and deep learning algorithms to analyze ESG, but collecting the datasets is demanding. Quantitative datasets regarding the environment, such as carbon data, are reachable [
19]. Nevertheless, it is still challenging to gather and standardize social and governance data. Natural language processing (NLP) effectively collects those datasets as numerous social and governance activities are exhibited on social media.
1.2. Objective
This paper suggests diverse AI approaches to analyzing ESG data through machine learning and deep learning algorithms. Various strategies were utilized, including regression, classification, and anomaly detection methods for each dataset: classifying whether investors conducted excellent or bad investments, detecting anomaly data to prevent an adversarial attack, predicting the revenue based on ESG funds, classifying the sentences in the article, and suggesting a straightforward method for predicting own ESG scores. This research focuses on two main objectives: first, examining and analyzing social and governance datasets via NLP algorithms of deep learning. Second, suggesting an explicit method for predicting the company’s ESG scores or rankings.
The remaining part of this paper is organized as follows:
Section 2 reviews related research about the ESG and data analysis.
Section 3 explains the materials and methods used in this paper, including datasets for each experiment, machine learning, and deep learning algorithms.
Section 4 exhibits the results from each experiment with the accuracy score, or root mean square error (RMSE) and mean absolute error (MAE).
Section 5 discusses this research’s principal findings and limitations that are expected to be improved in the upcoming research. Lastly,
Section 6 summarizes and concludes this paper.
2. Related Work
Sharma et al. examined whether considering ESG data points leads to profitable investments while promoting sustainability. The experiment indicated that higher ESG scores lead to better financial performance. ML models such as linear and random forest regression performed better when the training dataset included ESG and financial data. The research pointed out a positive relationship between ESG data and financial growth parameters [
16].
In Margot et al.’s research, a machine learning algorithm was developed to identify patterns between ESG profiles and the financial performance of companies. This machine-learning algorithm is composed of regularly updated sets of rules that map regions into the high-dimensional space of the ESG feature to predict excess returns. The aggregated predictions are converted into scores which are used to screen investments for stocks with positive scores. This machine learning algorithm nonlinearly links ESG features with financial performance. It is an efficient stock screening tool that outperforms classic strategies, which screen stocks based on their ESG ratings. Via powerful and nonlinear techniques such as machine learning, researchers found some form of alpha in an ESG profile of a company [
17].
Gupta et al. presented a framework for conducting statistical analysis and utilizing machine learning techniques to assess the importance of ESG parameters for investment decisions and how they affect financial performance. Return on equity was higher for companies with the best ESG ratings than the rest [
18].
D’Amato et al. identified the corporate structural variables that affect the ESG score. In the numerical results, balance sheet items are a significant predictor of ESG score. Compared to the classical regression approach based on GLM, the random forest algorithm achieves the best prediction performance, demonstrating the ability to capture the nonlinear pattern of the predictors [
19].
D’Amato et al. aimed to evaluate how structural data such as balance sheet items and income statements affect ESG scores for traded companies. A machine learning approach, in particular the Random Forest algorithm, is applied to the Bloomberg ESG scores to investigate the role of structural variables. According to this study, financial statement items adequately explain the ESG score [
20].
Yu et al. utilized machine learning algorithms to unveil the relationship between ESG scores and stock returns based on RANKING CSR Rating Agency data. Compared with non-ESG-related stocks, ESG-related stocks cannot generate excess returns and have risk performance during a normal period [
21].
Chen et al. proposed a machine learning approach to quantify the ESG premium of a company and capture the ESG alpha by using ESG scholar data as alternative data. This research shows that scholarly data-based ESG alpha strategies capture ESG premium better than traditional financial indicators [
22].
Alghofaili et al. aimed to improve the current detection techniques and enhance the detection accuracy in light of big data. The proposed model is evaluated with a dataset of credit card frauds, and the results are compared with the Auto-encoder model and some other machine learning techniques. The results demonstrated that LSTM achieved 99.95% accuracy in less than a minute [
23].
Schultz et al. have developed a method for detecting unusual journal entries within individual financial accounts using autoencoder neural networks. A list of entries that two auditors manually tagged is compared with the identified journal entries. In the comparison, all analyzed financial accounts showed high f-scores and high recall [
24].
Wang et al. applied text classification to an open-source dataset involving news and its relevance to the U.S. economy. Nine classifiers were used for text classification and sentiment analysis, including three traditional machine learning models and six neural network-based methods. Although the reviewed dataset is small and inherently challenging, Bi-LSTM, which has bidirectional dependencies, outperforms LSTM by 30% in multiclass classification [
25].
In Nugent et al.’s research, 31,605 news articles were classified into 20 ESG categories. The study revealed that domain adaptation and data augmentation techniques using ESG data improved classification performance. Using the domain adaptation model ‘Bert’, the proposed model performed a precision score of 0.84 and an f1-score of 0.75 [
26].
Guo et al. utilized data from 50,000 ESG news. The research examined the impact of ESG issues in financial news and analyzed the predictive power of ESG news on stock volatility. ESG news articles are extracted and converted into numerical figures using a transformer-based language model and sentiment analysis. Transformer Language models or text embedding convert symbolic text into dense numerical vectors maintaining the meaning-relatedness of text in the numerical space. Bayesian inference enables stable learning and predicting in the training and inference phases. This research method measured the stock market’s volatility with RMSE and MAE [
27].
We could figure out various methods to analyze ESG data from those works above, such as machine learning and deep learning algorithms. However, those papers missed two specific points: adversarial attacks and ESG score. Even though adversarial attack issues are critical nowadays, the research did not cover this issue. Though extracting the ESG score of the companies is vital, those researchers do not suggest a method for calculating the score; they only proposed various methods of analyzing the ESG data. Therefore, our research also focuses on these important issues.
3. Experimental Setup
3.1. Experiment #1: Classifying Whether the Investment Is Good or Bad
For the first experiment, the dataset from the Kaggle website was utilized, which could be accessed via
https://www.kaggle.com/imanolrecioerquicia/400k-nyse-random-investments-financial-ratios (accessed on 12 November 2021) [
28]. This dataset, organized as shown in
Table 1, classified the target variable ‘investment’ as to whether it is good or bad. Various financial variables, such as “EPS ratio”, “inflation”, “roe ratio” and “expected ratio” are included in the dataset, which was gathered from over 400,000 random investments in the NYSE market during the previous ten years. The dataset consists of 405,258 columns and an “ESG rating” row, representing the ESG index. For accurate analysis, the dataset was pre-processed through the MinMax scaler and checking/filling null values. Subsequently, various machine learning algorithms analyzed the preprocessed dataset, and the result was evaluated with the accuracy score.
3.2. Experiment #2: Unveiling the Impact of Noise on the Financial/ESG Data
Poisoning attacks, evasion attacks, and model extraction are examples of adversarial attacks [
29]. Since an adversarial attack is a critical issue in AI fields, we tried to disclose the impact of the adversarial attacks and how to detect them. From those attacks, our main target of the experiment is to uncover a poisoning attack, which attacks the training dataset. The same dataset was used in the second experiment. As this experiment aims to unveil the impact of the noise in the financial dataset, Gaussian noise was added to the dataset. The same preprocessing steps were operated, as mentioned in the first experiment. Then, we compared the result of the first experiment with the Gaussian noise. After the comparison, we proposed anomaly detection models that efficiently detect the noise in the given dataset. Local Outlier Factors (LOF) were utilized in the anomaly detection to clarify how our models effectively catch the noise-added data. Through this experiment, we could figure out the potential danger of adversarial attacks, which reveal significant financial data.
3.3. Experiment #3: Predicting the Financial Performance through ESG Data
Since the previous research suggested that the ESG ratios could affect financial return, the third experiment was set up to prove the hypotheses. The data can be accessed through the website:
https://www.kaggle.com/datasets/patrickgaspar/fossil-free-funds (accessed on 18 March 2022) [
30]. The description of the Kaggle site mentions that they collected the dataset from
https://fossilfreefunds.org/ (accessed on 18 March 2022) [
31], which unveils whether our savings are invested in fossil funds. The structure of the dataset is shown in
Table 2. For the experiment, indicators that are not ESG-related and rows and columns with missing values were removed. The train-test split function from the Scikit library was applied, and then the Robust scaler was utilized to minimize the impact of the outlier data. Specifically, the train dataset’s proportion is 70% and the test set is 30%. As well, the hyper parameter of the Robust scaler was set as its default. In consequence, various machine learning algorithms were evaluated with mean absolute error (MAE) and R-squared error.
3.4. Experiment #4: Classifying the News Articles into E, S, and G Labels
Recent research focuses on analyzing corporations’ ESG issues via text mining. Since gathering datasets about social and governance is quite difficult, we collected them by crawling the news datasets about specific companies. The news dataset was gathered from the Korean website “Naver” for the final experiment. Titles and articles of the news were collected through the crawling method. For each article and title, if the contexts were related to the environment, social, and governance, “E,” “S,” and “G” were labeled, respectively.
Table 3 indicates the dataset’s overall structure. Tokenization, lemmatization, and removing Stop Words methods were selected for the processing since the dataset is based on natural language (Korean). Thereafter, deep learning models, including gated recurrent unit (GRU), long short-term memory (LSTM), and bidirectional LSTM (Bi-LSTM), classified the labels and calculated the accuracy score of the proposed models.
3.5. Calculating ESG Scores through Financial Data
Since there is no objective and absolute method for calculating ESG scores, ESG scores differ in various institutions. Furthermore, small businesses find it more difficult to calculate their ESG scores. Therefore, through this experiment, our paper suggests a simple and powerful method for predicting the companies’ ESG scores from the financial data. The same dataset in the first and second experiments was utilized. Since the purpose of this experiment is to provide a simple and effective method for small businesses to calculate their ESG scores, a few financial-related input variables were included: “amount” (number of dollars invested), “nominal return”, “PE_ratio”, “EPS_ratio”, “PS_ratio”, “PB_ratio”, “NetProfitMargin_ratio”, “current_ratio”, “ROA_ratio” and “ROE_ratio”, as shown in
Table 4. The target variable is the ESG index in the dataset. Our model enables small businesses to predict their ESG index through machine learning algorithms and to compare the score with major companies such as Amazon and Apple.
3.6. Experiment Pipeline
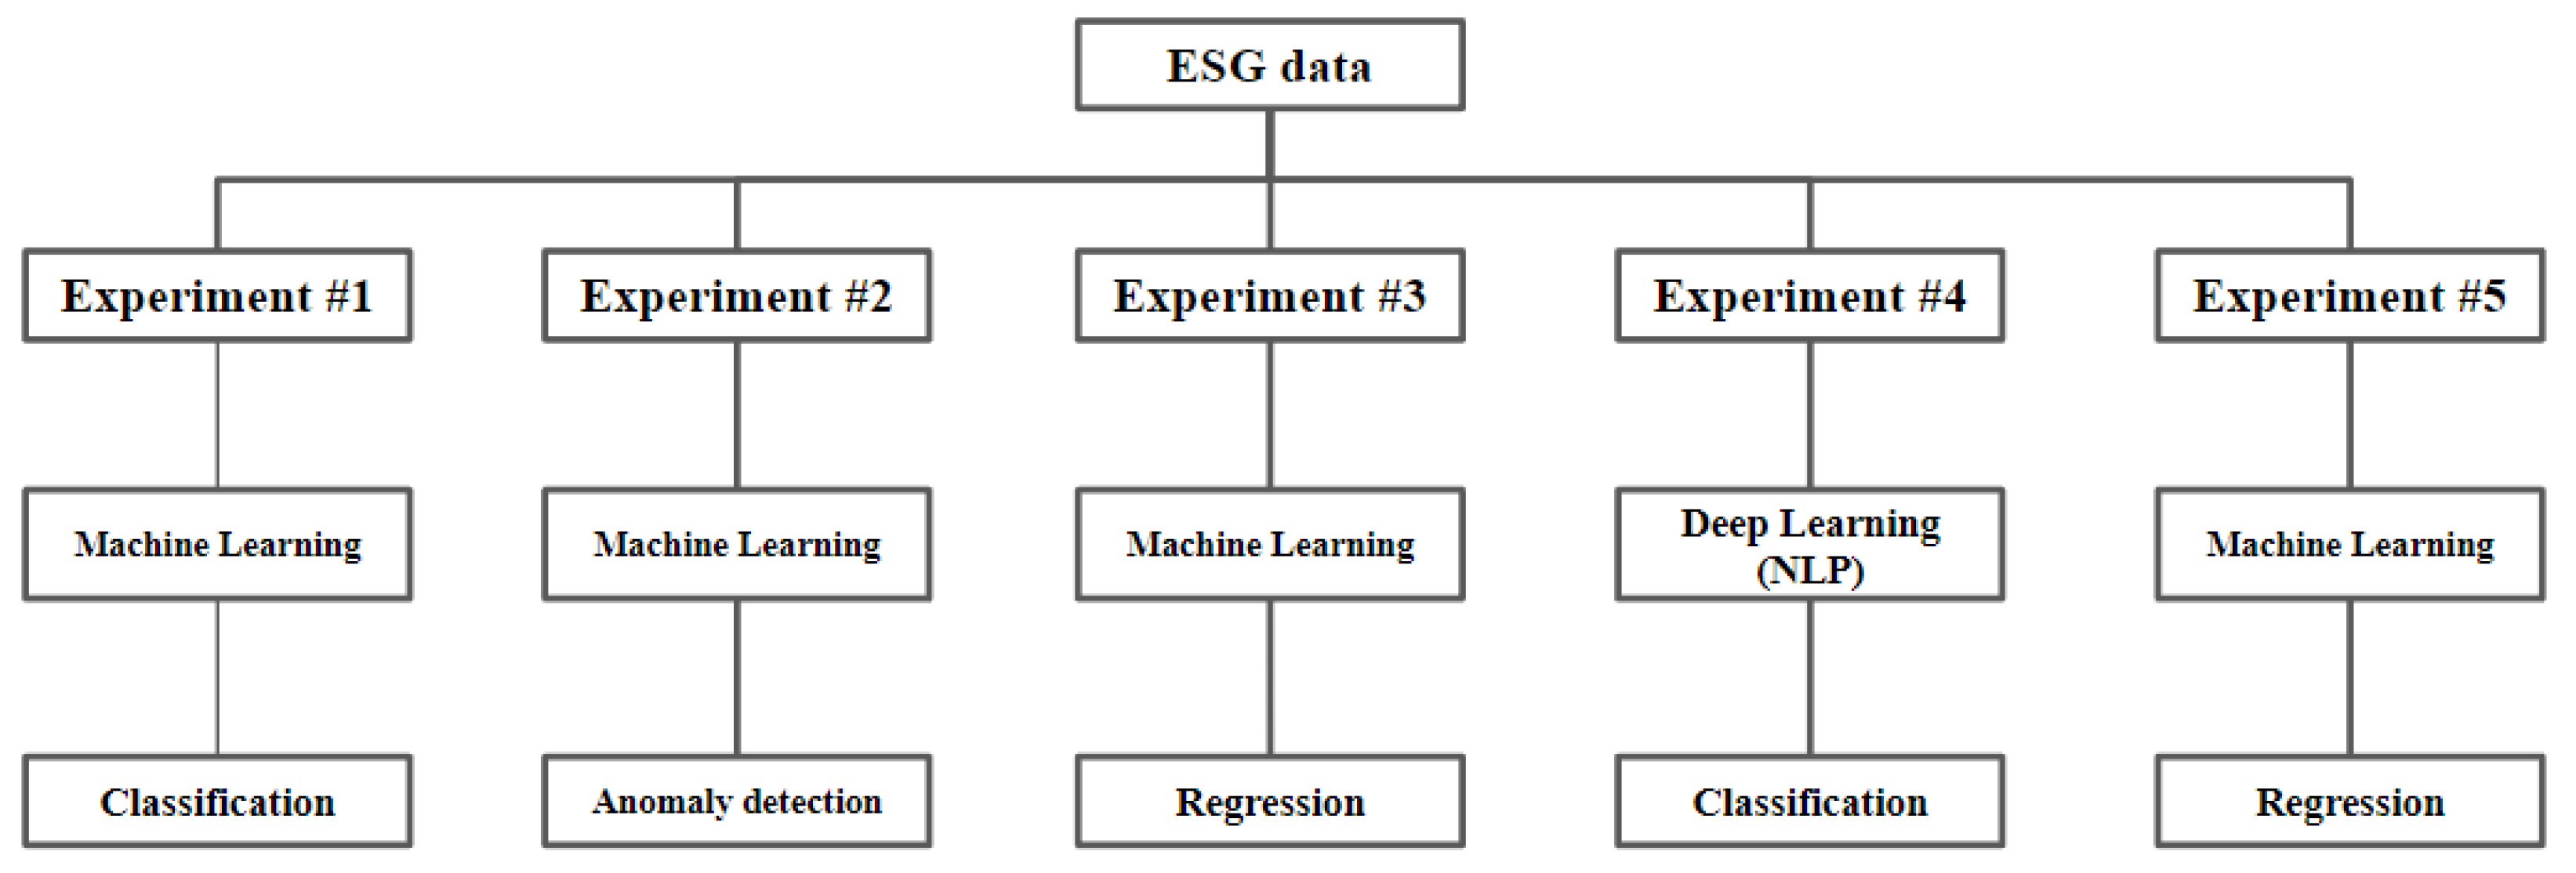
As mentioned above, our experiment consists of five different artificial intelligence-based experiments. Even though those experiments have the commonality that they are ESG data-based analyses, each represents different machine learning approaches to classification, anomaly detection, and regression.
Figure 2 shows the entire pipeline of our experiments.
4. Materials and Methods
4.1. Light Gradient Boosting Machine
The Light Gradient Boosting Machine (LGBM) is an innovative method created to address the drawbacks of conventional boosting methods, such as gradient boosting and Extreme Gradient Boosting (XG Boosting). When dealing with a dataset with many dimensions, the techniques could not deliver successful outcomes since they took a long time to compute. Gradient-based One-Side Sampling (GOSS) and Exclusive Feature Bundling were used to apply two novel techniques to the LGBM (EFB). The GOSS only remains the variables with high information gain, so it could efficiently remove the computation time by reducing the number of variables. The EFB is a highly effective technique, especially for the highly sparse dataset which went through One-Hot encoding. These techniques allow the LGBM to overcome the traditional boosting algorithms’ downsides and become one of the most widely used algorithms in data analysis competitions, such as Kaggle [
36].
4.2. Local Outlier Factors
Local outlier factors (LOF) were mainly invented to determine how much each observation deviates from the provided dataset. LOF effectively achieves its objective using the neighbor of the observation to estimate the degree of an outlier from a local perspective rather than considering whole datasets. The density between each data point and its neighbor points is used to determine the outlier, which means that if the density of the point is less, it is more likely to be classified as the outlier. The LOF is derived from “
k-distance of a data point
p”, “
k-nearest neighbors of
p”, “Reachability distance of
p concerning
o”, “Local reachability density of
p”, and “LOF of
p”. [
37,
38].
Definition 1. K-distance of data point p.
The mathematical expression denotes the first definition used in the LOF: A Euclidean n-dimensional space is used to determine the distance between the two data points
p and
o.
Definition 2. K-nearest neighbors of p.
K-Nearest Neighbors (KNN) of
p denotes any data point
q whose distance to the
p data point is not larger than the
k-distance. As shown in the Equation, the K-Nearest Neighbors of
q constitute the so-called
k-distance neighborhood of
p (2).
Definition 3. Reachability distance of p concerning o.
The expression denotes the reachability distance, which is a distance between data point
p and data point
o 4.3. Long Short Term Memory
Long short-term memory (LSTM) is one of a recurrent neural network (RNN), one of a deep learning algorithm. Deep neural networks (DNNs) are one-way networks in which input data passes through neural networks. RNNs differ in the overall network structure. The output from the RNN node becomes an input to the same node, which is called a “recurrent”. RNN model has the disadvantage of a vanishing gradient problem and LSTM overcomes it by including ‘cell state’. This allows the LSTM to preserve information for a long time. The entire architecture of the LSTM includes an input gate, an output gate, and a forget gate [
13,
39].
4.4. Gated Recurrent Unit
The gated recurrent unit (GRU) is also an RNN-based algorithm and has a similar architecture to the LSTM. In comparison, the LSTM consists of three gates whereas GRU consists of the reset gate and the update gate. The reset gate aims to clear the historical data from previously hidden levels. The sigmoid function is used as an output activation function after multiplying the value (0,1) at the previously hidden layer. The update gate determines a proportion of retaining previous information and corresponding current information. By multiplying the reset gate and the previous hidden state in the current hidden state, it decides on information to erase from the previous time step. Lastly, the final hidden state seeks to compute the hidden layer at the current moment by merging the results of both the update gate and the candidate hidden state [
40,
41].
5. Experiment Result
5.1. Result of Experiment #1
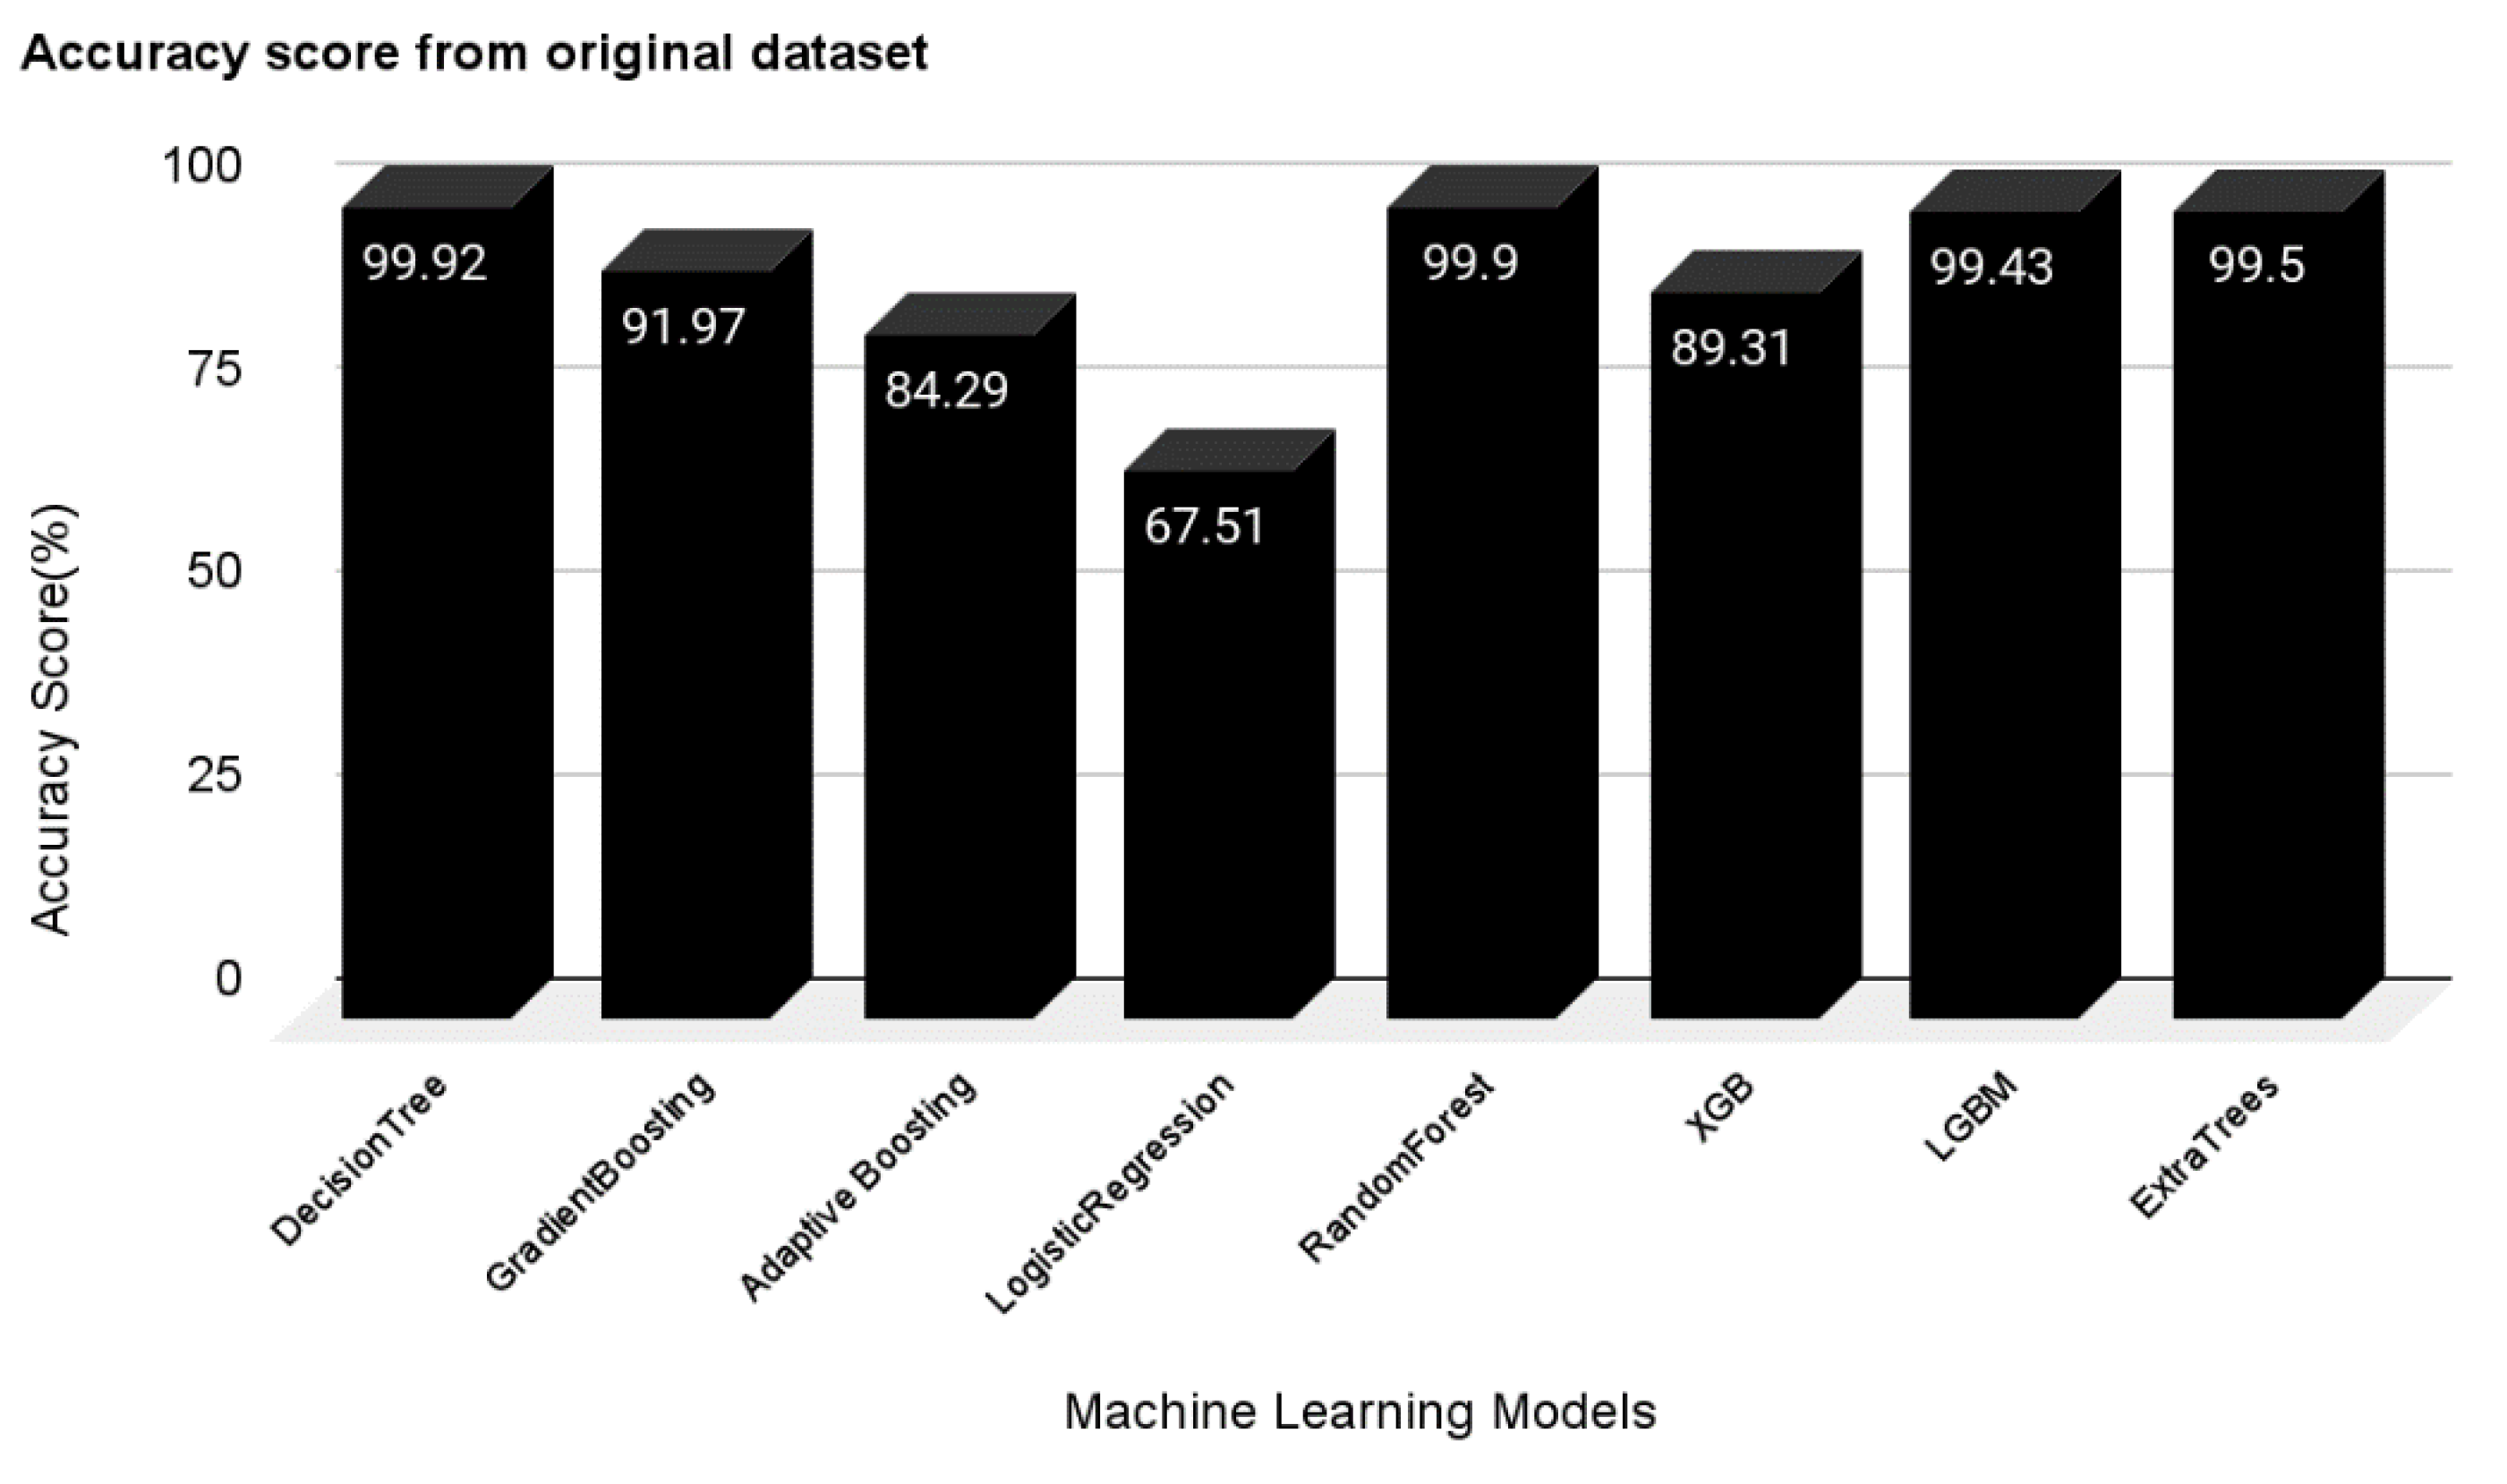
Multiple machine learning algorithms, including decision tree, logistic regression, gradient boosting, adaptive boosting, random forest, XG boosting, LGBM, and extra tree were used in the first experiment. As shown in
Figure 3, the results demonstrate that most of the classifiers performed well with more than 90% accuracy. While only logistic regression obtained 67.51%. LGBM, extra tree, gradient boosting, and decision tree, in particular, achieved greater than 99%. The hyper-parameters of every machine learning algorithm used in this experiment were set as their default.
5.2. Result of Experiment #2
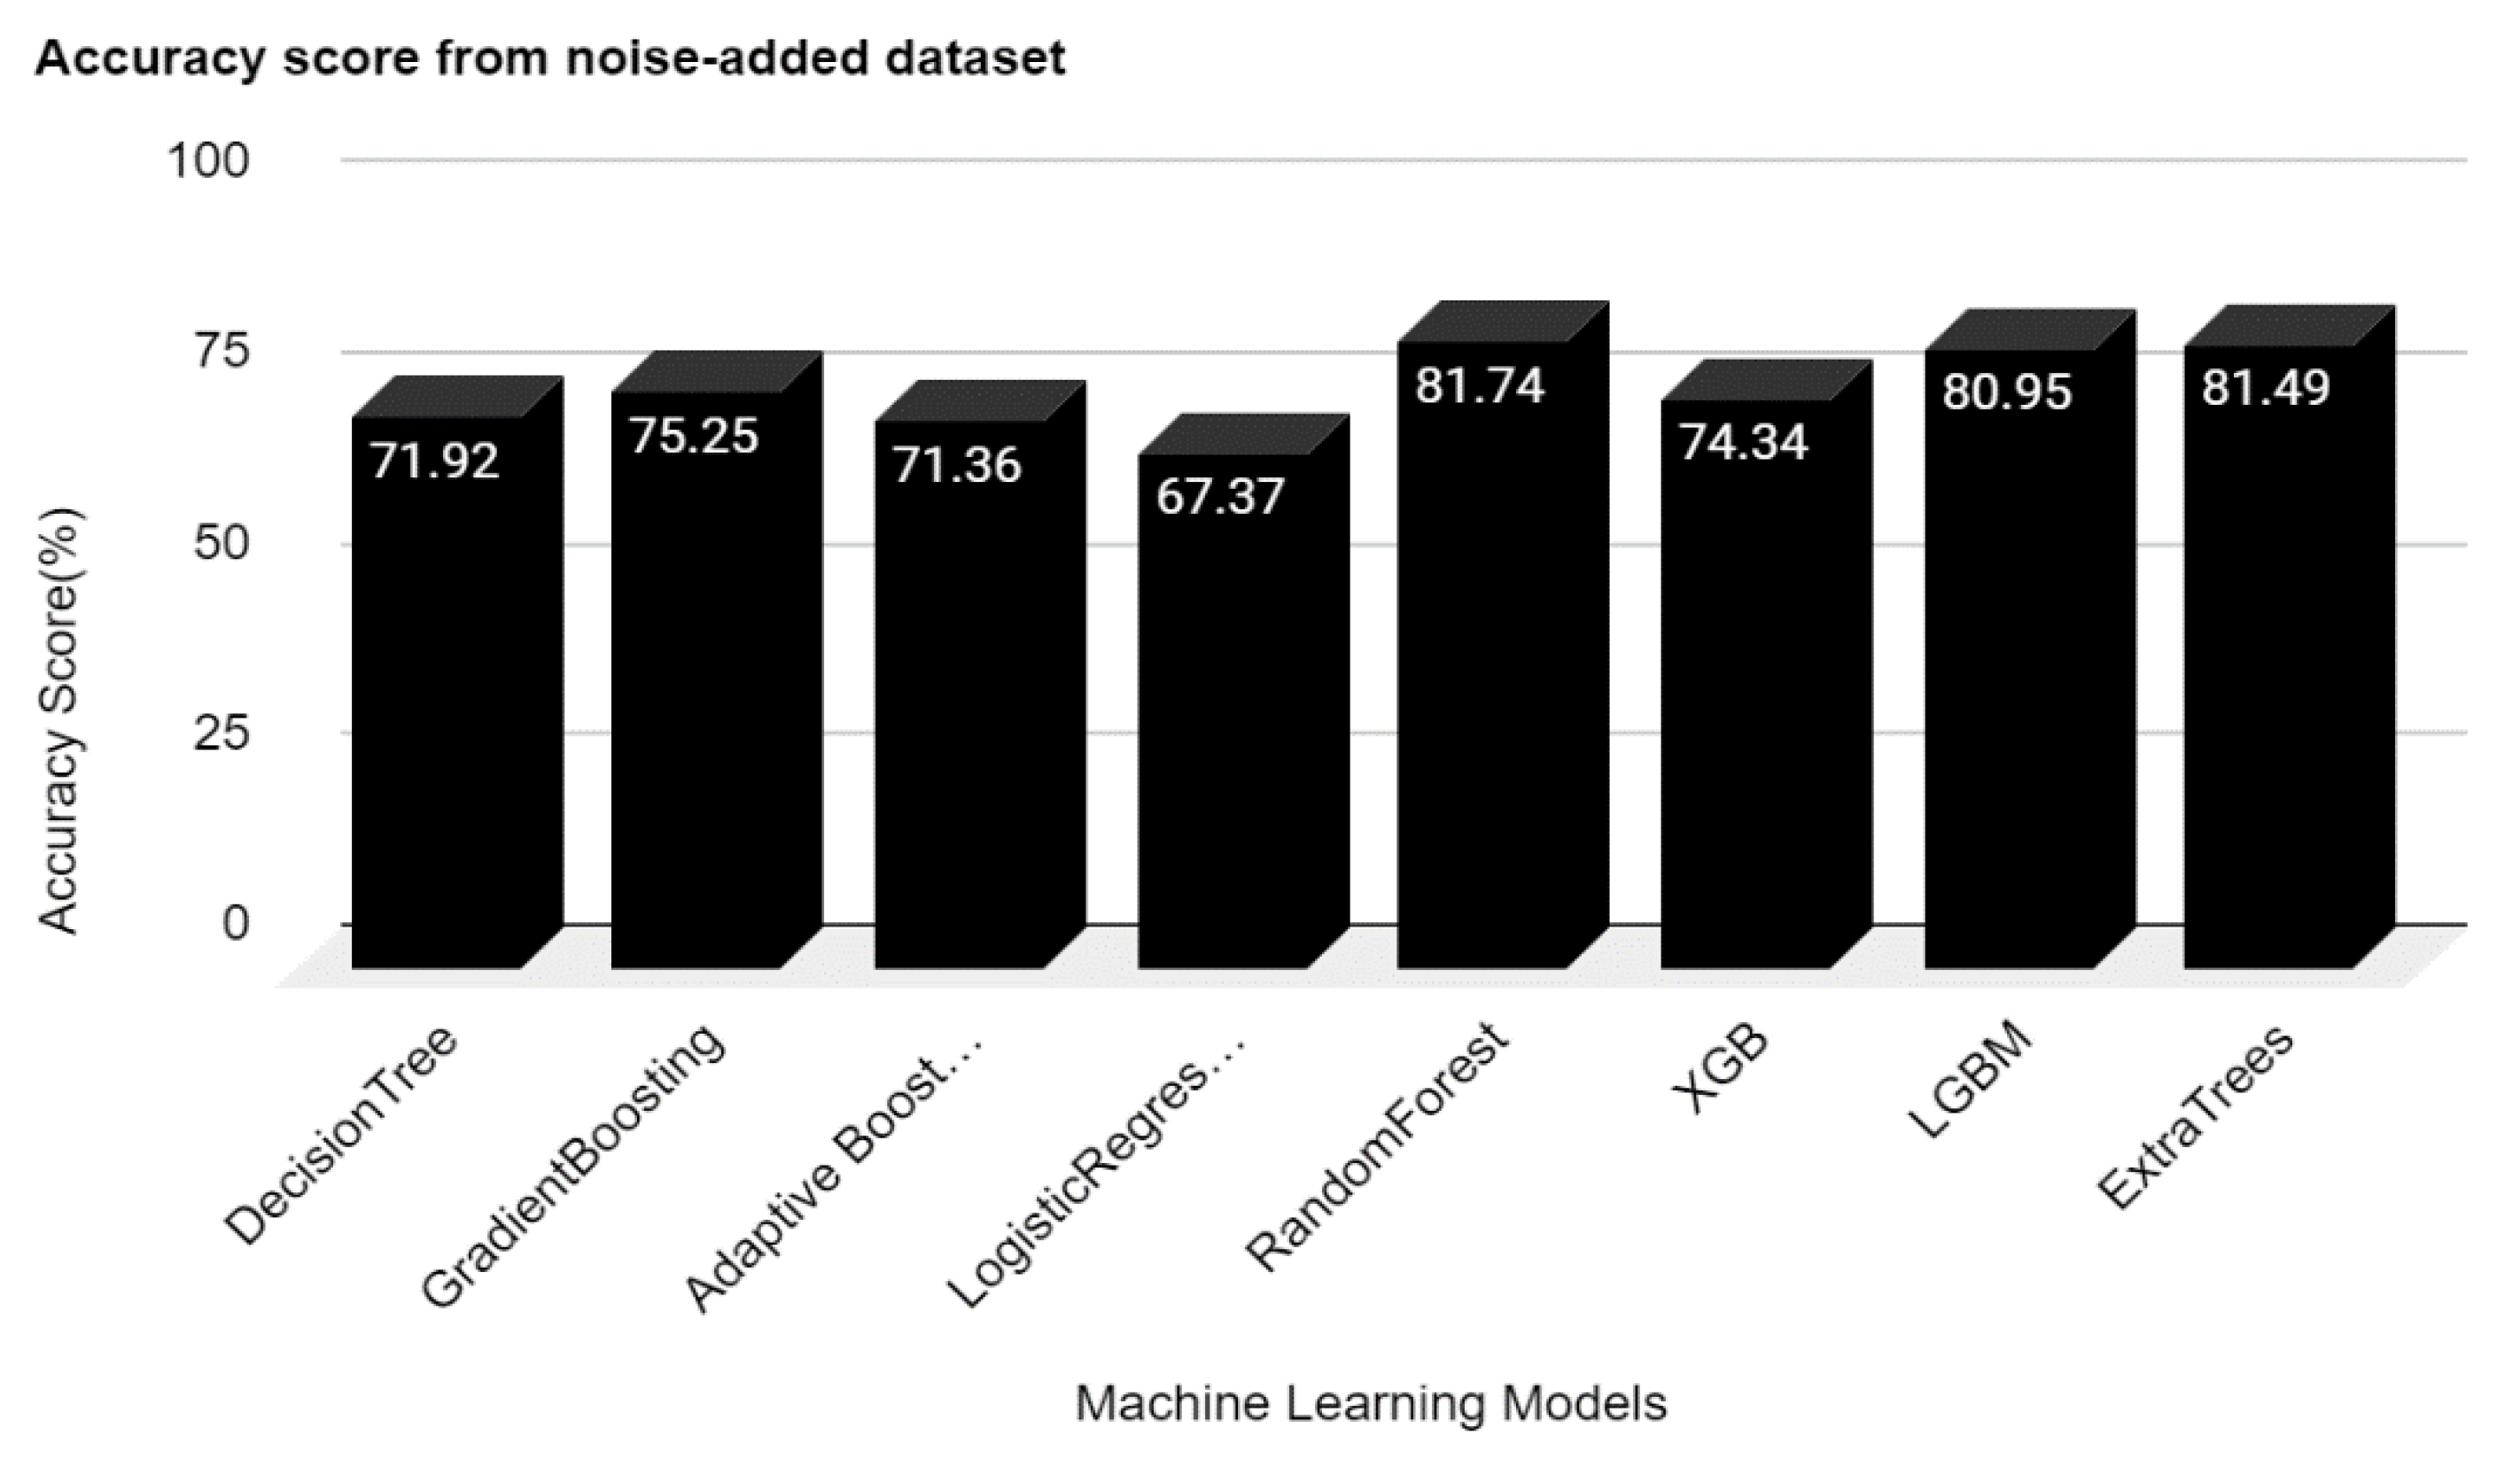
The overall accuracy of the classifiers was diminished in the second experiment after incorporating Gaussian noise into the training dataset. LGBM had the most remarkable accuracy of 88.5 percent, which dropped from 99.5 percent. Other algorithms with greater than 99 percent accuracy lost about 15 percent of their accuracy, as
Figure 4 indicates. These findings show that the noise data significantly influence the accuracy of the suggested machine learning models. It also revealed a potential threat of noise data, which an adversarial attack might trigger. Furthermore, none of the hyper parameter tunings was utilized; all models were set as default.
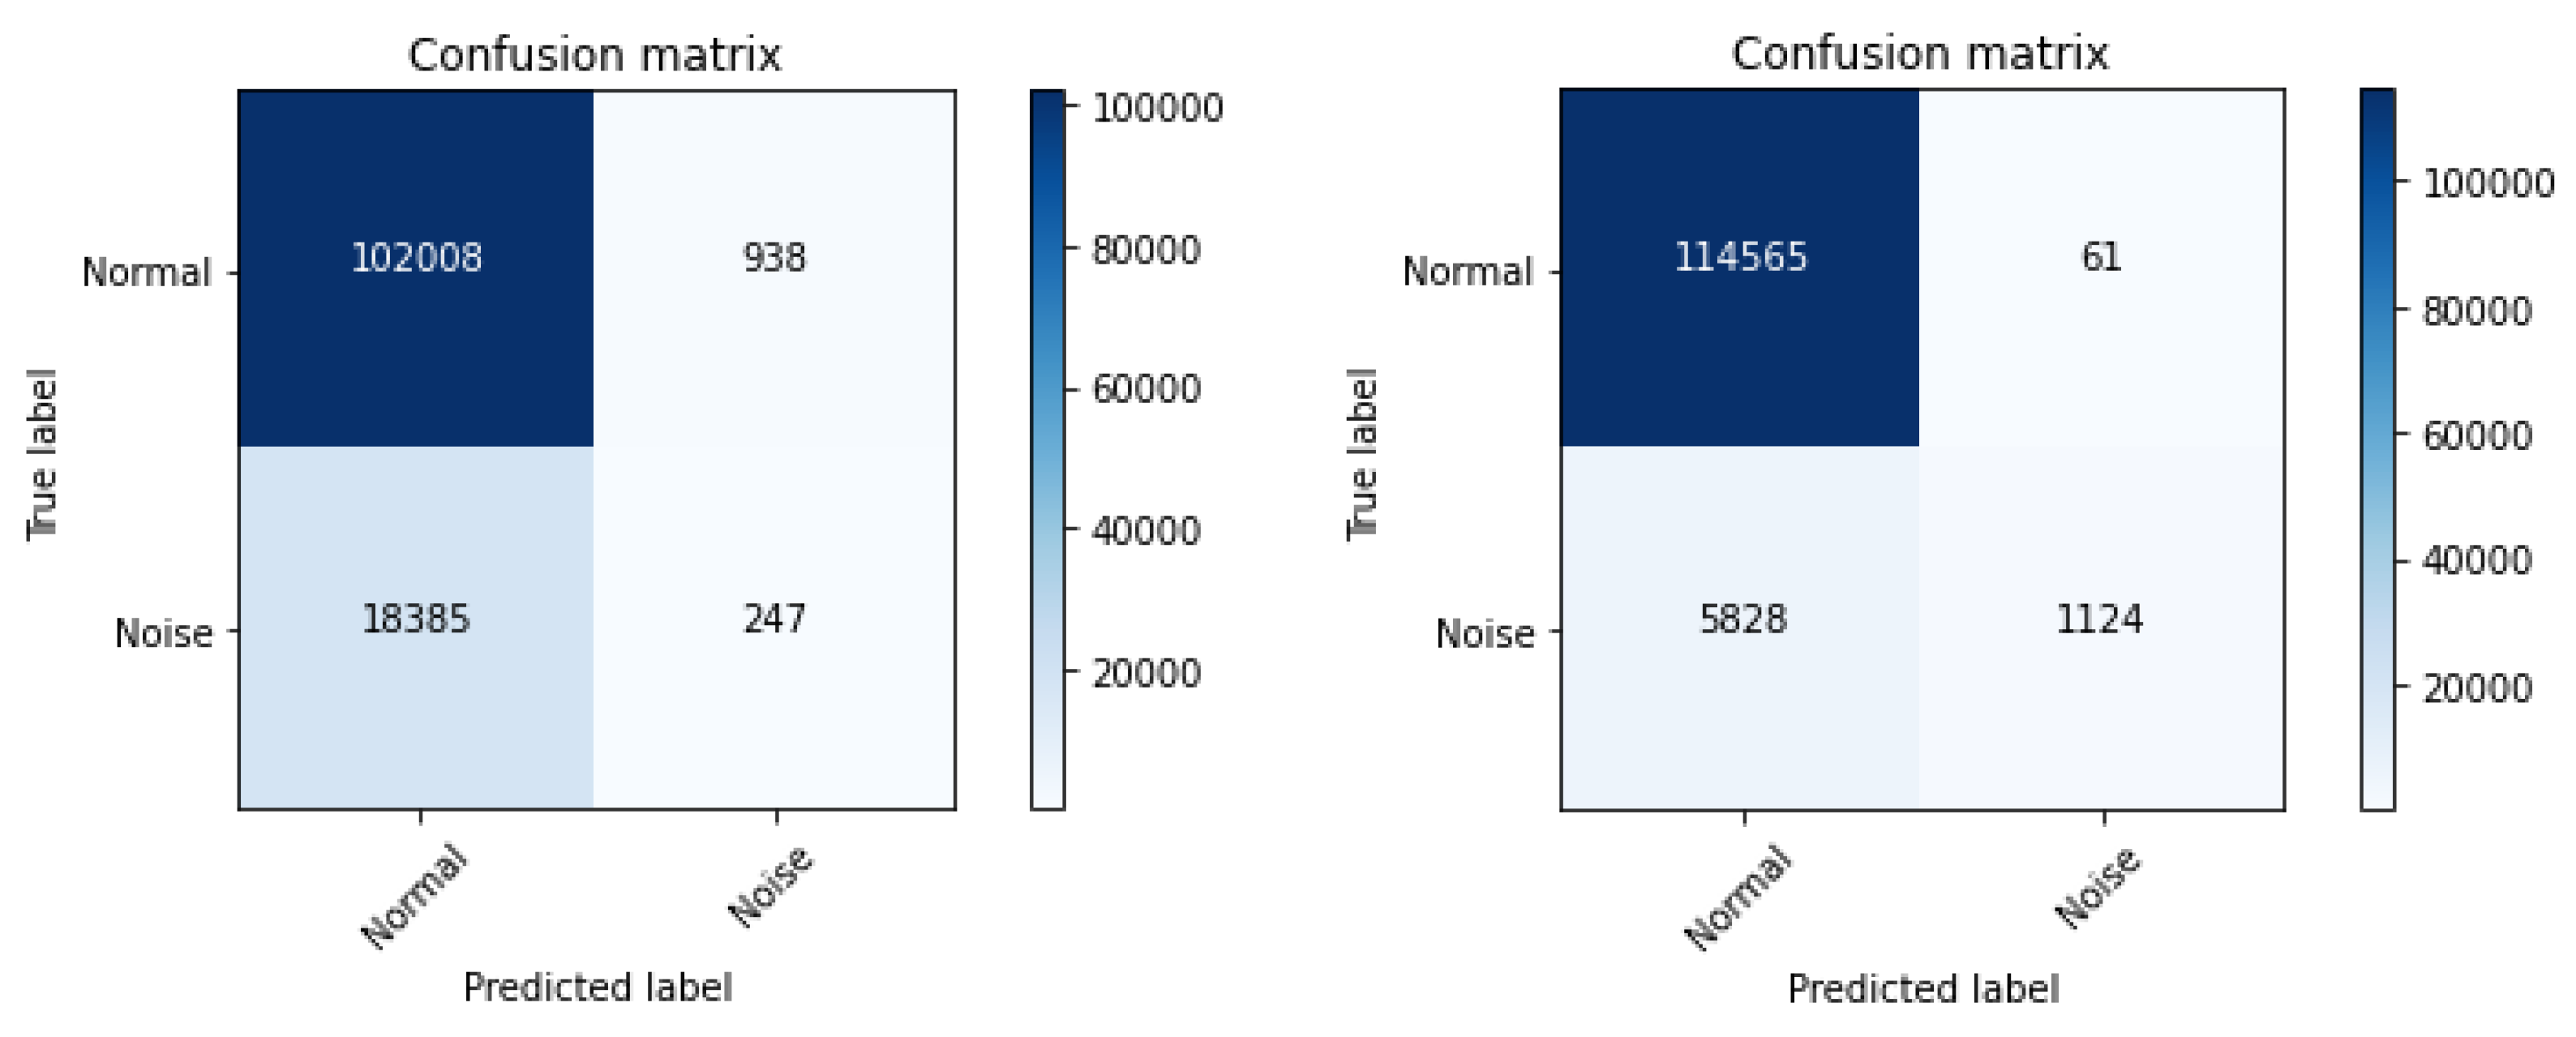
After the comparison, the dataset was manipulated to see if the noise in the data could be detected. As a result, the previous target column “investment” was removed, and the new variable “noise” was introduced as its alternative. The “noise” column only had 1 and 0 values, indicating noise and standard data respectively. The modified dataset contains just 1% of the noise data; the rest is standard data. Two ideal anomaly detection techniques, local outlier factors (LOF) and isolation forest (IF) discovered the noise data. The unsupervised anomaly detection model’s accuracy on the test set was 84.1% by IF and 95.156% by LOF. In addition,
Figure 5 illustrates a confusion matrix for each outcome. Outcome shows the possibility of detecting the noise data effectively to prevent an adversarial attack.
5.3. Experiment #3: Predicting the Financial Performance through ESG Data
In Experiment #3, the fund’s annual return was obtained from various machine learning and deep learning techniques. MAE evaluated LGBM’s prediction as 1.78, deep learning GRU as 0.9821, and random forest as 0.6677, as shown in
Figure 6. Foremost, Extra Tree regression’s annual return prediction resulted in 0.5849 of MAE, which was the best performance of all models. This experiment concluded that ESG indicators could help predict the fund’s annual return with a minor error, which implies that ESG indicators have a positive relationship with the fund’s annual return. If funds, investors, and companies can predict returns within a small margin of error, it is expected to help various stakeholders’ decisions about the fund. None of the hyper parameter tunings were used; all algorithms were used in their default configurations.
5.4. Experiment #4: Classifying the News Articles into E, S, and G Labels
A multi-classification study was conducted to classify three fields: Environment, Social, and Governance in this experiment. The highest score of prediction was 0.8582 when the classification was conducted using embeddings and Bi-LSTM without processing Stop Words. However, the highest score was 0.8936 when the prediction conducted embeddings and Bi-LSTM after processing the Stop Words. The experiment proved that classifying the articles into E, S, and G labels is efficient as the proposed model yields about 90% of accuracy. It also explained that institutions can easily find specific companies’ ESG activities efficiently through online articles. Furthermore, from the company’s perspective, they must respond quickly to important ESG issues to protect their image and value since various issues of companies spread rapidly to the world through the media. This finding could help them respond more efficiently. For hyper parameter tuning, the learning rate was set at 0.001; the sigmoid function was used for the activation function.
5.5. Experiment #5: Calculating ESG Scores through Financial Data
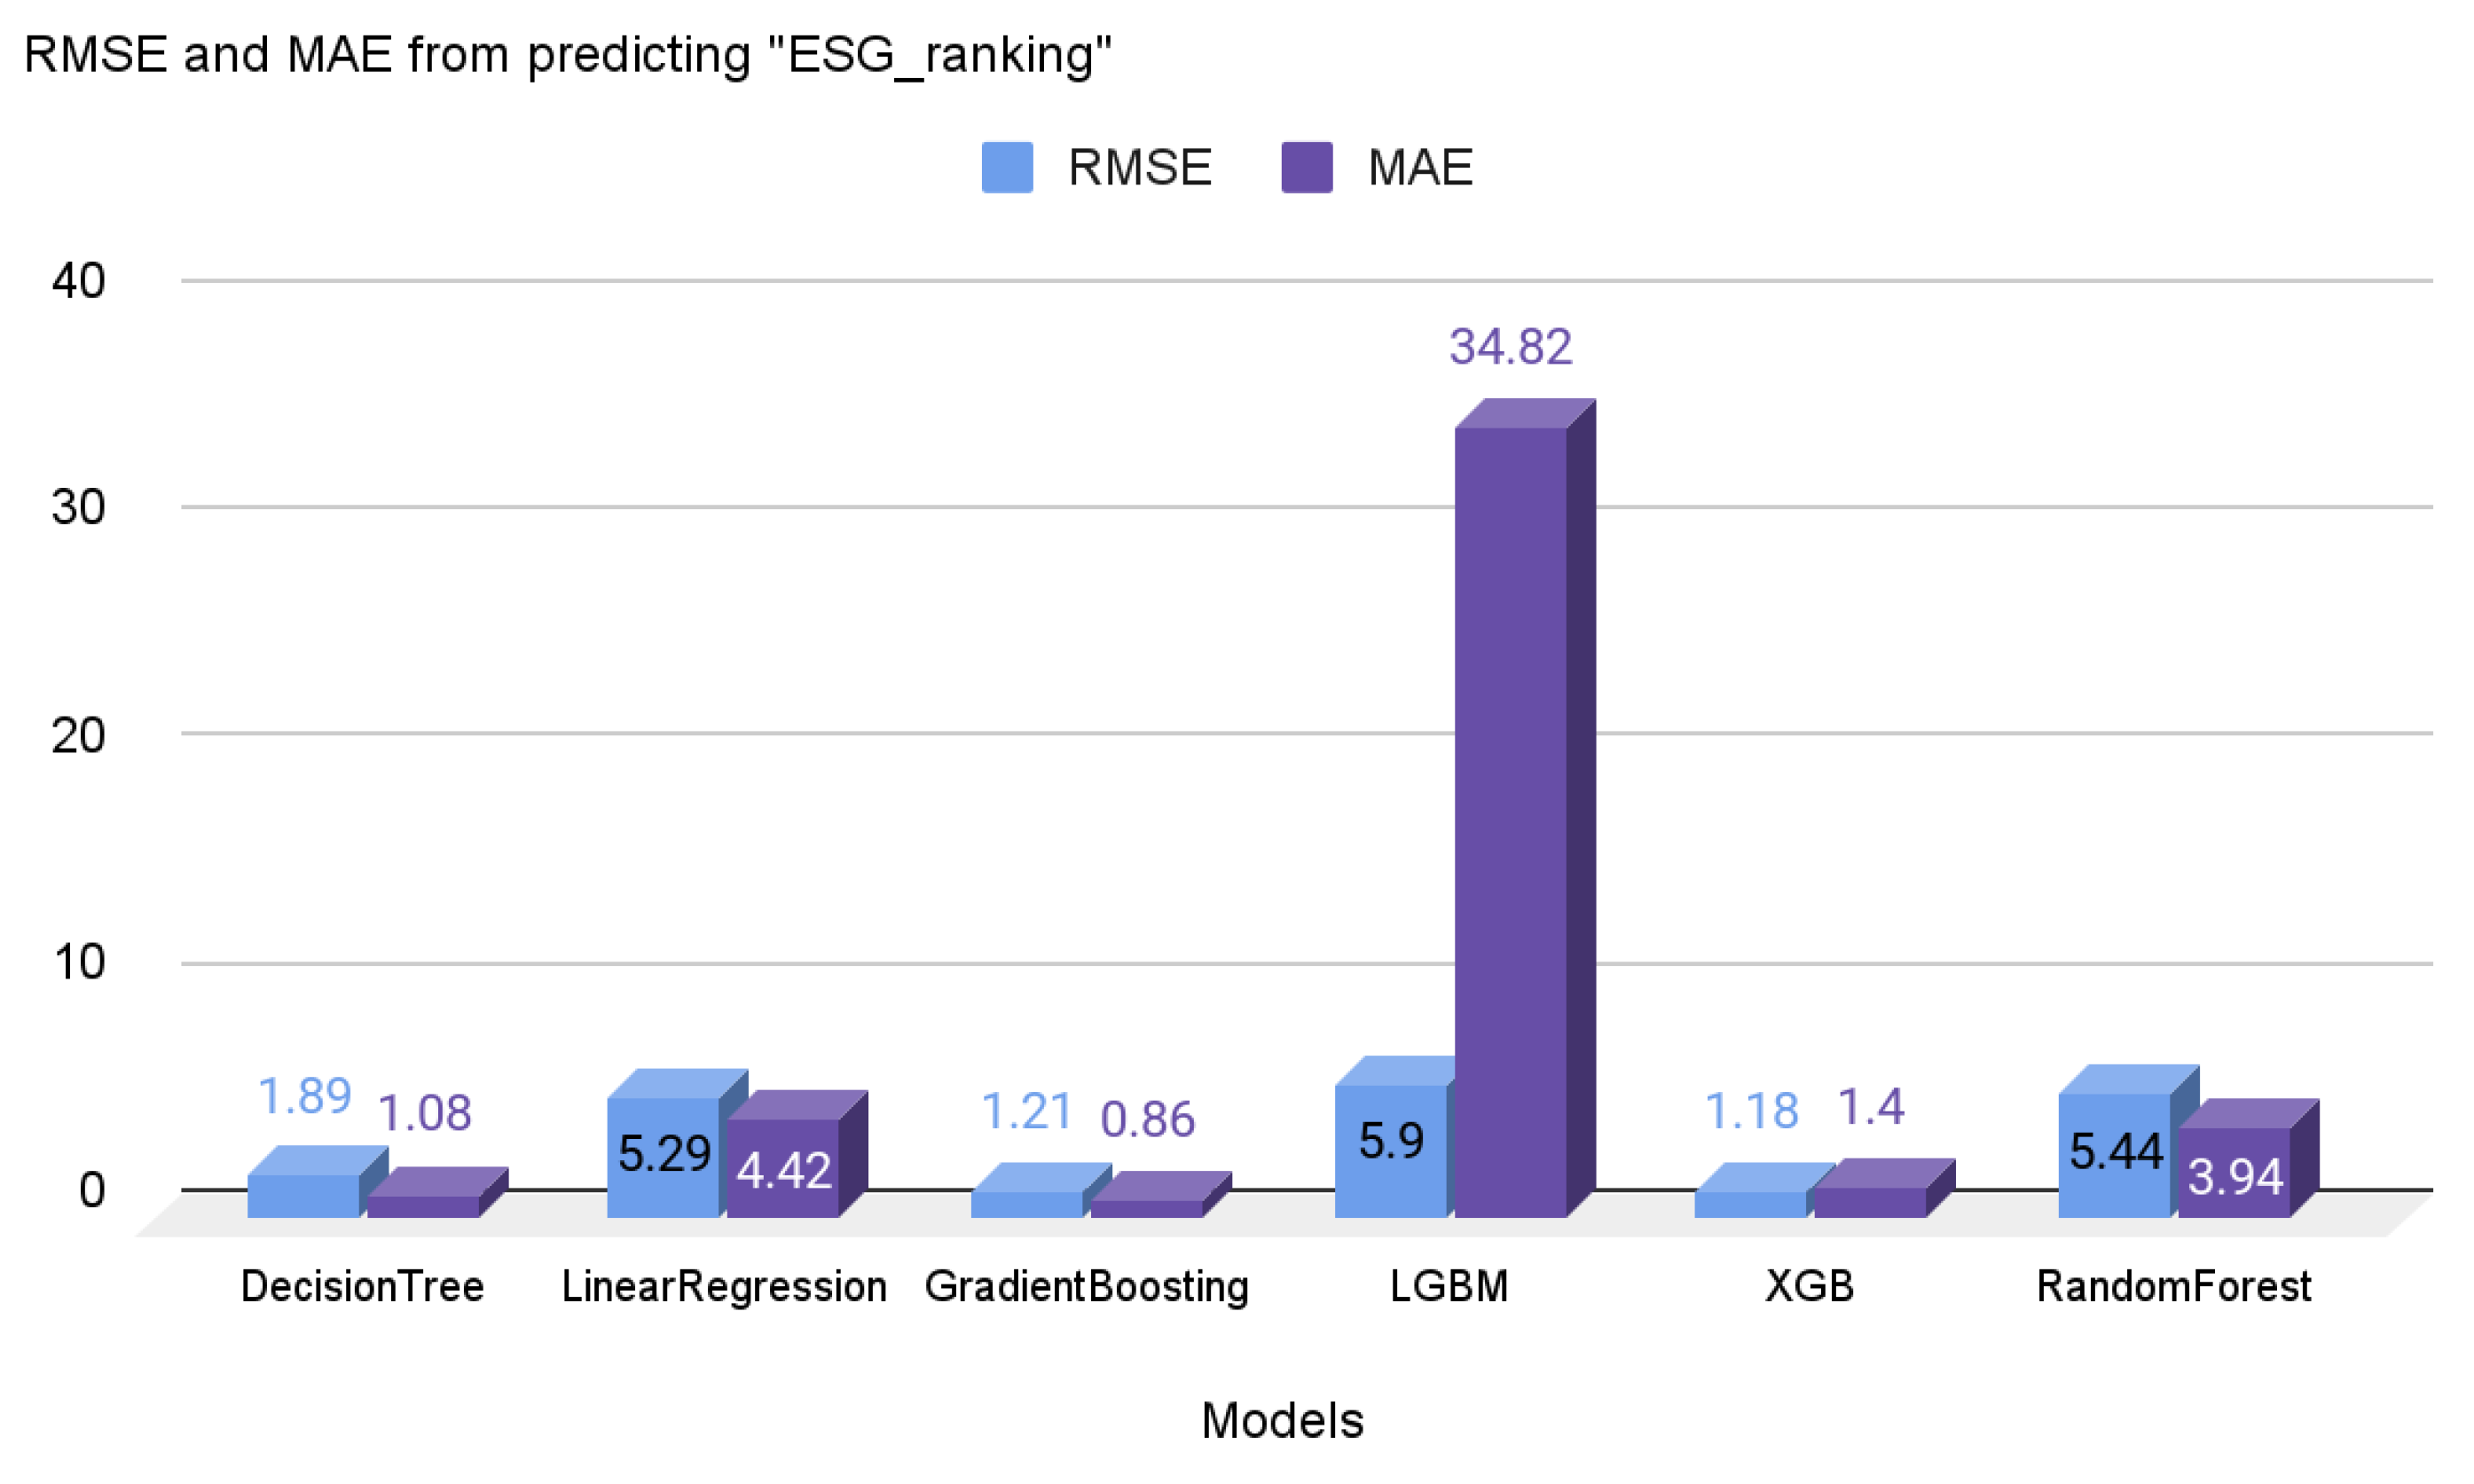
Experiment #5 is about predicting ESG scores through machine learning algorithms. As mentioned above, only financial-related variables were selected as the input variables, enabling small businesses to effectively predict their ESG scores. Various machine learning algorithms were utilized, as found in
Figure 7. The gradient boosting and XGB algorithms yielded the most accurate prediction with low RMSE and MAE scores. Through this experiment, it can be concluded that it is possible to predict the ESG scores with the financial-related variables. The finding would be helpful for small businesses to predict their scores. Since the importance of the ESG has been increasing, even small businesses should be aware of their ESG-related scores or stats. However, as the calculated ESG scores from this experiment are related values, not absolute values, firms should consider this when using these results to compare the scores to the other businesses. All algorithms were utilized in their default settings; none of the hyper-parameter tunings were applied.
6. Discussion
This research successfully conducted five experiments to analyze ESG datasets through AI algorithms. We also propose diverse approaches to machine learning algorithms, which is our research’s principal finding. Representative techniques are regression, classification, and animation detection. This paper covered all of these approaches and yielded substantial results for each experiment. Furthermore, we successfully classified each sentence in the article into ESG labels with high accuracy through NLP technologies. This finding would help institutions collect ESG-related activities from particular companies. We also propose a simple method for predicting their estimated ESG rankings via financial-related variables. Even if this paper yields these successful results, limitations exist. The dataset we used is insufficient. In the fourth experiment, we collected the data ourselves by crawling the articles, but crawling further information from the company is too complicated. We had to download the datasets from the Kaggle website and thus, the datasets used in our experiment are limited. We aim at two things in further research. First, the fourth experiment, which is classifying the sentences of articles, is based on the Korean language. We will conduct more experiments based on various languages, including English, French, and Spanish. Second, since collecting the ESG-related datasets from the companies is difficult, our team will cooperate with specific companies to gather abundant data and apply these experiments’ results to real-life situations.
7. Conclusions
While the importance of ESG is increasing, the number of studies related to ESG analysis is less than expected. This paper suggests diverse approaches to analyzing ESG topics via artificial intelligence algorithms. We design five different experiments: determining whether an investment is a good or bad decision to invest based on the ESG index, identifying anomalies in the dataset, predicting financial performance using ESG data, classifying sentences in articles into ESG labels, and recommending a method for extracting the ESG index of companies utilizing machine learning models. All of these experiments showed prominent results, achieving about 99% accuracy in classification in the first experiment, 95% accuracy in detecting noise data in the second one, a 0.5849 MAE score in the third experiment, about 90% accuracy in classifying the sentences into ESG labels in the fourth experiment, and 1.18 of RMSE and 1.4 MAE in the last experiment. In summary, we can conclude that: (1) the financial +ESG variables could effectively predict the result of the investment, which could help investors; (2) the impact of noise data in the financial + ESG dataset is critical, but can effectively detect those data through LOF algorithms; (3) there is a high positive relationship between ESG and annual return; (4) each article could be efficiently classified into ESG labels, which help to figure out ESG activities of the specific company; and (5) a simple machine learning model can predict ESG index. As investments are expected to be more dependent on ESG and companies concentrate on ESG, our analysis aids stakeholders’ decision-making and companies’ management, opening a new horizon on sustainability. Furthermore, our paper is more informative than other related papers in suggesting various AI-based techniques and yielding significant results that can support various firms and institutions. In further research, since these results indicate that the superior performance of each algorithm is sophisticated enough for applying them to the real world, we are looking forward to conducting real-life analysis based on more datasets by collaborating with specific firms.
Author Contributions
Conceptualization, M.C. and H.J.; methodology, M.C.; software, H.J.; validation, M.C., O.L. and H.C.; formal analysis, H.C.; investigation, H.J.; resources, H.J.; data curation, M.C.; writing—original draft preparation, M.C.; writing—review and editing, H.C.; visualization, M.C.; supervision, O.L.; project administration, O.L. All authors have read and agreed to the published version of the manuscript.
Funding
This research received no external funding.
Institutional Review Board Statement
Not applicable.
Informed Consent Statement
Not applicable.
Data Availability Statement
The experiment’s datasets are available on the online website.
Conflicts of Interest
The authors declare no conflict of interest.
References
- Koh, H.-K.; Burnasheva, R.; Suh, Y.G. Perceived ESG (environmental, social, governance) and consumers’ responses: The mediating role of brand credibility, Brand Image, and perceived quality. Sustainability 2022, 14, 4515. [Google Scholar] [CrossRef]
- Cornell, B.; Hsu, J.C. ESG and investing in China and the United States. SSRN Electron. J. 2022. [Google Scholar] [CrossRef]
- O’Hearn, M.; Gerber, S.; Cruz, S.M.; Mozaffarian, D. The time is ripe for ESG + nutrition: Evidence-based nutrition metrics for environmental, social, and governance (ESG) investing. Eur. J. Clin. Nutr. 2022. [Google Scholar] [CrossRef] [PubMed]
- Nirino, N.; Santoro, G.; Miglietta, N.; Quaglia, R. Corporate controversies and company’s financial performance: Exploring the moderating role of ESG practices. Technol. Forecast. Soc. Chang. 2021, 162, 120341. [Google Scholar] [CrossRef]
- Adams, C.A.; Abhayawansa, S. Connecting the COVID-19 pandemic, environmental, social and governance (ESG) investing and calls for ‘harmonisation’ of sustainability reporting. Crit. Perspect. Account. 2022, 82, 102309. [Google Scholar] [CrossRef]
- Ferriani, F.; Natoli, F. ESG risks in times of COVID-19. Appl. Econ. Lett. 2020, 28, 1537–1541. [Google Scholar] [CrossRef]
- Krishnamoorthy, R. Environmental, social, and governance (ESG) investing: Doing good to do well. Open J. Soc. Sci. 2021, 9, 189–197. [Google Scholar] [CrossRef]
- Junesand, N. ESG Investing. ArcGIS StoryMaps. 2021. Available online: https://storymaps.arcgis.com/stories/527259a9971942ccab90a7145d162d13 (accessed on 11 November 2021).
- Liu, T.; Nakajima, T.; Hamori, S. Which factors will affect the ESG index in the USA and Europe: Stock, crude oil, or gold? In ESG Investment in the Global Economy; SpringerBriefs in Economics; Springer: Singapore, 2021; pp. 53–70. [Google Scholar] [CrossRef]
- Zhang, W.; Nakajima, T.; Hamori, S. Does ESG index have strong conditional correlations with sustainability related stock indices? In ESG Investment in the Global Economy; SpringerBriefs in Economics; Springer: Singapore, 2021; pp. 21–35. [Google Scholar] [CrossRef]
- Kiernan, M.J. Universal owners and ESG: Leaving money on the table? Corp. Gov. Int. Rev. 2007, 15, 478–485. [Google Scholar] [CrossRef]
- Berg, F.; Kölbel, J.; Rigobon, R. Aggregate confusion: The divergence of ESG Ratings. SSRN Electron. J. 2019. [Google Scholar] [CrossRef]
- Greff, K.; Srivastava, R.K.; Koutnik, J.; Steunebrink, B.R.; Schmidhuber, J. LSTM: A search space odyssey. IEEE Trans. Neural Netw. Learn. Syst. 2017, 28, 2222–2232. [Google Scholar] [CrossRef] [Green Version]
- Yoo, S.; Managi, S. Disclosure or action: Evaluating ESG behavior towards financial performance. Financ. Res. Lett. 2022, 44, 102108. [Google Scholar] [CrossRef]
- Zaccone, M.C.; Pedrini, M. ESG Factor Integration Into Private Equity. Sustainability 2020, 12, 5725. [Google Scholar] [CrossRef]
- Sharma, U.; Gupta, A.; Gupta, S.K. The pertinence of incorporating ESG ratings to make investment decisions: A quantitative analysis using machine learning. J. Sustain. Financ. Investig. 2022, 2021, 2013151. [Google Scholar] [CrossRef]
- Margot, V.; Geissler, C.; De Franco, C.; Monnier, B. ESG Investments: Filtering Versus Machine Learning Approaches. Appl. Econ. Financ. 2021, 8, 1. [Google Scholar] [CrossRef]
- Gupta, A.; Sharma, U.; Gupta, S.K. The role of ESG in sustainable development: An analysis through the lens of machine learning. In Proceedings of the 2021 IEEE International Humanitarian Technology Conference (IHTC), Virtual, 2–4 December 2021. [Google Scholar] [CrossRef]
- D’Amato, V.; D’Ecclesia, R.; Levantesi, S. ESG score prediction through Random Forest algorithm. Comput. Manag. Sci. 2021, 19, 347–373. [Google Scholar] [CrossRef]
- D’Amato, V.; D’Ecclesia, R.; Levantesi, S. Fundamental ratios as predictors of ESG scores: A machine learning approach. Decis. Econ. Financ. 2021, 44, 1087–1110. [Google Scholar] [CrossRef]
- Yu, G.; Liu, Y.; Cheng, W.; Lee, C.-T. Data analysis of ESG stocks in the Chinese Stock Market based on machine learning. In Proceedings of the 2022 2nd International Conference on Consumer Electronics and Computer Engineering (ICCECE), Guangzhou, China, 14–16 January 2022. [Google Scholar] [CrossRef]
- Chen, Q.; Liu, X.-Y. Quantifying ESG alpha using scholar Big Data. In Proceedings of the First ACM International Conference on AI in Finance, New York, NY, USA, 15–16 October 2020. [Google Scholar] [CrossRef]
- Alghofaili, Y.; Albattah, A.; Rassam, M.A. A financial fraud detection model based on LSTM Deep Learning Technique. J. Appl. Secur. Res. 2020, 15, 498–516. [Google Scholar] [CrossRef]
- Schultz, M.; Tropmann-Frick, M. Autoencoder neural networks versus external auditors: Detecting unusual journal entries in financial statement audits. In Proceedings of the Annual Hawaii International Conference on System Sciences, Maui, HI, USA, 7–10 January 2020. [Google Scholar] [CrossRef] [Green Version]
- Wang, J.; Bhowmick, A.; Cevik, M.; Basar, A. Deep learning approaches to classify the relevance and sentiment of news articles to the economy. In Proceedings of the 30th Annual International Conference on Computer Science and Software Engineering, Toronto, ON, Canada, 10–13 November 2020; pp. 207–216. [Google Scholar]
- Nugent, T.; Stelea, N.; Leidner, J.L. Detecting Environmental, Social and Governance (ESG) topics using domain-specific language models and data augmentation. In International Conference on Flexible Query Answering Systems; Springer: Cham, Switzerland, 2021; pp. 157–169. [Google Scholar] [CrossRef]
- Guo, T.; Jamet, N.; Betrix, V.; Piquet, L.A.; Hauptmann, E. ESG2Risk: A deep learning framework from ESG News to stock volatility prediction. arXiv 2020, arXiv:2005.02527. [Google Scholar] [CrossRef]
- Erquicia, I.R. 400K NYSE Random Investments + Financial Ratios. Kaggle 2021. Available online: https://www.kaggle.com/imanolrecioerquicia/400k-nyse-random-investments-financial-ratios (accessed on 2 June 2022).
- Volodin, I.; Putyato, M.; Makaryan, A.; Evglevsky, V.; Evsyukov, M. Classification of attack mechanisms and research of protection methods for systems using machine learning and artificial intelligence algorithms. In AIP Conference Proceedings; AIP Publishing: Long Island, NY, USA, 2021. [Google Scholar]
- Gaspar, P. ESG Project Study. Kaggle 2021. Available online: https://www.kaggle.com/datasets/patrickgaspar/fossil-free-funds (accessed on 2 June 2022).
- Fossil Free Funds. Fossil Free Funds. (n.d.). Available online: https://fossilfreefunds.org/ (accessed on 2 June 2022).
- Kim, S. JY Samsung’s Compliance Committee Has Emerged as a Major Pillar of Governance Reform. Edaily, 6 September 2021. Available online: https://www.edaily.co.kr/news/read?newsId=01118486629177824&mediaCodeNo=257 (accessed on 1 June 2022).
- Samsung Electronics Certifies ‘Product Carbon Footprint’ of 4 System Semiconductors. Samsung Newsroom, 9 September 2021. Available online: https://news.samsung.com/kr/%EC%82%BC%EC%84%B1%EC%A0%84%EC%9E%90-%EC%8B%9C%EC%8A%A4%ED%85%9C-%EB%B0%98%EB%8F%84%EC%B2%B4-4%EC%A2%85-%EC%A0%9C%ED%92%88-%ED%83%84%EC%86%8C-%EB%B0%9C%EC%9E%90%EA%B5%AD-%EC%9D%B8 (accessed on 1 June 2022).
- You, H. Samsung Semiconductor Job Expectations vs. Environmental and Tax Burden. ZDNet Korea, 10 September 2021. Available online: https://zdnet.co.kr/view/?no=20210910125234#:~:text=%EB%AF%B8%EA%B5%AD%20%ED%85%8C%EC%9D%BC%EB%9F%AC%EC%8B%9C%EB%AF%BC%20%EB%8C%80%EB%B6%80%EB%B6%84%EC%9D%B4,%EC%9D%B4%20%EB%82%B4%EC%95%BC%20%ED%95%9C%EB%8B%A4%EA%B3%A0%20%EC%A7%80%EC%A0%81%ED%96%88%EB%8B%A4 (accessed on 1 June 2022).
- Samsung Biologics Participated in the Financial Supervisory Service’s Climate Environment Risk Management Model Development Project. A Newspaper That Sees the Future—An Electronic Newspaper. 13 September 2021. Available online: https://m.etnews.com/20210913000154 (accessed on 1 June 2022).
- Fan, J.; Ma, X.; Wu, L.; Zhang, F.; Yu, X.; Zeng, W. Light gradient boosting machine: An efficient soft computing model for estimating daily reference evapotranspiration with local and external meteorological data. Agric. Water Manag. 2019, 225, 105758. [Google Scholar] [CrossRef]
- Breunig, M.M.; Kriegel, H.-P.; Ng, R.T.; Sander, J. LOF: Identifying density-based local outliers. In Proceedings of the 2000 ACM SIGMOD International Conference on Management of Data SIGMOD, Dallas, TX, USA, 15–18 May 2000. [Google Scholar] [CrossRef]
- Alghushairy, O.; Alsini, R.; Soule, T.; Ma, X. A review of local outlier factor algorithms for outlier detection in Big Data Streams. Big Data Cogn. Comput. 2020, 5, 1. [Google Scholar] [CrossRef]
- Gers, F.A. Learning to forget: Continual prediction with LSTM. In Proceedings of the 9th International Conference on Artificial Neural Networks: ICANN, Edinburgh, UK, 7–10 September 1999. [Google Scholar] [CrossRef]
- Chung, J.; Gulcehre, C.; Cho, K.; Bengio, Y. Empirical evaluation of gated recurrent neural networks on sequence modeling. arXiv 2014, arXiv:1412.3555. [Google Scholar]
- Joo, H.S.; Choi, H.Y.; Yun, C.H.; Cheon, M.J. Efficient network traffic classification and visualizing abnormal part via Hybrid Deep Learning Approach: Xception + bidirectional gru. Glob. J. Comput. Sci. Technol. 2022, 21, 1–10. [Google Scholar] [CrossRef]
| Publisher’s Note: MDPI stays neutral with regard to jurisdictional claims in published maps and institutional affiliations. |
© 2022 by the authors. Licensee MDPI, Basel, Switzerland. This article is an open access article distributed under the terms and conditions of the Creative Commons Attribution (CC BY) license (https://creativecommons.org/licenses/by/4.0/).


