Article

The Effects of ESG Combined Score on Business Performance of Enterprises in the Transportation Industry

Faculty of Business Administration, Ton Duc Thang University, No. 19 Nguyen Huu Tho Street, Tan Phong Ward, District 7, Ho Chi Minh City 700000, Vietnam
*
Author to whom correspondence should be addressed.
Sustainability 2022, 14(14), 8354; https://doi.org/10.3390/su14148354
Submission received: 6 June 2022 / Revised: 1 July 2022 / Accepted: 5 July 2022 / Published: 7 July 2022

Abstract

:
A plethora of present studies has the purpose of analyzing the connection related to the effect of environmental, social, and governance (ESG) on business performance. However, it has still not been able to bring out comprehensive results because of using a single metric to measure performance. Due to that, this research will: (i) use the data envelopment analysis (DEA) method to measure transportation firms’ performance and (ii) use OLS regression to explore the relationship between ESG combined score and business performance. In the first stage, we found out that 43 out of 56 firms work inefficiently. The managers of those companies should utilize their resources and refer to the benchmarking as a sample to follow. The environmental and social scores positively affect business performance in the second stage. Thus, managers should consider ESG as an investment, primarily when transportation is categorized as an “environmentally sensitive industry”. Besides, investors should pay more attention to a company that has ESG activities because that firm has the chance to improve its business performance and deal with its commitments.

1. Introduction

The transportation industry plays an essential role in today’s economy and society and significantly impacts growth and employment. The transportation sector directly employs around 10 million people and amounts to approximately 5% of gross domestic product (GDP), making it one of the most popular and rapidly developing sectors [1]. Due to that importance, estimating the overall performance of enterprises operating in the transportation industry is exceptionally critical. The result could provide more insights to decision-makers or boards of directors seeking to improve performance [2], creating benefits for investors and stakeholders. In addition, we suggest that inefficient companies can follow influential companies to enhance their performance.
However, such rapid development will include negative consequences, which are recorded at a high level of degradation for both the human habitat and the environment. For example, consistent with a report from the International Energy Agency in 2011, the global transportation industry has grown to be the second-most-significant greenhouse-gas-emitting sector in the world, accounting for 22% of the world’s CO2 emissions [2]. China was the second-biggest transport-related CO2 emitter, with 623.3 million metric tons of CO2 emissions in 2011, just behind the United States [3]. Severe environmental influences have already become important problems for economic growth and sustainable development. Each developed and developing economy has drawn exceptional interest from authorities, regulators, company decision-makers, and the general public. That disadvantageous effect may only be eased by progressively implemented sustainable policies [4]. With the deepening of public awareness about environmental issues, an increasing number of environmental policies have emerged. Remarkably, China has changed its strategies. In 2019, the Shanghai Stock Exchange’s “Science and Technology Innovation Board Stock Listing Rules” set forth obligatory ESG-associated statistics-disclosure requirements. In 2020, the Hong Kong Stock Exchange revised “How to Prepare Environmental, Social and Governance Reports” and “The Green Finance Regulations of Shenzhen Special Economic Zones”, which call for companies to reveal environmental statistics [5]. Besides that, the USA authorities departments and regulatory corporations attach great importance to ESG policy regulations and guidelines. According to Ruan and Liu [5], the USA’s Nasdaq Stock Exchange issued “ESG Reporting Guide 1.0” and “ESG Reporting Guide 2.0” in 2017 and 2019, respectively, aiming to offer guidance on ESG statistics disclosure of listed corporations and encourage the ESG engagement of small- and medium-sized corporations. Stakeholders such as customers, investors, governments, and regulators have shown increased interest in ESG issues [6,7]. For that reason, ESG practices have become an inevitable part associated with business’ sustainable-growth plans aiming toward prolonging firm survival and setting up a positive relationship with society and investors’ trust. The increase in ESG’s global prominence recently has shown us the significance of studying the effect of ESG on business performance, but the results of empirical studies on its impact on corporate business performance and firm value are mixed [8,9,10,11,12,13].
Most studies on ESG scores have so far focused on developed countries, such as the U.S. and other advanced countries in Europe [14,15]. Studies that concentrate on emerging markets are still limited [16,17,18]. Emerging markets such as China are still in the early stages of economic development. They are typically inclined to utilize the scale and speed of economic growth, which regularly fails to care about ESG issues. For that reason, different economies would lead to a difference in the outcomes of ESG practices. Due to the significance of measuring a company’s overall performance in the transportation industry, a series of articles about this issue were conducted. However, previous research has still not been able to bring out comprehensive results because of using only one metric to measure efficiency. For instance, Lee, Cin [19] have utilized financial ratios such as return on equity (ROE) and return on assets (ROA) to assess financial performance. Boğan and Dedeoğlu’s [20] method was accomplished by sending questionnaires using the Likert scale. Chiu, Lin [21] only used Tobin’s Q of listed firms in China to explore the relationship between pollution-reduction expenditure and firm performance. Research on simple indexes still does not bring out comprehensive outcomes. Our study would make up for these gaps by suggesting the data envelopment analysis (DEA) method, which has been widely based employed to study efficiency because different inputs and outputs can be considered simultaneously in evaluating relative efficiency [22]. An advantageous aspect of applying this method is the use of multiple inputs and multiple outputs to measure business performance, enabling us to accomplish more comprehensive results.
A broad range of studies has aimed to analyze the connection related to the effect of ESG on business performance. Some authors such as Yoon, Lee [18] used the valuation model presented by Feltham and Ohlson [23] to examine how each pillar of ESG affects the market value of firms. Others measure market performance and have captured the perception of overall ESG performance via the connection between ESG ratings and firms’ market value measured by Tobin’s Q [24]. There are also some extents about operating performance. Nevertheless, existed researchers claim that the ESG–financial performance relationship results are ambiguous, inconclusive, and contradictory [25]. Applying different performance-measurement methods to previous studies has caused the research results to be separated [26]. Therefore, in this study, we will help cover the last gaps by measuring the financial and market efficiency and examining this relationship. To investigate the business performance, we use the DEA method to find out the benchmark of the transportation industry. To explore the relationships between ESG combined score and business performance, we rely on dimensions of ESG combined score extracted from the Refinitiv database instead of ESG data collected through questionnaires or other databases. Refinitiv is one of the largest ESG data suppliers [27,28]. It assesses over 500 ESG metrics at the business level, with a selection of 186 of the most relevant and concrete measures per industry being utilized for the entire company evaluation and grading process; by utilizing a common database for ESG research, the outcomes of the study are comparable to those of the preceding literature because the research involves factors and data for a large number of companies that would be difficult to obtain with any method. In the era of pursuing high-quality growth and sustainable development, ESG has become the focus of everyone. In practice, the ESG score is widely used as a significant index to understand a firm’s overall corporate social responsibility (CSR) performance [18].
In the first step, we employ Charnes, Cooper’s [29] data envelopment analysis (DEA) approach to assess enterprises’ business performance in the transportation industry. For the second step, we analyze the connections between ESG performance and business performance using ordinary least squares (OLS) regression [30].
Our study has contributed two aspects. First, we used DEA methods that considered multiple input and output indicators to estimate the business performance of transportation firms in China and the United States. We did not utilize simple financial ratios such as ROA or Tobin’s Q but instead used three inputs and two outputs to arrive at a thorough value. The result produces the benchmark of the transportation industry, which less-effective firms can refer to, to improve their performance. Second, the study highlights the relationship between ESG combined score and business performance. The results offer implications for practitioners.
The remainder of this research is organized as follows. The Section 2 contains references to the relevant literature. This study’s data collection and research strategy are described in Section 3. Section 4 examines the findings, while Section 5 wraps up the report by outlining the study’s limitations and making suggestions for further research.

2. Hypothesis Development and Proposed Model

There are many papers suggesting that ESG activities have a positive influence on firms’ market value and performance. In the aspect of social activities, Miller, Eden [31] argued that a firm would increase their profit if they gain a CSR reputation. Cho, Chung [32] found a positive link between social contribution and the growth rate of the total assets of Korea’s listed companies. In environmental pillar, Kong, Liu [33] and Yadav, Han [34] conductors in China and the United States brought the results: environmental activities and improvement enhance market values Kong, Liu [33]. For travel and tourism companies in the USA, Ionescu, Firoiu [26] showed governance score has a positive effect on market value.
ESG scores are reformulated from the three above pillars by the Refinitiv database. Some recent articles used ESG scores to measure firm performance. For instance, Velte [35] used ESG scores to find out that governance performance has the greatest influence on a company’s financial performance. Our goal is to explore the relationship between ESG combined score and business performance.
In this chapter, besides mentioning the previous research, we build the hypothesis based on theories (including resources-based theory, stakeholders, shareholder views, and agency theory) to bring the most prosperous possible understanding.
Some activities in ESG investment are related to resources management, and many scholars have explored the relationship between ESG score and performance using Barney’s resources-based theory. Barney revealed that if a firm wants to gain a sustained competitive advantage, its resources must be valuable, rare, difficult to imitate, and nonsubstitutable [36]. In ESG activities, a firm can consider engaging as a strategic investment. For example, Branco pointed out that a firm that joins in CSR activities will get internal benefits such as developing new resources, improving productivity, and lowering the cost of compliance. Moreover, the reputation, known as external benefits, will bring more revenue to the company [37].
Engaging with ESG creates two opposing opinions. The first view belongs to the stakeholders, which supports ESG activities. They suggested that following environmental and social responsibility is a win-win strategy: solving the stakeholders’ concerns while still maximizing the shareholders’ values. In the second perspective, the shareholders do not think that. They argued that CSR engagement is not in their interest, so if any benefits to stakeholders come from the firm’s cost, then the revenue cannot be maximized [38].
The agency theory is on the same page with the shareholders’ view. According to agency theory, managers who engage in ESG activities are pursuing their wishes and benefiting themselves at the expense of the shareholders [38,39]. More CSR is not always better because agency problems can drive some CSR-related corporate policies [40].

2.1. Environmental Score and Business Performance

As public awareness of environmental issues has grown, a considerable number of environmental policies have evolved. The implementation of long-term strategy and investments to ensure the industry’s long-term viability contributes to the increasing focus of recent studies on explaining and demonstrating the role of environmental performance and its impact on corporate value. Environmental performance refers to corporate environmental management, including pollution control and prevention [41]. Empirical studies have been conducted based on various industries, such as transportation [42], banking [43], hospitality, and tourism [44]. Many types of research have been undertaken to determine the existence of environmental performance in the transportation industry in the linkage between environmental performance and business performance. On the other hand, the research findings are divisive and split into two ways of analysis. The researchers in the first strand demonstrated a significant association with business value, whereas the researchers in the second strand demonstrated that it was not. Abdi, Li [42] found that the environmental pillar score has a significant relationship with business performance after separating the variables’ environmental pillar score, social pillar score, governance pillar score, and their related effects on firm performance in the air-transport industry. Another study also showed that corporate performance and environmental score have a significant and positive relationship [45]. In the second strand, there is no significant relationship between environmental score and corporate performance at the upper-middle disclosure level. As a result, when it comes to firms’ environmental performance, research findings are still mixed and controversial.
Our outcomes will then support the first strand, especially in the transportation industry context. Following the prior literature and resources-based theory, we propose the following hypothesis.
Hypothesis 1 (H1).
Environmental score positively affects business performance.

2.2. Social Score and Business Performance

Belonging to Miralles-Quirós and Miralles-Quirós [41] definition, social performance refers to the management of crucial stakeholders such as employees, customers, and society. This essential role has led companies to focus on social performance to analyze its influence on companies’ performance. Along with the trend, there is a growing interest in environmental and social issues among a wide range of corporate stakeholders, including socially responsible investors, employees, customers, regulators, and government officials. The trade-off hypothesis suggests that businesses aimed at achieving social goals may increase firm costs and prevent profit maximization. However, in terms of social activities, good corporate social performance, such as charitable giving, will have a long-term positive effect on financial performance. Due to these conflicting interests, the debate over the impact of the social pillar score continues, with ambiguous and contentious results. Some studies, for example, suggest that there is a significant relationship between social pillar score and business performance [42,46,47]. To reinforce the results of the above similar studies and based on stakeholder theory, we propose the following hypothesis.
Hypothesis 2 (H2).
Social score positively affects business performance.

2.3. Governance Score and Business Performance

The corporate-governance criteria represent a company’s capacity via the use of methodologies and creative practices to command and regulate its rights and responsibilities through the development of incentives as well as checks and balances in order to generate long-term shareholder value [42]. Due to budget deficits, many companies prioritize governance and economic issues while reducing or deferring more stringent environmental and social concerns. Business governance is still the most critical aspect of corporate management today [47]. There have been a few studies that discuss the importance of governance performance in determining a company’s performance. Compared to good-governance businesses, weak-governance firms obtain lower equity returns, poorer operating performance, and lower company value. Several studies reveal that governance-pillar scores have a negative association with corporate performance [48,49,50]. Depending on shareholders’ perspectives, agency theory, and existing studies, we propose the following hypothesis.
Hypothesis 3 (H3).
Governance score negatively affects business performance.

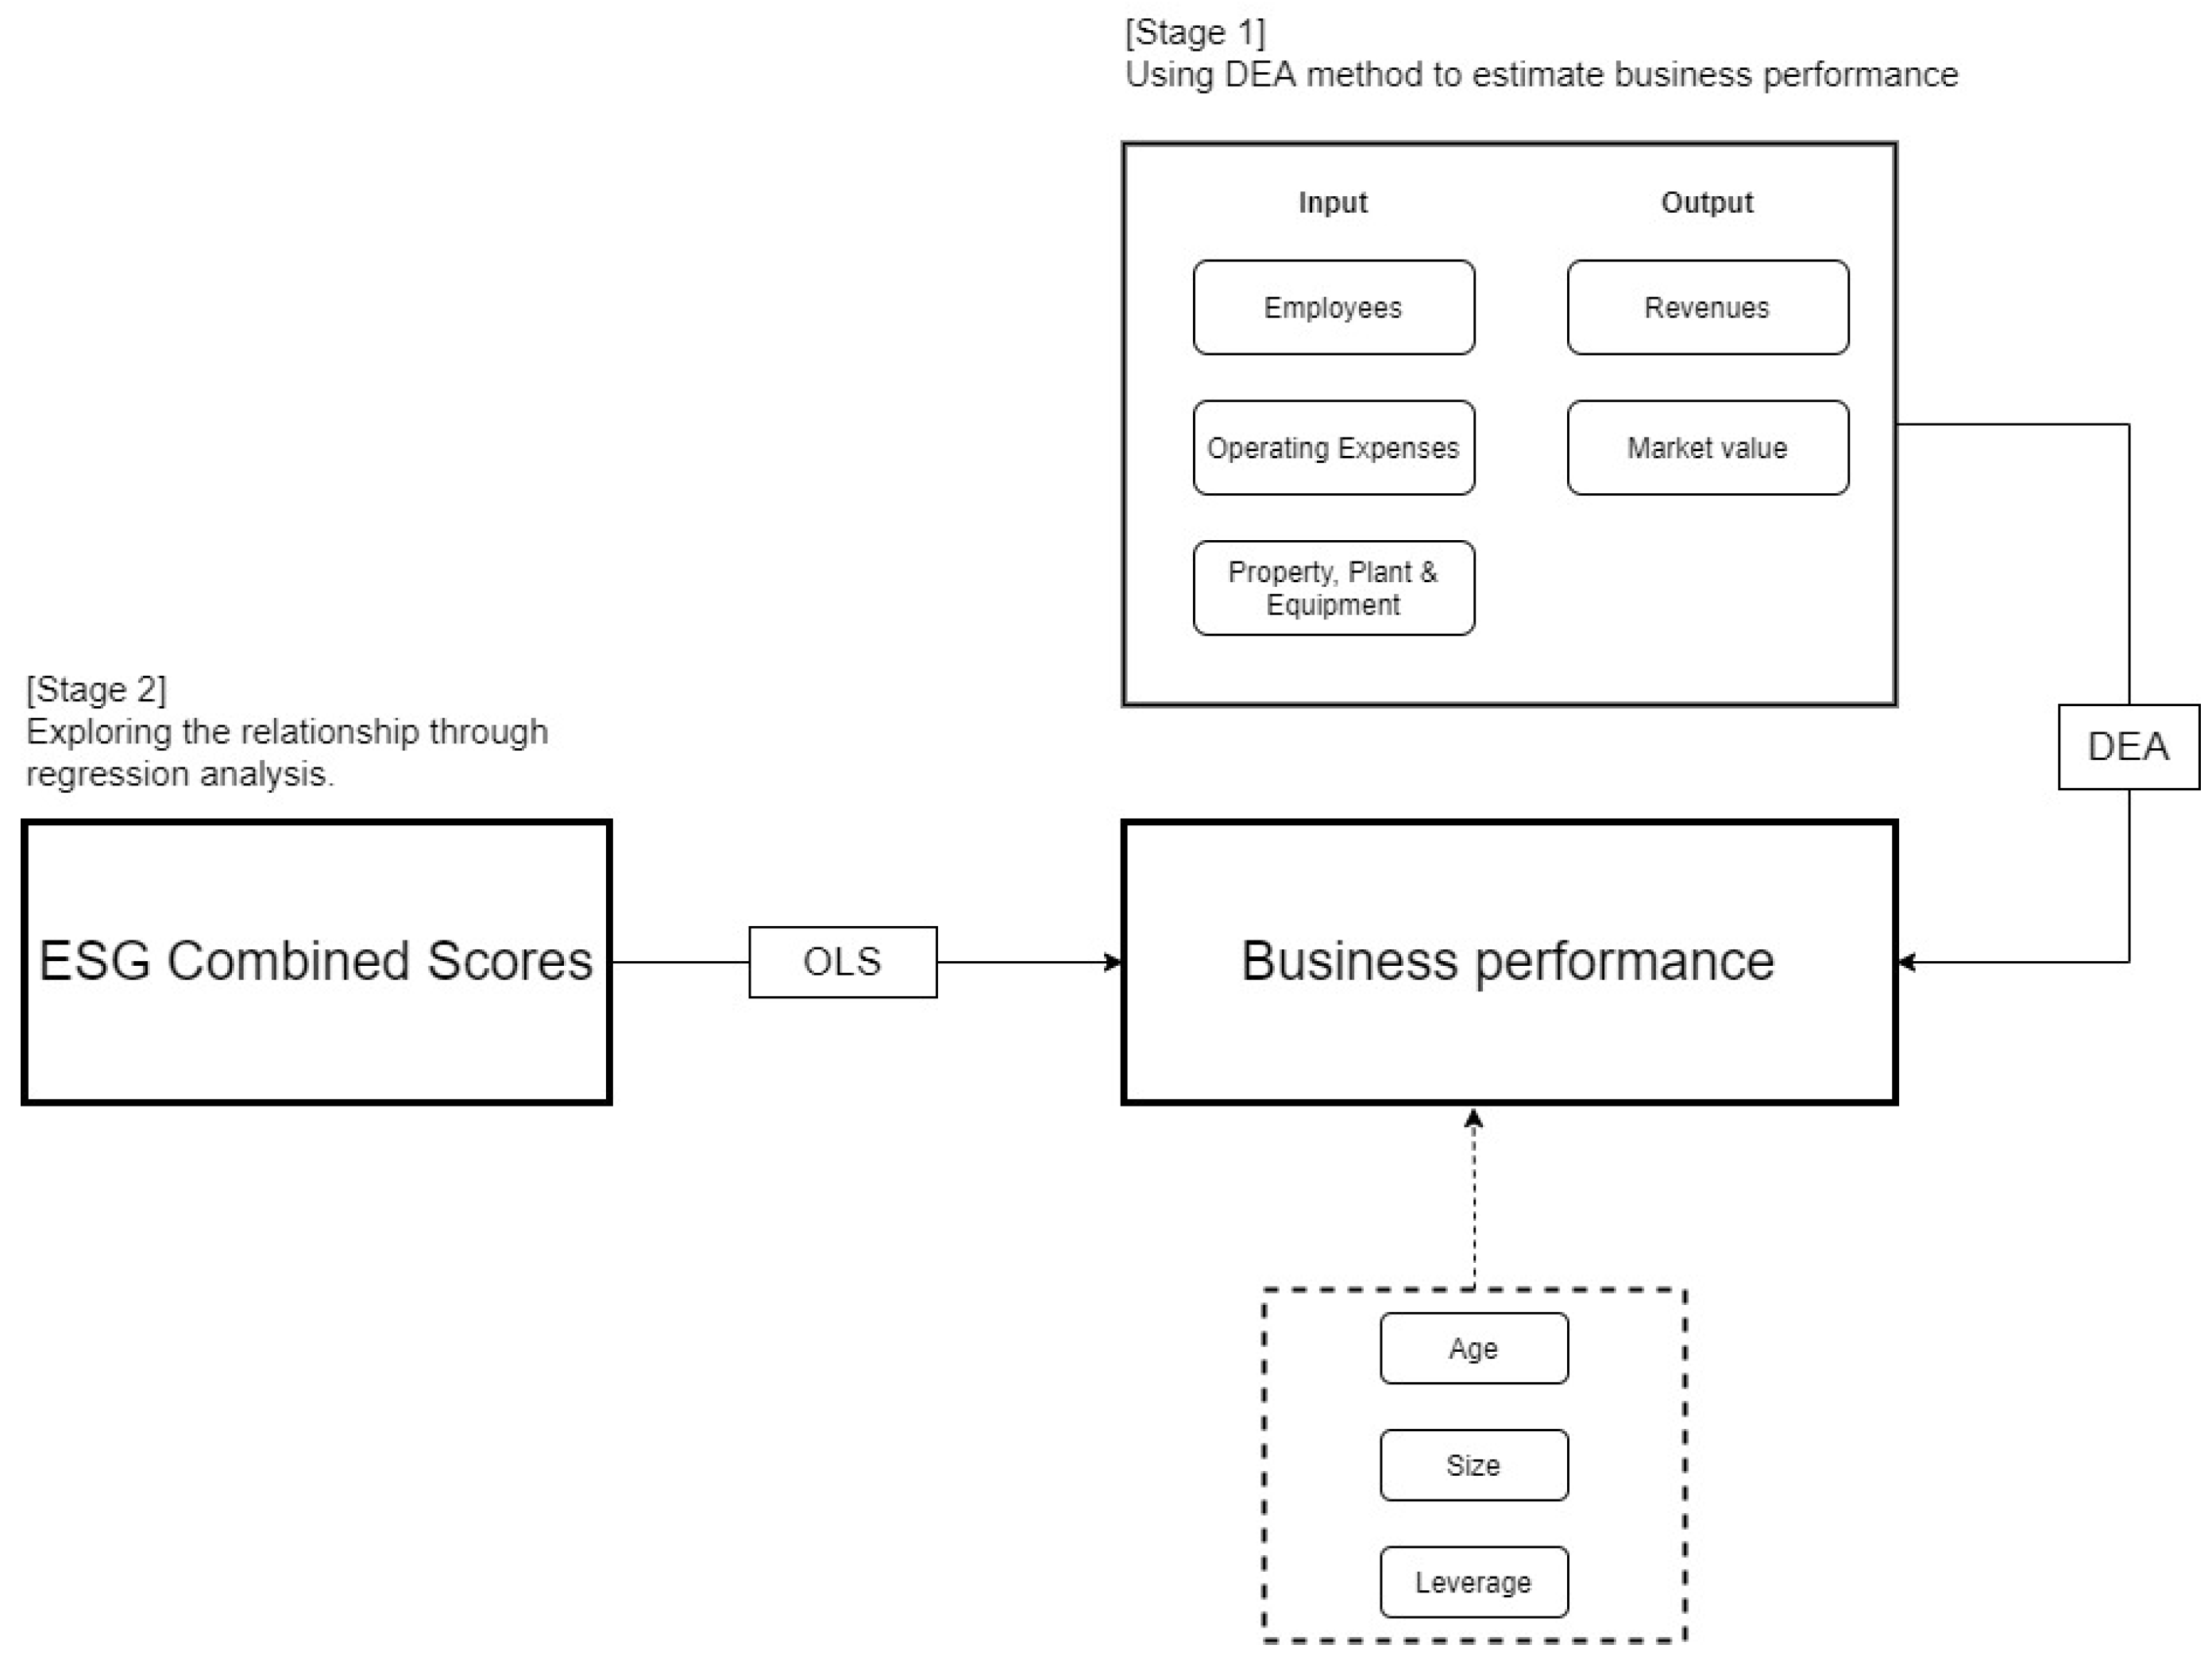
2.4. Proposed Research Framework

Figure 1 shows the research framework, which involves two steps. In the first step, we applied the DEA method with three inputs and two outputs to estimate the business performance of companies in the transportation industry. Table 1 shows the list of input and output variables collected in the existing literature.
Employees; property, plant, and equipment; and operating expenses are three inputs that were primarily used in previous research. For example, Xie, Nozawa [45] used employees as an input variable to explore whether ESG activities can improve a firm’s financial performance. Bayyurt, Gokhan [51] used both employees, and property, plant, and equipment (PPE) as inputs in the DEA model to measure manufacturing performance in Turkey and China. The Harrison and Rouse [52] handbook used PPE and operating expenses to guide how to measure accounting performance by DEA.
For output variables, revenues and market value are widely used by scholars. Xie, Nozawa [45] also used revenues for their research, while lo Storto [54] used it to analyze the cost–revenue production-cycle efficiency of Italian airports. Along with market value, Chen, Wang [55] used to analyze the performance of IT industry in China.
In the next step, we investigated the connections between ESG performance and business performance by using ordinary least squares (OLS) regression. ESG performance is measured by the ESG combined score, which overlays the ESG score and ESG controversies. Refinitiv [56] divided their captured data into 10 categories to calculate the ESG score, following up on companies’ scandals around the world to estimate ESG controversies and give a comprehensive evaluation.

2.5. Control Variables

There are three control variables added to support the study (age, size, and leverage) along with the hypothesis variables to operate the ordinary least squares (OLS) regression [57]. The number of employees in an organization is usually referred to as its organizational size [58]; some authors have demonstrated the effect of the number of the employees variable on business performance [59,60]. Several pieces of research have described the logarithm nature of the number of employees across organizations, which we are supposed to use as one of the control variables in this study. We aggregated the logarithm nature of the number of employees of enterprises to operate the regression calculation. Firm age has been used as a variable to study the impact on business performance in previous studies [61,62,63,64]. Investigating the relationship between company age and performance indicates if businesses can execute suitable strategies to stay relevant and discover ways to renew themselves, thus maintaining their commercial performance continually. In this study, the company’s age is collected as the difference from the year of establishment of the company to the year 2020. The variable leverage represents the result of the expression of total liabilities divided by equity. This study uses those measures because the debt-to-equity ratio is the most important measure for assessing financial risk [65]. With the company’s financial pressure, the manager will better consider the operating options to increase the company’s productivity, so that the leverage can affect the business performance [66,67].

3. Research Design and Methodology

3.1. Data

We gathered data on the transportation industry in China and the United States in 2019 from Refinitiv. Its database provided ESG scores and financial information. After collecting and cleaning data, 14 companies in China and 42 firms in the United States were chosen to be analyzed.
In the first stage, the financial data of 56 companies were used to estimate business performance for each firm. We used employee, operating expenses, and property, plant, and equipment as inputs for the DEA method. In terms of output, revenues and market values are selected. Table 2 shows the descriptive statistics of these variables.
In the second stage of OLS regression, three pillars of ESG scores are used to explore the relationship between ESG scores and business performance. The first pillar is the environment (environmental score), which is calculated based on aspects such as resource use, emissions, and innovation. The second is the social pillar (social score), which is reformulated into four categories: workforce, human rights, community, and product responsibility. The last one is the governance pillar (governance score), which is captured through three criteria: management, shareholders, and CSR strategy. All 10 categories described above are a reflection of the enterprise’s ESG performance, commitment, and effectiveness [48].
Table 2 presents descriptive statistics of input and output variables. To ensure that inputs’ and outputs’ data are fit to use in the DEA method, we applied a non-parametric Kolmogorov–Smirnov test. As shown in Table 3, all input and output are significant (p < 0.01). Thus, we rejected the null hypothesis and confirmed that data do not have the same distribution.
Table 3 shows the correlation matrix of input and output variables. All beta has a positive value at a 5% significance level, suggesting that inputs and outputs positively correlate. The strength varies from moderate to strong correlation, implying that they are interdependent and positively impact each other.

3.2. Methodology

3.2.1. Data Envelopment Analysis (DEA)

We use DEA method to evaluate the business’s performance. Since Charnes et al. (1978) introduced their method, it was widely used to estimate both profits (e.g., bank [68], supply chain [69]), and non-profit organizations (e.g., hospital [70], library [71], farm [72]). In the business section, a plethora of scholars used this method to measure business performance (Shang, Hung [73], Ouenniche and Carrales [74])
The name of DEA partially shows how it works—“envelops” the observations to identify the “frontier” (based on Farrell’s Efficiency Theory) that is used to evaluate observations and reflect the performance of entitles considered [75]. One of the most basic DEA models is the CCR model, which was built on the assumption of constant return to scale (CRS) by Charnes, Cooper [29]. In addition, Banker, Charnes [76] proposed the BBC model as an expansion of the CCR model, which led to a variable return to scale (VRS).
The DEA users may choose any of two orientations. Input orientation, which was implied in this study, shows how decision-making units (DMUs) can reduce the inputs while outputs change nothing. In contrast, output orientation aims to identify the amount of output that can be increased but input change nothing.
In the CCR model, we use x p to denote the inputs while y q representing the outputs of DMU t . In Equation (1), θ * is the efficiency of each DMU and has a value from 0 to 1. If θ * = 1, the DMU is called efficient, became benchmarking, and could not curtail input more. In contrast, if θ * < 1, the firm is less efficient than benchmarking and should be reduced to become more efficient.
θ * = min θ   subject   to i = 1 m λ i x p i θ x p t 0 ,   p = 1 ,   2 ,   ,   s ; i = 1 m λ i y q i y q t 0 ,   q = 1 ,   2 ,   , v ; λ i 0 ,   i = 1 ,   2 ,   ,   m

3.2.2. OLS Regression

Ordinary least squares regression (OLS) analyses were applied to test whether the ESG combined score impacted business performance and the relationship between two variables.
B P i = β 0 + β 1 E   S c o r e i + β 2 S   S c o r e i + β 3 G   S c o r e i + β 4 S i z e i + β 5 A g e i + β 5 L e v e r a g e i + ε i
In the regression model, B P i is the business performance. The coefficients β i explain how business performance is related to the ESG combined score. E   S c o r e is environmental pillar scores, S   S c o r e is social pillar scores, and G   S c o r e is governance pillar scores. ε i is the error term, and i is the firm. S i z e is the logarithm of employees, L e v e r a g e is the leverage ratio of the company, and A g e is the age of the company, which is the number of years since the company’s founding.

4. Results and Discussion

4.1. Business Performance in the Transportation Industry

4.1.1. DEA Result and the Creation of Reference Group

In this paper, we used the CCR model to analyze the technical efficiency of 56 transportation companies in both China and the USA. The result is presented in Table A1. Among 56 firms considered, 13 firms have a 100 percent efficiency rate, accounting for 23.2% of all surveyed subjects. Covenant Logistics is the firm that has the lowest efficiency with only 63.99%.
Furthermore, we provided the reference groups as shown in Table A1. The DEA method has the advantage of providing benchmarking DMUs for inefficient DMUs. Under the DEA analysis, the reference groups are created by comparing the total number of benchmarks from inefficient DMUs to DMUs with a 100 percent efficiency rate. Despite 13 enterprises producing a 100 percent efficiency rate, only eight companies contribute to the reference groups. It was 35 times for Zhejiang Expressway (China), 31 times for Union Pacific Corp (United States), 30 times for Landstar System Inc. (Jacksonville, FL, USA) etc.. As a result, Zhejiang Expressway was the most often referred, and, hence, had the highest reliability rate among the reference group’s participants.

4.1.2. Proposal for Inefficient DMUs

After measuring 56 companies by the DEA method, we explored the characteristics of these DMUs from a return-to-scale perspective that included Constant, Decreasing, and Increasing. Table A1 shows that 13 companies, which are 100% efficient, belong to the Constant Return to Scale category. These companies do not change anything and become the benchmark for inefficient firms. Twenty enterprises were classed as having a Decreasing return to scale, which means that increasing the input for these DMUs will cause the output to drop. On the opposite side, the remaining 23 companies were sorted in the Increasing return-to-scale group, and, thus, they should expand the scale of input to become more efficient.
Another great feature of the DEA method is it provides the scale of inputs and outputs that need to change to gain efficiency for inefficient DMUs. Table A2 and Table A3 indicate the present input and output values of inefficient DMUs and the standard input and output values recommended for business efficiency.

4.2. OLS Regression

4.2.1. Variables Characteristics

Table 4 shows the descriptive statistics of the dependent, independent, and control variables used in this study. The results show that the firms fluctuated between 0.63 and 1.0, in which firms recorded a 1.0 CRS score, practiced good business performance, and, thus, were considered a benchmark for others. Almost all firms achieved around 0.8 CRS score, which means that the company must mirror the benchmark to improve business.
We also do a variance inflation factors (VIFs) test to discover the presence of multicollinearity in the regression analysis (Table 4). VIF ranges from 1 upwards, and the higher the value, the less reliable the regression model is. All VIF values are below 3 (the greatest VIF obtained in running regressions is 2.275), which demonstrates that there is a high tolerance value and, thus, a low degree of multicollinearity. In other words, the results indicate that the independent variables collectively have no substantial amount of shared variance and verify the reliability of the regression analysis [77].

4.2.2. Relationship between ESG Combined Score and Business Performance

To test whether ESG dimensions impacted business performance, an OLS regression analysis was performed. In Table 5, three control variables and three independent variables were entered into the regression.
The employees variable was significantly related to business performance (β = −0.431, and p < 0.01). The standardized regression coefficient was significant for all three independent variables: environmental score, social score, and governance score (β = 0.342, 0.373, and −0.241 and p < 0.05, p < 0.05, and p < 0.10, respectively). Therefore, our three hypotheses were supported.

5. Discussion

This study used a sample of 56 listed companies in the United States and China, and the linear regression models highlighted the positive and significant relationship between ESG combined score and business performance. We used three dimensions of ESG combined score to comprehensively explore the relationship between ESG combined score and business performance. As a result, we may have been able to reduce potential estimation errors caused by just estimating the ESG combined score. This supports and extends the findings of studies that have found a positive relationship between ESG combined score and business performance [42,45].
The findings show that environmental score positively impacts business performance ( β = 0 . 342 ;   ρ   <   0 . 05 ) . Thus, Hypothesis 1 was supported. The results imply the necessity of implementation of ESG activities in business operations. Firms with good environmental performance, for example, maintain advanced levels in implementing pollution prevention and control strategies, so can obtain a good business performance. Although adopting green practices requires more investments and expenditures [45,78], environmental supply-chain management (one of the ecological quality-management policies) is positively related to company performance. It could be a source of competitiveness for businesses, allowing them to operate more efficiently and, thus, enhance business performance [78,79]. This can be explained from the perspective of resources-based theory. When a company pursues environmental responsibilities and the resources are managed efficiently, the company’s performance can be enhanced through lower costs and higher revenue by having a good reputation. Managing resource efficiency can bring sustained competitive advantages, according to the VRIO framework [80].
This paper has found that social scores positively affect business performance, so Hypothesis 2 was verified at a level of 5% significantly. Firms with good corporate social performance refer to the management of key stakeholders such as employees, customers, and society, and operating corporate governance at high levels can generate positive business performance. For example, implementing charitable giving, which may enhance business performance by improving a firm’s reputation, demonstrating that reputation is accumulated through stakeholder judgment [81,82], or nurture worker morale resulting in increased productivity, in turn, improves business performance, which benefits business performance in the long term [83]. Therefore, the implementation of charitable giving rather than a type of strategic advertising, may serve as a reputation builder or an efficiency improvement [84]. Regarding reputation that attracts employees, firms can implement equal opportunity and training policies, which were demonstrated to be positively associated with corporate efficiency, or social activities that can enhance corporate reputation and attract employees with little additional costs, which were positively related to corporate efficiency [45]; trained workers performed better than workers who did not participate in training programs [85]. Firms that follow employee career-development strategies and provide equal work conditions may improve their company reputation and attract more productive employees [86].
At a significant level of 5%, Hypothesis 3 was supported, so governance score negatively affects business performance, which is consistent with previous studies [48,49,50] and the two theories mentioned above. In Bénabou and Tirole’s [87] research, the CSR activities that do not enhance the firm value are called insider-initiated corporate philanthropy. In this interpretation, CSR activities are neither initially from stakeholders’ concerns nor their willingness to sacrifice money for a good cause but instead originate from the members of the board of directors desires. This directly affects shareholders and may lead to the agency problem. Not only by wasting money (which comes from shareholders) for unjustified purposes but also by expensing the agency cost, the firm value cannot be enhanced.
About control variables, only the employees variable that served as a control variable connected significantly to the relationship, which is consistent with the findings of Hancock, Allen [59]. The operating revenues of firms positively correlated with the company size (measured by the number of employees), which means with a large number of employees, the transportation services firms can carry and profit from incremental investment of staff (hiring more expensive people) [58]. Leverage and firm age variables have a nonpositive relationship with business performance, which is consistent with the findings of Carmeli, Schaubroeck [62] and Hofmann and Lampe [67]. The control variables produce consistent findings for all three ESG activity-analysis parameters.

6. Conclusions

6.1. Implication

In the first part of the research, we used the DEA method to explore the business performance of transportation enterprises in both the United States and China. The result reveals that most companies involved in the research are not efficient. Specifically, 43 out of 56 firms work inefficiently. The managers of those companies should utilize their resources as we proposed above. Moreover, they should refer to the benchmarking as a sample to follow. In the second part, the OLS regression shows that only the environmental score and social score positively affect business performance. From the managers’ point of view, they should not regard ESG activities as an enormous cost that the company must face. Instead, managers should consider ESG as an investment, primarily when transportation is categorized as an “environmentally sensitive industry”. In the beginning, there is a plethora of requirements and commitments to be met, but in the long-term, they will enjoy the benefits. They will have a more positive effect on business performance and a good reputation, thus increasing their competitive power against competitors. Moreover, the enterprise will have reductions and exemptions related to taxes, instead of engaging in CRS activities such as charity and donations to reduce cost, which can cause a negative effect on firm performance. From the view of investors, they should pay more attention to a company that has ESG activities, because that firm not only has the chance to improve its business performance but also can deal with its commitments.

6.2. Limitations and Future Research

Although using the DEA method brings more comprehensive results than other measuring-efficiency methods, this research still has limitations. Firstly, the data used in this study were limited to 2019. It does not bring the whole picture of transportation in the United States and China. Future researchers should use panel data to explore the most objective result, especially in the cross-national-research context. Secondly, this research has a differentiation in sample size. The research that conveys in a cross-national environment should have a similar sample composition in each country [88]. However, China’s low transparency affected us in collecting data from this country. China has 6 out of 10 transparency grades for energy and environment and just 5 out of 10 for human rights [89]. Refinitiv extracts data from public sources, so we just collected data from 16 firms in China and are not able to make a comparison between firms in China and the United States. In future studies, authors should approach more databases to get more data on China and provide insight into the two countries’ differences. Finally, we only used the one-stage DEA method to estimate business efficiency, which is more, but not totally, comprehensive than others. In the aspect of methodology, future research can consider using the two-stage DEA method to bring more comprehensive results.

Author Contributions

Conceptualization, T.N.P. and M.-H.L.; methodology, H.-D.N.; software, H.-D.N.; validation, H.-D.N., H.N.V., and C.D.P.; formal analysis, H.N.V.; investigation, C.D.P.; resources, T.N.P.; data curation, H.N.V.; writing—original draft preparation, H.-D.N.; writing—review and editing, P.P.T.; visualization, M.-H.L.; supervision, M.-H.L.; project administration, H.-D.N.; funding acquisition, T.N.P. All authors have read and agreed to the published version of the manuscript.

Funding

This research received no external funding.

Institutional Review Board Statement

Not applicable.

Informed Consent Statement

Not applicable.

Data Availability Statement

No new data were created or analyzed in this study. Data sharing is not applicable to this article.

Conflicts of Interest

The authors declare no conflict of interest.

Appendix A

Table A1. Business efficiency rate and reference group.
DMUCompany NameTechnical
Efficiency (%)
No. of
References
No. of Reference GroupsReference GroupsReturn to Scale
D01Cosco Shipping82.4003D14D15D30 Decre
D02Shanghai International Port10000 Const
D03ZTO Express95.5502D09D15 Decre
D04Daqin Railway73.6002D14D44 Decre
D05China Merchants76.0603D14D15D30 Incre
D06Cosco Shipping Energy65.6103D14D36D44 Decre
D07Guangzhou Baiyun International Airport70.9703D14D15D16 Incre
D08Ningbo Zhoushan Port Group71.1903D14D15D30 Decre
D09Shenzhen Expressway Group10030 Const
D10Tangshan Port Group84.7003D14D15D30 Incre
D11Best Inc.83.1703D14D15D30 Decre
D12Liaoning Port Co Group72.0403D14D16D44 Incre
D13Sinotrans Limited Company80.1203D14D30D39 Decre
D14Zhejiang Expressway100350 Const
D15Union Pacific Corporation100310 Const
D16CSX Corporation10030 Const
D17FedEx78.0603D14D15D30 Decre
D18Old Dominion Freight Line89.6804D09D14D15D30Decre
D19Kansas City Southern94.2503D15D16D44 Decre
D20Expeditors10000 Const
D21J. B. Hunt Transport Services80.2303D14D15D30 Decre
D22Ardmore Shipping Corporation81.3303D15D30D36 Incre
D23C.H. Robinson10000 Const
D24Air Transport International78.9703D14D15D30 Incre
D25Dorian LPG74.0503D15D36D44 Incre
D26Forward Air Corporation81.7503D14D30D39 Incre
D27Golden Ocean84.3203D30D36D42 Decre
D28Hub Group88.8703D14D15D30 Decre
D29Knight-Swift Transportation Holding72.1403D14D15D30 Decre
D30Landstar System Inc.100300 Const
D31Macquarie Infrastructure Holdings92.6303D15D30D36 Decre
D32Matson87.7303D14D15D30 Incre
D33Safe Bulkers Inc72.9202D14D44 Incre
D34Saia Inc68.0003D14D15D30 Incre
D35Schneider National78.6803D14D15D30 Decre
D36SFL Corporation10080 Const
D37Werner Enterprises70.8903D14D15D30 Decre
D38XPO Logistics75.3602D14D39 Decre
D39Corporacion America10060 Const
D40Covenant Logistics63.9903D14D15D30 Incre
D41Daseke Inc75.0303D14D15D30 Incre
D42DHT Holdings Inc10000 Const
D43Eagle Bulk Shipping64.1903D14D15D30 Incre
D44FLEX LNG10070 Const
D45Heartland Express67.8103D09D14D15 Incre
D46Marten Transport70.9603D14D15D30 Incre
D47Nordic American Tanker99.0503D30D36D42 Incre
D48Overseas Shipholding Group72.8003D15D30D36 Incre
D49P.A.M. Transport67.1103D14D15D30 Incre
D50Radiant Logistics10000 Const
D51Teekay Corporation78.4903D14D15D30 Incre
D52Textainer Group Holding83.3903D14D36D44 Decre
D53U.S. Xpress68.4403D14D15D30 Incre
D54Universal Logistics77.2603D14D30D39 Incre
D55Usa Truck, Inc.71.8903D14D15D30 Incre
D56Yellow Corp74.7700D14D39 Decre
Note: Incre, Const, and Decre stand for Increasing, Constant, and Decreasing, respectively.
Table A2. Actual input and recommended input for inefficiency DMUs.
DMUOperating ExpensesProperty, Plant,
and Equipment
No. of Employees
ActualExpectedActualExpectedActualExpected
D0120,608,06216,981,694.2419,765,11816,287,081.7527,286.9833,114
D032,469,0572,359,087.271,920,5761,835,035.1517,738.6719,009
D048,917,4836,563,617.0811,598,3958,536,873.4249,642.8096,995
D051,761,3051,339,694.585,600,1084,259,588.403574.944700
D061,730,5751,135,445.667,313,2814,798,308.764546.186929
D07938,476666,074.222,984,3182,118,090.692924.4512,888
D082,924,6802,081,996.975,249,6383,737,068.8211,944.5016,779
D09637,542637,542.00425,454425,454.004889.004889
D101,344,5831,138,891.361,884,4451,596,166.343258.493847
D115,145,6184,279,861.851,051,037874,198.827005.828423
D12766,149551,906.103,078,1972,217,422.062395.106607
D1310,945,3148,769,756.202,363,1951,893,471.8627,042.4433,751
D1764,907,00050,664,111.8430,429,00023,751,802.72186,554.96239,000
D183,290,4052,950,964.773,034,1352,721,131.7518,030.9620,105
D191,810,9001,706,854.058,964,7008,449,629.734792.077040
D218,431,4336,764,718.943,746,3663,005,789.5323,312.2529,056
D22213,875173,943.86663,486539,611.0641.4851
D241,275,1861,007,068.171,810,3221,429,687.643459.074380
D25158,451117,325.341,478,6811,094,892.1651.8370
D261,291,5721,055,837.20364,688298,125.974479.805480
D27607,226512,028.832,589,5932,183,612.4931.2037
D283,515,4453,124,283.53704,578626,180.034443.655000
D294,380,1263,159,955.433,020,1452,178,823.9817,170.0423,800
D311,428,0001,322,758.043,538,0003,277,253.47842.01909
D322,094,8001,837,862.141,854,2001,626,772.961744.161988
D33154,039112,326.92963,199702,375.20586.76952
D341,634,5521,111,550.701,156,489786,451.677072.3510,400
D354,440,9003,494,290.021,851,6001,456,918.0612,314.0915,650
D372,238,2291,586,597.731,537,6521,089,984.619028.0812,736
D3815,679,00011,816,139.364,949,0003,729,706.8571,669.79100,000
D40876,794561,099.57517,203330,981.263551.695550
D411,723,4001,293,110.06560,200420,332.054442.675921
D43288,925185,448.59857,110550,142.23625.17974
D45533,881362,000.08526,287356,850.942671.694050
D46775,453550,238.41641,572455,240.432900.014087
D47285,249236,783.72901,474892,906.4119.8120
D48325,615237,051.881,023,681745,252.84519.07713
D49501,047336,228.42387,275259,881.531778.962651
D511,558,9991,223,602.235,033,1303,950,322.673963.565050
D52493,634411,625.304,168,5553,476,022.08141.76170
D531,678,2221,148,618.58768,401525,913.545866.908572
D541,446,6181,117,708.87427,032329,940.225053.816541
D55519,584373,528.66260,444187,233.051473.742050
D564,859,6003,633,753.601,156,300864,620.4020,613.8929,000
Table A3. Actual output and recommended output for inefficiency DMUs.
DMURevenueMarket Value
ActualExpectedActualExpected
D0121,346,23021,346,230.009,161,200.0052,887,208.76
D033,204,6203,265,690.4213,446,038.0013,446,038.00
D0411,331,99711,331,997.0017,307,246.0027,167,493.18
D052,064,0582,064,058.007,894,326.0010,044,719.94
D061,945,6191,945,619.003,647,643.005,897,064.52
D071,115,9361,115,936.005,120,245.005,120,245.00
D083,448,7943,448,794.007,097,916.0011,649,396.93
D09877,132877,132.003,556,111.003,556,111.00
D101,589,1461,589,146.002,184,728.004,806,100.05
D115,098,3935,098,393.001,393,605.007,324,123.87
D12942,371942,371.003,711,670.003,711,670.00
D1311,010,56311,010,563.004,470,500.0015,371,616.29
D1769,693,00069,693,000.0039,436,840.00134,812,275.75
D184,109,1114,109,111.0015,123,256.0015,123,256.00
D192,866,0002,866,000.0014,721,076.0014,721,076.00
D219,165,2589,165,258.0012,403,543.0017,335,404.84
D22230,042230,042.00299,535.00564,277.46
D241,452,1831,452,183.001,391,868.004,412,608.34
D25158,032202,719.92853,996.00853,996.00
D261,410,3951,410,395.001,948,124.002,148,533.60
D27705,799705,799.00832,443.001,729,002.61
D283,668,1173,668,117.001,744,691.005,174,857.38
D294,843,9504,843,950.006,117,458.0010,943,472.07
D311,727,0001,727,000.003,709,957.004,755,867.97
D322,203,1002,203,100.001,750,320.005,200,669.66
D33198,184198,184.00177,060.00614,997.65
D341,786,7351,786,735.002,415,210.004,116,869.71
D354,747,0004,747,000.003,864,704.008,836,415.42
D372,463,7012,463,701.002,519,808.005,577,872.85
D3816,648,00016,648,000.007,332,400.0024,396,216.46
D40894,528894,528.00239,308.001,950,779.28
D411,737,0001,737,000.00204,101.003,022,660.90
D43292,378292,378.00328,910.001,345,707.97
D45596,815596,815.001,726,689.001,726,689.00
D46843,271843,271.001,175,578.002,027,226.31
D47317,220317,220.00724,375.00724,375.00
D48355,547355,547.00197,141.001,734,630.97
D49514,177514,177.00331,769.001,206,114.44
D511,945,3911,945,391.00536,173.009,441,618.08
D52707,481707,481.00608,520.002,689,872.83
D531,707,3611,707,361.00246,476.003,397,580.82
D541,511,9981,511,998.00517,271.002,329,831.67
D55522,631522,631.0063,722.001,038,460.18
D564,871,2004,871,200.0085,972.005,989,297.96

References

  1. Hub, E.S. Transport Sector Economic Analysis. 2014. Available online: https://joint-research-centre.ec.europa.eu/scientific-activities-z/transport-sector-economic-analysis_en#:~:text=Transport%20plays%20an%20important%20role,gross%20domestic%20product%20(GDP) (accessed on 6 January 2022).
  2. Li, X.; Li, F.; Zhao, N.; Zhu, Q. Measuring environmental sustainability performance of freight transportation seaports in China: A data envelopment analysis approach based on the closest targets. Expert Syst. 2020, 37, e12334. [Google Scholar] [CrossRef]
  3. Stefaniec, A.; Hosseini, K.; Xie, J.; Li, Y. Sustainability assessment of inland transportation in China: A triple bottom line-based network DEA approach. Transp. Res. Part D Transp. Environ. 2020, 80, 102258. [Google Scholar] [CrossRef]
  4. Wu, Y.; Zhang, S.; Hao, J.; Liu, H.; Wu, X.; Hu, J.; Walsh, M.P.; Wallington, T.J.; Zhang, K.M.; Stevanovic, S. On-road vehicle emissions and their control in China: A review and outlook. Sci. Total Environ. 2017, 574, 332–349. [Google Scholar] [CrossRef] [PubMed] [Green Version]
  5. Ruan, L.; Liu, H. Environmental, Social, Governance Activities and Firm Performance: Evidence from China. Sustainability 2021, 13, 767. [Google Scholar] [CrossRef]
  6. Escrig-Olmedo, E.; Muñoz-Torres, M.J.; Fernández-Izquierdo, M.Á. Sustainable Development and the Financial System: Society’s Perceptions about Socially Responsible Investing. Bus. Strategy Environ. 2013, 22, 410–428. [Google Scholar] [CrossRef]
  7. Hill, R.P.; Ainscough, T.; Shank, T.; Manullang, D. Corporate Social Responsibility and Socially Responsible Investing: A Global Perspective. J. Bus. Ethics 2007, 70, 165–174. [Google Scholar] [CrossRef]
  8. Anser, M.K.; Zhang, Z.; Kanwal, L. Moderating effect of innovation on corporate social responsibility and firm performance in realm of sustainable development. Corp. Soc. Responsib. Environ. Manag. 2018, 25, 799–806. [Google Scholar] [CrossRef]
  9. Aupperle, K.; Van Pham, D.J.E.R. An extended investigation in the relationship between corporate social responsibility and profitability. Empl. Responsib. Rights J. 1989, 2, 263–274. [Google Scholar] [CrossRef]
  10. Lee, S.; Seo, K.; Sharma, A. Corporate social responsibility and firm performance in the airline industry: The moderating role of oil prices. Tour. Manag. 2013, 38, 20–30. [Google Scholar] [CrossRef]
  11. McGuire, J.B.; Sundgren, A.; Schneeweis, T. Corporate Social Responsibility and Firm Financial Performance. Acad. Manag. J. 1988, 31, 854–872. [Google Scholar] [CrossRef]
  12. Riahi-Belkaoui, A. Executive Compensation, Organizational Effectiveness, Social Performance and Firm Performance: An Empirical Investigation. J. Bus. Financ. Account. 1992, 19, 25–38. [Google Scholar] [CrossRef]
  13. Saeidi, S.P.; Sofian, S.; Saeidi, P.; Saeidi, S.P.; Saaeidi, S.A. How does corporate social responsibility contribute to firm financial performance? The mediating role of competitive advantage, reputation, and customer satisfaction. J. Bus. Res. 2015, 68, 341–350. [Google Scholar] [CrossRef]
  14. Ait Sidhoum, A.; Serra, T. Corporate social responsibility and dimensions of performance: An application to U.S. electric utilities. Util. Policy 2017, 48, 1–11. [Google Scholar] [CrossRef]
  15. Rodriguez-Fernandez, M. Social responsibility and financial performance: The role of good corporate governance. BRQ Bus. Res. Q. 2016, 19, 137–151. [Google Scholar] [CrossRef] [Green Version]
  16. Sachin, N.; Rajesh, R. An empirical study of supply chain sustainability with financial performances of Indian firms. Environ. Dev. Sustain. 2022, 24, 6577–6601. [Google Scholar] [CrossRef]
  17. Garcia, A.S.; Mendes-Da-Silva, W.; Orsato, R.J. Sensitive industries produce better ESG performance: Evidence from emerging markets. J. Clean. Prod. 2017, 150, 135–147. [Google Scholar] [CrossRef]
  18. Yoon, B.; Lee, J.H.; Byun, R. Does ESG Performance Enhance Firm Value? Evidence from Korea. Sustainability 2018, 10, 3635. [Google Scholar] [CrossRef] [Green Version]
  19. Lee, K.-H.; Cin, B.C.; Lee, E.Y. Environmental Responsibility and Firm Performance: The Application of an Environmental, Social and Governance Model. Bus. Strategy Environ. 2016, 25, 40–53. [Google Scholar] [CrossRef]
  20. Boğan, E.; Dedeoğlu, B.B. Hotel employees’ corporate social responsibility perception and organizational citizenship behavior: Perceived external prestige and pride in organization as serial mediators. Corp. Soc. Responsib. Environ. Manag. 2020, 27, 2342–2353. [Google Scholar] [CrossRef]
  21. Chiu, S.C.; Lin, H.C.; Wang, C.S. The impact of investments in pollution reduction on shareholder wealth: Evidence from Taiwanese manufacturing companies. Corp. Soc. Responsib. Environ. Manag. 2017, 24, 676–691. [Google Scholar] [CrossRef]
  22. Liu, X.; Ji, X.; Zhang, D.; Yang, J.; Wang, Y. How public environmental concern affects the sustainable development of Chinese cities: An empirical study using extended DEA models. J. Environ. Manag. 2019, 251, 109619. [Google Scholar] [CrossRef] [PubMed]
  23. Feltham, G.A.; Ohlson, J.A. Valuation and clean surplus accounting for operating and financial activities. Contemp. Account. Res. 1995, 11, 689–731. [Google Scholar] [CrossRef]
  24. Nekhili, M.; Boukadhaba, A.; Nagati, H.; Chtioui, T. ESG performance and market value: The moderating role of employee board representation. Int. J. Hum. Resour. Manag. 2021, 32, 3061–3087. [Google Scholar] [CrossRef]
  25. Tang, Z.; Hull, C.E.; Rothenberg, S. How Corporate Social Responsibility Engagement Strategy Moderates the CSR–Financial Performance Relationship. J. Manag. Stud. 2012, 49, 1274–1303. [Google Scholar] [CrossRef]
  26. Ionescu, G.H.; Firoiu, D.; Pirvu, R.; Vilag, R.D. The Impact of Esg Factors on Market Value of Companies from Travel and Tourism Industry. Technol. Econ. Dev. Econ. 2019, 25, 820–849. [Google Scholar] [CrossRef]
  27. Baran, M.; Kuźniarska, A.; Makieła, Z.J.; Sławik, A.; Stuss, M.M. Does ESG Reporting Relate to Corporate Financial Performance in the Context of the Energy Sector Transformation? Evidence from Poland. Energies 2022, 15, 477. [Google Scholar] [CrossRef]
  28. Escrig-Olmedo, E.; Fernández-Izquierdo, M.; Ferrero-Ferrero, I.; Rivera-Lirio, J.; Muñoz-Torres, M. Rating the Raters: Evaluating how ESG Rating Agencies Integrate Sustainability Principles. Sustainability 2019, 11, 915. [Google Scholar] [CrossRef] [Green Version]
  29. Charnes, A.; Cooper, W.W.; Rhodes, E. Measuring the efficiency of decision making units. Eur. J. Oper. Res. 1978, 2, 429–444. [Google Scholar] [CrossRef]
  30. Simar, L.; Wilson, P.W. Estimation and inference in two-stage, semi-parametric models of production processes. J. Econom. 2007, 136, 31–64. [Google Scholar] [CrossRef]
  31. Miller, S.R.; Eden, L.; Li, D. CSR Reputation and Firm Performance: A Dynamic Approach. J. Bus. Ethics 2018, 163, 619–636. [Google Scholar] [CrossRef]
  32. Cho, S.; Chung, C.; Young, J. Study on the Relationship between CSR and Financial Performance. Sustainability 2019, 11, 343. [Google Scholar] [CrossRef] [Green Version]
  33. Kong, D.; Liu, S.; Dai, Y. Environmental Policy, Company Environment Protection, and Stock Market Performance: Evidence from China. Corp. Soc. Responsib. Environ. Manag. 2014, 21, 100–112. [Google Scholar] [CrossRef]
  34. Yadav, P.L.; Han, S.H.; Rho, J.J. Impact of Environmental Performance on Firm Value for Sustainable Investment: Evidence from Large US Firms. Bus. Strategy Environ. 2016, 25, 402–420. [Google Scholar] [CrossRef]
  35. Velte, P. Does ESG performance have an impact on financial performance? Evidence from Germany. J. Glob. Responsib. 2017, 8, 169–178. [Google Scholar] [CrossRef]
  36. Barney, J. Firm resources and sustained competitive advantage. J. Manag. 1991, 17, 99–120. [Google Scholar] [CrossRef]
  37. Branco, M.C.; Rodrigues, L.L. Corporate social responsibility and resource-based perspectives. J. Bus. Ethics 2006, 69, 111–132. [Google Scholar] [CrossRef]
  38. Hu, J.; Wang, S.; Xie, F. Environmental responsibility, market valuation, and firm characteristics: Evidence from China. Corp. Soc. Responsib. Environ. Manag. 2018, 25, 1376–1387. [Google Scholar] [CrossRef]
  39. Azmi, W.; Hassan, M.K.; Houston, R.; Karim, M.S. ESG activities and banking performance: International evidence from emerging economies. J. Int. Financ. Mark. Inst. Money 2021, 70, 101277. [Google Scholar] [CrossRef]
  40. Ferrell, A.; Liang, H.; Renneboog, L. Socially responsible firms. J. Financ. Econ. 2016, 122, 585–606. [Google Scholar] [CrossRef] [Green Version]
  41. Miralles-Quirós, M.; Miralles-Quirós, J. The Value Relevance of Environmental, Social, and Governance Performance: The Brazilian Case. Sustainability 2018, 10, 574. [Google Scholar] [CrossRef] [Green Version]
  42. Abdi, Y.; Li, X.; Càmara-Turull, X. Impact of Sustainability on Firm Value and Financial Performance in the Air Transport Industry. Sustainability 2020, 12, 9957. [Google Scholar] [CrossRef]
  43. Bătae, O.M.; Dragomir, V.D.; Feleagă, L. The relationship between environmental, social, and financial performance in the banking sector: A European study. J. Clean. Prod. 2021, 290, 125791. [Google Scholar] [CrossRef]
  44. Uyar, A.; Kilic, M.; Koseoglu, M.A.; Kuzey, C.; Karaman, A.S. The link among board characteristics, corporate social responsibility performance, and financial performance: Evidence from the hospitality and tourism industry. Tour. Manag. Perspect. 2020, 35, 100714. [Google Scholar] [CrossRef]
  45. Xie, J.; Nozawa, W.; Yagi, M.; Fujii, H.; Managi, S. Do environmental, social, and governance activities improve corporate financial performance? Bus. Strategy Environ. 2019, 28, 286–300. [Google Scholar] [CrossRef] [Green Version]
  46. Jitmaneeroj, B. Reform priorities for corporate sustainability. Manag. Decis. 2016, 54, 1497–1521. [Google Scholar] [CrossRef]
  47. Ting, I.W.K.; Azizan, N.A.; Bhaskaran, R.K.; Sukumaran, S.K. Corporate Social Performance and Firm Performance: Comparative Study among Developed and Emerging Market Firms. Sustainability 2019, 12, 26. [Google Scholar] [CrossRef] [Green Version]
  48. Duque-Grisales, E.; Aguilera-Caracuel, J. Environmental, Social and Governance (ESG) Scores and Financial Performance of Multilatinas: Moderating Effects of Geographic International Diversification and Financial Slack. J. Bus. Ethics 2019, 168, 315–334. [Google Scholar] [CrossRef]
  49. Baldini, M.; Maso, L.D.; Liberatore, G.; Mazzi, F.; Terzani, S. Role of Country- and Firm-Level Determinants in Environmental, Social, and Governance Disclosure. J. Bus. Ethics 2016, 150, 79–98. [Google Scholar] [CrossRef]
  50. Govindan, K.; Kilic, M.; Uyar, A.; Karaman, A.S. Drivers and value-relevance of CSR performance in the logistics sector: A cross-country firm-level investigation. Int. J. Prod. Econ. 2021, 231, 107835. [Google Scholar] [CrossRef]
  51. Bayyurt, N.; Gokhan, D. Economics. Performance measurement of Turkish and Chinese manufacturing firms: A comparative analysis. Eurasian J. Bus. Econ. 2008, 1, 71–83. [Google Scholar]
  52. Harrison, J.; Rouse, P. DEA and accounting performance measurement. In Handbook of Operations Analytics Using Data Envelopment Analysis; Springer: Boston, MA, USA, 2016; pp. 385–412. [Google Scholar]
  53. Begoña, G.-N.; Carlos, S.-C.; Cecilio, C.M. Microfinance institutions and efficiency. Omega 2007, 35, 131–142. [Google Scholar]
  54. lo Storto, C. The analysis of the cost-revenue production cycle efficiency of the Italian airports: A NSBM DEA approach. J. Air Transport. Manag. 2018, 72, 77–85. [Google Scholar] [CrossRef]
  55. Chen, X.; Wang, X.; Wu, D.D.; Zhang, Z. Analysing firm performance in Chinese IT industry: DEA Malmquist productivity measure. Int. J. Inf. Technol. Manag. 2011, 10, 3–23. [Google Scholar] [CrossRef]
  56. Refinitiv. Environmental, Social and Governance (ESG) Scores from Refinitiv. 2021. Available online: https://www.refinitiv.com/content/dam/marketing/en_us/documents/methodology/refinitiv-esg-scores-methodology.pdf (accessed on 15 February 2022).
  57. Oxelheim, L.; Randøy, T. The impact of foreign board membership on firm value. J. Bank. Financ. 2003, 27, 2369–2392. [Google Scholar] [CrossRef] [Green Version]
  58. Neely, A. Exploring the financial consequences of the servitization of manufacturing. Oper. Manag. Res. 2008, 1, 103–118. [Google Scholar] [CrossRef] [Green Version]
  59. Hancock, J.I.; Allen, D.G.; Bosco, F.A.; McDaniel, K.R.; Pierce, C.A. Meta-Analytic Review of Employee Turnover as a Predictor of Firm Performance. J. Manag. 2011, 39, 573–603. [Google Scholar] [CrossRef] [Green Version]
  60. Hsiao, H.I.; Kemp, R.G.M.; van der Vorst, J.G.A.J.; Omta, S.W.F. A classification of logistic outsourcing levels and their impact on service performance: Evidence from the food processing industry. Int. J. Prod. Econ. 2010, 124, 75–86. [Google Scholar] [CrossRef]
  61. Činčalová, S.; Hedija, V. Firm Characteristics and Corporate Social Responsibility: The Case of Czech Transportation and Storage Industry. Sustainability 2020, 12, 1992. [Google Scholar] [CrossRef] [Green Version]
  62. Carmeli, A.; Schaubroeck, J.; Tishler, A. How CEO empowering leadership shapes top management team processes: Implications for firm performance. Leadersh. Q 2011, 22, 399–411. [Google Scholar] [CrossRef]
  63. Ling, Y.H. The influence of intellectual capital on global initiatives. VINE 2012, 42, 129–144. [Google Scholar] [CrossRef]
  64. LiPuma, J.A.; Newbert, S.L.; Doh, J.P. The effect of institutional quality on firm export performance in emerging economies: A contingency model of firm age and size. Small Bus. Econ. 2013, 40, 817–841. [Google Scholar] [CrossRef]
  65. Bhandari, L.C. Debt/Equity Ratio and Expected Common Stock Returns: Empirical Evidence. J. Financ. 1988, 43, 507–528. [Google Scholar] [CrossRef]
  66. Kotey, B. Debt Financing and Factors Internal to the Business. Int. Small Bus. J. 1999, 17, 11–29. [Google Scholar] [CrossRef]
  67. Hofmann, E.; Lampe, K. Financial statement analysis of logistics service providers: Ways of enhancing performance. Int. J. Phys. Distrib. Logist. Manag. 2013, 43, 321–342. [Google Scholar] [CrossRef]
  68. Zheng, Y.; Rashid, M.H.; Siddik, A.B.; Wei, W.; Hossain, S.Z. Corporate Social Responsibility Disclosure and Firm’s Productivity: Evidence from the Banking Industry in Bangladesh. Sustainability 2022, 14, 6237. [Google Scholar] [CrossRef]
  69. Zhao, S.; Wang, J.; Ye, M.; Huang, Q.; Si, X. An Evaluation of Supply Chain Performance of China’s Prefabricated Building from the Perspective of Sustainability. Sustainability 2022, 14, 1299. [Google Scholar] [CrossRef]
  70. Gholami, R.; Añón Higón, D.; Emrouznejad, A. Hospital performance: Efficiency or quality? Can we have both with IT? Expert Syst. Appl. 2015, 42, 5390–5400. [Google Scholar] [CrossRef] [Green Version]
  71. Noh, Y. Evaluation of the resource utilization efficiency of university libraries using DEA techniques and a proposal of alternative evaluation variables. Libr. Hi Tech. 2011, 29, 697–724. [Google Scholar] [CrossRef]
  72. Li, W.; Wang, L.; Wan, Q.; You, W.; Zhang, S. A Configurational Analysis of Family Farm Management Efficiency: Evidence from China. Sustainability 2022, 14, 6015. [Google Scholar] [CrossRef]
  73. Shang, J.-K.; Hung, W.-T.; Lo, C.-F.; Wang, F.-C. Ecommerce and hotel performance: Three-stage DEA analysis. Serv. Ind. J. 2008, 28, 529–540. [Google Scholar] [CrossRef]
  74. Ouenniche, J.; Carrales, S. Assessing efficiency profiles of UK commercial banks: A DEA analysis with regression-based feedback. Ann. Oper. Res. 2018, 266, 551–587. [Google Scholar] [CrossRef] [Green Version]
  75. Cooper, W.W.; Seiford, L.M.; Tone, K. Introduction to Data Envelopment Analysis and Its Uses: With DEA-Solver Software and References; Springer Science & Business Media: New York, NY, USA, 2006. [Google Scholar]
  76. Banker, R.D.; Charnes, A.; Cooper, W.W. Some models for estimating technical and scale inefficiencies in data envelopment analysis. Manag. Sci. 1984, 30, 1078–1092. [Google Scholar] [CrossRef] [Green Version]
  77. Hair, J.F.; Black, W.C.; Babin, B.J.; Anderson, R.E. Multivariate Data Analysis: Global Edition, 7th ed.; Pearson Education Limited: London, UK, 2014. [Google Scholar] [CrossRef]
  78. Abdallah, A.B.; Al-Ghwayeen, W.S. Green supply chain management and business performance. Bus. Process. Manag. J. 2020, 26, 489–512. [Google Scholar] [CrossRef]
  79. Rao, P.; Holt, D. Do green supply chains lead to competitiveness and economic performance? Int. J. Oper. Prod. Manag. 2005, 25, 898–916. [Google Scholar] [CrossRef]
  80. Johnson, G.; Whittington, R.; Regnér, P.; Angwin, D.; Scholes, K. Exploring Strategy; Pearson: London, UK, 2020. [Google Scholar]
  81. Brammer, S.; Millington, A. Does it pay to be different? An analysis of the relationship between corporate social and financial performance. Strateg. Manag. J. 2008, 29, 1325–1343. [Google Scholar] [CrossRef]
  82. Wang, H.; Choi, J.; Li, J. Too Little or Too Much? Untangling the Relationship between Corporate Philanthropy and Firm Financial Performance. Organ. Sci. 2008, 19, 143–159. [Google Scholar] [CrossRef] [Green Version]
  83. Godfrey, P.C. The Relationship between Corporate Philanthropy And Shareholder Wealth: A Risk Management Perspective. Acad. Manag. Rev. 2005, 30, 777–798. [Google Scholar] [CrossRef] [Green Version]
  84. Wang, K.; Miao, Y.; Su, C.-H.; Chen, M.-H.; Wu, Z.; Wang, T. Does Corporate Charitable Giving Help Sustain Corporate Performance in China? Sustainability 2019, 11, 1491. [Google Scholar] [CrossRef] [Green Version]
  85. De Grip, A.; Sauermann, J. The Effects of Training on Own and Co-worker Productivity: Evidence from a Field Experiment. Econ. J. 2012, 122, 376–399. [Google Scholar] [CrossRef] [Green Version]
  86. Turban, D.B.; Greening, D.W. Corporate Social Performance and Organizational Attractiveness to Prospective Employees. Acad. Manag. J. 1997, 40, 658–672. [Google Scholar] [CrossRef]
  87. Bénabou, R.; Tirole, J. Individual and corporate social responsibility. Economica 2010, 77, 1–19. [Google Scholar] [CrossRef] [Green Version]
  88. Shi, W.; Veenstra, K. The Moderating Effect of Cultural Values on the Relationship between Corporate Social Performance and Firm Performance. J. Bus. Ethics 2021, 174, 89–107. [Google Scholar] [CrossRef]
  89. The Heritage Foundation. 2021 China Transparency Report; The Heritage Foundation: Washington, DC, USA, 2021; Available online: https://www.heritage.org/CTP (accessed on 18 March 2022).
Figure 1. The research framework of this study.
Sustainability 14 08354 g001
Table 1. Input and output definitions.
Input/OutputFactorsDefinitionsSources
InputEmployees (people)Represents the number of both full-time and part-time employees of the company.[45,51]
Property, Plant, and Equipment
(in thousand USD)
Represents gross property, plant, and equipment less the accumulated reserves for depreciation, depletion, and amortization.[51,52]
Operating Expenses (in thousand USD)Represents the sum of all expenses related to operations[52,53]
OutputRevenues (in thousand USD)Represents gross sales and other operating revenues less discounts, returns, and allowances.[45,54]
Market Value (in thousand USD)Represents market capitalization at the fiscal year-end date plus preferred stock plus minority interest plus total debt minus cash.[55]
Table 2. Descriptive statistics of input and output.
TypeIndicatorUnitMeanMin.Max.Std.K-S Test a
InputEmployeesPerson16,475.188.00239,000.0035,897.70p < 0.01
InputOperating Expensesthousands of USD 4,383,261.0561,342.0064,907,000.009,314,310.26p < 0.01
InputProperty, Plant, Equipmentthousands of USD 4,523,949.5020,127.0055,728,000.009,418,345.73p < 0.01
OutputRevenuesthousands of USD 5,007,733.14113,285.0069,693,000.0010,171,638.73p < 0.01
OutputMarket valuethousands of USD 7,848,691.1463,722.00125,124,877.0018,634,345.91p < 0.01
Note: a The Kolmogorov–Smirnov test.
Table 3. Correlation matrix of input and output.
(1)(2)(3)(4)(5)
1. Employees1
2. Operating Expenses0.924 ***1
3. Property, Plant, Equipment0.488 ***0.551 ***1
4. Revenues0.361 ***0.407 ***0.934 ***1
5. Market Value0.921 ***0.993 ***0.639 ***0.509 ***1
Note: *** indicates the statistical significance at the level of 1%.
Table 4. Descriptive statistics of variables in OLS regression.
MinMaxMeanStd. VIF
Business Performance0.641.000.830.12
Environmental Score0.0083.1025.5422.681.696
Social Score12.2888.2948.6320.481.272
Governance Score5.5588.7032.8219.142.275
Age1.795.643.530.831.267
Leverage5.157.221.541.651.060
Size2.0812.388.202.331.489
Table 5. Regression analysis on relationship between business performance and ESG combined score.
VariableOLS Regression
Control Variables
Size−0.431 ***
Age−0.077
Leverage−0.135
Independent Variables
Environmental Score0.342 **
Social Score0.373 **
Governance Score−0.241 **
Note: ** and *** indicate the significance level of 5% and 1%, respectively. The dependent variable is business performance.
Publisher’s Note: MDPI stays neutral with regard to jurisdictional claims in published maps and institutional affiliations.

