1. Introduction
Postal services and network development is an essential part of the socioeconomic infrastructure of a country [
1]. Access to postal services and infrastructure gives consumers connections to global communication, financial, economic, and social networks. High-performing postal networks have reliable service and good connectivity [
1].
WIK Consult [
2] confirmed the importance of postal access points for service consumers. Depending on the country, consumers regard postal access points as important in the next 5–10 years, with a mean of 3.31 (where 1 = not at all important and 4 = very important).
The ERGP [
3] showed that users are generally satisfied with the accessibility of the access points, although in some countries, longer operating hours would be more appreciated. As for the location, consumers want access nearer to their homes or workplaces. According to [
4], postal service consumers are well aware of the locations of the post access points and of the distances needed to travel to get to one. Most of the respondents are satisfied if the distance to letterboxes is not greater that one kilometer, and the maximum distance to a post office should be 3 km.
The social dimensions of postal networks are also important, especially their impacts on vulnerable users. The distances that vulnerable users expect to travel to a postal access point are even shorter: People over age of 65 expect an access point to be no farther than 500 m [
4], although market trends should be taken into consideration [
5].
The main goal of this paper is to determine optimal locations of postal access points (postal offices), regarding the travel cost function. Determining postal service accessibility with respect to distances traveled to a certain access point allows us to analyze the organization of a postal network and the optimal locations of postal offices. This is confirmed by applying the simulated annealing (SA) and brute force search algorithms when searching all the possible solutions in the proposed area (generating the searchable map of the area).
The paper is organized in the following way:
Section 2 addresses the literature review, while
Section 3 focuses on the methods and materials used in the research (the research background and an overview of the research methodology are provided). The application of the brute force and SA algorithms is explained. The results are presented in
Section 4, and the discussion and concluding remarks (including contributions, originality, future research, limitations of the research, and applicability) are given in
Section 5 and
Section 6, respectively.
2. Literature Review
The Postal Services Directive [
6] states that EU Member States should guarantee certain densities of access points in both rural and urban regions. Determining the optimal locations for postal facilities is a well-known problem addressed by many researchers.
One of the most researched strategies of determining the optimal numbers of postal service access points is based on the reorganization of the postal network. This approach is closely connected to the provision of the universal postal service (UPS). The UPS obligation means that countries are obliged to provide a certain set of postal services to their citizens that are transparent and that operate under the same conditions.
The authors in [
7] present principles for designing postal network units adjusted to specific requirements of the postal network organization. The reorganization of the postal network is addressed by the authors in [
8], where DEA and a fuzzy approach tool were used to organize post offices in a rural area. Šarac et al. apply the set covering location problem (SCLP) to determine the minimum number of postal units [
9], while Blagojević et al. integrate Wand-Mendel’s method for the same problem [
10]. The set covering problem was earlier applied for minimizing the number of relay box locations [
11]. Integer linear programming (ILP) and mixed-integer linear programming (MILP) were developed for hybrid hub-and-spoke postal logistics networks [
12], while [
13] proposed a two-stage method to solve a real-world urban postal service network redesign problem.
De-population and rural facility decline is the topic in [
14], while the strategic planning of the postal network in rural communities is addressed in [
15,
16,
17]. The EU Directive [
6] emphasizes the importance of such areas: “Rural postal networks, in, inter alia, mountain and island regions, play an important role in integrating businesses into the national/global economy and in maintaining cohesion in social and employment terms. Furthermore, rural postal points in remote regions can provide an important infrastructure network for access to new electronic communications services”. Unfortunately, many of the postal network access points in these areas have been closed or reorganized or are facing similar scenarios.
To address these problems, many countries impose certain criteria that universal service providers (USP) must meet for the postal service to be considered accessible. The most common criteria are [
3]: the number of postal establishments (PE) per locality or municipality; one PE per number of inhabitants depending on the size of settlement and distinctions between rural and urban; the maximum distance that one has to travel to the nearest PE; the minimum number of post offices providing UPS or the full range of postal services; the density of post offices and access points corresponding to the needs of users; the number of inhabitants/maximum distance, especially in rural areas; the percentage of population at a certain distance from the PE; the number of Pes throughout the whole territory of the country, etc.
It is evident that criteria vary and that there is no unique strategy on the organization of postal networks. This is understandable since the criteria should be tailored to each country’s demographic, geographic, social, and cultural specifics. The social dimension of postal service provision is addressed in [
18], where the authors confirmed that it is possible to ensure socially responsible postal operations.
The redesign of a postal network in terms of collection postboxes was discussed by Bruno et al. [
19,
20]. Those authors provide an interesting approach to postal box network design based on two orientations: the postal service provider and the postal service user. The authors in [
21] also discuss the reorganization of postal boxes in terms of their reduction, providing mathematical formulations and a real data case study.
Network analysis based on the application of GIS (geographic information system) tools has been used for analyzing the optimal locations of facilities [
22,
23]. In the field of postal network organization, Comber et al. [
24] analyzed UK postal network criteria to determine if the closures of post offices met the said criteria, and the results of the analysis showed that most of the criteria were not met with the changes in the post office locations. Furthermore, Higgs and Authors [
25] investigated the social impacts of changes in postal service accessibility, emphasizing rural communities and the elderly.
Another important dimension of postal service reorganization is the accessibility of the service. This implies relationships between service suppliers and consumers with regard to spatial factors such as distances and travel times as well as to demographic, social, economic, and other service-specific factors. Distance from the closest facility is most used to measure the accessibility of a service.
In our previous work [
26], we used post-network density criteria as input data for the GIS-based network analysis of the UPS accessibility for the inhabitants of rural areas. Postal service accessibility was further investigated with spatial analysis methods such as the distance-decay gravity model [
27] and the two-step floating catchment area method (2SFCAM) [
28]. GIS-based analysis was also used to demonstrate postal retail locations in the postal retail market [
29].
Applications of advanced search and programming algorithms for postal network organization and optimization are scarce. Brute force algorithms are often used in searching procedures and commonly used to solve problems with pattern searching [
30].
SA is one of the most-used metaheuristic algorithms for solving various types of optimization problems. It was first implemented to show analogies between annealing in solids and the optimization of very complex systems [
31]. For transportation-sector problems, it was first used for routing and location problems where authors implemented it in the traveling salesman problem and the p-median location problem [
32]. SA is often used for solving similar positioning and allocation problems such as the allocation in electric vehicle charging stations [
33], the positioning of small cells for coverage and for cost-efficient 5G network deployment [
34], multi-base buoy passive localization [
35], swarm optimization in underwater acoustic positioning [
36,
37], intelligent bus positioning based on Internet of Things [
38], etc. SA was also applied for logistic hub location–allocation problems [
39,
40] and for solving pickup and delivery problems [
41,
42,
43,
44,
45].
In this research, the SA algorithm is used to find approximate (global) optimums through the minimization of the evaluation function. SA compares the proposed solution of postal office (PO) position of map by calculating the evaluation function (the sum of all distances to the nearest PO). If the neighbor position has the better result, then the current neighbor solution becomes the current best solution. SA optimization is more robust and is not sensitive to the problems of local minimum (gradient descent and similar algorithms would stop the searching process in the first local minimum).
3. Materials and Methods
3.1. Research Background
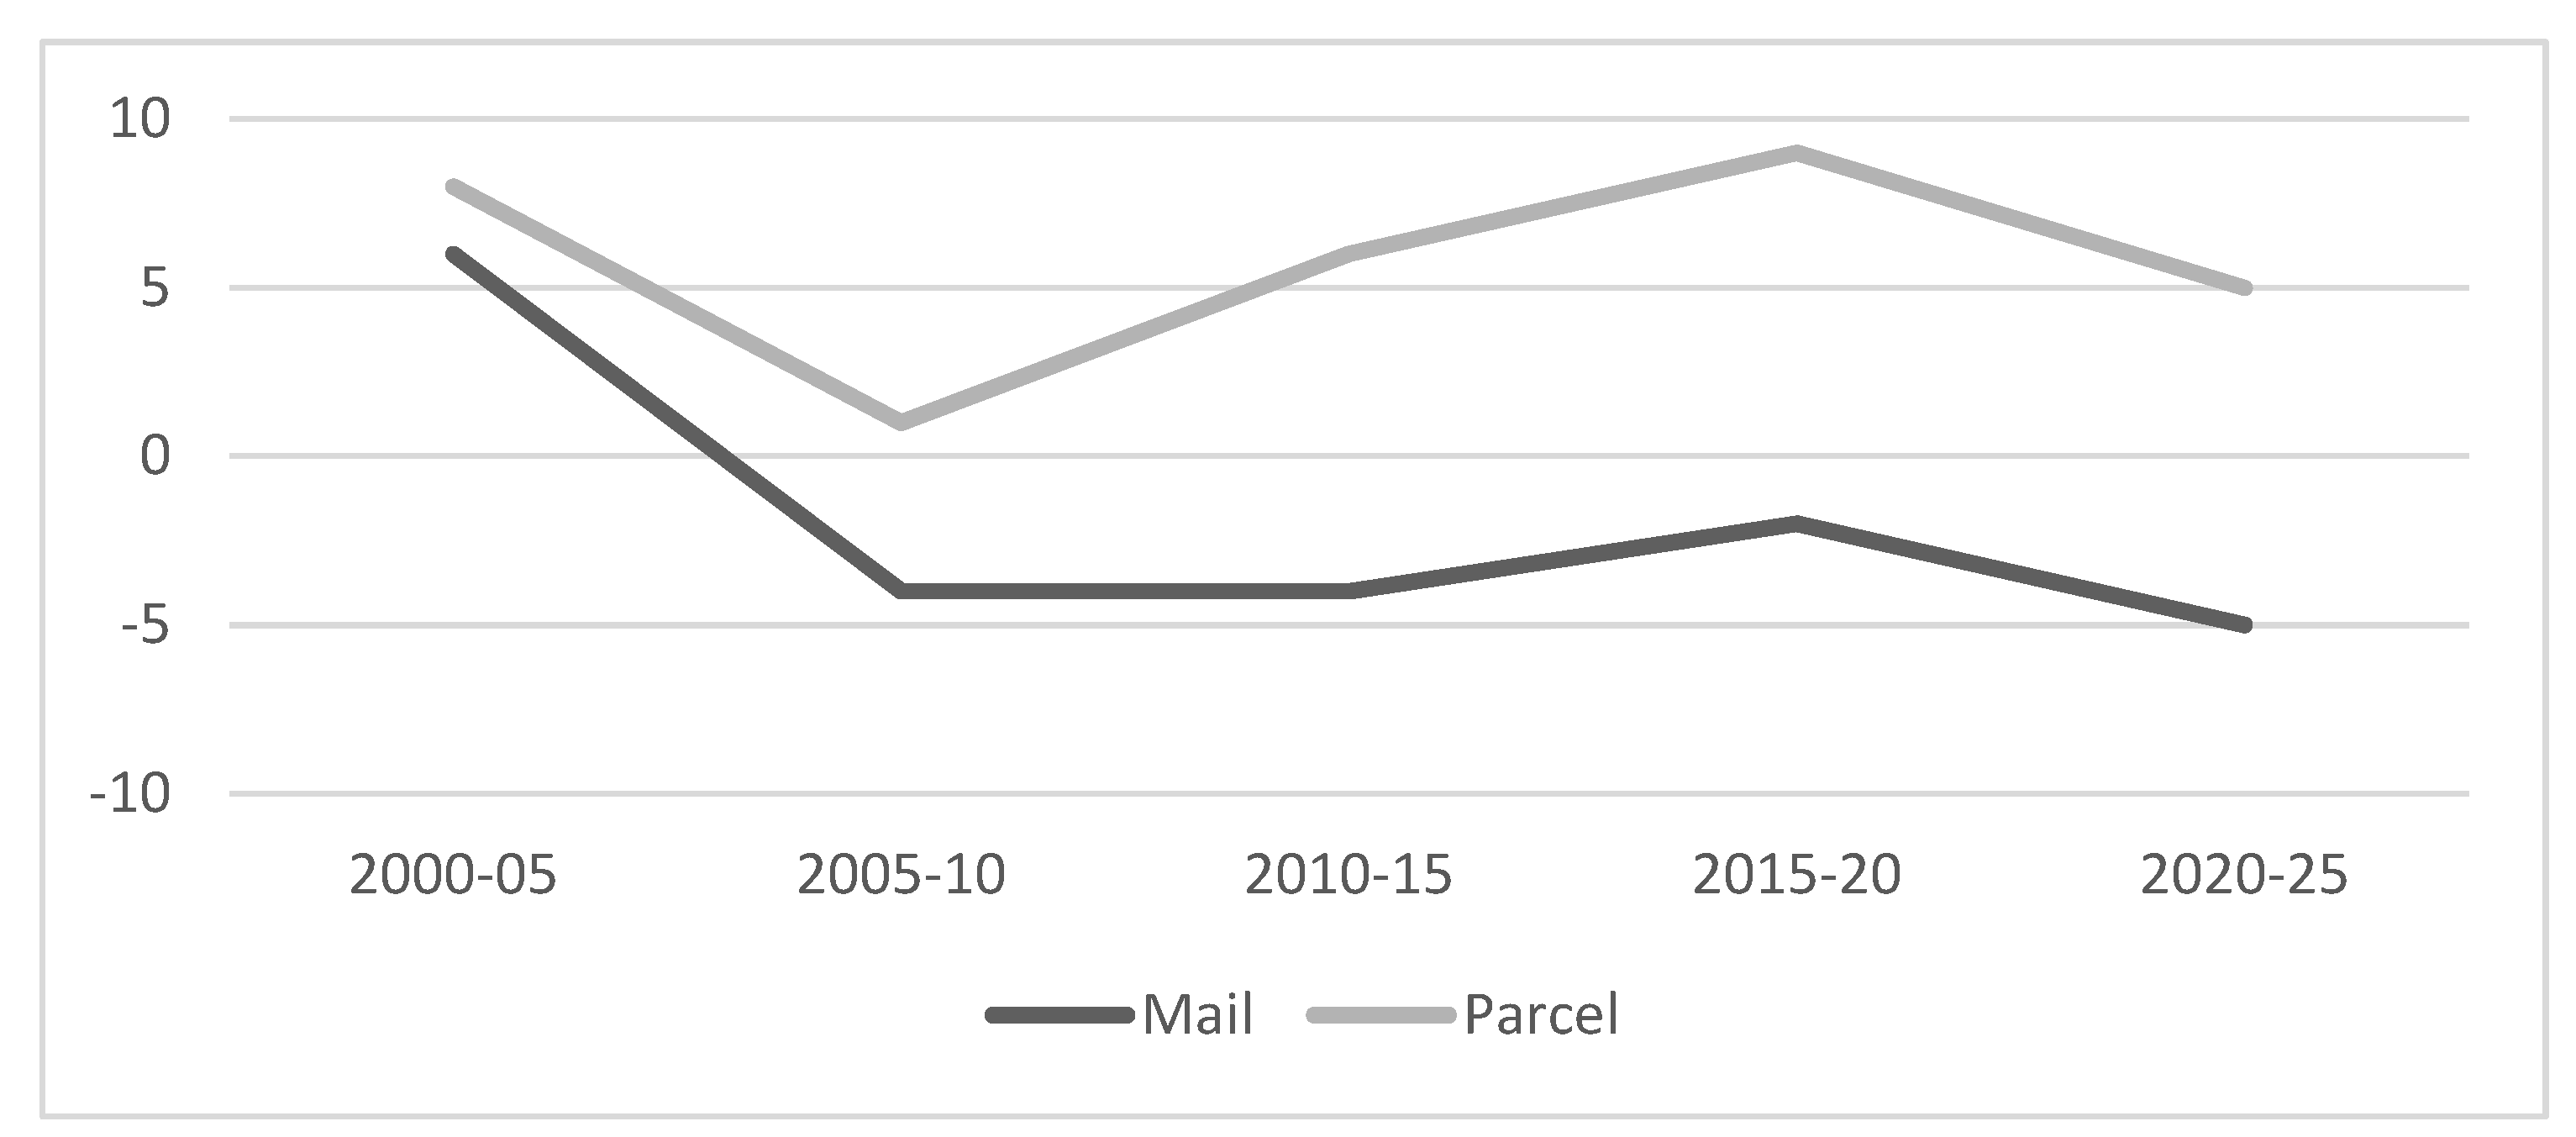
Current trends in postal market volumes are presented in
Figure 1. The continuous growth of the parcel market has been present and is expected in the future. On the other side, the letter market records a continuous decrease in volumes that is also expected to continue. McKinsey & Company [
5] predict that the letter/parcel ratio will equalize by 2025. It is evident that postal service providers must transform their networks, services and technological processes to meet future market needs.
However, despite these trends and predictions, consumers comprise an important part of the postal development market.
Figure 2 shows the responses of consumers regarding possible reasons for the future use of postal services.
A plurality of consumers (48%) finds communication with other entities (people, businesses or public institutions) most important. The delivery of goods, as well as the return options and financial and marketing services are not less important. These indicators show that consumers count on the presence of postal services in the future and can serve as pointers for the strategic planning of future postal development. We already discussed the importance of postal network organization in rural areas, where postal service is important to the users, especially vulnerable users.
Most research on service accessibility is based on the calculation of accessibility measures in relation to certain demographic or geographic units: community level [
46], county population and centroids [
47], population districts [
48], basic spatial units [
49], etc. In our study, we adopt house numbers as data units for determining the optimal location of a postal office. This is for two main reasons: Such fine data resolution is appropriate to use in rural areas, where the necessities of vulnerable users can be studied with greater care, and this approach was appropriate for capturing the character of the universal service and its commitment to accessibility for all citizens.
3.2. Data Preparation and Methodology for Calculating the Postal Service Accessibility
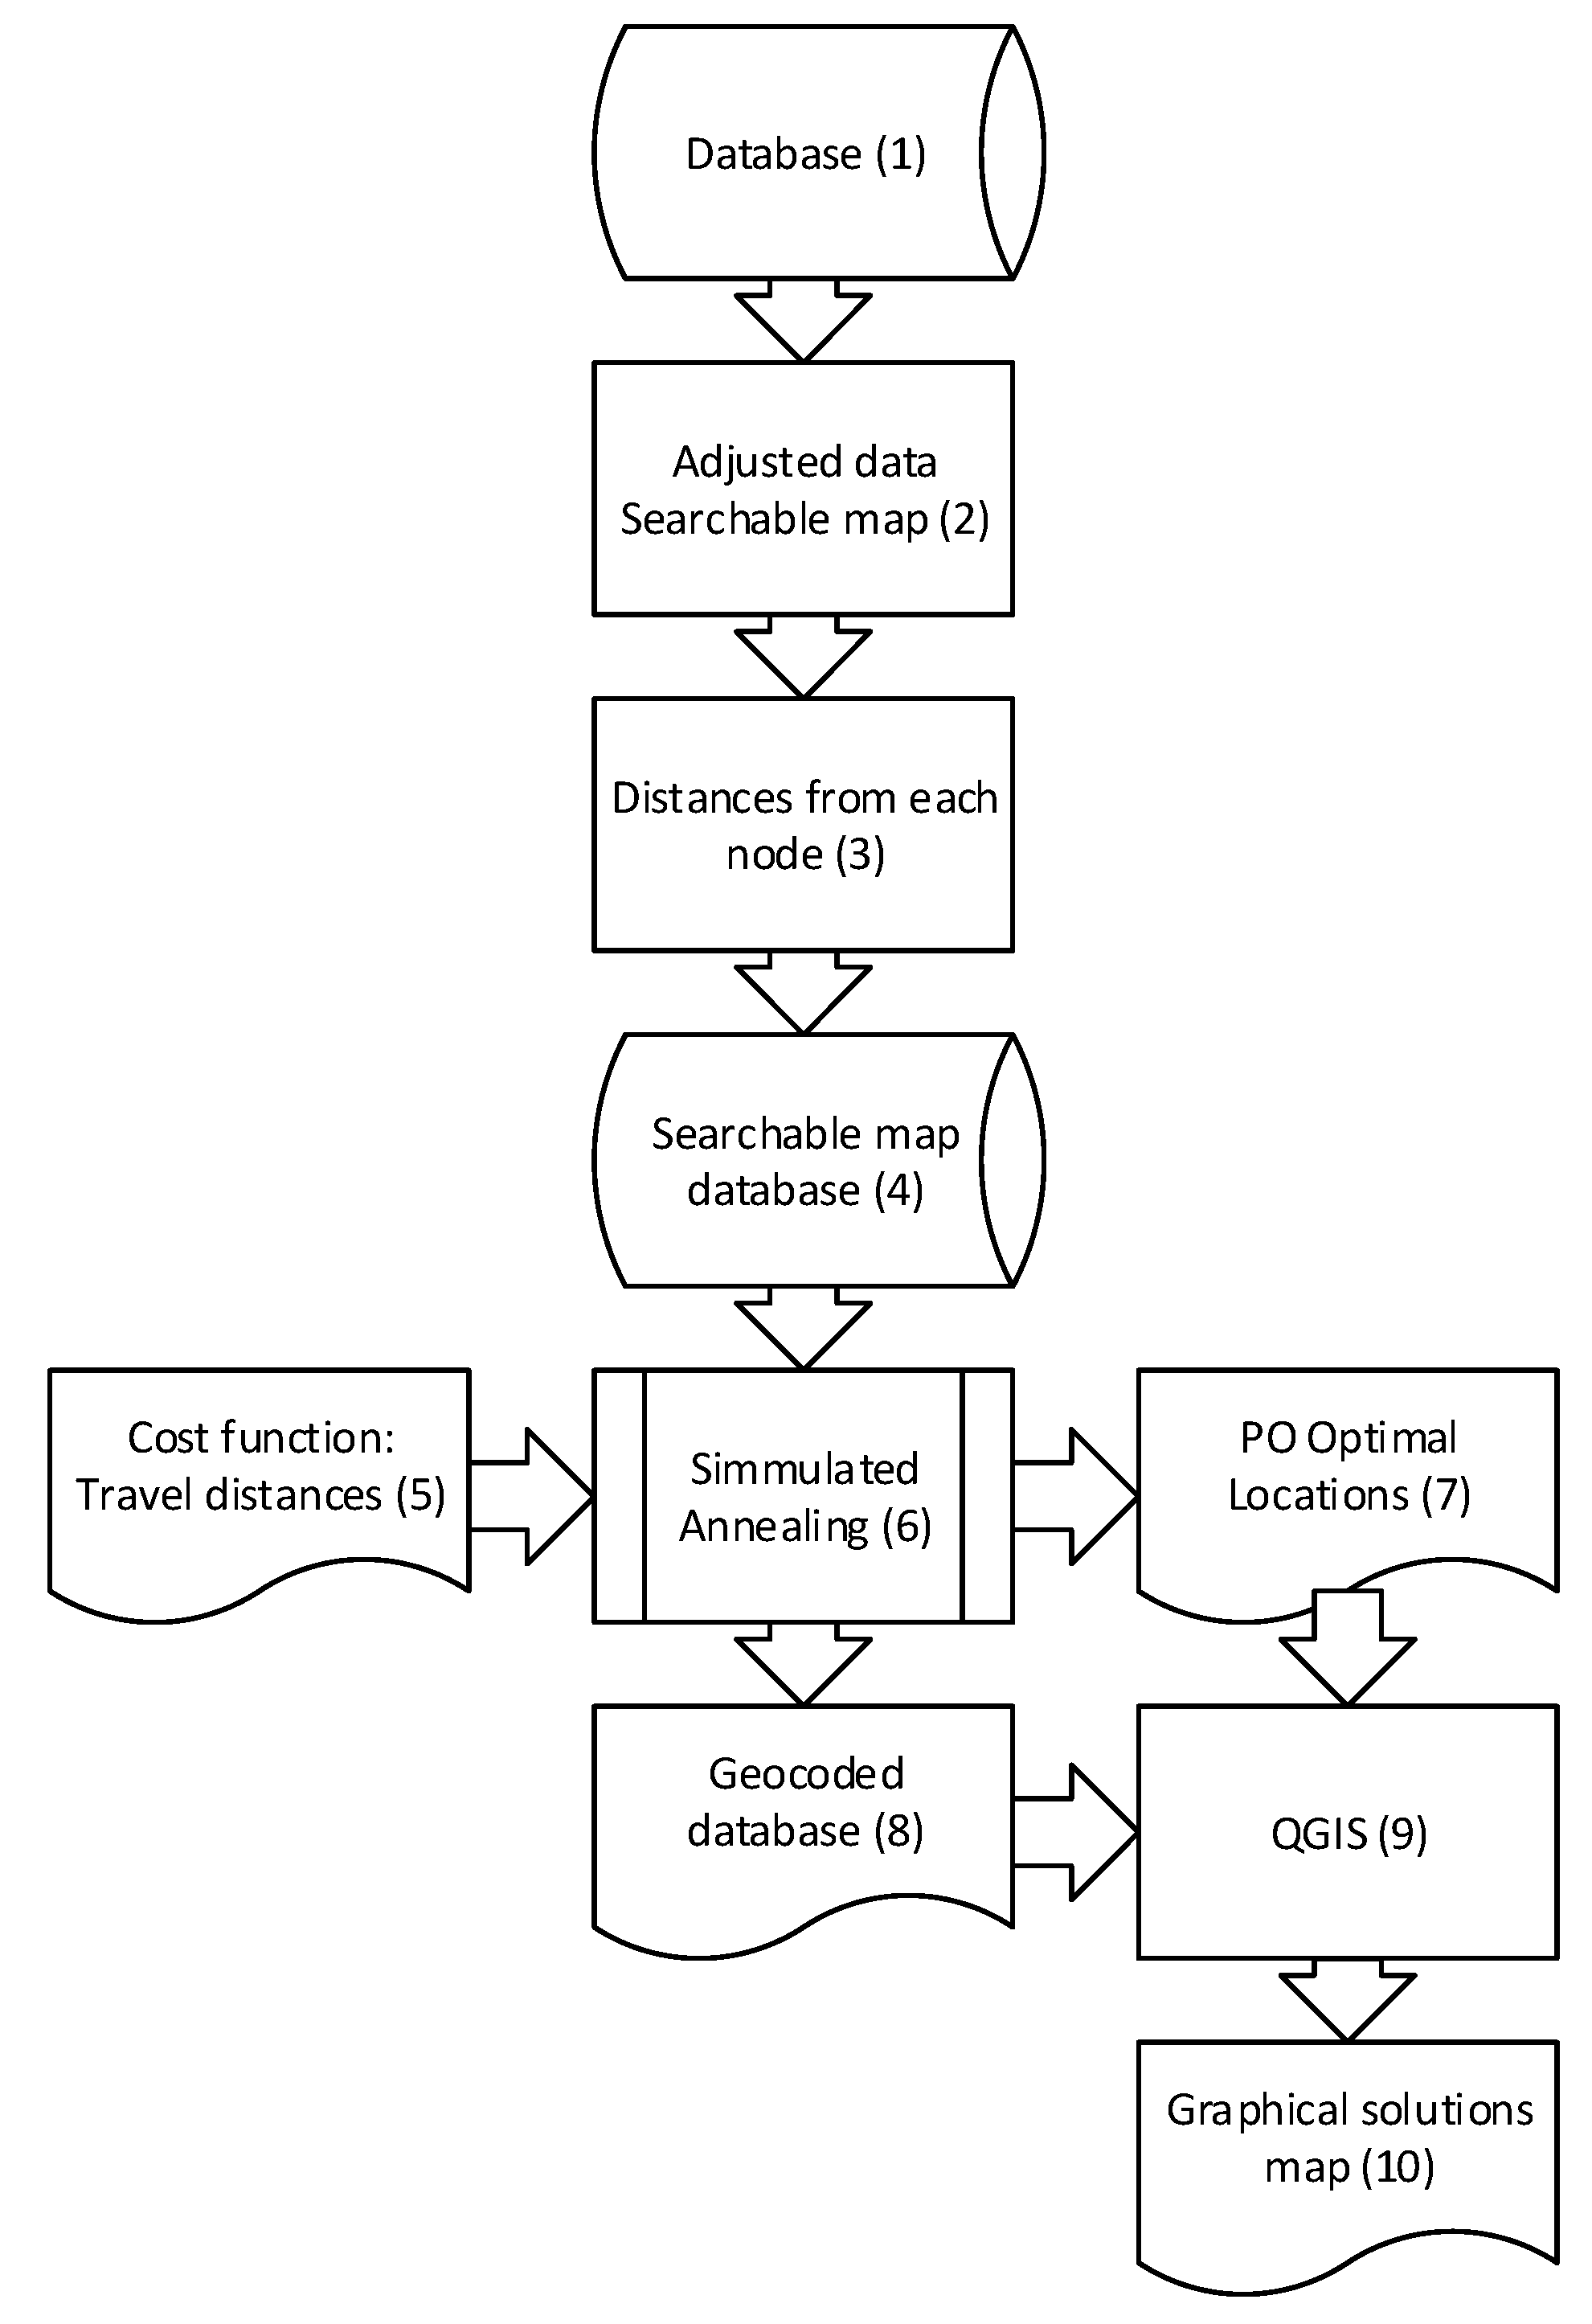
Figure 3, with numerations of individual blocks in the flowchart, shows the methodology of the research.
The first step was the data preparation and adjustment, steps (1) and (2), where the data were organized as a set of searchable data. In this step, all distances between nods were calculated (3). After the data preparation (4), the SA algorithm (6) was used to optimize the positions of the post offices (PO) (7). Grading functions were created by the sum of the travel distances to the nearest post office (5), and these steps are explained in detail in
Section 3.2,
Section 3.3 and
Section 3.4. The results are saved in geocoded database (8) and together with the optimal locations of post offices (7) are presented as graphical solution map (10) in QGIS (9) program.
The software used for steps (2) to (7) was made by the authors in Python programming language in Scientific Python Development Environment–Spyder IDE, run by Anaconda Navigator. Simulations; the data were prepared in Intel® i7, 10th generation of processor, with 6 cores, 16 GB of RAM memory and NVIDIA® GeForce® Mx330 graphical card with 2 GB GDDR5 video memory.
When implementing the SA algorithm to determine optimal post office location, data preparation is the first step of the process. On the road network (graph), the geocoded points (road nodes) are added, and the minimal road distance between them are calculated:
where
is the number of road nodes. The Dijkstra algorithm [
50] was used to find the shortest path between the two nodes in a graph. All results are in symmetrical
matrix named
D:
where
, for
1, N].
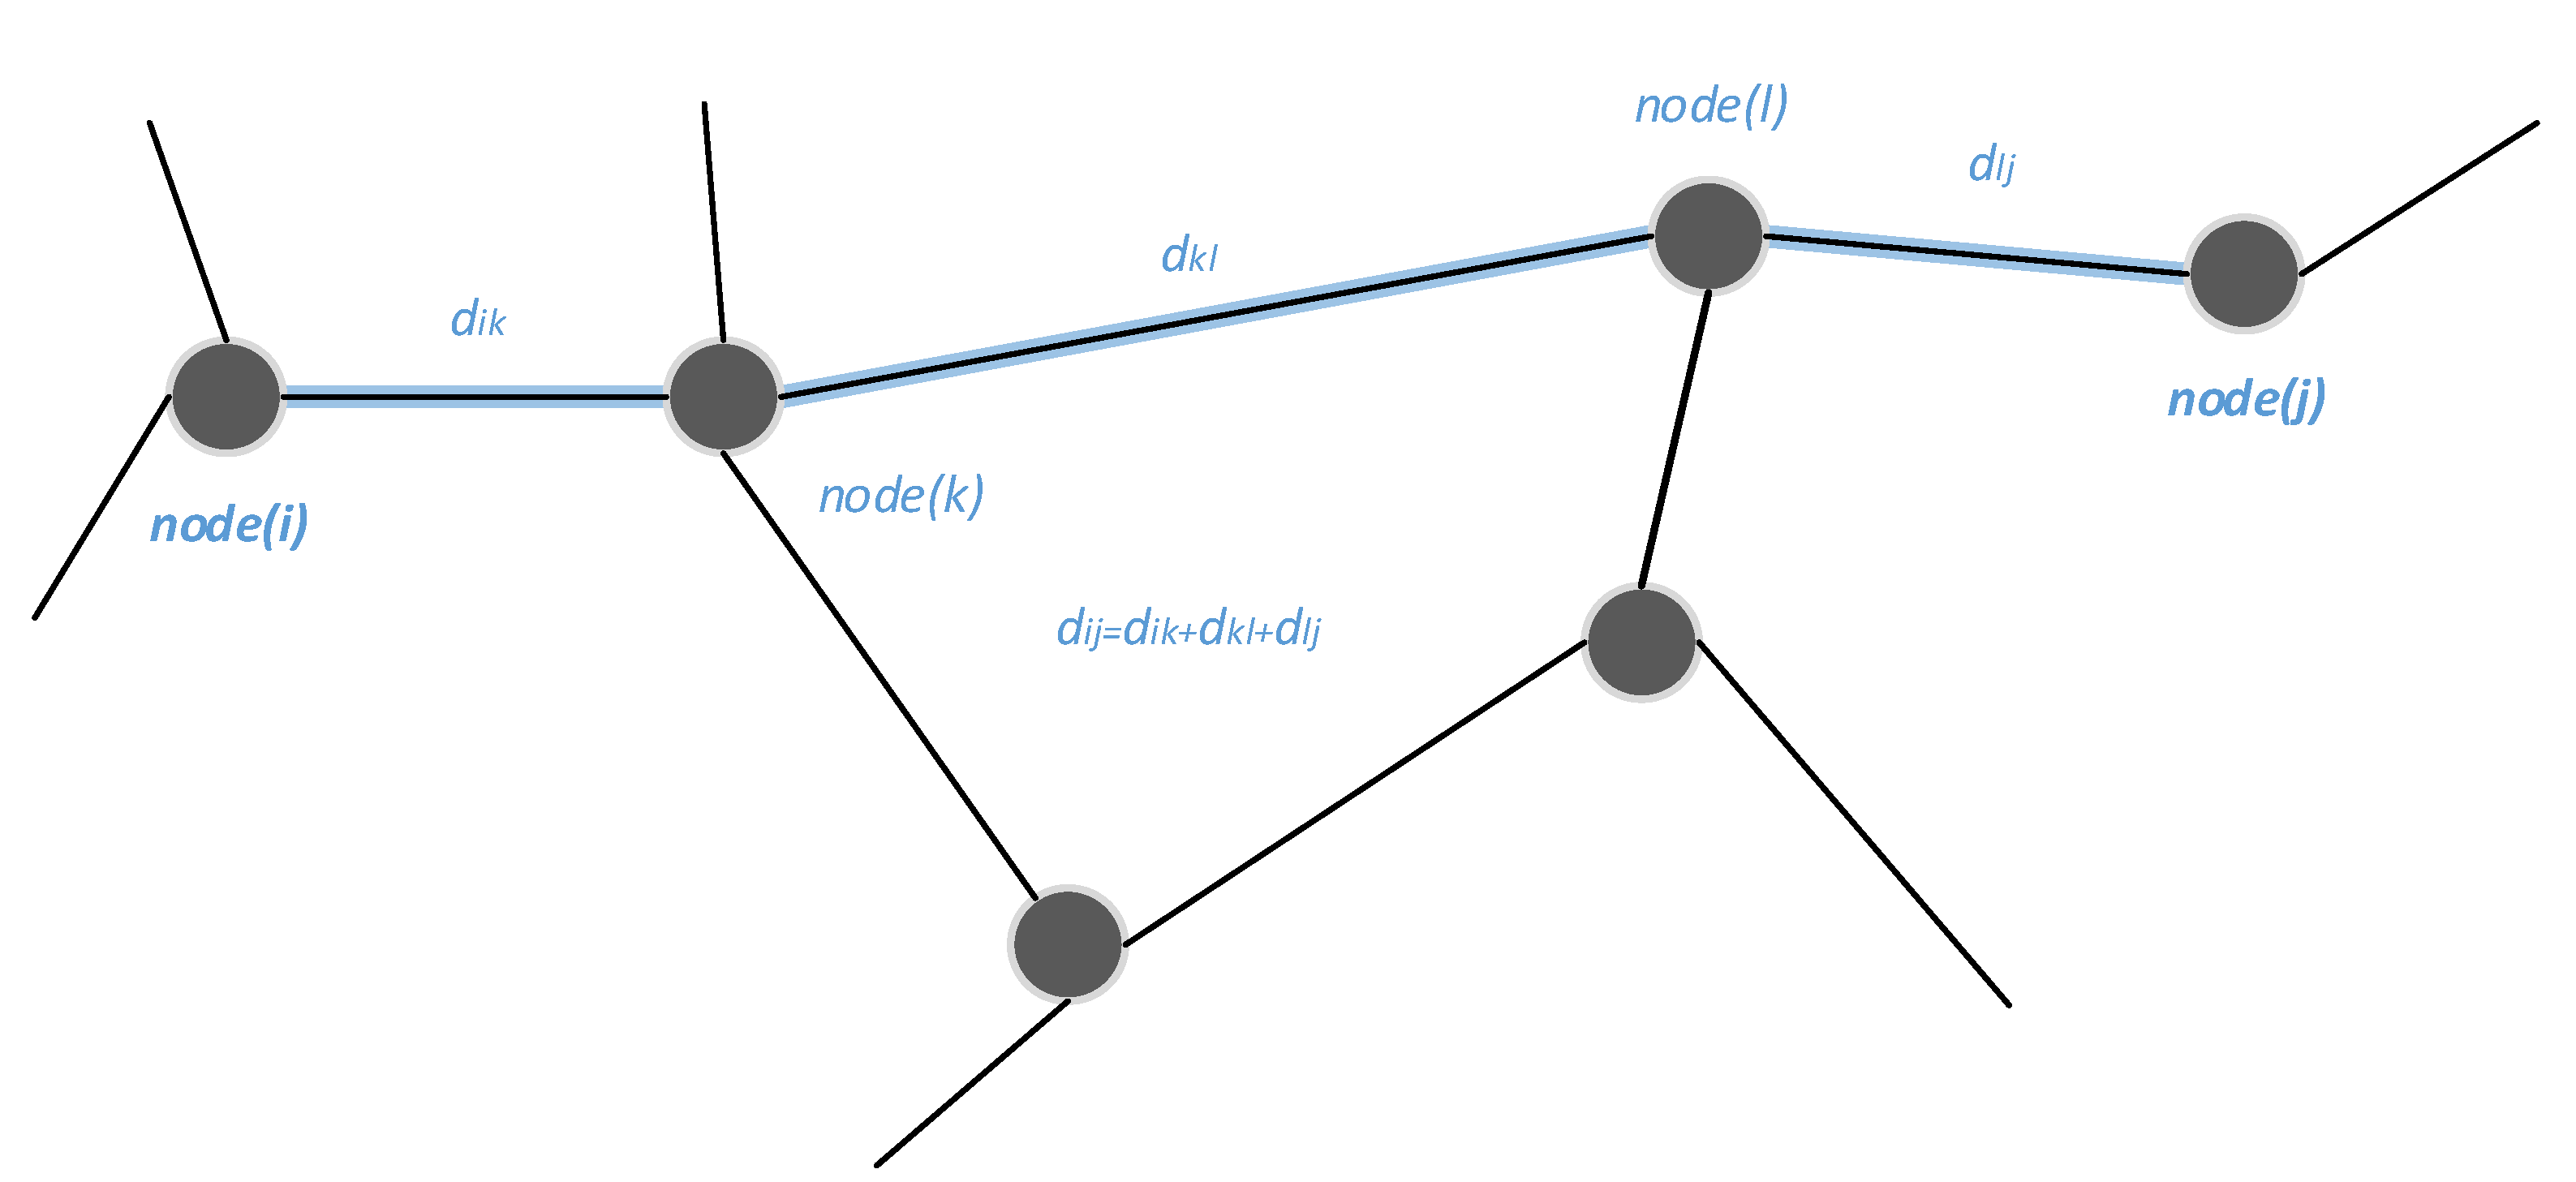
An example of the road distance function between two road nodes is presented in
Figure 4. The distance between nodes with index
i and
j,
, is the sum of the distances between two sequential nodes on the optimal path between
i,
j nodes. In this example:
The road nodes are downsized replacements for graphs.
The elements
of matrix
can be multiplied by the number of houses within the
-th catchment area
:
The new matrix formed with is no longer symmetric since each node has an independent number of house numbers. In this paper, matrix is mostly used, and the road distance between two nodes is multiplied with factor when cost function of solution is calculated.
Road nodes are used for the downsizing domain of the minimization problem. There are 3408 house numbers (
) in the selected area. To solve the problem of finding the optimal locations for a number of
P postal offices in a selected area, the number of combinations without repetition
is:
For road nodes
N = 365, the number of combinations without repetition
is:
The number of solution combinations for
is given in
Table 1.
By downsizing the domain of solution using the road nodes as a type of centroids, the optimal locations for the most post offices can be identified. Additionally, the optimization algorithm can be prove with a brute-force search for up to P = 4 without using a supercomputer or enormous computation power. For P greater than 4, there are large numbers of possible solutions that can hardly be found by brute-force search.
Each road node has a corresponding data that represents the number of houses within the node catchment area. Parameter is used in the multiplication (weight) when distances from one road to another are calculated.
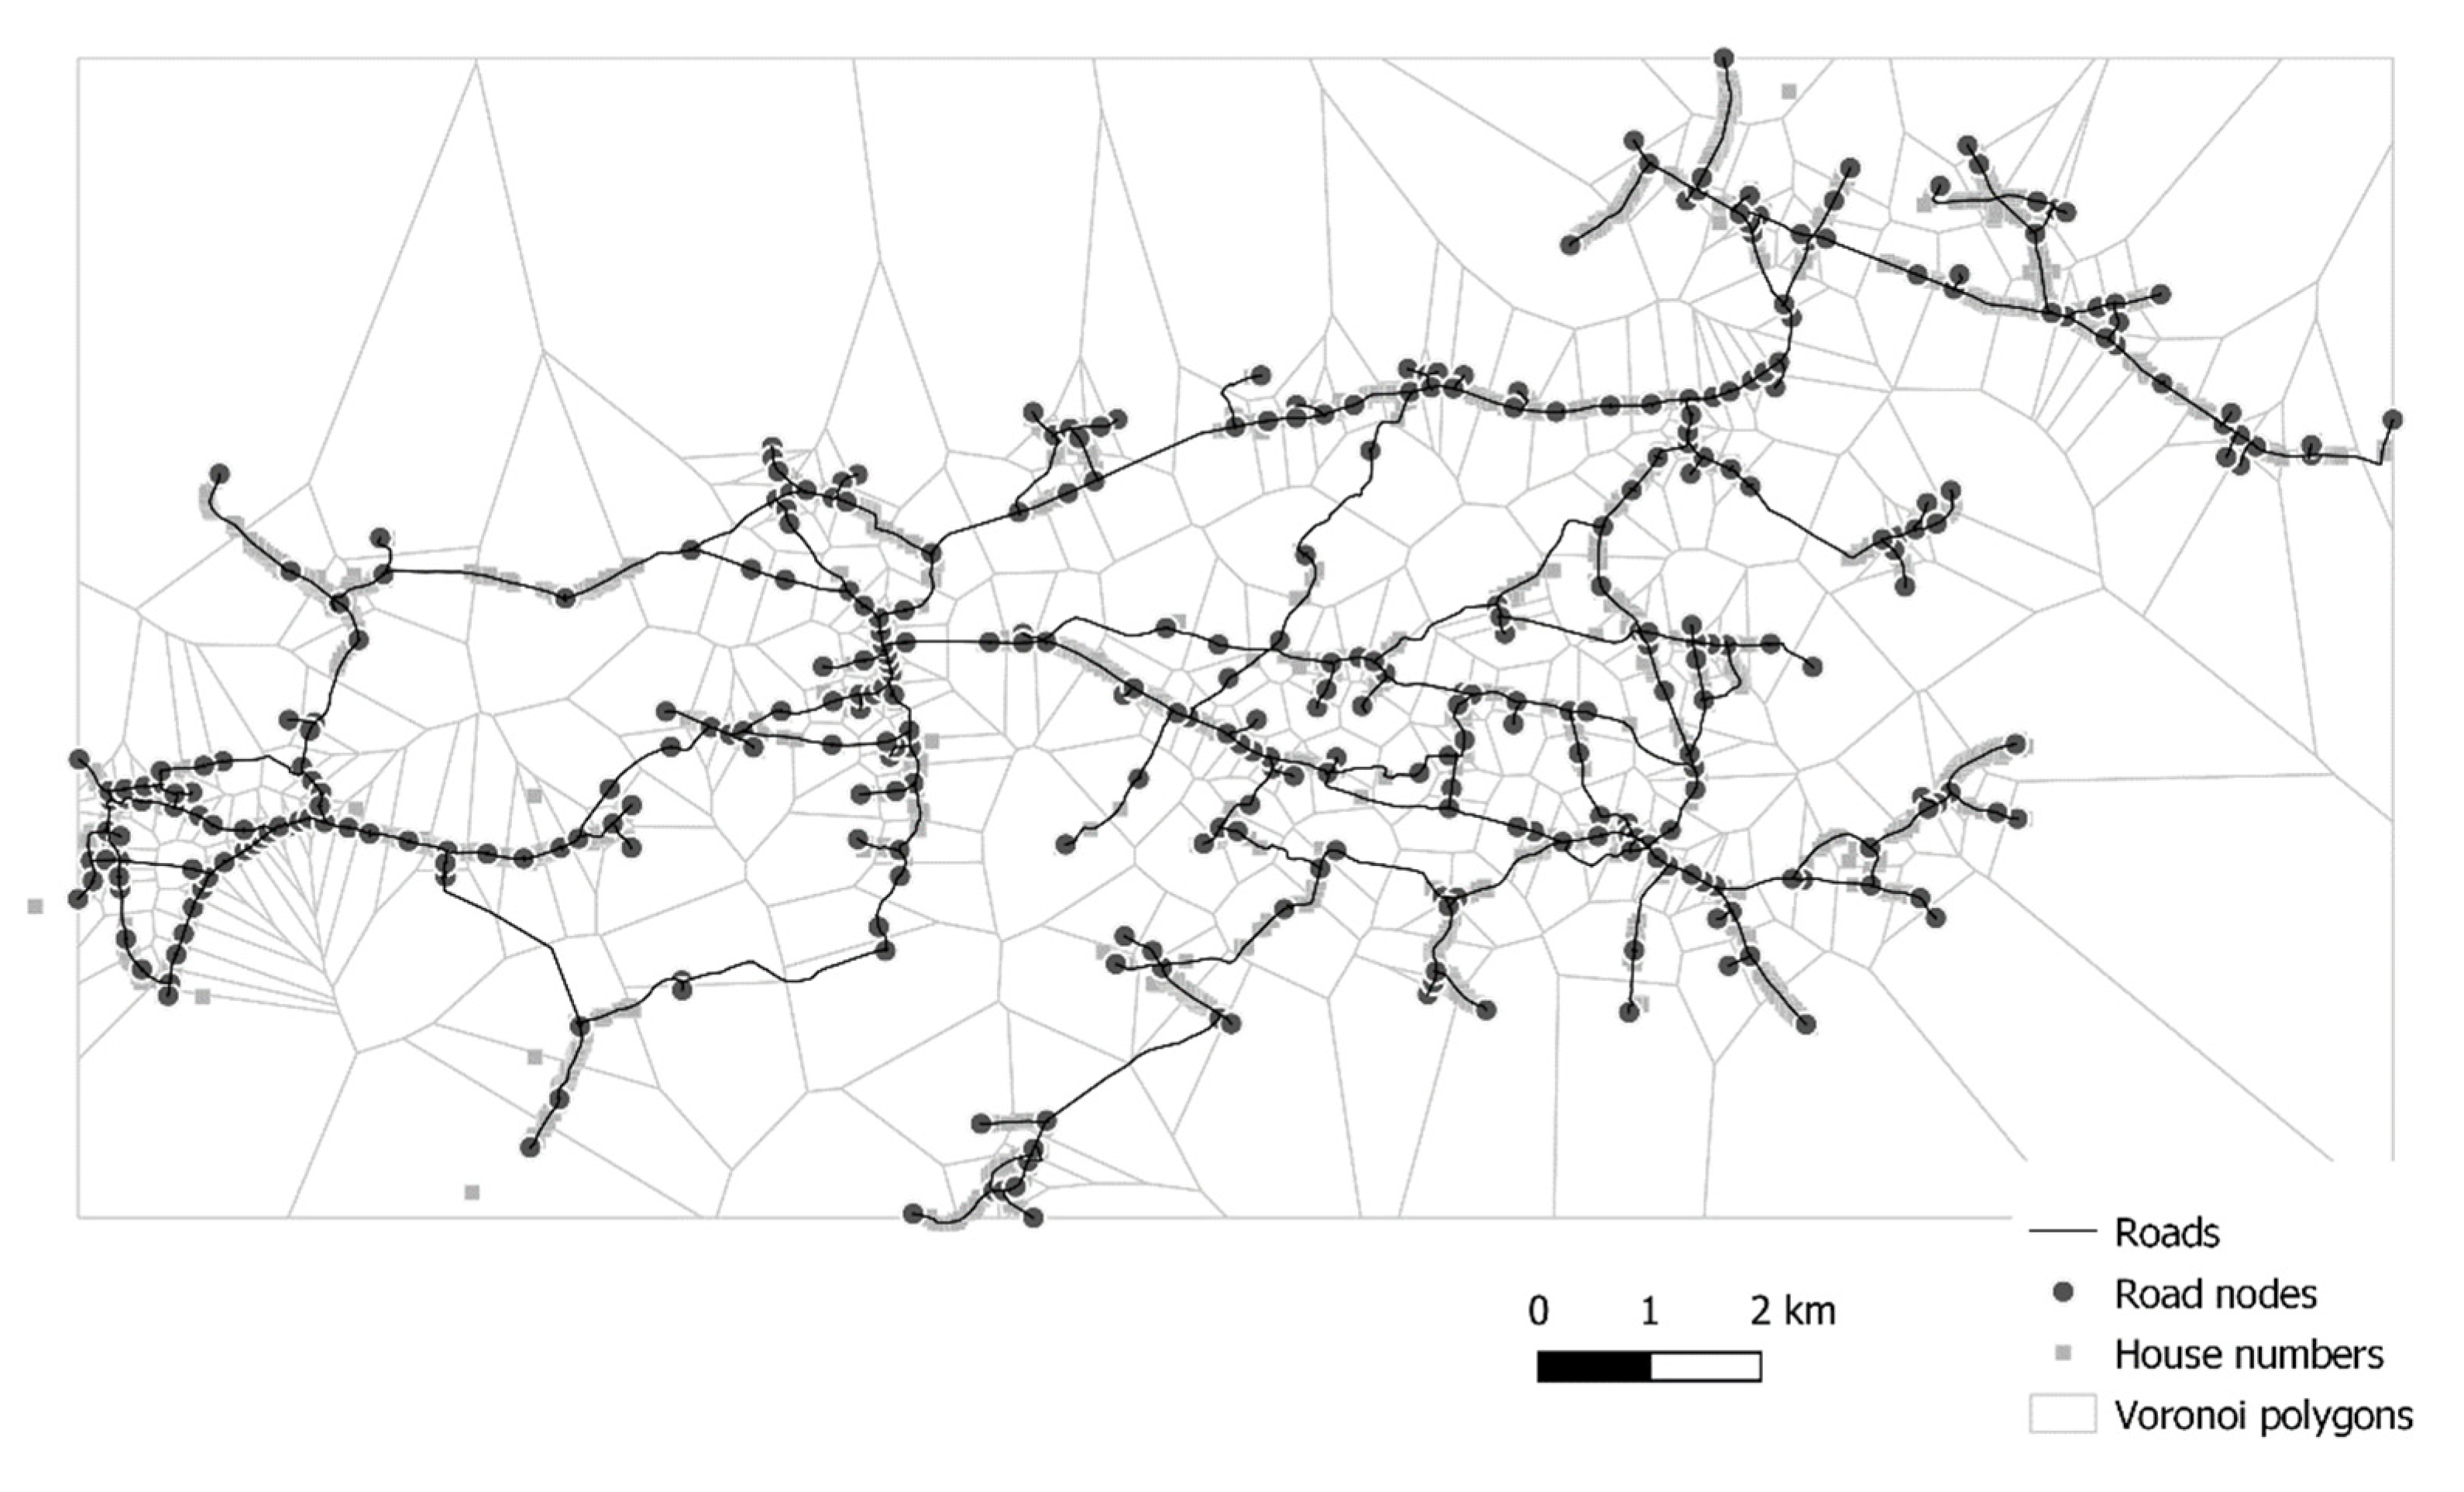
The selected area for the simulation of the proposed model is a rural area in the Republic of Croatia that consists of 3408 house numbers. A detailed map of the area including the locations of house numbers, roads and road nodes is given in
Figure 5.
3.3. Brute-Force Search Algorithm
A brute-force search algorithm for finding solutions is used to calculate the cost functions (the sum of all node distances for selected nodes-possible solutions for the optimal location of a PO). The cost function is calculated for each solution. When searching for the optimal location of one post office (
P = 1), the sum of distances of all nodes to all other nodes is calculated:
where
is the house number in the catchment area of road node
. Matrix
can also be used for solving the brute-force problem. The calculated sums are organized in a matrix (vector) named
C with dimensions
:
If the index of element in vector
C has the minimum value:
Then the optimal position of a post office is on node .
For number of postal offices
, each possible solution contains
numbers of indexes:
where
is
k-th iteration of the solution.
Matrix must be calculated for each solution by adding the distances to the nearest node indexed in solution . The nearest node is found by searching matrix. Each road node can be associated only with the nearest road node from possible solution . In this way, the catchment areas for each node in a particular solution are created. Each road node is associated with one of the nodes from solution.
For example, one graph is defined with 1 nodes, indexed from
N = 1 to
. If one possible solution for the positioning of
postal offices is on nodes
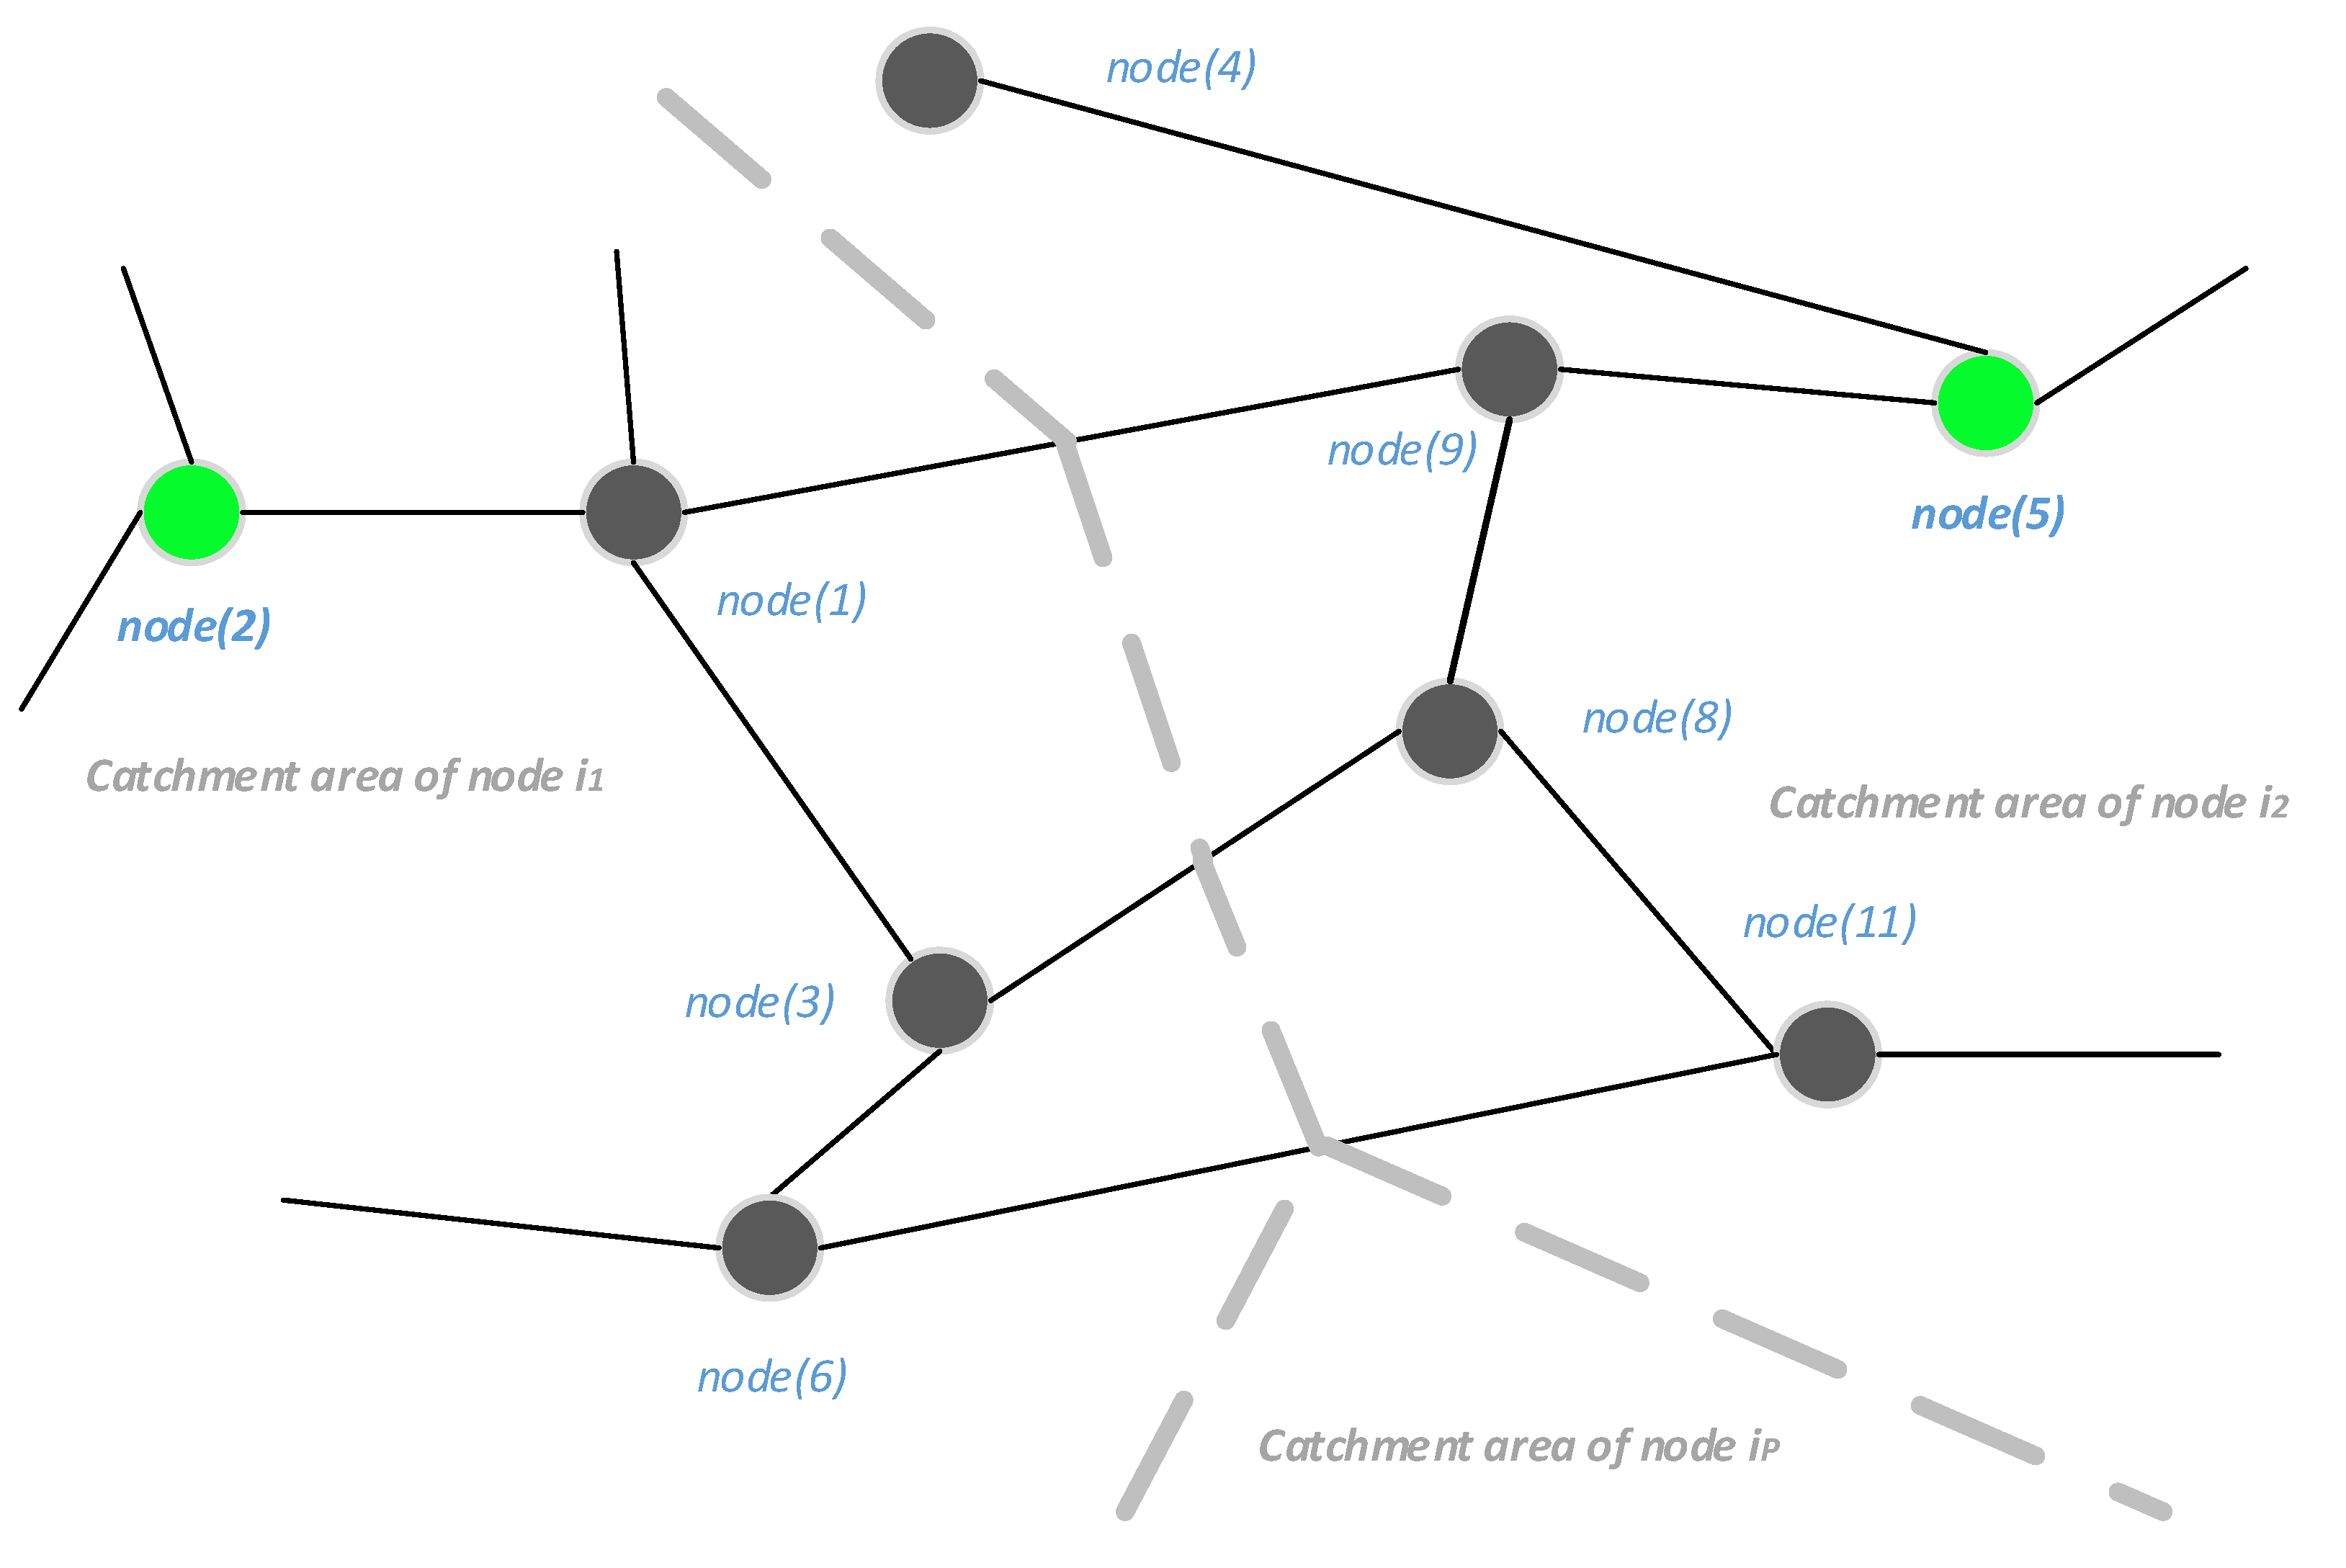
then all other road nodes are associated with the catchment area nearest to them. An illustration of nodes and catchment areas is presented in
Figure 6.
Nodes within the solution are presented in green, while the rest of the nodes are presented in black circles. Some of the road nodes belong to catchment area
, some to
and the rest to the catchment area of node
. With the assumption that there are overall 13 nodes on this map, three nodes are “used” for possible solution
. The remaining ten nodes are placed in one of three catchment areas. The nodes with indexes
and 6 belong to the catchment area of node
. The nodes with indexes
, 9 and 11 belong to the catchment area of node
and the nodes with indexes 10, 12 and 13 belong to the catchment area of node
(those three nodes (10, 12 and 13) and node
are not presented in
Figure 6). In sum, three nodes belong to the catchment area of node
, four nodes to the catchment area of node
and the remaining three nodes to the catchment area of node
. The calculated sums of distances for each node within
are:
where
is the road distance between node
from the solution and node
from the graph and
is the element from distance matrix
at location
column and
row.
The cost function of solution
can be calculated as the sum of all the elements of vector
. Vector
contains the distances of all road nodes to the nearest node from solution
, defined as:
The cost function of solution
can be calculated as:
where
are elements of vector
for
and
is the number of house numbers within the centroid of node
. The brute-force algorithm calculates the cost function for each solution, and then the solution with the minimum cost function is the optimal solution for the post office location. The product of performing the cost function on solution
is referred to as
cost function in the rest of the paper.
3.4. Simulated Annealing
Using the meta-heuristic algorithm simulated annealing (SA), global optimums and approximate global position optimums were found for several post offices in the observed area. Position optimums for several post offices were made with the aim of minimizing the total road distance for all house numbers that gravitate to a certain PO. Each house number can be a solution for positioning a post office. For a large number of nodes and a larger , the number of combinations is too big for brute-force searching algorithms. The SA algorithm is used for approximating the minimization problem. It is a meta-heuristic algorithm for the approximation of global optimization in a large domain (search space). In this paper, the problem of finding the optimal location of postal offices in a large search space can be described as:
For given searchable network with known mutual road distances and corresponding house numbers, find a solution of placing P postal offices in such way that sum of all distances for all house numbers to nearest postal office is minimal.
The pseudo code for the SA algorithm used for solving previously described optimization problem is shown in Algorithm 1.
| Algorithm 1: Pseudo code for the SA algorithm. |
|
| := |
| := |
| for := 0 to do |
| := |
| := |
| |
| if then |
|
|
|
|
| else |
| if then |
|
|
| end if |
| end if |
|
|
| end for |
| return |
At the beginning of the SA algorithm, random
is generated and evaluated by calculating
costFunction1 (earlier described). Starting temperature is set to the initial value. At each iteration, new neighbor
is generated, and if it has a lower evaluated value, it becomes
. If
does not become
due to the evaluation, the change can appear with probability calculated by
. After iteration, the temperature is decreased by multiplying the current temperature by
. This process is known as cooling. Parameter
can be calculated as:
where
and
are the start and stop values of the parameter temperature and
is the overall number of simulated annealing steps.
The probability of changing element is not related to the value of cost function within a proposed (particular) solution. The probability of changing the element is a feature used for overcoming the problem of the local minimum and the searching for the global minimum in the area around the local minimum.
4. Results
Centroids were introduced to facilitate the search for a tree of possible solutions for multiple house numbers allowing a shorter calculation time of the SA algorithm. Each individual node on the road is associated with corresponding house numbers, where the distance between them is the shortest compared with the other road nodes. The number of house numbers gravitating to a particular node is recorded along with the geographical data of each road node and is used as a weighting factor in SA searching for optimal locations. Some nodes on the road (e.g., node 17 with coordinates 16.6581, 45.7836) are closest to the seven house numbers located around it. They are a part of the centroid of the node on the road with index 17). The areas that gravitate to a particular road junction are shown in the Voronoi polygons in
Figure 7.
After adjusting the graphs and data for the application of the SA algorithm, optimal solutions were found for certain post office locations. For up to three locations, the result of the SA searches was confirmed by an exhaustive search of all possible solutions (brute force search algorithm). The amounts of all possible combinations of solutions for each number of post offices are shown in
Table 2.
The solutions for P = 1, 2 and 3 are confirmed with an exhaustive search and result in optimal positions of post offices. To reach optimal solutions by searching the set of all possible solutions without meta-heuristic algorithms, 365 nodes were searched for P = 1, and 66,430 node combinations were searched for P = 2. For P = 3, there are 8,038,030 possible node combinations. For P = 4, it would be necessary to search for 727,441,715 node combinations, which would require an enormous amount of time (processor units).
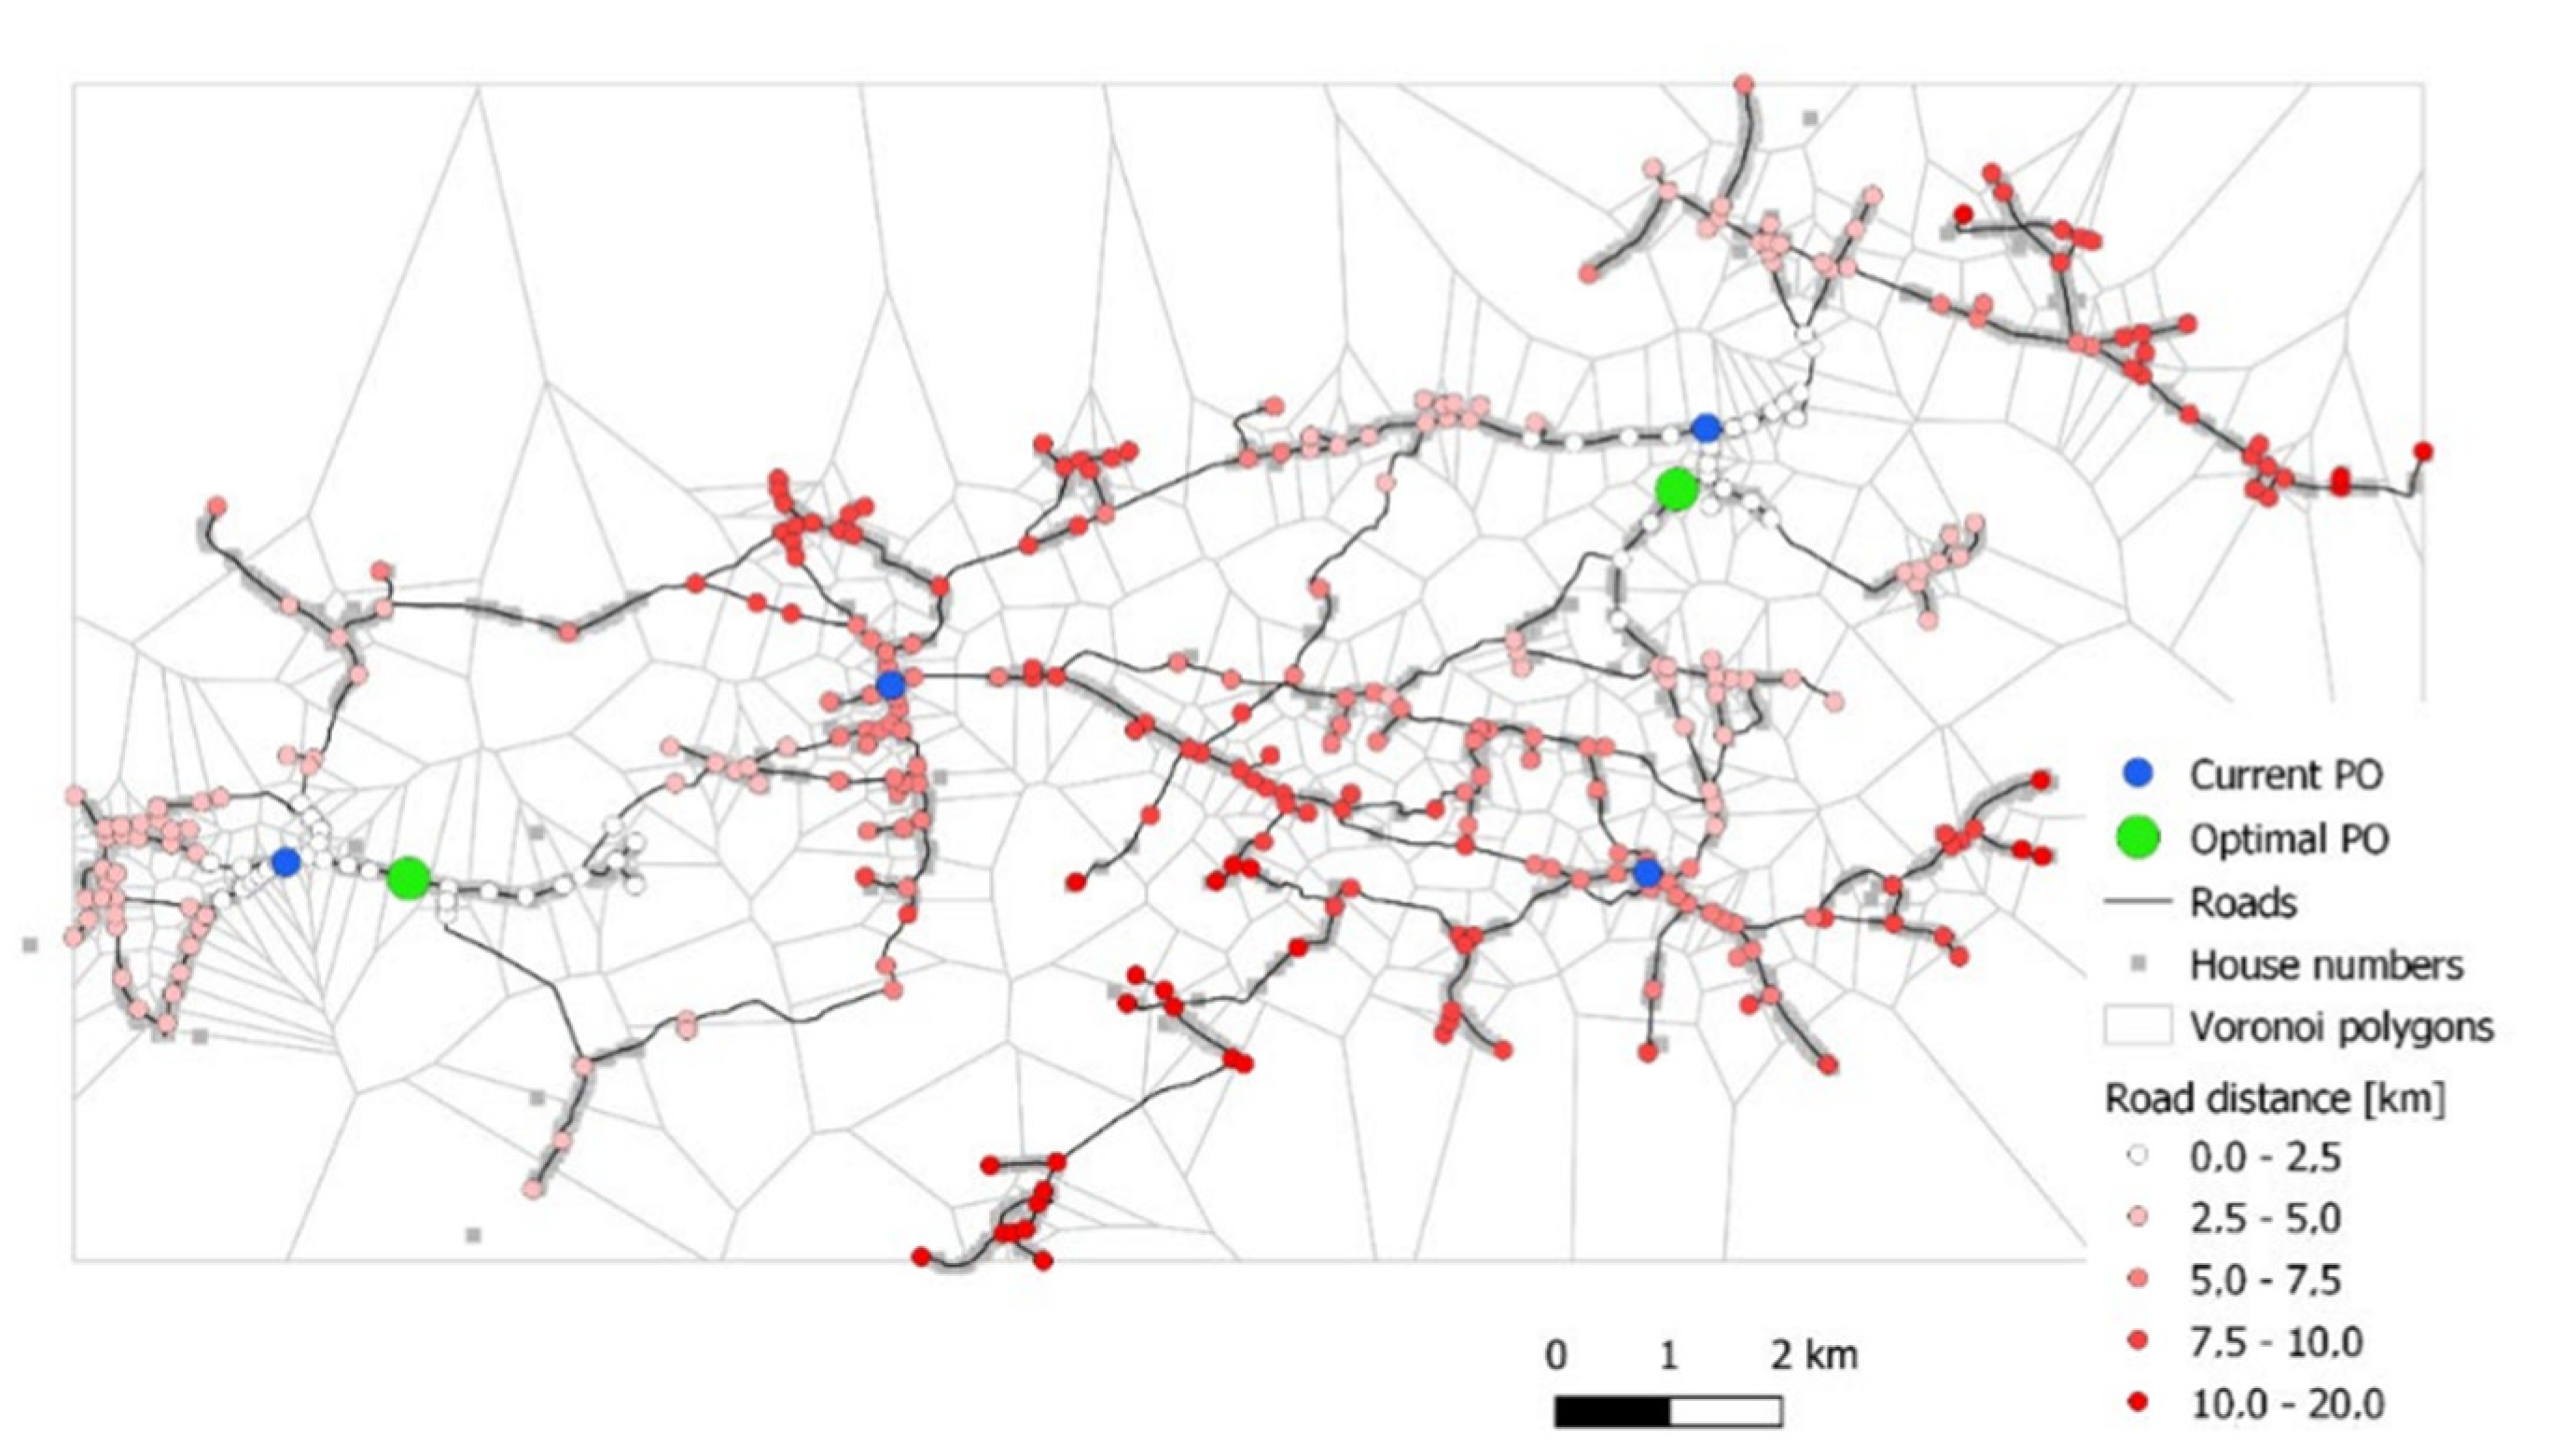
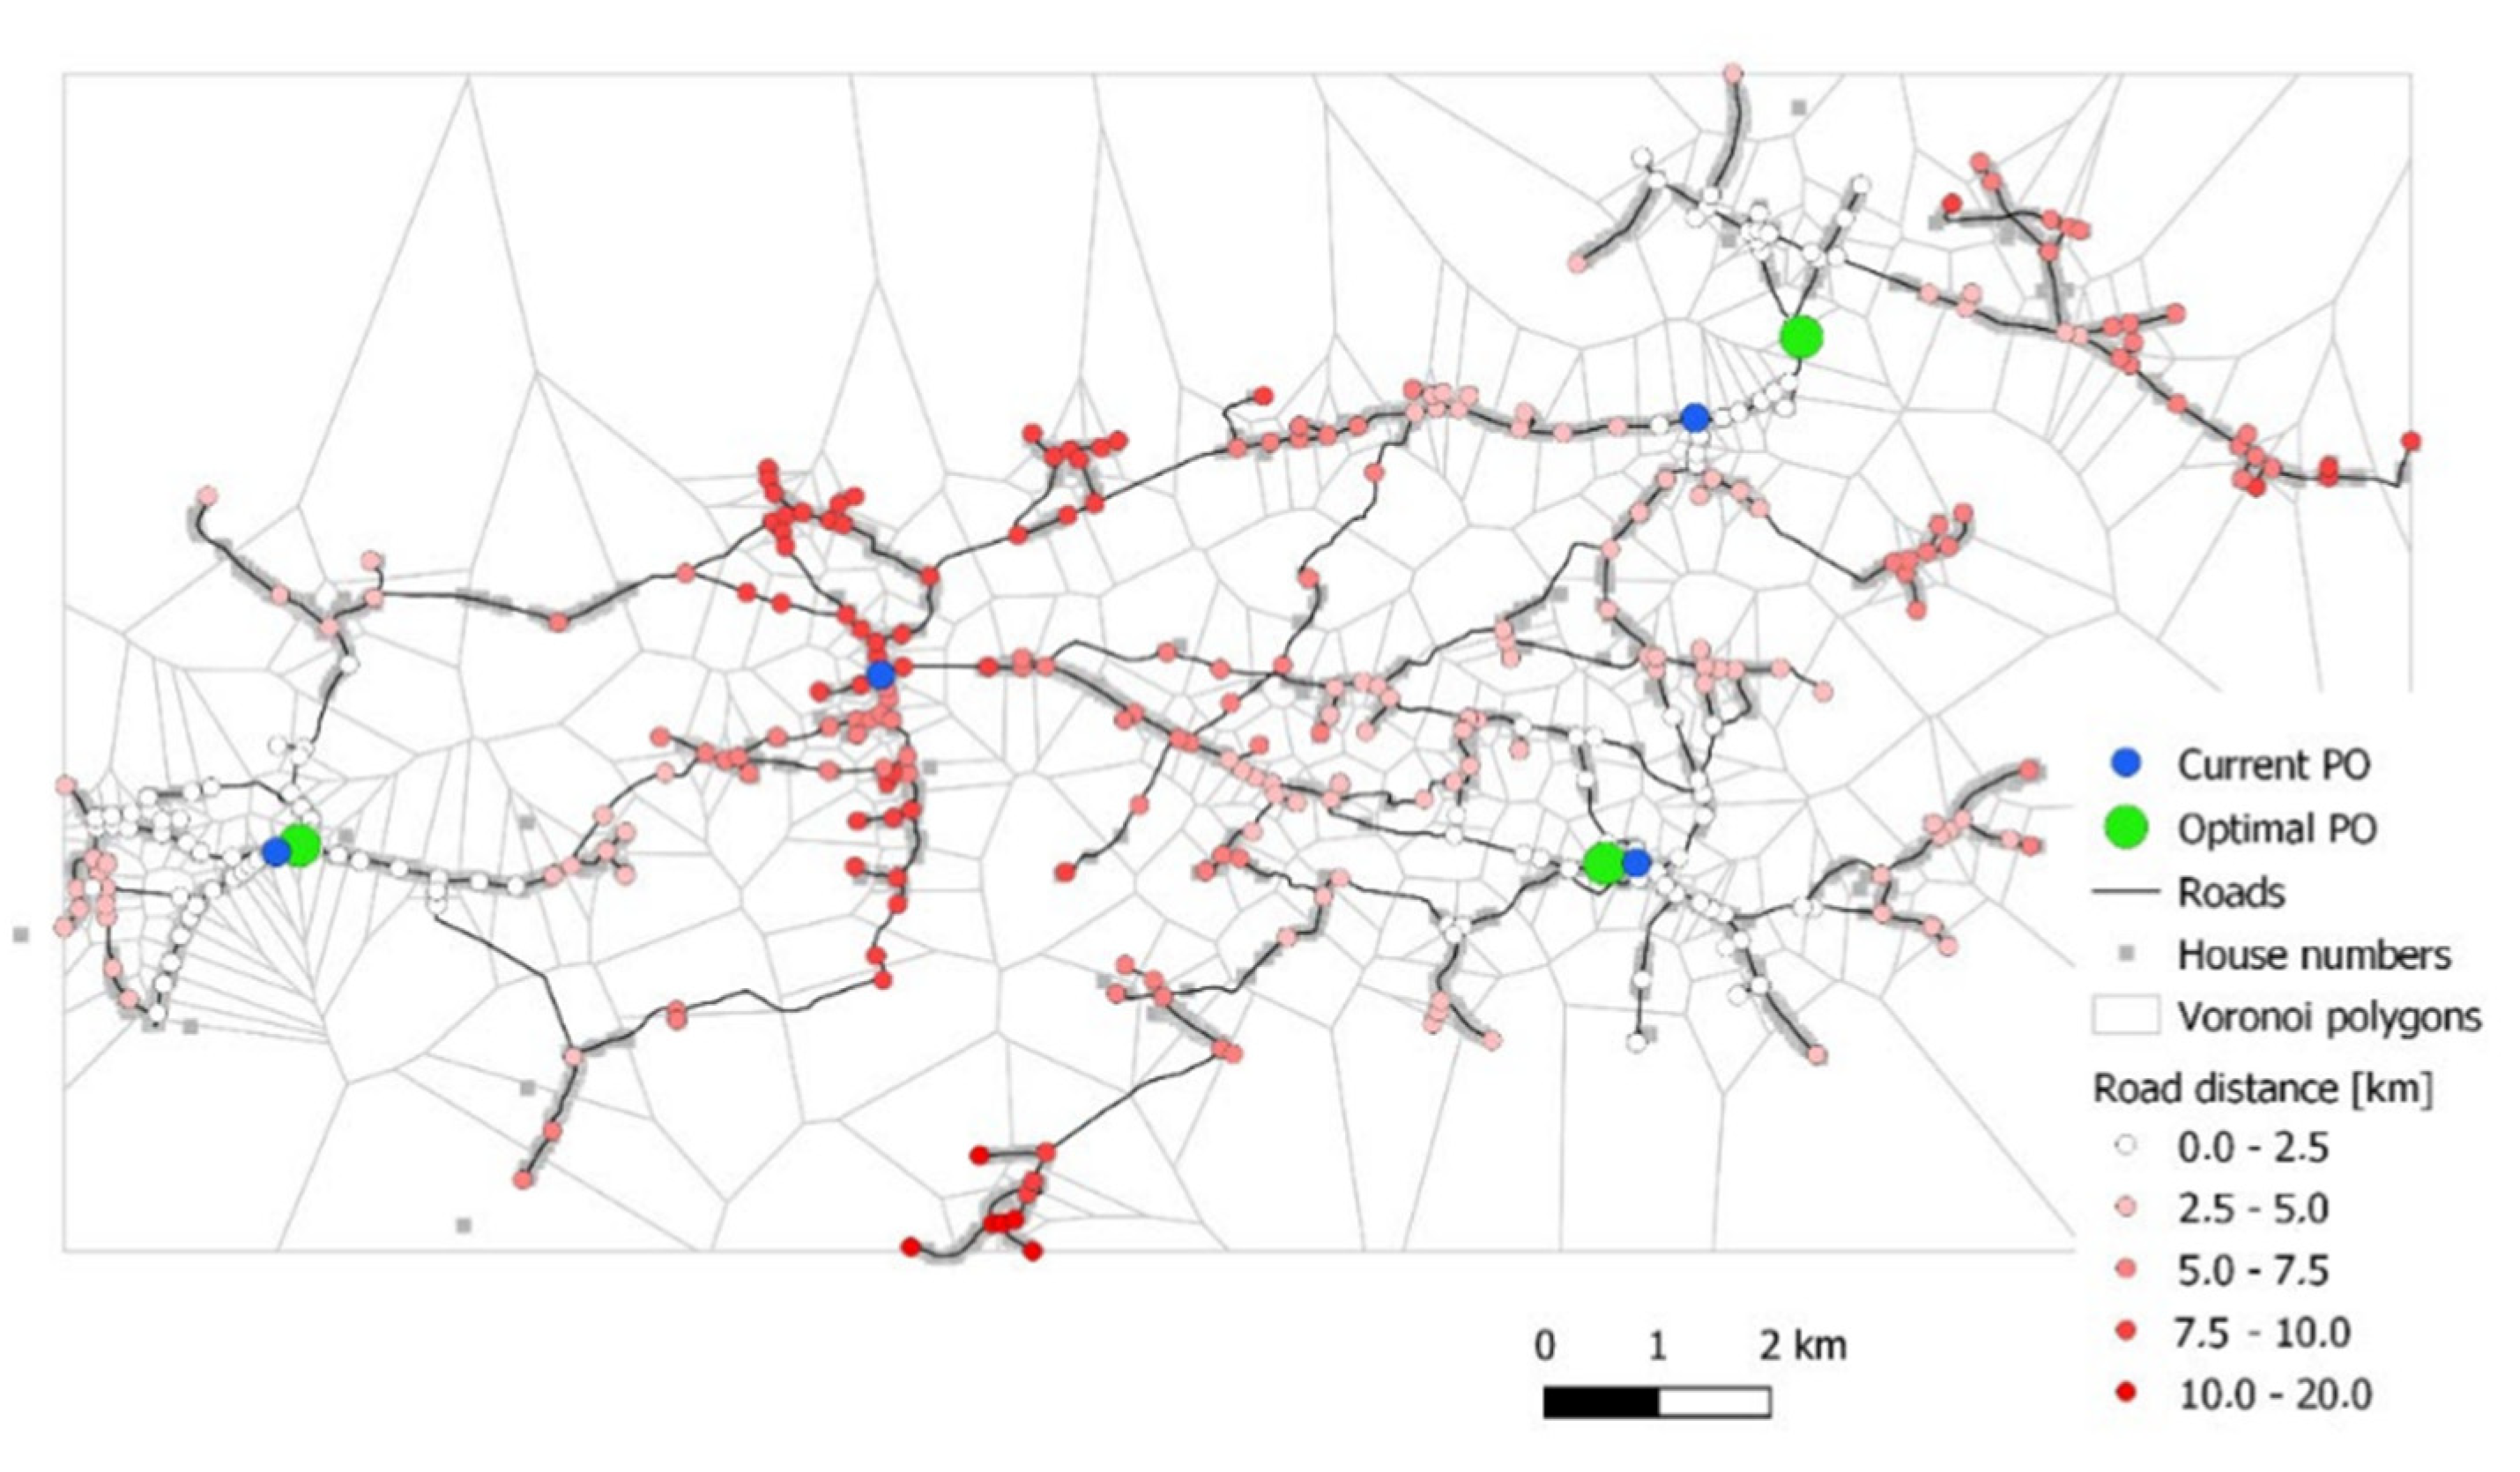
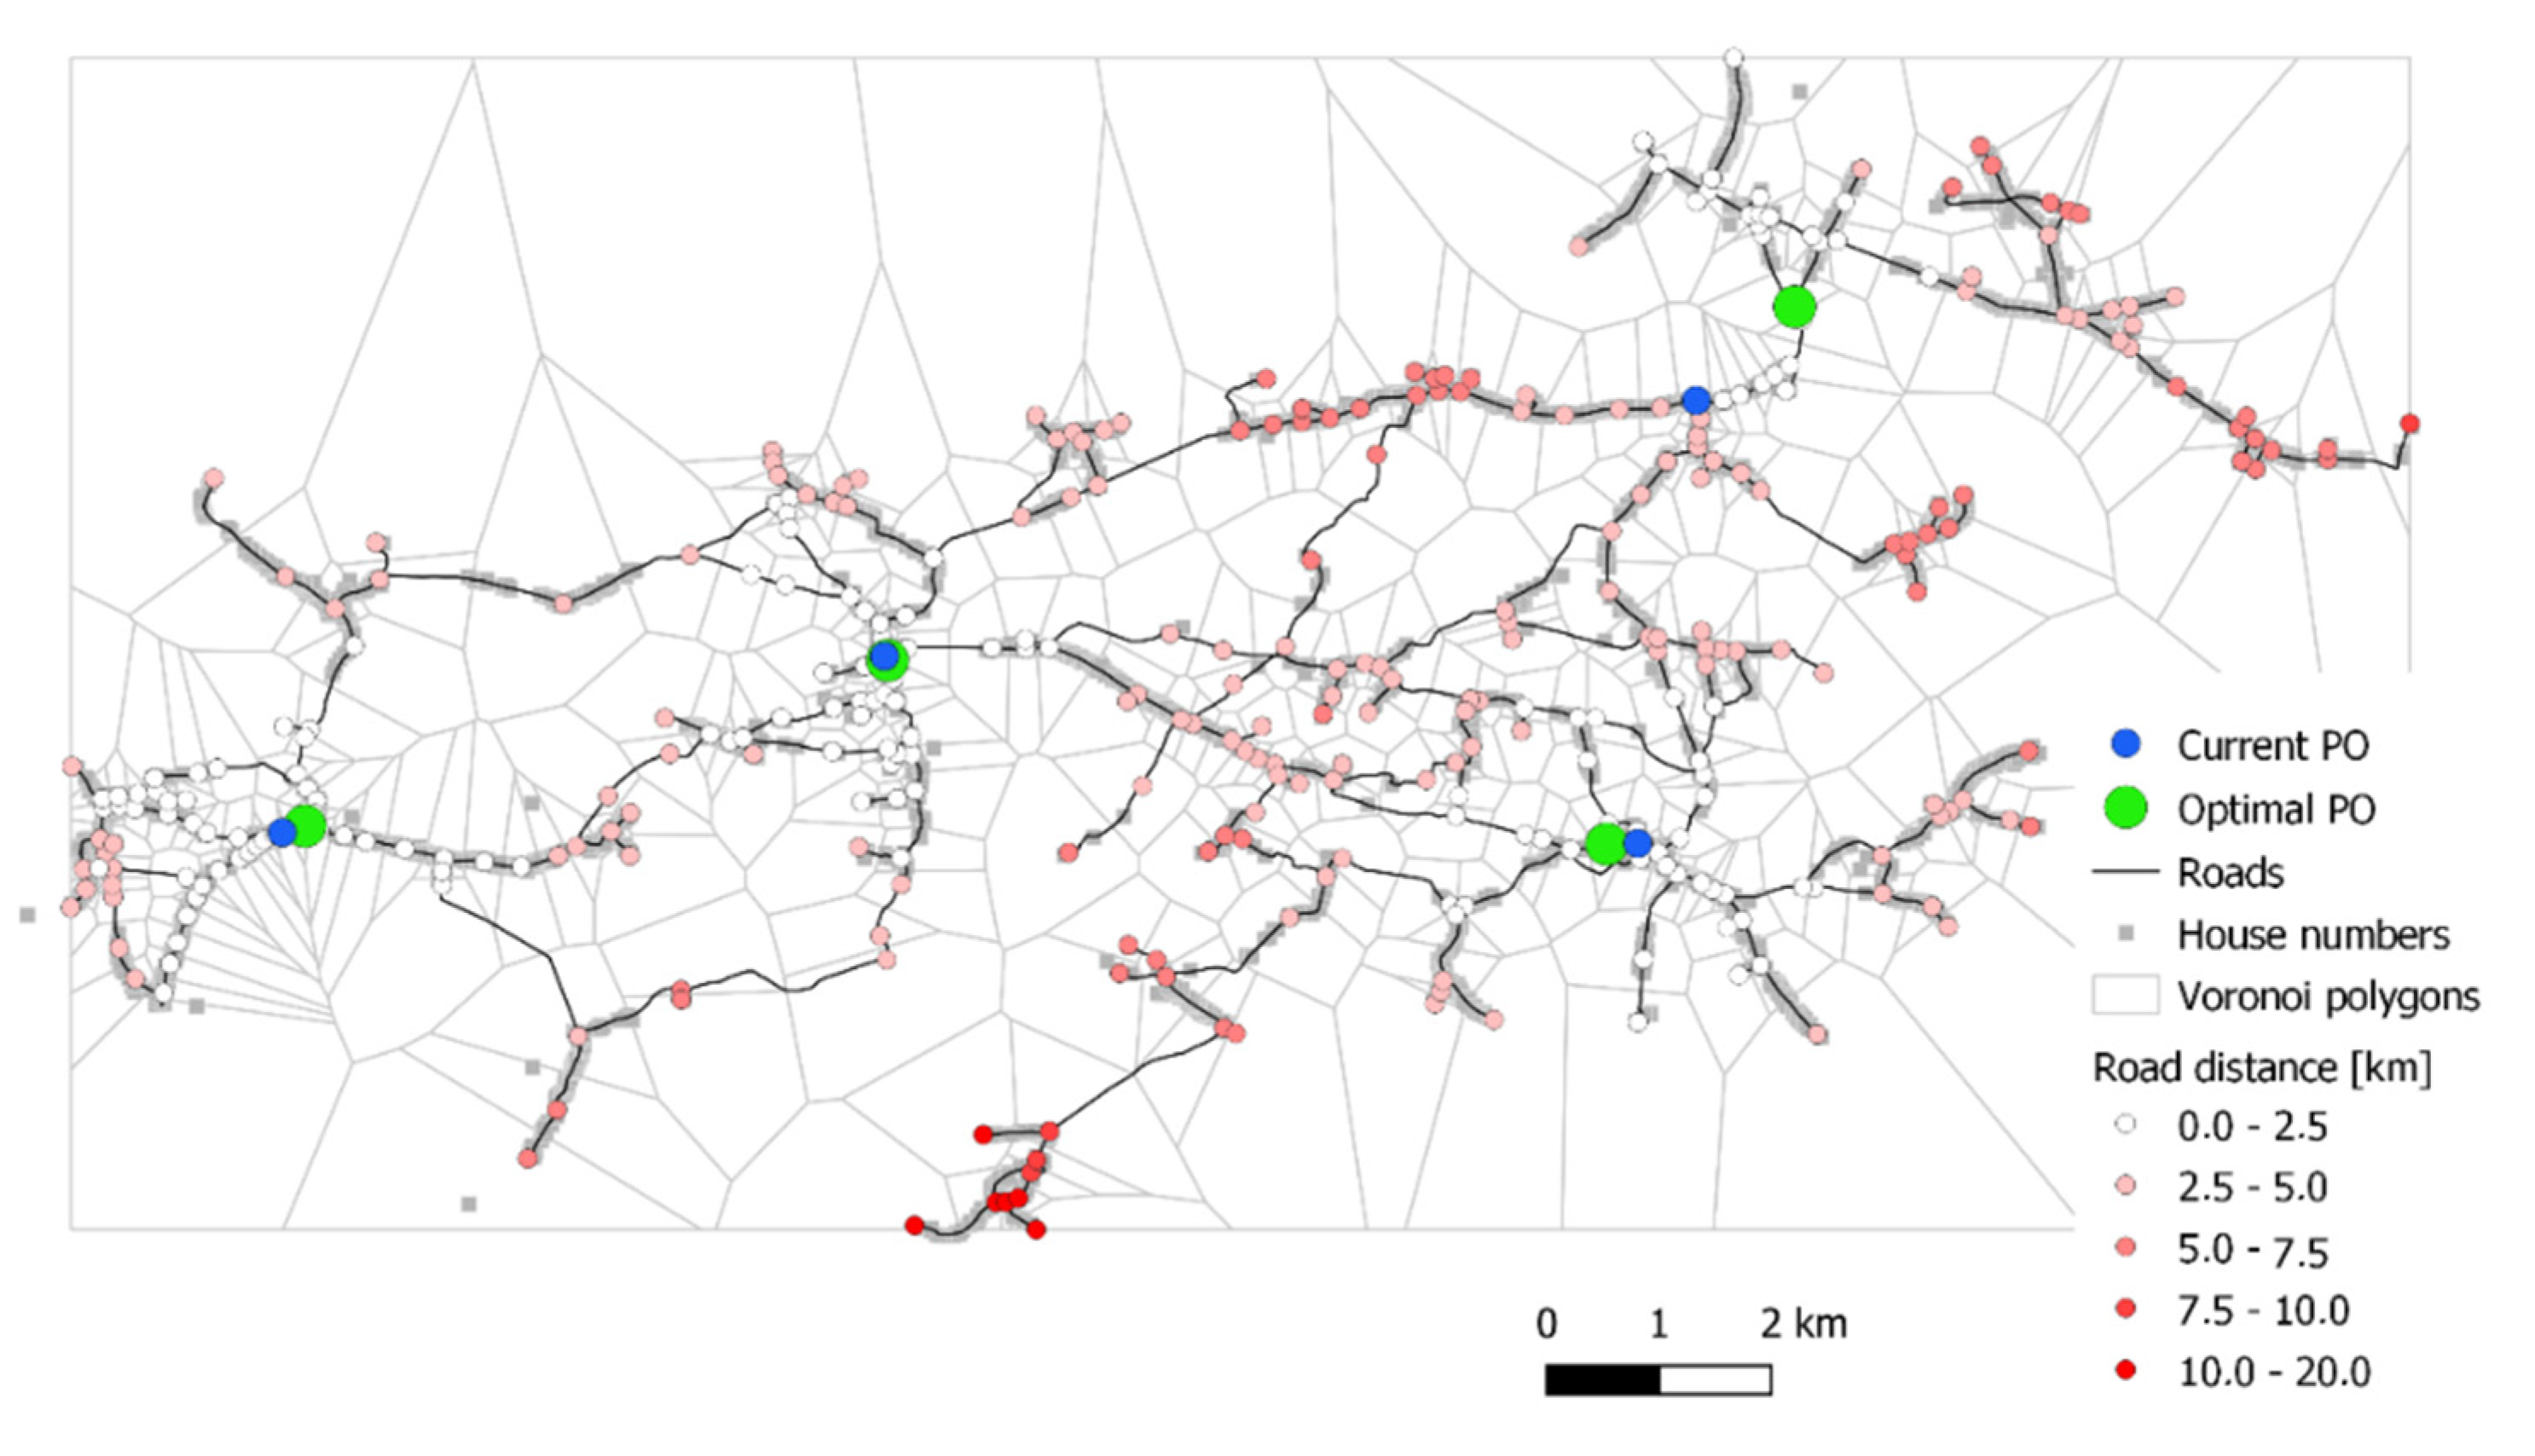
The locations of the post offices for
N = 1, 2, 3, 4 are shown in
Figure 8,
Figure 9,
Figure 10 and
Figure 11. Each optimal post office location is shown by a green node, while the distances of all other nodes are shown in red.
5. Discussion
The optimal position is determined by the minimization of the sum of all distances between house numbers and the nearest post office. In other words, the distances between house numbers and post offices are minimal.
The methodology presented in this paper gives us the possibility to optimize the number of post offices in a certain area with emphasis on decreasing their number. If one post office is to be closed, then thew closure of all post offices to the optimal tree of solutions can be compared.
According to
Table 2, the optimal solution is
P = 3 nodes [15, 64, 89], confirmed by the brute force algorithm. The cost function of the optimal solution is 143.
Table 2 also shows solutions for all four scenarios of post office closures. The current locations of the post offices do not fully coincide with optimal solutions, where the nearest location of the post offices are to nodes [16, 37, 58, 90], with cost 115.78. The optimal SA-given solution is [15, 37, 65, 89], with cost function 111.
If the trends of post-office closure are considered, the results of comparing the decrease of post offices are presented in
Table 3. The optimal solution (brute force algorithm confirmed) for three nodes is [15, 64, 89], with cost function 143. All the results are compared to optimal solutions and presented in percentage.
For the suboptimal solution of closing a post office at location 16, the cost function (distances) of service accessibility will increase around 9%. If another post office is closed, the increase can vary from 28 to 83%. In other words, distances will increase while service accessibility will decrease.
This is a challenging situation for postal service providers. Our methodology gives clear, concise, and concrete solutions for optimal post office locations regarding cost function. However, service accessibility is what should be considered when decreasing the number of post offices. If the postal access points are not accessible to the population, then the sustainability of the USO is in question. Furthermore, social character and the significance of the postal service, particularly in rural areas should not be neglected.
Alternative Access Point (AAP) Scenario
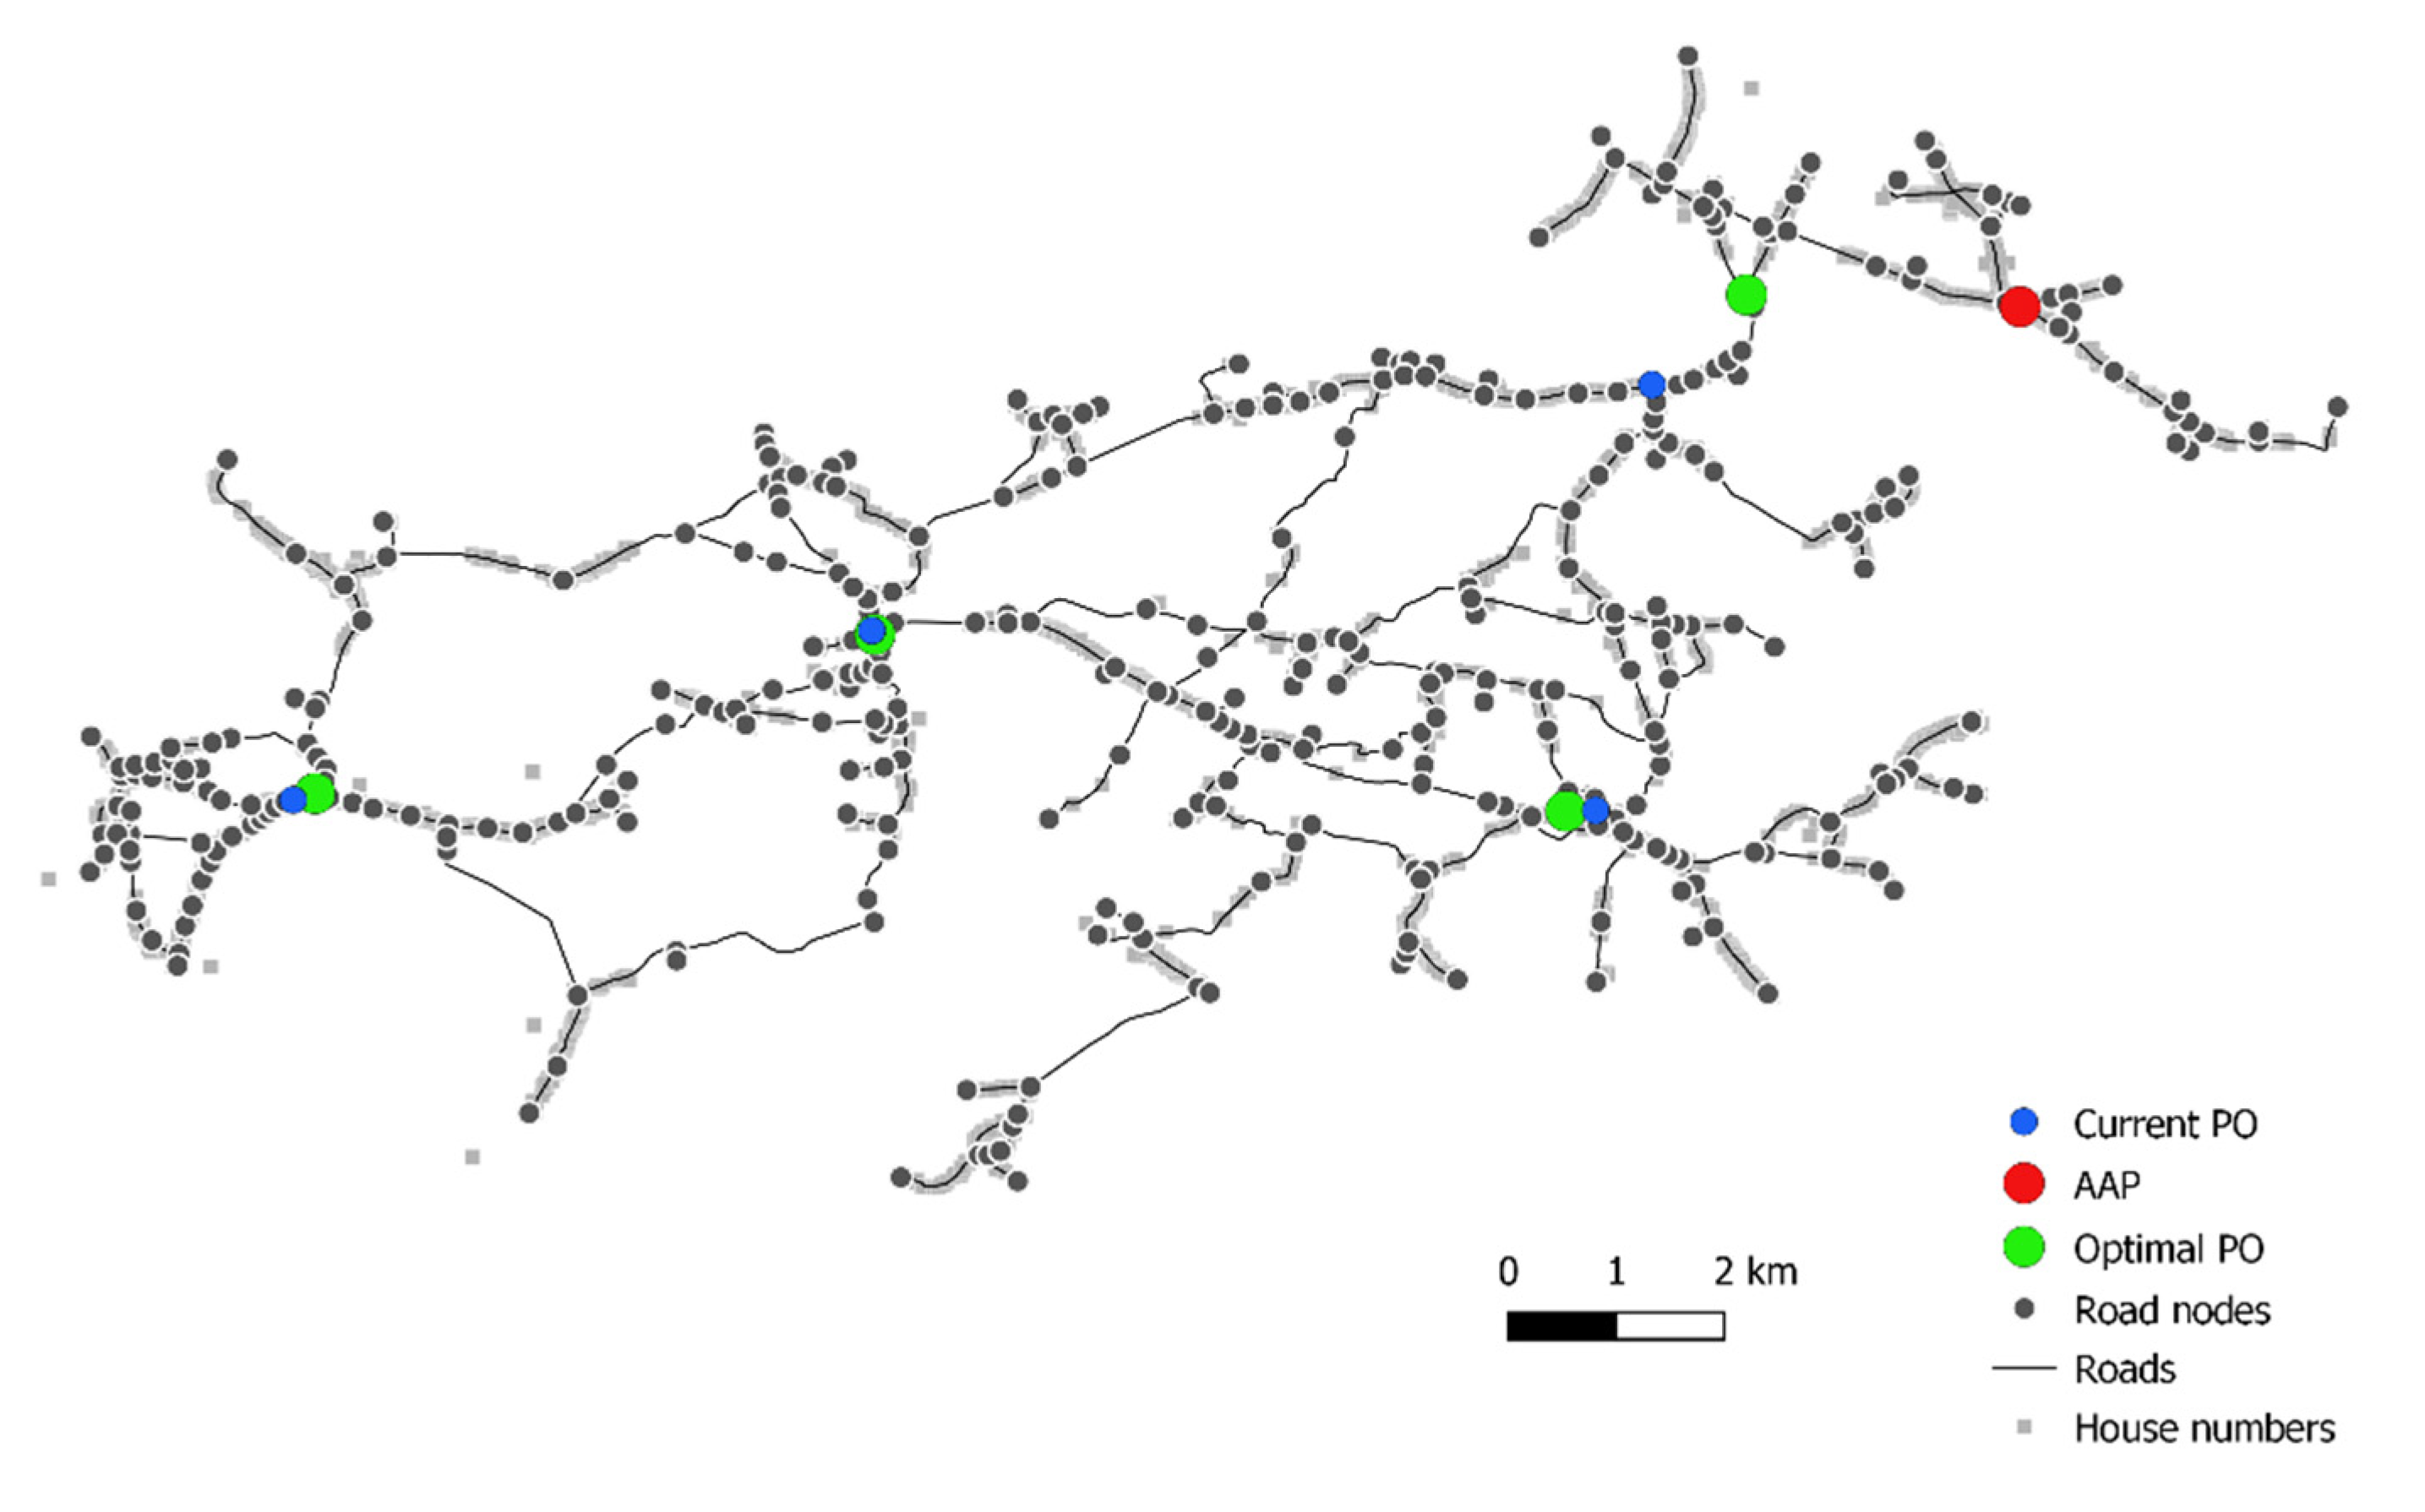
If an additional AAP is to be considered, then the methodology presented in this paper can also be implemented. In such a scenario, it would be necessary to fix 4 out of 5 nodes of the primary solution and to check the sum of all distances for the fifth solution. This can be performed using brute force since there are only 365 − 4 = 361 possible solutions. The AAP location is shown in
Figure 12.
The optimal location for an AAP is node 308. The cost of the solution [16, 37, 90, 58, 90, 308] is 99.00. If an APP is added regarding N = 1, 2, 3 or 4 post offices, the same solutions (or with insignificant difference) are obtained as in the previous case scenario (closure of a certain post office). This is logical, since the analysis showed that there is little difference (when N = 4) between the current and SA algorithm obtained results.
6. Conclusions
This paper determines the optimal locations of postal access points (post offices). It allows for a novel approach to organizing a postal network with respect to service accessibility. Accessibility to postal services is measured through a cost function (distances travelled to access a post office), and the results clearly show that a reduction in the number of post offices results in a decrease in service accessibility. In this regard, one possible solution can be planning an alternative success point location.
The proposed methodology includes converting the mapped area into distance nodes that are then searched by the simulated annealing and brute force algorithms. This results in the creation of maps with detected optimal post office locations. If a postal service provider’s network strategy is directed at the reduction of post offices, this methodology can help in determining the best solutions for this scenario. It can also help in the scenario of choosing the best location for an additional access point. The potential to apply this methodology in real postal service provider business-planning conditions should be considered. The applicability of the research is obvious from applying these scenarios.
However, there are some limitations to this study. We only considered distances to post offices as a cost function. In future research, it would be advisable to include other measures, such as demographic characteristics of the population, modes of travel used to access a service, types of services offered in post offices, different types of access points (self-serving devices, alternative post offices such as gas stations, shops and other). These measures could be divided into user-oriented or service provider-oriented. This would reveal business strategies that are oriented according to the overall business plans of a service provider, especially where rural communities are concerned.
