Article

The Impact of Board Size on Green Innovation in China’s Heavily Polluting Enterprises: The Mediating Role of Innovation Openness

1
Chakrabongse Bhuvanath International Institute for Interdisciplinary Studies, Rajamangala University of Technology Tawan-Ok, Bangkok 10400, Thailand
2
Huanghe Business School, Henan University of Economics and Law, Zhengzhou 450000, China
*
Author to whom correspondence should be addressed.
Sustainability 2022, 14(14), 8632; https://doi.org/10.3390/su14148632
Submission received: 7 May 2022 / Revised: 3 July 2022 / Accepted: 11 July 2022 / Published: 14 July 2022

Abstract

:
Among the many reasons to encourage enterprises to implement green innovation, external factors such as market mechanisms and policy regulation both have the greatest probability of failure. Therefore, the idea of exploring ways to promote green innovation from internal factors has gradually attracted attention. This study is based on an internal perspective to explore the relationship between board size, openness, and green innovation by using data from the heavily polluting enterprises listed in China’s A-share market from 2015 to 2020. The regression results show that board size has a significant positive impact on green innovation, and the openness breadth plays a partial mediating role. This indicates that more board members are conducive to the implementation of green innovation strategies, as well as expanding the innovation openness breadth, so as to obtain external knowledge and resources to promote green innovation. Through further heterogeneity analysis, we found that the above relationship is more significant in state-owned enterprises. Finally, this study provides new theoretical evidence for the debate over whether board size promotes or inhibits green innovation. Furthermore, it provides a path and practical guidance for enterprises to implement green innovation more effectively by relying on their directors’ networks and increasing their own openness.

1. Introduction

In reviewing the development of China over the past 40 years, one can see that it features a contradiction between rapid economic growth and continuous ecological deterioration [1,2]. In 2020, China’s GDP ranked second in the world, but its Environmental Performance Index (EPI) ranked 120th. In this contradiction, heavily polluting enterprises play a dual role: They are the important driving force of economic growth [3] and the main emitters of pollutants because of low efficiency in the production process and their resource utilization [4,5]. Thus, under the realistic background of weak economic growth, a lack of natural resources, and serious ecological destruction [6], enterprises need to address the contradiction between the economy and the environment through green innovation to achieve sustainability [7,8].
Green innovation refers to the use of clean technologies or the incorporation of environmental concepts into organizational management, product design, production, and sales [9] in order to reduce energy waste, resource consumption, and pollution emissions [10,11]. However, compared to traditional innovation, implementing green innovation requires more expense, higher risks, longer return cycles, and a complex and diversified knowledge base [12,13]. It not only brings economic benefits to enterprises but also considers environmental and social benefits; that is, it shows the “dual externality” characteristics of “knowledge spillover” and “environment spillover” [14,15]. Based on the above characteristics, enterprises often lack the motivation to implement green innovation, which also results in a failure to drive green innovation behavior through market mechanisms, otherwise known as “market failure” [16]. Therefore, a review of the previous literature shows that government intervention is deemed to be the most important force to promote green innovation [17,18]. Appropriate environmental policies can have the effect of “innovation compensation” [19,20], to compensate for the additional costs incurred by enterprises in fulfilling their social responsibilities [21], inducing corporations to carry out ecologically friendly behaviors and effectively addressing the issue of “market failure” [22].
Currently, the Chinese central government has paid great attention to the environmental pollution caused by manufacturing enterprises [23] and has introduced policies to help enterprises carry out green innovation, for example, “Made in China 2025”. However, there are many problems with local governments implementing fundamental environmental policies, such as the lack of political will [24], selective implementation [25], and lack of better effects [26]. The agency problem between central and local governments [27,28], as well as the moral hazard problem that exists in enterprises [29], has caused a “policy failure” with respect to environmental regulations meant to induce enterprises to implement green innovation [28].
Based on the realities of “market failure” and “policy failure”, some scholars have argued that external factors are not crucial [6,30]; instead, the driving force of green innovation may come from inside enterprises [31], and they have begun to explore internal factors, such as internal control [32], green behavior [33], green leadership [34], etc. However, there is not much work in the literature analyzing the correlation between board size and green innovation. As the highest decision-making body of a company, the board of directors plays a linking role between owners and managers [35]. It can directly intervene in the decision-making process of business strategy, and it inevitably determines the implementation of green innovation behavior [36]. Board size is an important indicator that measures the board’s governance ability; by clarifying its influence on green innovation, it can not only enrich the relevant literature but also have practical significance in guiding enterprises to implement green innovation.
In the era of accelerated product updating and diversified user needs, independent innovation can no longer meet the demands of modern market competition. Open innovation has become an efficient way for firms to promote R&D activities and breakthrough technological bottlenecks [37]. However, there is little work in the literature analyzing the mediating effect of openness. Based on open innovation theory and resource-based theory, an enterprise’s open behavior is conducive to breaking through internal organizational boundaries and introducing external innovation resources [38], providing a basic guarantee for the smooth implementation of green innovation [39]. Open innovation can help firms acquire external knowledge [40], overcome technological lock-in [41], increase the efficiency of green innovation [42], and reduce costs and risks [43]. On the other hand, more board members can improve the cognitive scope, knowledge composition, and openness of the board, which is conducive to finding more partners and obtaining more innovation opportunities [44]. Therefore, we selected data from heavily polluting enterprises listed in China’s A-share market from 2015 to 2020, built a research model of “board size–openness–green innovation”, and, through regression analysis, verified the hypotheses that board size has a positive impact on green innovation, and that openness breadth and depth play a mediating role between the two.
The remainder of the article is organized as follows: Section 2 summarizes the correlation between board size, green innovation, and openness and describes the hypotheses; Section 3 introduces the research samples and methods; Section 4 describes the empirical analysis and robustness test; and Section 5 summarizes the paper and puts forward policy suggestions.

2. Literature Review and Research Hypothesis

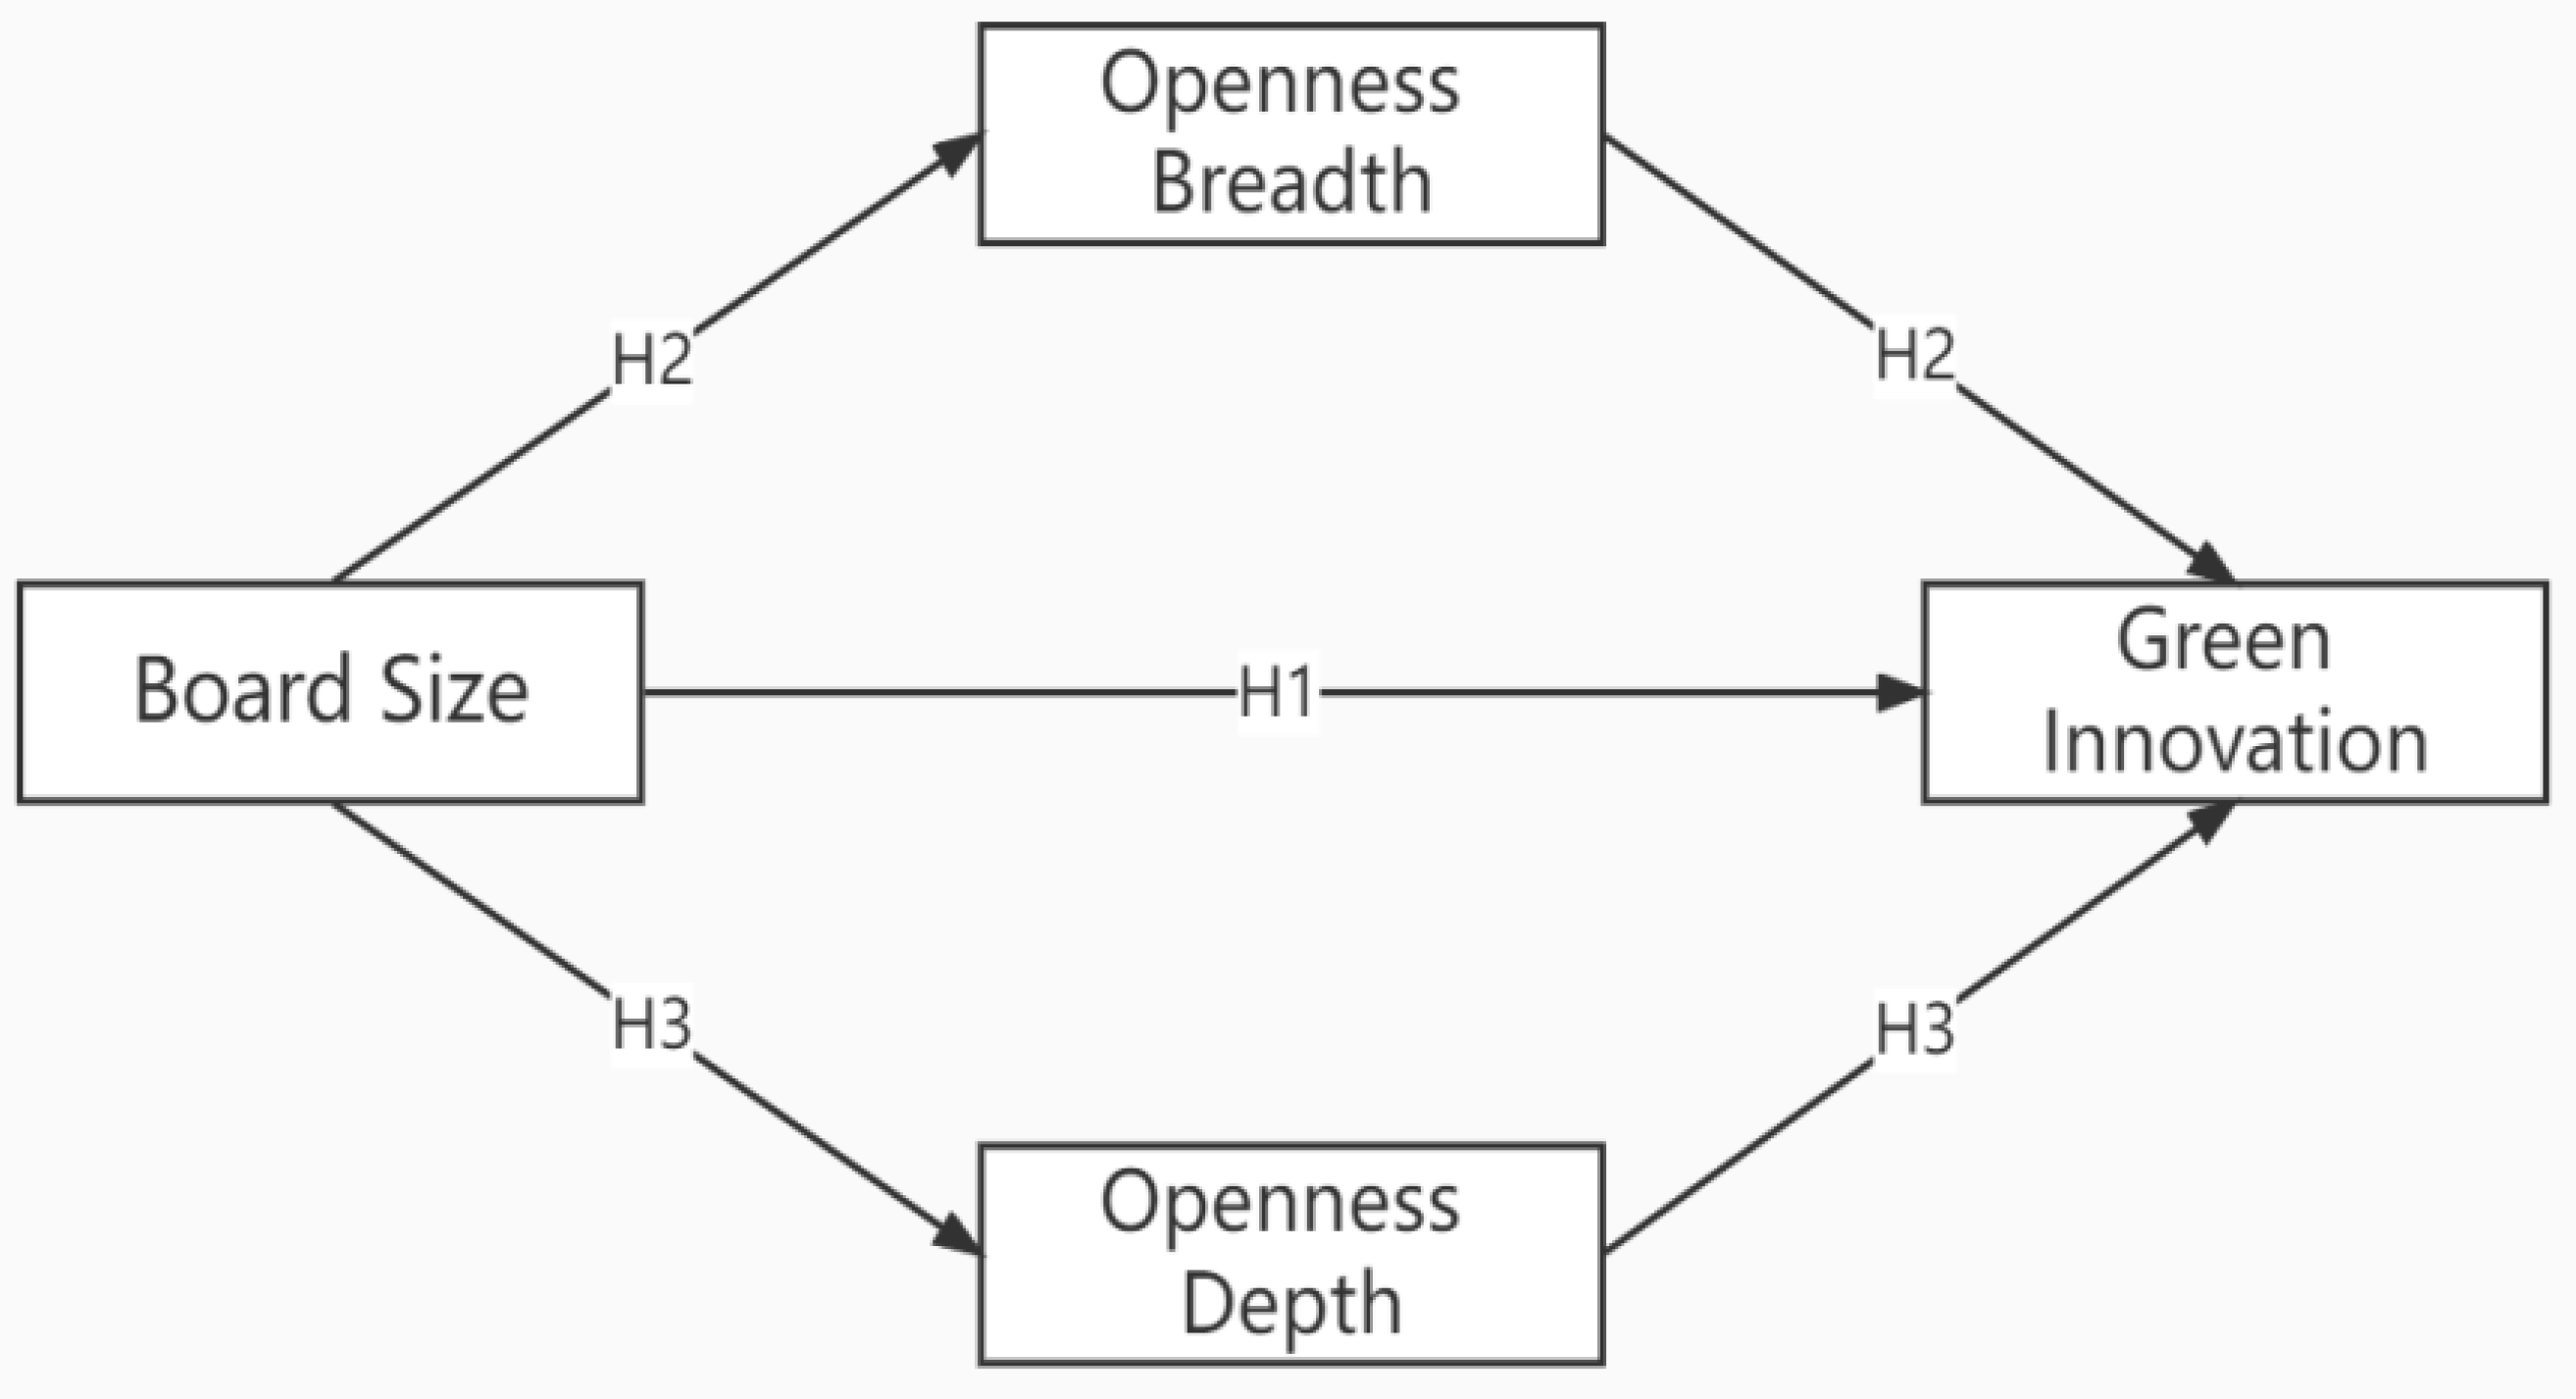
2.1. Board Size and Green Innovation

The concept of green innovation is built on the innovation behavior of enterprises, integrated with the idea of ecological protection [45]. It tries to implement green organization management, adopt clean technology, and the installation of environmental equipment in order to reduce pollution emissions, energy consumption, and resource waste in the whole process of product design, production, sales, and recycling [9,46]. It helps enterprises gain legitimacy [47], establish a green image [48], cater to market demand [49,50], form competitive advantages [51,52], and, finally, achieve the win–win situation of positive financial and ecological performance [3,53]. Green innovation can reconcile revenue growth and ecological improvement, and it has become a key factor for firms to achieve their own sustainable development [54]. The driving factors include government regulations and industrial policies at the macrolevel [55], as well as consumer demands [56], media supervision [57], supply chain demands [58], and other pressures from stakeholders at the market level. At the same time, the study of the driving mechanisms of internal management [59] on green innovation from the microlevel has also started to attract the attention of scholars [60,61].
The board of directors is the core institutional arrangement of modern enterprises. Its governance mechanism constitutes the predominant system between the company’s management and shareholders. Its job responsibility is to supervise and control management. Its operational efficiency plays a decisive role in the company’s strategic decision-making, business performance, and technological innovation [36]. How board size affects the innovation behavior of enterprises has not yet been determined. Scholars of the positive facilitation view argue that a large number of board members can provide a variety of complementary knowledge for technological innovation decision-making, ensuring that there is a diversity of views, which is beneficial to alleviate the agency problem in the process of innovation [44]. Scholars of the negative obstacles view argue that, with an increase in the board’s members, there will be more transaction costs, inefficiency in decision-making, deviation in risk sharing, and the “free rider” effect, which can hinder the development of innovation behavior [62]. In addition, through empirical analysis, some scholars have found that there was a significant inverted “U-shaped” correlation between board size and enterprise innovation [63].
As an important part of corporate strategy, green innovation is inevitably affected by the characteristics of the board [64]. First, based on the principal–agent theory, the board of directors plays a supervisory role in internal governance; the larger the board size, the more it can reduce collusive behavior and agency problems, improving the quality of internal decision-making [65]. Then, it can urge companies to do more to protect their reputations, implement green innovations, and build a green image for the government and the public. Orozco (2018), based on cross-sectional data on 84 large Colombian companies taken from 2008 to 2012, found that board size positively correlates with corporate reputation. A larger board will enhance the interaction between the enterprise and the external environment and attach more importance to its own reputation [66]. Second, based on the resource-based theory, more board members and more obvious heterogeneity among the board can provide enterprises with more external resources, such as new technologies, financing channels, and key researchers [65]. Shapiro (2013) points out that the resource provision ability of the board can effectively promote the innovation performance of enterprises [67]. Therefore, the addition of these external resources can effectively improve the effectiveness and performance of green innovation. Third, based on a knowledge-based view, knowledge is an important resource in promoting innovation strategies, and enterprises need to integrate internal and external knowledge to cultivate their knowledge base and further improve their innovation [68]. These efforts can also provide resources and an impetus for the implementation of green innovation projects. Due to the speed of knowledge dissemination and update, a single source of knowledge can no longer meet innovation needs [69], especially for green innovation with more complex technical requirements [70]. Therefore, more board members reflect the heterogeneity and diversification of the board [71], which is conducive to the cultivation of a diversified knowledge base and the improvement of enterprises’ green innovation abilities. In summary, we propose the following hypothesis:
Hypothesis 1 (H1).
The board size of a corporation has a positive impact on green innovation.

2.2. Board Size, Innovation Openness, and Green Innovation

Chesbrough (2003) first proposed the theory of open innovation. He believed that open innovation was an innovation model that could break the organizational boundaries of enterprises and jointly construct an innovation ecological network with universities, consumers, suppliers, governments, competitors, etc. [72]. It not only involved the internal transformation of external knowledge and technology but also included the external commercialization of internal technology and knowledge [73]. Under the background of emphasizing high-quality development, open innovation has become the principal means to maintain competitive advantage and achieve mutual benefit [74]. Numerous well-known enterprises, such as Hyundai Motor, IBM, P&G, and Intel, also use open innovation to break development bottlenecks, expand market scope, and achieve high-quality innovation projects. Therefore, enterprises are paying more attention to the open innovation model, and external innovation knowledge, resources, and opportunities are becoming the prior conditions for enterprises to make innovation decisions [75]. Open innovation is divided into two dimensions: breadth and depth [76]. Breadth represents the type of partners in open innovation and reflects the diversity of external knowledge sources, and depth represents the frequency of cooperation with partners in open innovation, reflecting the stability of external knowledge sources [77].
Compared to other types of innovation, green innovation adheres to the principle of sustainable development and has significant externalities, such as “knowledge spillover” and “environment spillover”. Similarly, the knowledge and technologies required for green innovation are complex and diverse, and it is hard for firms to possess all the technologies themselves [70,78]. Therefore, green innovation needs and is more suitable for collaborative research and development [6,43]. First, open innovation is conducive to an enterprise’s absorption, processing, and transformation of its partners’ green technology, improving their own green innovation efficiency [40,69]. Composite technologies from the innovation ecosystem are critical to green innovation and can improve its efficiency and sustainability [39]. Second, the open behavior of enterprises helps them build a knowledge base with partners, integrate different types of knowledge, and overcome the limitations of technical resources [68]. A rich and deep knowledge base can support and strengthen the process of green innovation and facilitate the generation of new green ideas and projects [79]. Third, an open and cooperative model can help reduce the costs and risks of innovation [43,80]. Especially for green innovation, with its complex technology and high cost, it is necessary to decrease the failure rate of green projects and ease the doubts of management in order to promote green projects through joint undertakings with partners [81]. Fourth, open innovation can break through the capacity lock-in problem in the process of green innovation [41]. Through cooperation with external organizations, strategic capabilities in the R&D process can be acquired, thus ensuring green technology output [82]. Yu Bai (2021) used big data samples from 503 enterprises to construct a multi-relationship network and found that the breadth and depth of the relationship networks of enterprises are positively correlated with green innovation [77]. Sánchez-Sellero (2021), using data from the Spanish Technological Innovation Panel, found that establishing R&D cooperation with external partners is the key driving force to promote the green innovation of enterprises [83].
The core of open innovation is to build an innovation ecological network, which includes different kinds of partners, and use this network to develop the core technology of enterprises, thus realizing the integration of knowledge and technology [84,85]. Meanwhile, the network of directors, composed of corporate board members, determines the breadth and depth of the innovation ecological network. First, the heterogeneity of the network of board members reflects the ability and scope of an enterprise to find external resources [86]. Director networks can find external innovative resources and opportunities at lower costs and then complement internal resources. More board members also mean a broader social network, and the directors’ own work experience, administrative level, and part-time positions can improve the board’s cognitive level and ability to integrate resources [87], which can provide a favorable basis for cooperation with a variety of external organizations. Therefore, board size facilitates the breadth of openness, collaboration with a wider range of external organizations, and bringing diverse technology and knowledge to green innovation. Second, improving the board’s network can not only increase the number of external innovation channels but also strengthen close contact with external innovation channels, obtain more stable external support, and provide a more accurate understanding of peripheral knowledge and creativity [88]. The knowledge background of directors can also promote the transmission of knowledge and enhance communication efficiency in the process of innovation [89]. Therefore, the expansion of board size is conducive to establishing closer cooperative relationships, carrying out in-depth innovation cooperation with external organizations, and improving the efficiency of green innovation. Chuluun (2017) analyzed information on the directors of 3838 unique companies and found that the enterprise network built through the board interlocks had a positive impact on the input and output of innovation [86]. Therefore, in order to better understand the mediating effect of open innovation, this paper puts forward the following hypotheses:
Hypothesis 2 (H2).
Openness breadth plays a mediating role in the impact of board size on green innovation.
Hypothesis 3 (H3).
Openness depth plays a mediating role in the impact of board size on green innovation.
The role relationship and research hypotheses are shown in Figure 1.

3. Research Methods and Samples

3.1. Research Samples and Data Source

Heavily polluting enterprises, represented by the coal, steel, and electricity industries, are the pillar industries driving economic growth in China, as well as the critical consumers of natural resources and major emitters of pollutants [90,91]. Therefore, in the process of green economic transformation, heavily polluting enterprises face the greatest pressure and the most urgent need to implement green innovation [26]. From an internal perspective, the significance of exploring the driving path for heavy polluting enterprises toward green transformation has increased.
Research samples for this paper were selected from the heavily polluting enterprises listed in China’s A-share market. In 2012, the China Securities Regulatory Commission (CSRC) revised the industry codes of the Listed Companies Classification Index, classifying heavily polluting industries into 16 industries. The sample data in this paper span from 2015 to 2020, and the screening process is as follows (Table 1).
The final results showed 97 valid sample companies and 582 observed values in total. The final sample of enterprises covered 13 industries, and their structural traits are shown as follows (Table 2).
The data involved mainly include annual report data, financial data, patent data, etc. The annual report data of the enterprises came from the China Juchao Consulting Network; the financial data of the enterprises came from the China CSMAR database. The patent data of the enterprises came from the Patent Retrieval Database of the State Intellectual Property Office of China.

3.2. Research Variables

3.2.1. Explained Variable: Green Innovation (GI)

The measurement of this variable is a very complex problem because the characteristics of the technological innovation process are such that scholars cannot directly measure and determine the quality level. At present, most scholars use the total number of green patent applications to measure the level of GI [92]. Therefore, this study also referred to the above methods to measure the explained variables. Meanwhile, green innovation was defined as a continuous variable, and the actual data had obvious truncation characteristics; that is, some enterprises did not apply for green patents in some years. We defined green innovation (GI) by adding 1 to the total number of green patent applications and taking the natural logarithm. The calculation formula was as follows:
GI = Ln(Total number of green patent applications + 1)

3.2.2. Explanatory Variable: Board Size (Dno)

The measurement standard was equal to the number of board members. The higher the value, the more board members, and, thus, the more diverse the board heterogeneity. Since the data were continuous variables, in order to alleviate the problems of heteroscedasticity and multicollinearity in the model, logarithmic processing was conducted on the variables. The calculation formula was as follows:
Dno = ln(Number of Board Members)

3.2.3. Mediating Variables

Laursen and Salter (2006) divided openness into breadth and depth, which are recognized by most scholars and are widely accepted and used measures of openness [76].
(1) Openness breadth (OB): The measurement standard was the number of external organizations that have a cooperative relationship with the target enterprise in the process of joint application and patent authorization. The larger the number of organizations, the more extensive the knowledge source. Since the actual data had obvious truncation characteristics (that is, some enterprises did not jointly apply for patents in some years), openness breadth (OB) was defined by adding the number of organizations with 1 and taking the natural logarithm. The calculation formula was as follows:
OB = Ln(Total number of external organizations + 1)
(2) Openness depth (OD): The measurement standard was, in the process of joint patent application and authorization, the average amount of cooperation between the target enterprise and its partners, that is, the ratio of the number of patents jointly applied to the number of external organizations jointly applying for patents. The higher the ratio, the deeper the openness of the enterprise, and, thus, the more frequent the knowledge exchange activities with partners. Since the actual data had obvious truncation characteristics (that is, some enterprises did not jointly apply for patents in some years), openness depth (OD) was defined by adding 1 to the ratio and taking the natural logarithm. The calculation formula was as follows:
OD = Ln(Total number of patents jointly filed/Total number of external organizations + 1)

3.2.4. Control Variables

Drawing on the research of Ma (2022) [32] and Pan (2021) [93], this study selected for R&D investment (RD), corporate redundancy (OR), operational capacity (Roa), profitability (Roe), cash constraint (Cash), development ability (Growth), ownership concentration (EC), and CEO duality (Dual). The definition and measurement of the explained variables, explanatory variables, mediating variables, and control variables involved in this section are shown in Table 3. In order to eliminate the influence of extreme values, we winsorized all continuous variables at the 1% level.

3.3. Empirical Model

In this study, ordinary least squares (OLS) models with fixed effects of time and industry were constructed for regression, and all hypotheses were verified with the three-step mediation test [94]. The first step was through Model (1) to verify the direct impact of Dno on GI. If the regression coefficient, c, of Dno was statistically significant, it indicated that Dno had a positive or negative impact on GI, verifying Hypothesis 1.
In the second step, we needed to verify the impact of Dno on the mediation variables. At this time, the mediation variables OB and OD needed to be included in the equation as explained variables for regression. According to models (2a) and (2b), if the regression a1 and a2 coefficients of Dno were statistically significant, it indicated that Dno also had a positive or negative impact on the mediation variables, OB and OD. Finally, if the regression results of the above two steps were significant, we verified the mediating effect of OB and OD through models (3a) and (3b). If either of the regression results of the above two steps were not significant, there was no need to conduct a third-step test, indicating that the mediating effect did not exist.
In the third step, Dno and mediation variables (OB, OD) were simultaneously used as explanatory variables of the regression equation to verify the impact on GI. In models (3a) and (3b), if the regression coefficients, c′, b1, and b2, of Dno, OB, and OD were statistically significant, it indicated that OB and OD had partial mediating effects. Among the direct effects of Dno on GI, some of them were mediated by OB or OD. If only the regression coefficient, c′, of Dno was not statistically significant, it indicated that OB and OD had a complete mediating effect; Dno affected GI completely through both OB and OD. The total effect of the explanatory variable on the explained variable = a × b + c′, and the proportion of the mediating effect = a × b/(a × b + c′). The results verify Hypotheses 2 and 3.
The empirical model was constructed as follows:
G I i , t = α i , t + c D n o i , t + β 1 R D i , t + β 2 O R i , t + β 3 R o a i , t + β 4 R o e i , t + β 5 C a s h i , t + β 6 G r o w t h i , t + β 7 E C i , t + β 8 D u a l i , t + β 9 Y e a r t + β 10 I n d i + ε i , t
O B i , t = α i , t + a 1 D n o i , t + β 1 R D i , t + β 2 O R i , t + β 3 R o a i , t + β 4 R o e i , t + β 5 C a s h i , t + β 6 G r o w t h i , t + β 7 E C i , t + β 8 D u a l i , t + β 9 Y e a r t + β 10 I n d i + ε i , t
O D i , t = α i , t + a 2 D n o i , t + β 1 R D i , t + β 2 O R i , t + β 3 R o a i , t + β 4 R o e i , t + β 5 C a s h i , t + β 6 G r o w t h i , t + β 7 E C i , t + β 8 D u a l i , t + β 9 Y e a r t + β 10 I n d i + ε i , t
G I i , t = α i , t + c D n o i , t + b 1 O B i , t + β 1 R D i , t + β 2 O R i , t + β 3 R o a i , t + β 4 R o e i , t + β 5 C a s h i , t + β 6 G r o w t h i , t + β 7 E C i , t + β 8 D u a l i , t + β 9 Y e a r t + β 10 I n d i + ε i , t
G I i , t = α i , t + c D n o i , t + b 2 O D i , t + β 1 R D i , t + β 2 O R i , t + β 3 R o a i , t + β 4 R o e i , t + β 5 C a s h i , t + β 6 G r o w t h i , t + β 7 E C i , t + β 8 D u a l i , t + β 9 Y e a r i , t + β 10 I n d i , t + ε i , t
In each model, i represents the industry dummy variable, t represents the year dummy variable, α represents the fixed effect variable that does not change with time, β is the regression coefficient of the control variables, and ε is the random error term.

4. Empirical Analysis

4.1. Descriptive Statistics

Table 4 is a descriptive statistical table of the full sample. It can be seen that there are 582 observed values for each variable. The mean value and standard deviation of GI are 14.42 and 24.97, indicating that heavily polluted listed companies have a considerable degree of dispersion in the number of green patent applications. The data on the Dno distribution are relatively concentrated, and the quantiles of P25, P50, and P75 are 9, 11, and 13, respectively, indicating that there is little difference in board size and the number of board members in the sample enterprises. The mean value of openness breadth (OB) was 4.82, and the standard deviation was 10.57; the median is 2, indicating that the number of innovation partners in most enterprises remains at a low level and has a great disparity. The mean value of openness depth (OD) is 4.17, and the quantiles of P25, P50, and P75 were 1, 2.5, and 5.33, respectively, indicating that the total number of patents jointly applied for by most enterprises was larger than the total number of partners, and they could conduct more than one patent application cooperation with each partner.
Table 5 and Table 6 are descriptive statistical tables of subsamples according to the ownership property. As can be observed in the mean values of green innovation (GI) and board size (Dno), state-owned enterprises have better green patent output and more board members than non-state-owned enterprises. Similarly, the openness breadth and depth of state-owned enterprises are much higher than non-state-owned enterprises.

4.2. Correlation Coefficient Test

Table 7 shows the Pearson correlation coefficient between various variables. It can be seen that there are significant positive correlations between green innovation (GI), board size (Dno), openness breadth (OB), and openness depth (OD) at the 1% level; thus, the preliminaries verified that Dno, OB, and OD can both promote GI. There is a positive relationship between board size (Dno), openness breadth (OB), and openness depth (OD), but it is not very significant, which needs to be further verified with regression analysis. Meanwhile, only the correlation coefficient between OB and OD is greater than 0.5, and the other correlation coefficients are all less than 0.5; however, these two variables are not included in the same model. Therefore, there is no high correlation or serious multicollinearity problem in the empirical model.

4.3. Regression Analysis

4.3.1. Green Innovation, Board Size, and Openness

Table 8 reports regression results that tested the relationship between green innovation, board size, and openness. Model (1) verifies the direct impact of Dno on GI; the regression coefficient of Dno is 0.791, which passes the significance test at the 1% level, indicating that the expansion of corporate board size is conducive to promoting green innovation level. Thus, H1 is supported.
Model (2a) verifies the influence of Dno on the mediator OB; the regression coefficient of Dno was 0.3, which passes the significance test at the 1% level, indicating that an increase in board members can form a larger network of directors and increase the breadth of external innovation cooperation. Model (3a) verifies the mediation effect of OB; the results show that the regression coefficient of OB to GI is 0.446, which passes the significance test at the 1% level. The regression coefficient of Dno to GI is 0.657, which passes the significance test at the 1% level. In Model (3a), the regression coefficients of Dno and OB are both significant, and the coefficient of Dno (0.657) is smaller than that of Dno in Model (1) (0.791), indicating that openness breadth plays a partial mediating effect between board size and green innovation. Thus, H2 is supported.
Model (2b) verifies the influence of Dno on the mediator OD; the regression coefficient of Dno was 0.094, but it does not pass the significance test. Therefore, the regression results of Model (3b) have no statistical significance, indicating that long-term innovation cooperation with a single partner will not promote the green innovation level of enterprises; thus, openness depth has no significant mediating effect on board size and green innovation. Therefore, H3 is not supported.
A Sobel–Goodman test was utilized in this study to further verify the mediating effect of openness. It can be seen from the test results that the Z value of OB is greater than the critical value of 1.65, which passes the significance test at the 10% level. The proportion of the mediating effect reached 30.93%, further proving that openness breadth has a partial mediating effect on board size and green innovation.

4.3.2. Heterogeneity Test by Ownership Property

Enterprises with different property rights have significant differences in government subsidies, management systems, and governance modes, so ownership property has a heterogeneous influence on firm innovation behaviors [95]. In this section, samples are distributed by the actual controller type of the companies [32]. The dummy variable of ownership property is configured, and the assignment rule is: non-state-owned (non-Soe) enterprises = 0, state-owned (Soe) enterprises = 1. Then, we enter the interaction terms of Dno, OB, OD, and ownership property (Soe) to further verify the heterogeneous impact of ownership property on green innovation.
The regression results of Model (1) show that the coefficients of Dno and the interaction terms (Dno×Soe) are 0.536 and 0.168, respectively, which pass the significance test at the 5% and 1% levels, respectively. The results show that, for non-state-owned enterprises, the regression coefficient of Dno on GI is 0.536, and for state-owned enterprises, the regression coefficient of Dno on GI is 0.704 = 0.536 + 0.168, indicating that the Dno has a positive effect on GI in both Soe and non-Soe enterprises, but that the expansion of the Dno in Soe enterprises has a more significant effect on GI than in non-Soe enterprises.
As can be seen from the regression results of Model (2a), the regression coefficient of Dno is not significant, while the regression coefficient of the interaction term (Dno×Soe) is 0.074, which passes the significance test at the 10% level, indicating that, in Soe enterprises, the expansion of Dno has a more significant impact on obtaining more external partners. Therefore, compared to non-Soe enterprises, the openness breadth can play a mediating effect in Soe enterprises. The regression results of Model (2b) show that openness depth has no mediating effect in either Soe or non-Soe enterprises. Thus, some hypotheses in this paper are further verified (Table 9).

4.4. Robustness Test

In this section, the robustness test is investigated by changing the measure index of the explained variables (Table 10). Referring to Ma (2022) [32], green invention patents have higher technological content and better represent the quality of green innovation. Therefore, the number of green invention patent applications is invoked as a proxy index of GI for regression analysis. The results show that the positive and negative correlations between the variables do not change; however, the significance level of the explained variables does change, indicating that the regression results are robust. The Sobel–Goodman test results are also consistent with those mentioned above.

4.5. Results and Discussion

The purpose of this study was to examine the impact of board size on green innovation and the mediating role of innovation openness in Chinese heavily polluting enterprises. By using the balanced panel data of the samples to conduct multiple linear regression according to the three-step mediation test method, the empirical results were obtained and the hypotheses proposed in this paper were tested.
Hypothesis 1 was that a corporation’s board size has a positive impact on green innovation. The regression results of Model (1) in Table 8 show that the coefficient of Dno is 0.791, which has statistical significance at the 1% level, indicating that Hypothesis 1 is supported. In China’s heavy pollution enterprises, an increase in board members can increase the collaboration of heterogeneous opinions in internal decision-making, causing innovation strategies to take social responsibility and environmental protection into account, thus promoting green innovation. This result further expands the conclusion of Galia (2012)’s study [64]. Although their conclusion showed that board size has no significant impact on innovation, this result proves that the diversification of the board caused by an increase in the board size can have a significant positive impact on green innovation. It also proves that green innovation needs more diversified knowledge and technology than general innovation [70]. However, this result is contrary to the empirical conclusion of Li Xia (2022) [96]. In their study, they took the new energy automobile industry as a sample and found that board size had a negative impact on green innovation as a control variable. The reason may be due to differences in industry samples.
Hypothesis 2 was that openness breadth plays a mediating role in the impact of board size on green innovation. The regression results of Models (2a) and (3a) in Table 8 show that the coefficients of Dno are 0.3 and 0.657, respectively, and are statistically significant at the 5% and 1% levels. Meanwhile, the coefficient of OB is 0.446, which has statistical significance at the 1% level, indicating that Hypothesis 2 is supported. The results show that a larger board of directors can accommodate more people with expertise and more technology, which are scarce resources for enterprises [65]. Meanwhile, their personal social connections also provide opportunities for enterprises to collaborate with external organizations with respect to innovation. Diverse innovation partners can provide the diverse knowledge needed for process, product management, and other improvements in green innovation [10] while also sharing the risks and costs. This result first supports the view that open innovation is conducive to promoting green innovation, which is consistent with the conclusion of most scholars [69,81]. That is, open or collaborative R&D is the key path to the efficient implementation of green innovation. Meanwhile, the result also empirically tested the impact of board size on open innovation, that is, whether a larger board network forms a broader enterprise network and drives innovation performance. This empirical result also supports the research of Chuluun (2017) [86].
Hypothesis 3 was that openness depth plays a mediating role in the impact of board size on green innovation. The regression results of Model (2b) in Table 8 show that the coefficient of Dno is 0.094, which is not statistically significant, indicating that an increase in board members does not significantly affect the deep and long-term innovation cooperation of enterprises. Therefore, the results of Model (3b) in Table 8 cannot verify the mediating effect of open depth, and Hypothesis 3 is not supported. The probable reason is that green innovation covers production technology, equipment, daily management, office, and other aspects. Compared to traditional innovation, it is more diverse and comprehensive [97]; no company can have all the green technology it needs, and no company can supply all the green technologies that the market needs [70,78]. Therefore, enterprises require a variety of partners to implement green innovation rather than a single, long-term partner.
This study further verifies the heterogeneity effect of ownership property. The regression results of Model (1) in Table 9 show that, compared to non-state-owned enterprises, Dno has a greater and significant positive effect on Gi in state-owned enterprises. The possible reason is that Soe enterprises need to more closely abide by the government’s environmental policies and establish a good public image [98]. Meanwhile, the business goals of Soe enterprises are often consistent with government will, which makes for an easier time in obtaining government subsidies and reducing the cost of GI [99]. Meanwhile, for Soe enterprises, the mediating effect of OB is also more significant. However, the mediating effect of OD is not statistically significant in any equity enterprises. The directors of Soe enterprises often have government experience and administrative ranks, and such identity labels make it easier for them to gain trust in innovation networks and facilitate the establishment of more cooperative relationships [100], thus promoting green innovation cooperation. This result also supports previous research [99,100]. However, some scholars have also pointed out that senior executives appointed by the government in state-owned enterprises often lack professional training and competitiveness, and are conservative about innovative projects [101]. The reason for the different views may be that, compared to general innovation, green innovation is linked to the environmental performance of enterprises, and the latter is closely related to the political motivation of senior managers [102].

5. Conclusions

5.1. Empirical Findings

This study explored the influencing factors of green innovation from the perspective of enterprise internal governance and constructs a theoretical framework of “board size–openness–green innovation”. We empirically examined the impact of board size on green innovation, the mediating role of innovation openness, and the heterogeneity of ownership property with respect to Chinese heavily polluting enterprises. Based on the panel data of heavily polluting enterprises listed in China’s A-share market from 2015 to 2020, ordinary least squares (OLS) models with fixed effects of time and industry were used for multiple linear regression, and the empirical results are as follows: (1) Board size has a significant positive impact on green innovation, indicating that more board members can provide resources and knowledge support for green innovation, strengthening the supervision of environmental decisions. (2) Openness breadth plays a significant partial mediating effect on the relationship between board size and green innovation, while openness depth has no significant mediating effect. This result indicates that a larger board also means a larger network of directors, which facilitates the search for and acquisition of external technical resources and innovation partners. Furthermore, the greater openness breadth also provides more resources, knowledge, and innovation opportunities for green innovation. (3) Ownership property had a heterogeneous effect; in state-owned enterprises, the expansion of board size promoted green innovation, and the mediating effect of openness breadth was also more significant. This result indicates that boards in state-owned enterprises more actively cater to government environmental policies; likewise, they more easily find outside innovation partners.
The possible innovations and contributions of this study are as follows. First, from the perspective of internal governance, this study empirically examined the impact of board size on green innovation, which fills the research gap in the field of green innovation and provides new evidence for how board governance mechanisms affect green innovation. Second, the significant promoting effect of open innovation or collaborative innovation on green innovation has been verified by most scholars. The theoretical framework of “board size–openness–green innovation” constructed in this study further enriches the impact mechanism of open innovation on green innovation and clarifies the mediating role of openness. Third, this study finds that director networks provide advantages and form a foundation for enterprises to expand external innovation cooperation networks and that a larger board is conducive to more extensive innovation cooperation for the purpose of improving green innovation performance. This provides practical guidance for enterprises trying to improve internal governance to promote green innovation. Fourth, we further explored the heterogeneity influence of ownership property, finding that, in state-owned enterprises, board size has a more significant impact on green innovation, and the mediating effect of openness is more significant, which also supports previous studies that found that green innovation is more valued in state-owned enterprises.

5.2. Policy Implications

This study has some guiding significance for business owners, policymakers, and other stakeholders. First, previous studies have shown that the impact of board size on innovation is inconsistent, but the results of this study show that maintaining a large board of directors can positively promote green innovation. For enterprise owners, more board members can be recruited in practice to ensure the implementation of green innovation decisions and projects. More board members can provide heterogeneous opinions when making strategic decisions, take environmental issues and social responsibilities into greater consideration, and strengthen supervision over management to avoid “short-sighted” behaviors.
Second, the results of this study show that openness breadth partially mediates the relationship between board size and green innovation. Therefore, enterprises should fully rely on the board of directors’ network, expanding the scope of external cooperation to carry out extensive green innovation cooperation with external organizations, such as universities, research institutions, government, suppliers, etc. The opportunities for innovative collaboration derived from the network of directors can share risks, reduce costs, and absorb more external resources and knowledge for an enterprise’s own green innovation behavior.
Third, open innovation provides a new development path for implementing green innovation. The government and other stakeholders, as victims of corporate pollution and beneficiaries of green innovation, should also actively participate in innovation cooperation. For example, the government can introduce preferential policies to encourage cooperative innovation and help enterprises build an industry–university–research system. Consumers and suppliers in the market can also provide suggestions for enterprises’ green innovations or deeply participate in the innovation process.

5.3. Limitations

This study had the following limitations, which need further study in the future. First, there were some limitations in the research sample. This study focused on a specific social environment and specific industries among listed heavily polluting enterprises in China, covering a wide range that is typical of these enterprises. However, the research sample did not consider non-listed companies or other manufacturing industries and countries; thus, future studies will need to expand the sample scope and size. Second, this study used the number of green patent applications to measure the explained variable. This measurement method can represent the innovation ability of firms, but it cannot directly reflect the green management level; thus, there were certain measurement limitations, and future studies will need to adopt more comprehensive measurement standards. Third, this study only studied the impact of board size on green innovation, but the dimensions representing the level of board governance also include the ratio of independent directors and board incentives, which also have an impact on corporate strategic decisions. Thus, there were certain dimension limitations, and future studies will need to further analyze the influencing mechanism from multiple dimensions.

Author Contributions

Conceptualization, J.Z. and W.C.; methodology, J.Z.; software, J.Z.; validation, J.Z.; formal analysis, A.P.; investigation, J.Z.; resources, J.Z.; data curation, J.Z.; writing—original draft preparation, J.Z.; writing—review and editing, J.Z.; visualization, J.Z.; supervision, A.P.; project administration, A.P.; funding acquisition, W.C. All authors have read and agreed to the published version of the manuscript.

Funding

This research received no external funding.

Institutional Review Board Statement

Not applicable.

Informed Consent Statement

Not applicable.

Data Availability Statement

The data and models used during the study are available from the corresponding author by request.

Conflicts of Interest

The authors declare no conflict of interest.

References

  1. Fan, F.; Lian, H.; Liu, X.; Wang, X. Can environmental regulation promote urban green innovation Efficiency? An empirical study based on Chinese cities. J. Clean. Prod. 2021, 287, 125060. [Google Scholar] [CrossRef]
  2. Luo, Y.; Salman, M.; Lu, Z. Heterogeneous impacts of environmental regulations and foreign direct investment on green innovation across different regions in China. Sci. Total Environ. 2021, 759, 143744. [Google Scholar] [CrossRef]
  3. Xie, X.; Zhu, Q. How can green innovation solve the dilemmas of “Harmonious Coexistence”? Manag. World 2021, 37, 128–149. [Google Scholar]
  4. Zhang, Y.; Xing, C.; Wang, Y. Does green innovation mitigate financing constraints? Evidence from China’s private enterprises. J. Clean. Prod. 2020, 264, 121698. [Google Scholar] [CrossRef]
  5. Li, W.; Bhutto, T.A.; Xuhui, W.; Maitlo, Q.; Zafar, A.U.; Bhutto, N.A. Unlocking employees’ green creativity: The effects of green transformational leadership, green intrinsic, and extrinsic motivation. J. Clean. Prod. 2020, 255, 120229. [Google Scholar] [CrossRef]
  6. De Marchi, V.J.R. Environmental innovation and R&D cooperation: Empirical evidence from Spanish manufacturing firms. Res. Policy 2012, 41, 614–623. [Google Scholar]
  7. Ghisetti, C.; Rennings, K. Environmental innovations and profitability: How does it pay to be green? An empirical analysis on the German innovation survey. J. Clean. Prod. 2014, 75, 106–117. [Google Scholar] [CrossRef] [Green Version]
  8. Tariq, A.; Badir, Y.; Chonglerttham, S. Green innovation and performance: Moderation analyses from Thailand. Eur. J. Innov. Manag. 2019, 22, 446–467. [Google Scholar] [CrossRef]
  9. Chen, Y.-S.; Lai, S.-B.; Wen, C.-T. The influence of green innovation performance on corporate advantage in Taiwan. J. Bus. Ethics 2006, 67, 331–339. [Google Scholar] [CrossRef]
  10. Albort-Morant, G.; Leal-Millán, A.; Cepeda-Carrión, G. The antecedents of green innovation performance: A model of learning and capabilities. J. Bus. Res. 2016, 69, 4912–4917. [Google Scholar] [CrossRef]
  11. Liu, Z.; Li, X.; Peng, X.; Lee, S. Green or nongreen innovation? Different strategic preferences among subsidized enterprises with different ownership types. J. Clean. Prod. 2020, 245, 118786. [Google Scholar] [CrossRef]
  12. Zhang, J.A.; Edgar, F.; Geare, A.; O’Kane, C. The interactive effects of entrepreneurial orientation and capability-based HRM on firm performance: The mediating role of innovation ambidexterity. Ind. Mark. Manag. 2016, 59, 131–143. [Google Scholar] [CrossRef]
  13. Jiao, J.-L.; Zhang, X.-L.; Tang, Y.-S. What factors determine the survival of green innovative enterprises in China?—A method based on fsQCA. Technol. Soc. 2020, 62, 101314. [Google Scholar] [CrossRef] [PubMed]
  14. Rennings, K. Redefining innovation—Eco-innovation research and the contribution from ecological economics. Ecol. Econ. 2000, 32, 319–332. [Google Scholar] [CrossRef]
  15. Li, D.; Zheng, M.; Cao, C.; Chen, X.; Ren, S.; Huang, M. The impact of legitimacy pressure and corporate profitability on green innovation: Evidence from China top 100. J. Clean. Prod. 2017, 141, 41–49. [Google Scholar] [CrossRef] [Green Version]
  16. Shen, C.; Li, S.; Wang, X.; Liao, Z. The effect of environmental policy tools on regional green innovation: Evidence from China. J. Clean. Prod. 2020, 254, 120122. [Google Scholar] [CrossRef]
  17. Porter, M.E.; Van der Linde, C. Toward a new conception of the environment-competitiveness relationship. J. Econ. Perspect. 1995, 9, 97–118. [Google Scholar] [CrossRef] [Green Version]
  18. Harrison, A.; Martin, L.A.; Nataraj, S. Green industrial policy in emerging markets. Annu. Rev. Resour. Econ. 2017, 9, 253–274. [Google Scholar] [CrossRef]
  19. Tian, P.; Lin, B. Promoting green productivity growth for China’s industrial exports: Evidence from a hybrid input-output model. Energy Policy 2017, 111, 394–402. [Google Scholar] [CrossRef]
  20. Feng, Z.; Chen, W. Environmental regulation, green innovation, and industrial green development: An empirical analysis based on the Spatial Durbin model. Sustainability 2018, 10, 223. [Google Scholar] [CrossRef] [Green Version]
  21. Costa, J.; Fonseca, J. The Impact of Corporate Social Responsibility and Innovative Strategies on Financial Performance. Risks 2022, 10, 103. [Google Scholar] [CrossRef]
  22. Kriechel, B.; Ziesemer, T. The environmental Porter hypothesis: Theory, evidence, and a model of timing of adoption. Econ. Innov. New Technol. 2009, 18, 267–294. [Google Scholar] [CrossRef] [Green Version]
  23. Zeng, H.; Dong, B.; Zhou, Q.; Jin, Y. The capital market reaction to central environmental protection inspection: Evidence from China. J. Clean. Prod. 2021, 279, 123486. [Google Scholar] [CrossRef]
  24. Zheng, S.; Kahn, M.E.; Sun, W.; Luo, D. Incentives for China’s urban mayors to mitigate pollution externalities: The role of the central government and public environmentalism. Reg. Sci. Urban Econ. 2014, 47, 61–71. [Google Scholar] [CrossRef]
  25. Wang, H.; Fan, C.; Chen, S. The impact of campaign-style enforcement on corporate environmental Action: Evidence from China’s central environmental protection inspection. J. Clean. Prod. 2021, 290, 125881. [Google Scholar] [CrossRef]
  26. Fang, Z.; Bai, H.; Bilan, Y. Evaluation research of green innovation efficiency in China’s heavy polluting industries. Sustainability 2019, 12, 146. [Google Scholar] [CrossRef] [Green Version]
  27. Wang, Z.; Chen, M.-H.; Chin, C.L.; Zheng, Q. Managerial ability, political connections, and fraudulent financial reporting in China. J. Account. Public Policy 2017, 36, 141–162. [Google Scholar] [CrossRef]
  28. Zhang, Z.; Peng, X.; Yang, L.; Lee, S. How does Chinese central environmental inspection affect corporate green innovation? The moderating effect of bargaining intentions. Environ. Sci. Pollut. Res. 2022, 29, 42955–42972. [Google Scholar] [CrossRef]
  29. Wang, R.; Wijen, F.; Heugens, P.P. Government’s green grip: Multifaceted state influence on corporate environmental actions in China. Strateg. Manag. J. 2018, 39, 403–428. [Google Scholar] [CrossRef]
  30. Zhou, Y.; Hong, J.; Zhu, K.; Yang, Y.; Zhao, D. Dynamic capability matters: Uncovering its fundamental role in decision making of environmental innovation. J. Clean. Prod. 2018, 177, 516–526. [Google Scholar] [CrossRef] [Green Version]
  31. Peng, B.; Zheng, C.; Wei, G.; Elahi, E. The cultivation mechanism of green technology innovation in manufacturing industry: From the perspective of ecological niche. J. Clean. Prod. 2020, 252, 119711. [Google Scholar] [CrossRef]
  32. Ma, X.; Ock, Y.-S.; Wu, F.; Zhang, Z. The Effect of Internal Control on Green Innovation: Corporate Environmental Investment as a Mediator. Sustainability 2022, 14, 1755. [Google Scholar] [CrossRef]
  33. Zhu, J.; Tang, W.; Zhang, B.; Wang, H. Influence of Environmentally Specific Transformational Leadership on Employees’ Green Innovation Behavior—A Moderated Mediation Model. Sustainability 2022, 14, 1828. [Google Scholar] [CrossRef]
  34. Begum, S.; Xia, E.; Ali, F.; Awan, U.; Ashfaq, M. Achieving green product and process innovation through green leadership and creative engagement in manufacturing. J. Manuf. Technol. Manag. 2021, 33, 656–674. [Google Scholar] [CrossRef]
  35. Fufa Gulema, T.; Zhou, X. Corporate Governance, Innovation Capacity and Firm Performance Evidence from Chinese Listed Firms. Int. J. Empir. Financ. Manag. Sci. 2020, 2, 26–42. [Google Scholar]
  36. Usman, M.; Javed, M.; Yin, J. Board internationalization and green innovation. Econ. Lett. 2020, 197, 109625. [Google Scholar] [CrossRef]
  37. Wu, H.; Zhou, Y. Optimal degree of openness in open innovation: A perspective from knowledge acquisition & knowledge leakage. Technol. Soc. 2021, 67, 101756. [Google Scholar]
  38. Chesbrough, H.; Crowther, A.K. Beyond high tech: Early adopters of open innovation in other industries. R&D Manag. 2006, 36, 229–236. [Google Scholar]
  39. Dangelico, R.M.; Pontrandolfo, P.; Pujari, D. Developing sustainable new products in the textile and upholstered furniture industries: Role of external integrative capabilities. J. Prod. Innov. Manag. 2013, 30, 642–658. [Google Scholar] [CrossRef]
  40. Arfi, W.B.; Hikkerova, L.; Sahut, J.-M. External knowledge sources, green innovation and performance. Technol. Forecast. Soc. Chang. 2018, 129, 210–220. [Google Scholar] [CrossRef]
  41. Chadha, A. Overcoming competence lock-in for the development of radical eco-innovations: The case of biopolymer technology. Ind. Innov. 2011, 18, 335–350. [Google Scholar] [CrossRef]
  42. Thakur, V.; Mangla, S.K. Change management for sustainability: Evaluating the role of human, operational and technological factors in leading Indian firms in home appliances sector. J. Clean. Prod. 2019, 213, 847–862. [Google Scholar] [CrossRef]
  43. Ma, Y.; Hou, G.; Yin, Q.; Xin, B.; Pan, Y. The sources of green management innovation: Does internal efficiency demand pull or external knowledge supply push? J. Clean. Prod. 2018, 202, 582–590. [Google Scholar] [CrossRef]
  44. Chen, V.Z.; Li, J.; Shapiro, D.M.; Zhang, X. Ownership structure and innovation: An emerging market perspective. Asia Pac. J. Manag. 2014, 31, 1–24. [Google Scholar] [CrossRef]
  45. Karakaya, E.; Hidalgo, A.; Nuur, C. Diffusion of eco-innovations: A review. Renew. Sustain. Energy Rev. 2014, 33, 392–399. [Google Scholar] [CrossRef]
  46. Mi, L.; Sun, Y.; Gan, X.; Yang, H.; Lv, T.; Shang, K.; Qiao, Y.; Jiang, Z. Promoting employee green behavior through the person-organization fit: The moderating effect of psychological distance. Front. Psychol. 2020, 11, 568385. [Google Scholar] [CrossRef]
  47. Cankaya, S.Y.; Sezen, B. Effects of green supply chain management practices on sustainability performance. J. Manuf. Technol. Manag. 2018, 30, 98–121. [Google Scholar] [CrossRef]
  48. Dai, D.; Xue, Y. The Impact of Green Innovation on a Firm’s Value from the Perspective of Enterprise Life Cycles. Sustainability 2022, 14, 1226. [Google Scholar] [CrossRef]
  49. Ahmeda, U.; Mozammelb, S.; Zamanc, F. Green HRM and green innovation: Can green transformational leadership moderate: Case of pharmaceutical firms in Australia. Syst. Rev. Pharm. 2020, 11, 616–617. [Google Scholar]
  50. Ali, F.; Ashfaq, M.; Begum, S.; Ali, A. How “Green” thinking and altruism translate into purchasing intentions for electronics products: The intrinsic-extrinsic motivation mechanism. Sustain. Prod. Consum. 2020, 24, 281–291. [Google Scholar] [CrossRef]
  51. Chen, Y.-S.; Chang, C.-H. The determinants of green product development performance: Green dynamic capabilities, green transformational leadership, and green creativity. J. Bus. Ethics 2013, 116, 107–119. [Google Scholar] [CrossRef]
  52. Fernando, Y.; Jabbour, C.J.C.; Wah, W.-X. Pursuing green growth in technology firms through the connections between environmental innovation and sustainable business performance: Does service capability matter? Resour. Conserv. Recycl. 2019, 141, 8–20. [Google Scholar] [CrossRef]
  53. de Azevedo Rezende, L.; Bansi, A.C.; Alves, M.F.R.; Galina, S.V.R. Take your time: Examining when green innovation affects financial performance in multinationals. J. Clean. Prod. 2019, 233, 993–1003. [Google Scholar] [CrossRef]
  54. Dong, Z.; He, Y.; Wang, H.; Wang, L. Is there a ripple effect in environmental regulation in China?—Evidence from the local-neighborhood green technology innovation perspective. Ecol. Indic. 2020, 118, 106773. [Google Scholar] [CrossRef]
  55. Cainelli, G.; D’Amato, A.; Mazzanti, M. Resource efficient eco-innovations for a circular economy: Evidence from EU firms. Res. Policy 2020, 49, 103827. [Google Scholar] [CrossRef]
  56. Farza, K.; Ftiti, Z.; Hlioui, Z.; Louhichi, W.; Omri, A. Does it pay to go green? The environmental innovation effect on corporate financial performance. J. Environ. Manag. 2021, 300, 113695. [Google Scholar] [CrossRef]
  57. Wang, C.; Hu, Y.; Zhang, J.; Miao, C. CEO media exposure and green technological innovation decision: Evidence from Chinese polluting firms. Math. Probl. Eng. 2020, 2020, 8271621. [Google Scholar] [CrossRef]
  58. Lisi, W.; Zhu, R.; Yuan, C. Embracing green innovation via green supply chain learning: The moderating role of green technology turbulence. Sustain. Dev. 2020, 28, 155–168. [Google Scholar] [CrossRef]
  59. Tsai, K.H.; Liao, Y.C. Innovation capacity and the implementation of eco-innovation: Toward a contingency perspective. Bus. Strategy Environ. 2017, 26, 1000–1013. [Google Scholar] [CrossRef]
  60. Feng, L.; Zhao, W.; Li, H.; Song, Y. The effect of environmental orientation on green innovation: Do political ties matter? Sustainability 2018, 10, 4674. [Google Scholar] [CrossRef] [Green Version]
  61. El-Kassar, A.-N.; Singh, S.K. Green innovation and organizational performance: The influence of big data and the moderating role of management commitment and HR practices. Technol. Forecast. Soc. Chang. 2019, 144, 483–498. [Google Scholar] [CrossRef]
  62. Chindasombatcharoen, P.; Chatjuthamard, P.; Jiraporn, P.; Treepongkaruna, S. Achieving sustainable development goals through board size and innovation. Sustain. Dev. 2021. [Google Scholar] [CrossRef]
  63. De Cleyn, S.H.; Braet, J. Do board composition and investor type influence innovativeness in SMEs? Int. Entrep. Manag. J. 2012, 8, 285–308. [Google Scholar] [CrossRef]
  64. Galia, F.; Zenou, E. Board composition and forms of innovation: Does diversity make a difference? Eur. J. Int. Manag. 2012, 6, 630–650. [Google Scholar] [CrossRef]
  65. Adams, R.B.; Hermalin, B.E.; Weisbach, M.S. The role of boards of directors in corporate governance: A conceptual framework and survey. J. Econ. Lit. 2010, 48, 58–107. [Google Scholar] [CrossRef] [Green Version]
  66. Orozco, L.A.; Vargas, J.; Galindo-Dorado, R. Trends on the relationship between board size and financial and reputational corporate performance: The Colombian case. Eur. J. Manag. Bus. Econ. 2018, 27, 183–197. [Google Scholar] [CrossRef] [Green Version]
  67. Shapiro, D.; Tang, Y.; Wang, M.; Zhang, W. The effects of corporate governance on the innovation performance of Chinese SMEs. Eur. Econ. Rev. 2013, 50, 155–183. [Google Scholar] [CrossRef]
  68. Albort-Morant, G.; Leal-Rodríguez, A.L.; De Marchi, V. Absorptive capacity and relationship learning mechanisms as complementary drivers of green innovation performance. J. Knowl. Manag. 2018, 22, 432–452. [Google Scholar] [CrossRef]
  69. Yang, J.Y.; Roh, T. Open for green innovation: From the perspective of green process and green consumer innovation. Sustainability 2019, 11, 3234. [Google Scholar] [CrossRef] [Green Version]
  70. Melander, L.; Pazirandeh, A. Collaboration beyond the supply network for green innovation: Insight from 11 cases. Supply Chain Manag. Int. J. 2019, 24, 509–523. [Google Scholar] [CrossRef]
  71. Varshney, P.; Kaul, V.K.; Vasal, V. Corporate governance index and firm performance: Empirical evidence from India. LBS J. Manag. Res. 2015, 13, 59–75. [Google Scholar] [CrossRef]
  72. Chesbrough, H.W. Open Innovation: The New Imperative for Creating and Profiting from Technology; Harvard Business Press: Boston, MA, USA, 2003. [Google Scholar]
  73. Lichtenthaler, U. Open innovation: Past research, current debates, and future directions. Acad. Manag. Perspect. 2011, 25, 75–93. [Google Scholar]
  74. Mubarak, M.F.; Petraite, M. Industry 4.0 technologies, digital trust and technological orientation: What matters in open innovation? Technol. Forecast. Soc. Chang. 2020, 161, 120332. [Google Scholar] [CrossRef]
  75. Klewitz, J.; Hansen, E.G. Sustainability-oriented innovation of SMEs: A systematic review. J. Clean. Prod. 2014, 65, 57–75. [Google Scholar] [CrossRef]
  76. Laursen, K.; Salter, A. Open for innovation: The role of openness in explaining innovation performance among UK manufacturing firms. Strateg. Manag. J. 2006, 27, 131–150. [Google Scholar] [CrossRef]
  77. Bai, Y.; Wang, J.-Y.; Jiao, J.-L. A framework for determining the impacts of a multiple relationship network on green innovation. Sustain. Prod. Consum. 2021, 27, 471–484. [Google Scholar] [CrossRef]
  78. Cainelli, G.; De Marchi, V.; Grandinetti, R. Does the development of environmental innovation require different resources? Evidence from Spanish manufacturing firms. J. Clean. Prod. 2015, 94, 211–220. [Google Scholar] [CrossRef]
  79. Guo, Y.; Wang, L.; Chen, Y. Green entrepreneurial orientation and green innovation: The mediating effect of supply chain learning. SAGE Open 2020, 10, 2158244019898798. [Google Scholar] [CrossRef]
  80. Rauter, R.; Globocnik, D.; Perl-Vorbach, E.; Baumgartner, R. Open innovation and its effects on economic and sustainability innovation performance. J. Innov. Knowl. 2019, 4, 226–233. [Google Scholar] [CrossRef]
  81. Sun, Y.; Sun, H. Green innovation strategy and ambidextrous green innovation: The mediating effects of green supply chain integration. Sustainability 2021, 13, 4876. [Google Scholar] [CrossRef]
  82. Song, Y.; Zhang, J.; Song, Y.; Fan, X.; Zhu, Y.; Zhang, C. Can industry-university-research collaborative innovation efficiency reduce carbon emissions? Technol. Forecast. Soc. Chang. 2020, 157, 120094. [Google Scholar] [CrossRef]
  83. Sánchez-Sellero, P.; Bataineh, M. How R&D cooperation, R&D expenditures, public funds and R&D intensity affect green innovation? Technol. Anal. Strateg. Manag. 2021, 1–14. [Google Scholar] [CrossRef]
  84. Lichtenthaler, U.; Lichtenthaler, E. A capability-based framework for open innovation: Complementing absorptive capacity. J. Manag. Stud. 2009, 46, 1315–1338. [Google Scholar] [CrossRef]
  85. Asakawa, K.; Nakamura, H.; Sawada, N. Firms’ open innovation policies, laboratories’ external collaborations, and laboratories’ R&D performance. R&D Manag. 2010, 40, 109–123. [Google Scholar]
  86. Chuluun, T.; Prevost, A.; Upadhyay, A. Firm network structure and innovation. J. Corp. Financ. 2017, 44, 193–214. [Google Scholar] [CrossRef]
  87. Li, W.; Xu, J.; Zheng, M. Green governance: New perspective from open innovation. Sustainability 2018, 10, 3845. [Google Scholar] [CrossRef] [Green Version]
  88. Ghisetti, C.; Marzucchi, A.; Montresor, S. The open eco-innovation mode. An empirical investigation of eleven European countries. Res. Policy 2015, 44, 1080–1093. [Google Scholar] [CrossRef]
  89. Custódio, C.; Ferreira, M.A.; Matos, P. Do general managerial skills spur innovation? Manag. Sci. 2019, 65, 459–476. [Google Scholar] [CrossRef]
  90. Wu, H.; Wang, S. Do bond market participants pay attention to corporate environmental information?—Empirical evidence from China’s heavily polluting listed companies. Account. Res. 2016, 9, 68–74. [Google Scholar]
  91. Wang, K.; Zhang, X. The effect of media coverage on disciplining firms’ pollution behaviors: Evidence from Chinese heavy polluting listed companies. J. Clean. Prod. 2021, 280, 123035. [Google Scholar] [CrossRef]
  92. Fabrizi, A.; Guarini, G.; Meliciani, V. Green patents, regulatory policies and research network policies. Res. Policy 2018, 47, 1018–1031. [Google Scholar] [CrossRef]
  93. Pan, Z.; Liu, L.; Bai, S.; Ma, Q. Can the social trust promote corporate green innovation? Evidence from China. Environ. Sci. Pollut. Res. 2021, 28, 52157–52173. [Google Scholar] [CrossRef]
  94. Wen, Z.; Chang, L.; Hau, K.-T.; Liu, H. Testing and application of the mediating effects. Acta Psychol. Sin. 2004, 36, 614. [Google Scholar]
  95. Deng, F.; Li, Y. Managerial ability, ownership and innovation investment: Empirical evidence based of high-tech listed companies. J. Ind. Technol. Econ. 2019, 38, 19–26. [Google Scholar]
  96. Xia, L.; Gao, S.; Wei, J.; Ding, Q. Government subsidy and corporate green innovation-Does board governance play a role? Energy Policy 2022, 161, 112720. [Google Scholar] [CrossRef]
  97. Ninlawan, C.; Seksan, P.; Tossapol, K.; Pilada, W. The implementation of green supply chain management practices in electronics industry. In Proceedings of the World Congress on Engineering, London, UK, 4–6 July 2012; Citeseer: London, UK, 2010; pp. 1563–1568. [Google Scholar]
  98. Yu, C.-H.; Wu, X.; Zhang, D.; Chen, S.; Zhao, J. Demand for green finance: Resolving financing constraints on green innovation in China. Energy Policy 2021, 153, 112255. [Google Scholar] [CrossRef]
  99. Zhong, Z.; Peng, B. Can environmental regulation promote green innovation in heavily polluting enterprises? Empirical evidence from a quasi-natural experiment in China. Sustain. Prod. Consum. 2022, 30, 815–828. [Google Scholar] [CrossRef]
  100. Gao, K.; Wang, L.; Zhao, H. Management Executive Power and Corporate Green Innovation—Empirical Evidence from China’s State-Owned Manufacturing Sector. Technol. Soc. 2022, 70, 102043. [Google Scholar] [CrossRef]
  101. Wu, H.; Liu, S.; Hu, S. Visible hand: Do government subsidies promote green innovation performance—Moderating effect of ownership concentration. Pol. J. Environ. Stud. 2021, 30, 881–892. [Google Scholar] [CrossRef]
  102. Aguilera, R.; Duran, P.; Heugens, P.; Sauerwald, S.; Turturea, R.; VanEssen, M. State ownership, political ideology, and firm performance around the world. J. World Bus. 2021, 56, 101113. [Google Scholar] [CrossRef]
Figure 1. Role relationship and research hypotheses.
Sustainability 14 08632 g001
Table 1. Sample screening process.
Screening ProcessNumber of CompaniesNumber of Observations
According to heavy pollution industry codes, screening companies listed in China A-shares.12187308
Excluding companies with abnormal financial conditions (ST. * ST).11677002
Excluding companies listed after 2015.7274362
Excluding companies that do not disclose or lack environmental and sustainable development reports.5553330
Excluding companies with incomplete or missing data on jointly applied patents.1761056
Excluding companies with incomplete or missing data on green patents.97582
Table 2. Sample structural traits.
Industry CodeIndustry NameSample Size
B06Coalmining and selection industry7
B09Nonferrous metal mining and selection industry5
C13Agricultural and sideline food processing industry3
C22Papermaking and paper product industry2
C25Petroleum refinery industry1
C26Chemical Industry20
C27Pharmaceutical manufacturing industry16
C28Chemical fiber manufacturing industry3
C30Nonmetal mineral product industry9
C31Ferrous metal smelting and manufacturing industry9
C32Nonferrous metal smelting and manufacturing industry10
C33Metal product industry6
D44Power and heat production and supply industry6
Table 3. Definition and description of variables.
TypesNamesCodesMeasure
Explained variableGreen innovationGILn(Total number of green patent applications + 1)
Explanatory variableBoard sizeDnoLn(Number of Board Members)
Mediating variablesOpenness breadthOBLn(Total number of external organizations + 1)
Openness depthODLn(Total number of patents jointly filed/Total number of external organizations + 1)
Control variablesR&D investmentRDThe proportion of R&D investment in total assets
Firm redundancyOR(Current Ratio + Equity and Liabilities + Sales Period Expense Ratio)/3
Operational capacityRoaReturn on total assets
ProfitabilityRoeReturn on equity
Cash constraintsCash(Operational cash flow)/Total Assets
Development abilityGrowthIncrease rate of business revenue
Ownership concentrationECShareholding ratio of the largest shareholder
CEO dualityDualWhether the chairman and the general manager are the same person; yes = 0, no = 1
YearYearYear dummy variables
IndustryIndSet industry dummy variables according to CSRC standards
Table 4. Full sample descriptive statistics.
VariableNMeanSDP25P50P75MinMax
GI58214.4224.9726160272
Dno58211.082.8991113522
OB5824.8210.571250138
OD5824.175.7912.55.33056
RD5820.030.020.010.030.0400.18
OR5821.081.170.530.771.250.115.93
Roa5820.470.460.460.60.870.132.88
Roe5820.080.230.030.090.14−4.321.47
Cash5820.10.080.050.090.1300.49
Growth5820.120.28−0.010.080.21−0.63.95
EC58238.7615.2427.4937.0548.5511.0882.51
Dual5820.870.3411101
Table 5. Descriptive statistics of state-owned enterprises.
VariableNMeanSDP25P50P75MinMax
GI34718.74329.90738230272
Dno34712.013.072101114522
OB3475.90813.261350138
OD3474.3156.67412.3335.231056
RD3470.020.0180.0050.0160.03300.101
OR3470.8360.6720.4480.6120.9530.1055.385
Roa3470.7970.5240.4510.6430.9330.1272.883
Roe3470.0610.2930.0260.070.126−4.321.467
Cash3470.0940.0620.0470.0810.1260.0010.39
Growth3470.1180.329−0.0310.0710.188−0.5973.948
EC34744.0715.333.2240.2454.9616.8882.51
Dual3470.9450.22811101
Table 6. Descriptive statistics of non-state-owned enterprises.
VariableNMeanSDP25P50P75MinMax
GI2358.02512.539149092
Dno2359.6981.8819911516
OB2353.2133.584124024
OD2353.9444.16812.6675.667020.33
RD2350.0420.0260.0280.0390.050.0010.18
OR2351.4441.5750.7561.0381.5970.23915.93
Roa2350.6660.3260.4770.5750.7720.1562.311
Roe2350.1080.0890.0510.1030.155−0.3270.489
Cash2350.120.0950.0580.0920.1460.0120.493
Growth2350.1350.1950.0060.1150.239−0.2760.943
EC23530.9111.2822.9429.5439.8511.0857.35
Dual2350.7530.43211101
Table 7. The correlation coefficient of variables.
Variables123456789101112
1.GI1
2.Dno0.17 ***1
3.OB0.36 ***0.07 *1
4.OD0.17 ***0.010.53 ***1
5.RD−0.31 ***−0.29 ***−0.020.021
6.OR−0.25 ***−0.21 ***−0.0280.08 *0.45 ***1
7.Roa0.0010.12 ***−0.0260.15 ***−0.26 ***−0.14 ***1
8.Roe−0.02−0.030.0350.13 ***0.085 **0.23 ***0.11 ***1
9.Cash−0.2 ***−0.03−0.049−0.0080.31 ***0.35 ***0.0050.26 ***1
10.Growth−0.0010.0240.0040.0330.0070.0470.0170.4 ***−0.0141
11.EC0.17 ***0.15 ***0.14 ***−0.014−0.28 ***−0.23 ***0.0630.099 **0.044−0.0141
12.Dual0.1 ***0.16 ***−0.028−0.11 ***−0.105 **−0.19 ***−0.016−0.061−0.007−0.0380.096 **1
Note: ***, **, and * represent significance levels of 1%, 5%, and 10%, respectively.
Table 8. Regression results with respect to green innovation, board size, and openness.
VariablesModel (1)Model (2a)Model (3a)Model (2b)Model (3b)
GIOBGIODGI
Dno0.791 ***
(3.65)
0.3 **
(1.97)
0.657 ***
(3.18)
0.094
(0.66)
0.764 ***
(3.59)
OB//0.446 ***
(8.39)
//
OD////0.287 ***
(5.35)
RD−3.489
(−1.31)
3.358 *
(1.66)
−4.986 *
(−1.92)
3.147
(1.53)
−4.393 *
(−1.68)
OR−0.002
(−0.05)
0.032
(0.95)
−0.016
(−0.38)
0.065
(1.46)
−0.021
(−0.45)
Roa−0.2 *
(−1.66)
−0.061
(−0.66)
−0.173
(−1.44)
0.168
(1.42)
−0.248 **
(−1.97)
Roe0.257
(0.46)
0.323
(0.85)
0.113
(0.21)
0.642
(1.46)
0.072
(0.13)
Cash−2.247 ***
(−3.76)
−1.716 ***
(−3.55)
−1.482 ***
(−2.62)
−1.181 **
(-2.43)
−1.908 ***
(-3.22)
Growth−0.243
(−1.01)
−0.023
(−0.11)
−0.233
(−0.95)
−0.01
(−0.06)
−0.24
(−1.01)
EC0.008 **
(2.08)
0.005
(1.55)
0.006
(1.62)
0
(0.08)
0.008 **
(2.13)
Dual0.095
(0.75)
−0.097
(−0.96)
0.138
(1.20)
−0.179 *
(−1.68)
0.146
(1.2)
Constant0.114
(0.19)
0.284
(0.68)
−0.013
(−0.02)
0.927 **
(2.39)
−0.153
(−0.26)
N582582582582582
Year FEYesYesYesYesYes
Ind FEYesYesYesYesYes
R20.3440.1620.4260.1360.376
Sobel test 0.1247 * (z = 1.668)0.0394 (z = 0.8865)
Goodman−1 test 0.1247 * (z = 1.659)0.0394 (z = 0.8715)
Goodman−2 test 0.1247 * (z = 1.677)0.0394 (z = 0.9024)
Proportion of mediating effect 0.30930.0977
Note: The t statistic in parentheses is based on robust standard errors. ***, **, and * represent significance levels of 1%, 5%, and 10%, respectively.
Table 9. The effect of ownership property.
VariablesModel (1)Model (2a)Model (3a)Model (2b)Model (3b)
GIOBGIODGI
Dno0.536 **
(2.36)
0.189
(1.14)
0.554 **
(2.53)
0.032
(0.21)
0.601 ***
(2.66)
OB//0.211 **
(2.52)
//
OD////0.166 **
(2.25)
Dno×Soe0.168 ***
(3.47)
0.074 *
(1.94)
−0.015
(−0.22)
0.041
(1.01)
0.052
(0.68)
OB×Soe//0.312 ***
(3.04)
//
OD×Soe////0.194 *
(1.78)
RD−1.138
(−0.42)
4.386 **
(2.09)
−2.652
(−1.02)
3.724 *
(1.71)
−2.155
(−0.82)
OR−0.009
(−0.19)
0.029
(0.88)
−0.022
(−0.5)
0.063
(1.42)
−0.016
(−0.36)
Roa−0.222 *
(−1.9)
−0.07
(−0.77)
−0.167
(−1.41)
0.163
(1.37)
−0.258 **
(−2.12)
Roe0.465
(0.83)
0.414
(1.08)
0.147
(0.26)
0.693
(1.57)
0.199
(0.35)
Cash−2.02 ***
(−3.33)
−1.617 ***
(−3.32)
−1.28 **
(−2.27)
−1.126 **
(−2.3)
−1.693 ***
(−2.83)
Growth−0.219
(−0.89)
−0.012
(−0.06)
−0.16
(−0.62)
−0.004
(−0.02)
−0.195
(−0.8)
EC0.004
(0.96)
0.003
(0.95)
0.003
(0.65)
−0.001
(−0.24)
0.004
(1.02)
Dual0.006
(0.05)
−0.136
(−1.34)
0.025
(0.22)
−0.201 *
(−1.84)
0.038
(0.31)
Constant0.692
(1.14)
0.537
(1.21)
0.466
(0.81)
1.069 ***
(2.66)
0.364
(0.61)
N582582582582582
Year FEYesYesYesYesYes
Ind FEYesYesYesYesYes
R20.3560.1670.4430.1380.39
Note: The t statistic in parentheses is based on robust standard errors. ***, **, and * represent significance levels of 1%, 5%, and 10%, respectively.
Table 10. Robustness test of green innovation, board size, and openness.
VariablesModel (1)Model (2a)Model (3a)Model (2b)Model (3b)
GIOBGIODGI
Dno0.749 ***
(3.85)
0.3 **
(1.97)
0.622 ***
(3.35)
0.094
(0.66)
0.725 ***
(3.75)
OB//0.424 ***
(8.27)
//
OD////0.257 ***
(4.92)
RD0.767
(0.32)
3.358 *
(1.66)
−0.658
(−0.28)
3.147
(1.53)
−0.043
(−0.02)
OR0.016
(0.37)
0.032
(0.95)
0.003
(0.07)
0.065
(1.46)
−0.001
(−0.02)
Roa−0.081
(−0.68)
−0.061
(−0.66)
−0.055
(−0.47)
0.168
(1.42)
−0.124
(−0.99)
Roe0.601
(1.14)
0.323
(0.85)
0.464
(0.9)
0.642
(1.46)
0.436
(0.82)
Cash−2.235 ***
(−3.91)
−1.716 ***
(−3.55)
−1.507 ***
(−2.81)
−1.181 **
(−2.43)
−1.931 ***
(-3.41)
Growth−0.241
(−1.08)
−0.023
(−0.11)
−0.232
(−0.98)
−0.01
(−0.06)
−0.239
(−1.07)
EC0.009 **
(2.29)
0.005
(1.55)
0.007 *
(1.82)
0
(0.08)
0.009 **
(2.34)
Dual0.116
(0.92)
−0.097
(−0.96)
0.158
(1.34)
−0.179 *
(−1.68)
0.163
(1.32)
Constant−0.537
(−1.01)
0.284
(0.68)
−0.658
(−1.32)
0.927 **
(2.39)
−0.776
(−1.49)
N582582582582582
Year FEYesYesYesYesYes
Ind FEYesYesYesYesYes
R20.2690.1620.360.1360.3
Sobel test 0.1173 * (z = 1.669)0.3512 (z = 0.8855)
Goodman−1 test 0.1173 * (z = 1.66)0.3512 (z = 0.8963)
Goodman−2 test 0.1173 * (z = 1.678)0.3512 (z = 0.9026)
Proportion of mediating effect 0.31550.0944
Note: The t statistic in parentheses is based on robust standard errors. ***, **, and * represent significance levels of 1%, 5%, and 10%, respectively.
Publisher’s Note: MDPI stays neutral with regard to jurisdictional claims in published maps and institutional affiliations.

