Article

A Sustainability Assessment Framework for On-Site and Off-Site Construction Logistics

by
Nicolas Brusselaers
1,*,
Selamawit Mamo Fufa
2 and
Koen Mommens
1
1
Department of Business Technology and Operations, Faculty of Economic and Social Sciences and Solvay Business School, Vrije Universiteit Brussel, Pleinlaan 2, 1050 Elsene, Belgium
2
Building and Infrastructure, SINTEF (Stiftelsen for Industriell og Teknisk Forskning), P.O. Box 124 Blindern, 0314 Oslo, Norway
*
Author to whom correspondence should be addressed.
Sustainability 2022, 14(14), 8573; https://doi.org/10.3390/su14148573
Submission received: 31 May 2022 / Revised: 1 July 2022 / Accepted: 12 July 2022 / Published: 13 July 2022

Abstract

:
Urban areas pay increasing attention to new construction and infrastructure works, mainly due to the rapid global rise in urbanisation. In the long run, these works have a positive correlation with the economic and social attractiveness of cities. Construction strongly relies on logistics activities, which cannot be neglected in the environmental equation. An important aspect in tackling the negative effects of construction logistics (CL) lies in understanding the source and mitigation potential of the impacts incurred. However, currently, limited robust impact assessments are available for this sector. Given the lack of these rigorous assessments, it is difficult to evaluate the environmental criteria concerned, especially when comparing innovative CL solutions. In this paper, we present a holistic sustainability assessment framework designed for CL activities based on life cycle approaches, which covers four main iterative steps: (1) goal and scope definition, (2) data identification and availability, (3) scenario and setup evaluation and (4) environmental impact assessment. To measure both the off-site and on-site CL impact, two distinct and complementary methodologies are used: External Cost Calculations and Life Cycle Assessment. The framework was implemented on a pilot case in the Brussels-Capital Region (Belgium). It provides a holistic view of CL impacts for policy evaluations and implementations on the project, portfolio or city level. The results show that off-site zero-emission construction vehicles are the way forward if cities want to achieve environmental goals by 2035. However, market readiness for high-capacity vehicles must be considered. Otherwise, the positive effects on air pollution, climate change and noise are offset by a saturation of the road transport network and its associated congestion and infrastructure damage costs.

1. Introduction

Macro-economically, the construction sector produces 9.7% of Europe’s GDP, employing over 12 million people [1]. Consequently, it forms one of the largest economical industries. These figures also translate to the construction logistics (CL) sector, as the construction sector is intrinsically strongly reliant on logistics activities [2]. Indeed, 60–80% of the building materials and services which are necessary for the gross work are procured by suppliers and subcontractors [3]. The vast transport requirements are further emphasised by the immobile and ephemeral multi-organisation of a construction site [4,5]. The costs of material deliveries and reverse waste flows are financially significant, representing 8–15% of the total construction budget, excluding additional failure costs which can further increase the total budget by 10% [6]. Optimising the planning, consolidation and cooperation can render more efficient and sustainable CL [7], which also influence financial gains, potentially cutting total project construction costs by up to 20% [8]. Better planning and coordination of off-site and on-site logistics activities are also important, as the contribution from on-site logistics activities is estimated to be up to 60% of the total logistics cost [9]. An efficient construction site layout, which covers the geometry of the site, size and location of temporary facilities, is an important aspect that needs to be considered in the early planning phase, as it can significantly affect on-site transportation, CL and construction workers’ safety [10]. Recent research also shows that the reverse logistics supply chain can and should be managed more efficiently throughout the construction phases [11], while considering macro-level waste quality assurances [12]. Moreover, collaboration and coordination of actors in the supply chain and the use of off-site construction solutions (such as just-in-time and kitting) are some measures that need to be considered for the effective management of resource and material flows [13].
Gross estimates show that construction is responsible for up to 20–35% of total urban freight traffic in Europe [14]. Consequently, beside the financial costs, these transport movements also translate into a significant share of generated environmental costs. In the case of transport, the major externalities are air pollution, climate change, congestion, accidents, infrastructure, noise, loss of habitat and well-to-tank costs [15]. These nuisances go beyond the area of the construction site itself, as transports to and from the site also impact the area around the site and its surrounding city [16,17]. The global construction sector accounts for up to 23% of the total CO2 emissions, where on-site construction site activities account for up to 5.5% of the emissions [18]. There are several activities towards reducing emissions from on-site construction activities. Norway is the leader in using public procurement procedures to develop and implement emission-free on-site construction site solutions to fulfil international, national and regional environmental goals [19,20]. Emission reduction from off-site construction activities should also be considered to reduce the impact and avoid problem shifting from on-site to off-site activities.
However, little attention has been paid to the environmental costs of CL so far, most often because the construction sector is suffering from a data availability issue when it comes to accurate construction transport flows [14]. So far, current studies do not evaluate this burden using adequate performance indicators, such as vehicle- or tonne-kilometres, which are necessary in the calculation of transport externalities. For this reason, environmental impact reports are often lacking. Consequently, cities are encountering difficulties in developing and tailoring CL policies, as there is no baseline serving as a foundation in this process [21]. While policies targeting zero emission cities push regional and local authorities to attach more and more importance to logistics [22,23], there is a challenge in calculating the impacts generated by CL, as well as computing a robust, sector-wide environmental impact assessment. The MIMIC research project (Minimizing Impact of Construction Material Flows in Cities: Innovative Co-Creation, grant number 438.15.403 under the JPI Urban Europe research programme) was born to demonstrate how smart governance concepts can be used to facilitate construction and city planning processes [24]. By supporting logistics to, from and on urban construction sites, external costs generated by transport could be alleviated. Concluded in November 2021, the project delivered a smart governance concept supporting urban development decision processes [25]. This concept highlighted the need for the testing the framework developed within the project to enable the monitoring and quantification of both the off-site and on-site impact of CL scenarios, and to be deployed on project, portfolio and city levels [21,25].
The aim of this paper is to provide the integration of the impact assessment methods developed through the MIMIC project. Two distinct and complementary methodologies, External Cost Calculations (ECC) and Life Cycle Assessment (LCA), have been used to evaluate the use case selected in this study.
After this introduction section, a description of the theoretical impact assessment framework is outlined, followed by the methodology used in this study. Then, the results of the impact assessment applied in a demonstration pilot are presented and discussed. Finally, the conclusions and limitations are presented.

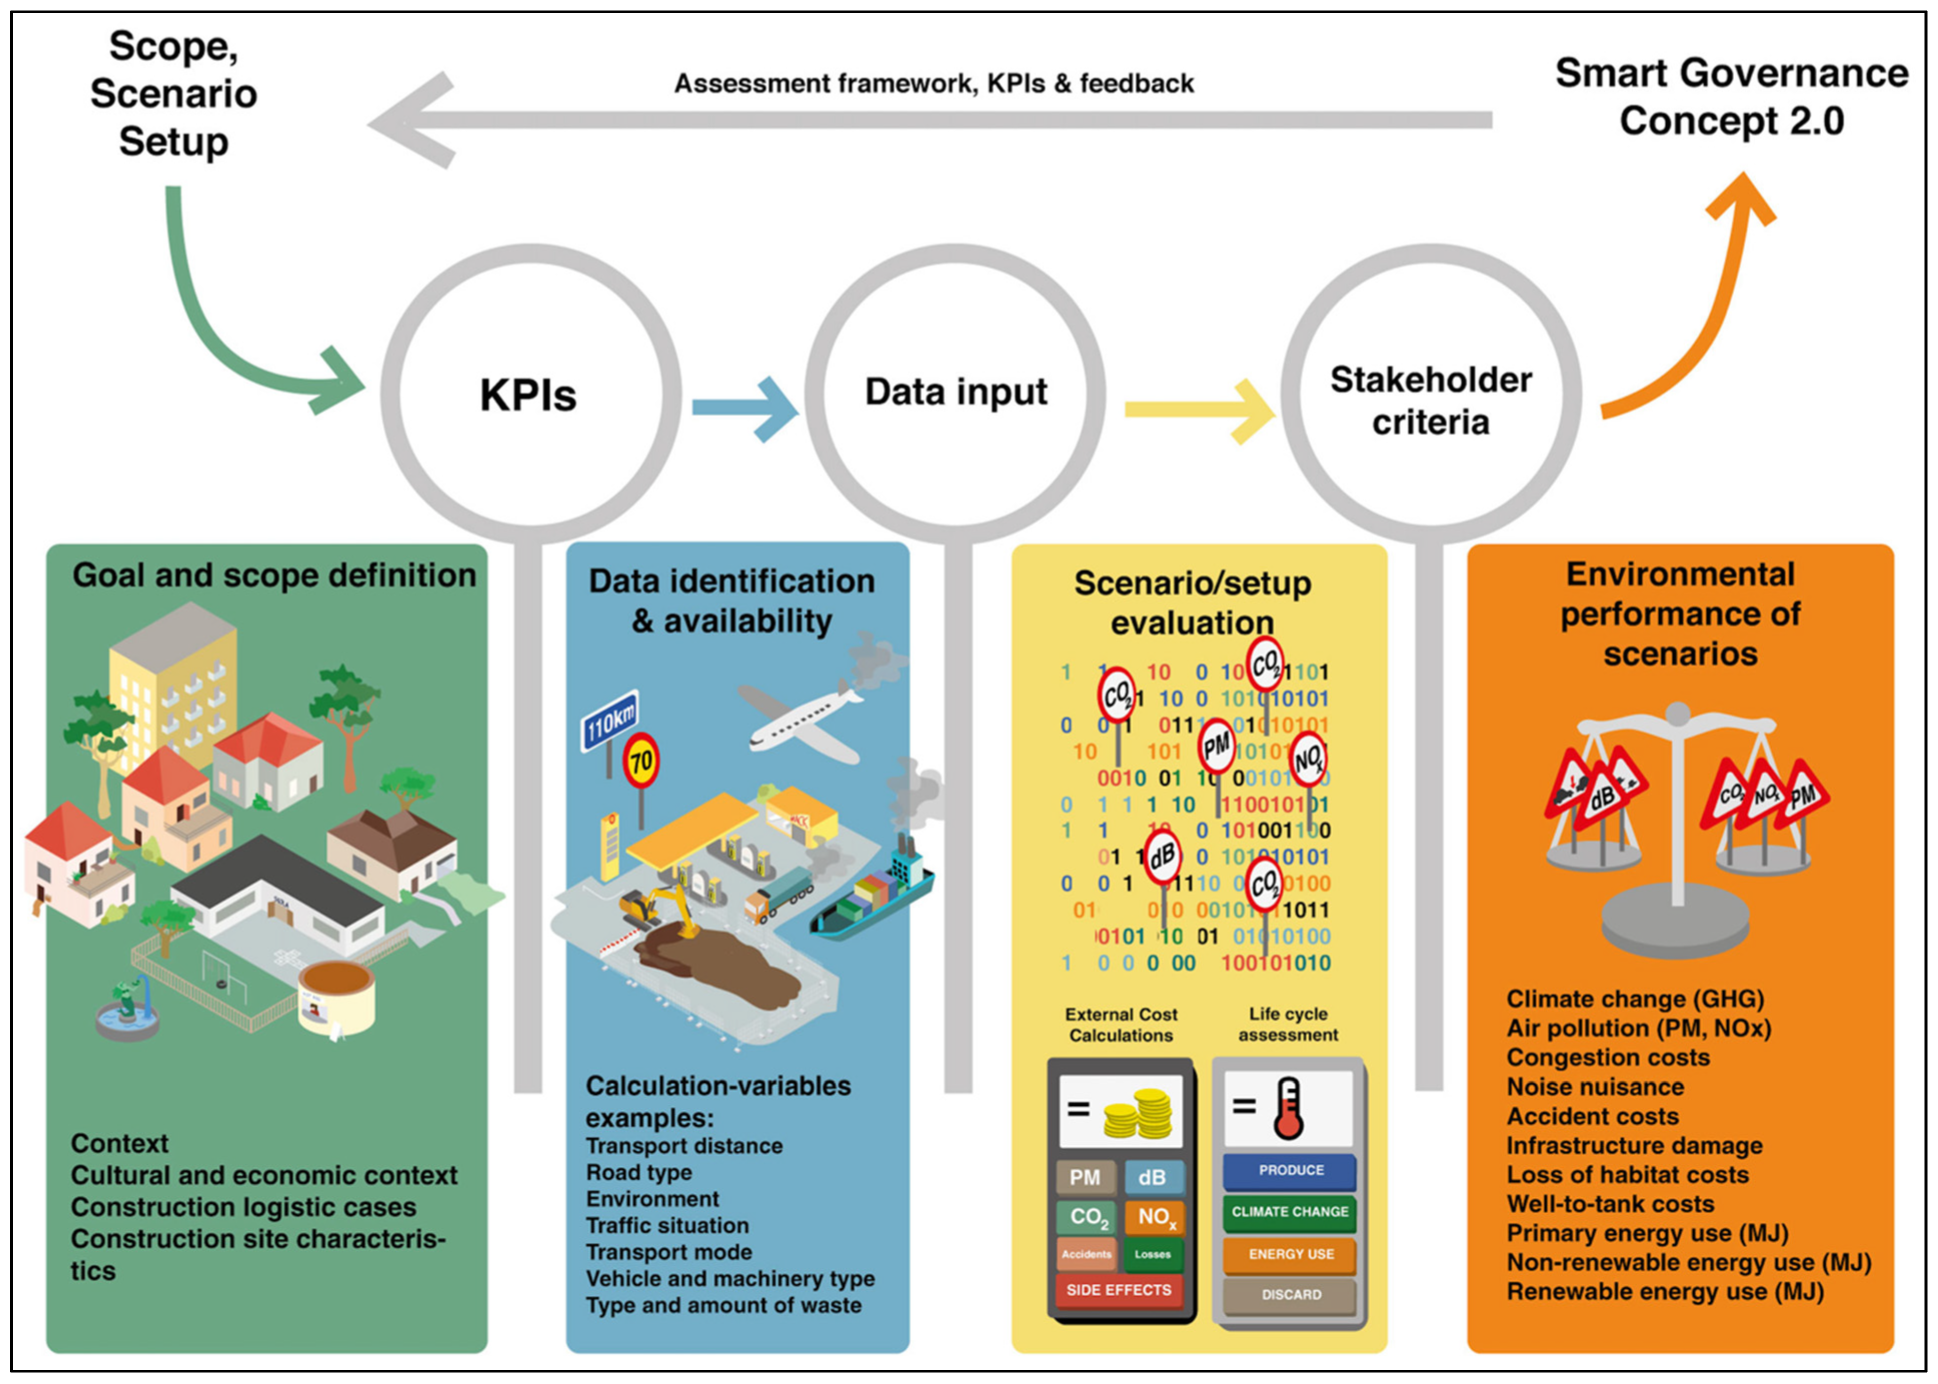
2. Theoretical Impact Assessment Framework

The impact from the case study is evaluated based on the methodologies presented in the CL impact assessment framework developed through the MIMIC project [24], which is presented in Figure 1 The framework is developed based on life cycle approaches and covers four main iterative steps: (1) goal and scope definition, (2) data identification and availability, (3) scenario and setup evaluation and (4) environmental performance of scenarios. The following section gives an overview of these four steps.
Goal and scope definition: The goal and scope definition of the desired CL impact assessment include the definition of the system boundary for CL activities, Construction Logistics Scenarios (CLS) and key performance indicators (KPIs). The contextual elements inherent to the construction project or city are identified (green), which form the basis of the framework. These factors include the cultural and economic context (such as the involved actors and scope of the construction programme, project and/or portfolio), details on the logistics case (such as the logistics’ scope and environment, the considered transport modes or transport limitations) and construction site characteristics (such as the amount of materials required on-site and considered procurement criteria). These factors are inherently linked to the defined scope, scenario and setup, which are defined as part of the Smart Governance Concept 2.0 [25]. CLS can enable us to consider alternative CL solutions to improve the efficiency and performance of CL activities defined in the Smart Governance Concept 2.0: (1) defining goals and scope (based on contextual foundations) at the strategic level in the decision-making process, (2) planning possible contextual and logistics scenarios to achieve the goals defined at the strategic level and (3) testing and implementing selected setups of scenarios at the operational level [27]. The goals and scope definition of the construction programme, portfolio or project thus have a direct influence on the choice of indicators considered in the evaluation methods (Cfr. ECC and LCA).
Data identification and availability: After consideration of relevant key performance indicators, the next step is to identify the available logistics data. Both LCA and ECC methods need detailed transport inventory data from CL activities [26]. Examples of relevant calculation variables are the transport distance, the road type, the traffic situation, vehicle characteristics and transported volume, some of which are fundamental, and some can serve as enrichment to the analysis [14]. The main methodologies used thus far to assess the external costs of construction logistics include traffic counts, surveys and/or data from CLS, which have served in a number of impact assessments in the sector [14]. However, current studies could not evaluate this burden using robust and adequate performance indicators, i.e., vehicle- or tonne-kilometres, which are necessary in the calculation of transport externalities [14]. For this reason, environmental impact reports are often lacking.
Scenario and setup evaluation: The collected data are then input as part of a scenario and/or setup evaluation (yellow) using the two complementary methodologies highlighted above, ECC and LCA. These methodologies are used to evaluate both the on-site and off-site CL activities. LCA is used to evaluate the direct and indirect environmental impact of both on-site and off-site CL activities by utilising climate change and resource use as KPIs. ECC has proven its relevancy to evaluate the monetarised environmental and social impacts of transport and off-site CL by utilising cost related to climate change, air pollution, congestion, noise, accidents and infrastructure damage [5,28]. More details on both methodologies used can be found in [14] and [26]. The scenario and setup evaluation aims to investigate a wide range of solutions in comparison with a baseline (business-as-usual) for the defined scenarios and setups and input criteria from the involved stakeholders. The evaluation is conducted based on input and background data collected, using LCA and ECC methods. These evaluations can be further enriched based on preferences put forward by the involved stakeholder, for example, by means of a Multi-Actor Multi-Criteria Analysis (MAMCA) [29]. For transport of materials, machinery and waste, both methods utilise the transport distance and vehicle characteristics as main calculation variables. Table 1 summarises the scope and data used by the ECC and LCA methods.
Environmental performance: The output of the framework then presents the environmental performance of CLS (orange). The considered framework takes into consideration all major transport externalities (climate change, air pollution, congestion, noise, accidents, infrastructure damage, habitat loss and well-to-tank costs) and its impact throughout the life cycle of the construction vehicle (including GHG emissions, primary energy use, renewable and non-renewable energy use). The framework allows for the impact assessment of all off-site (cargo bike, LCV, HGV, barges, maritime and aviation) and on-site (construction machinery) construction vehicle modes and types. Consequently, different CLS and setups can be evaluated against one another, either compared to a baseline (business-as-usual) or to simulated scenarios.

3. Materials and Methods

This section presents the methodological approach, which covers (1) a description of the case study, (2) the system boundaries of the CL activities, (3) the impact assessment framework and ECC/LCA methodologies and (4) scenarios used as part of the demonstration case.

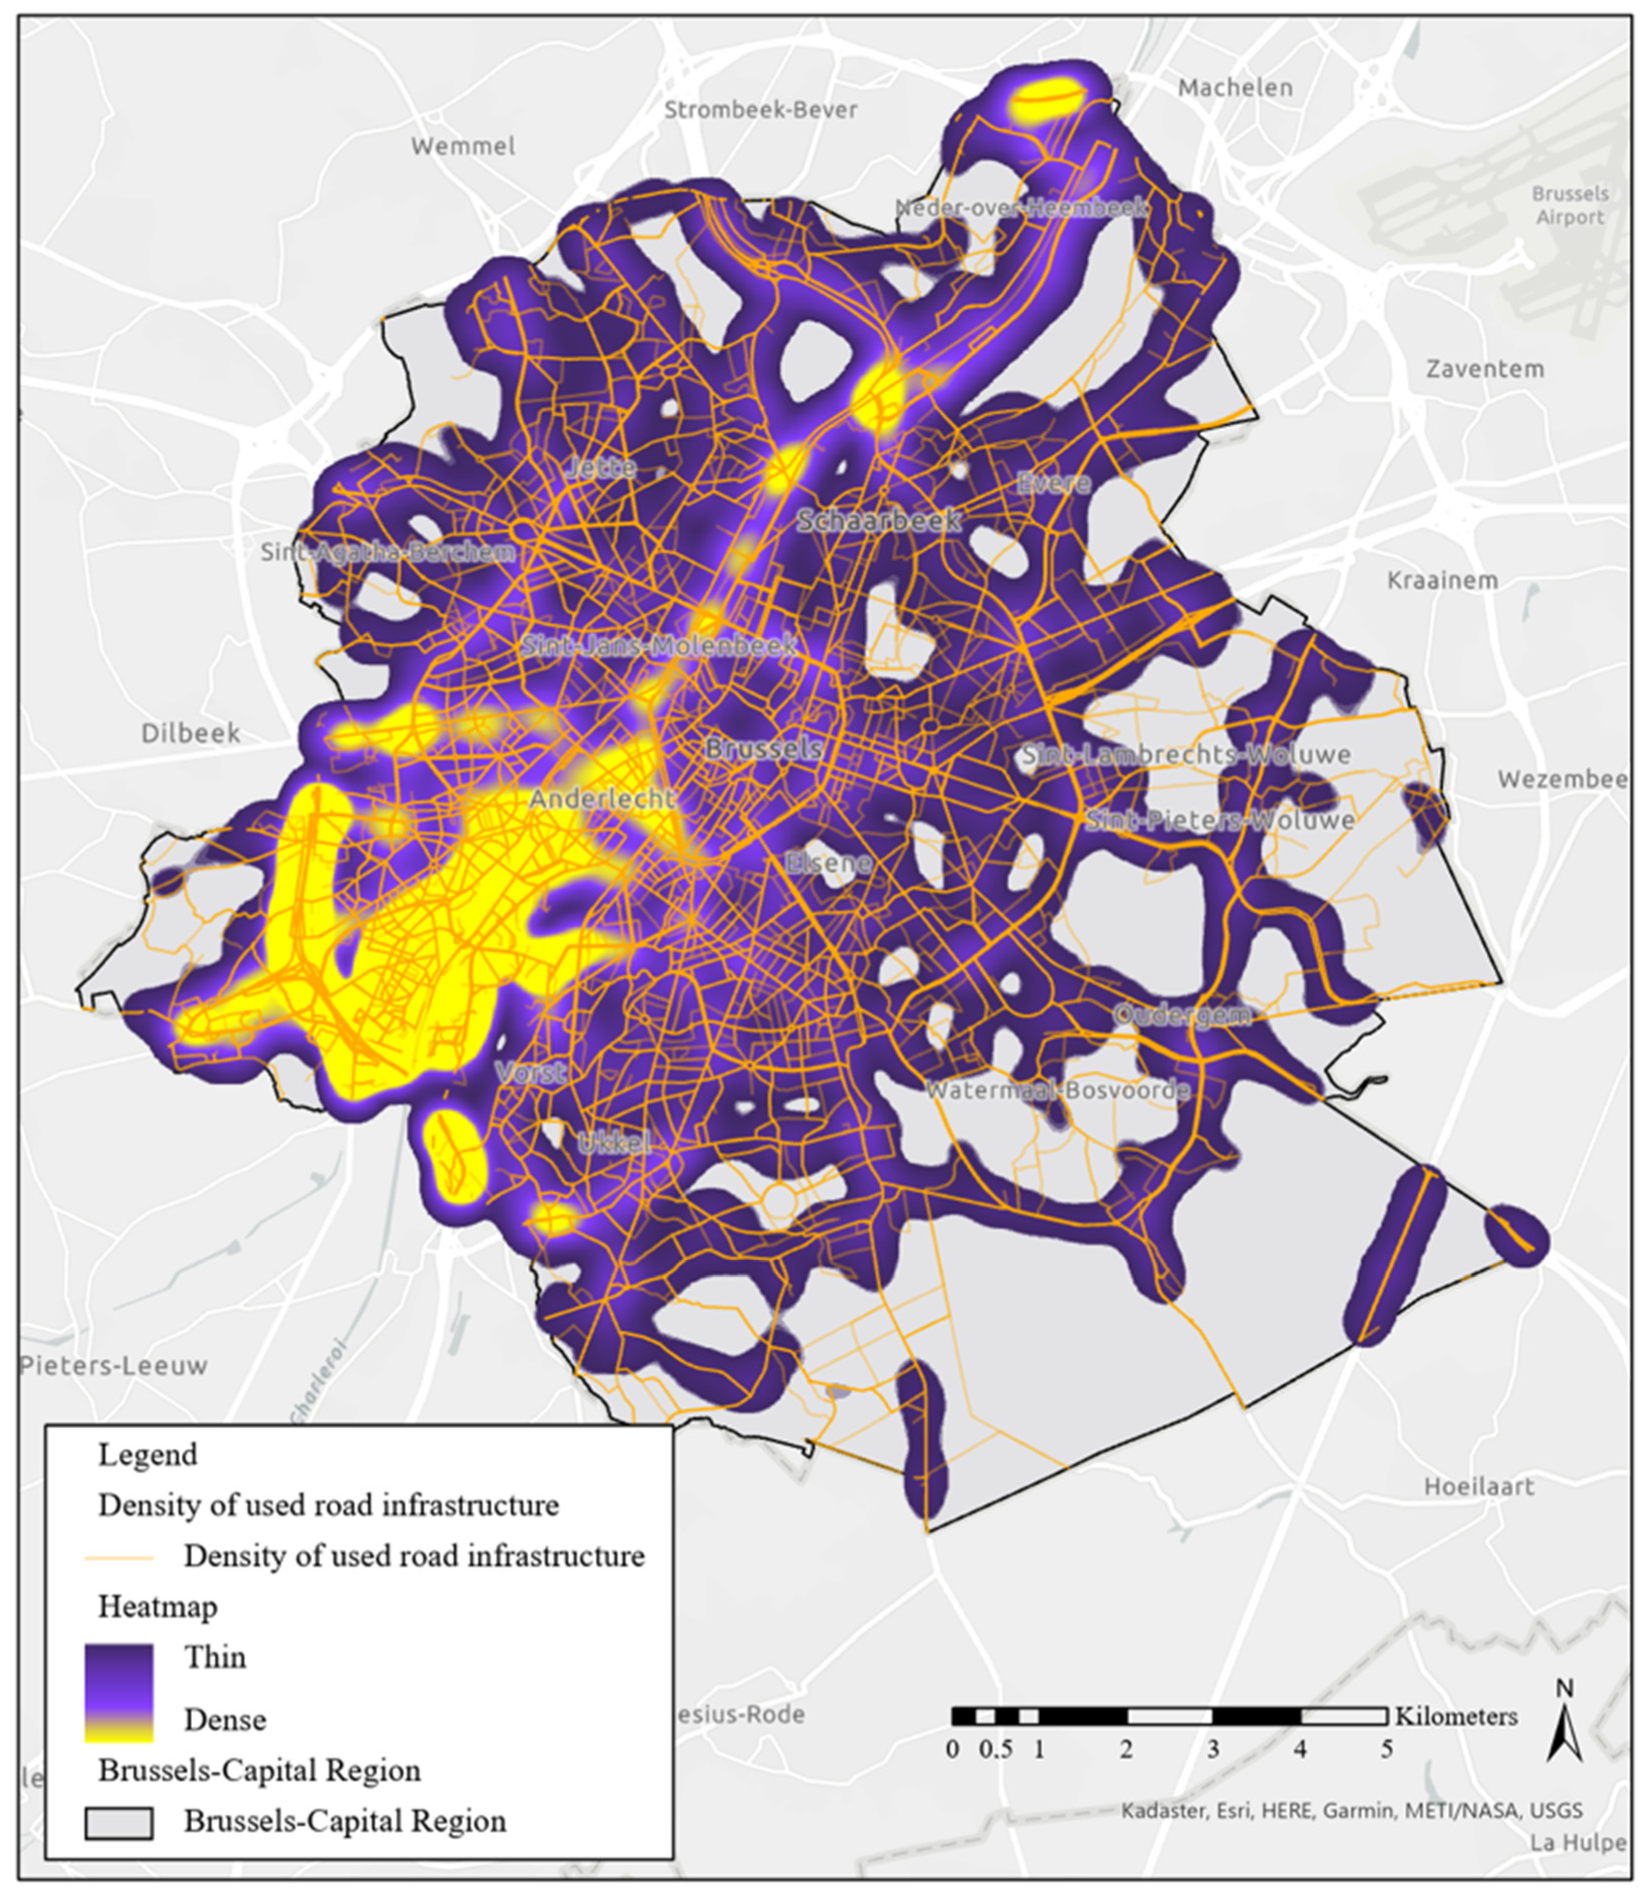
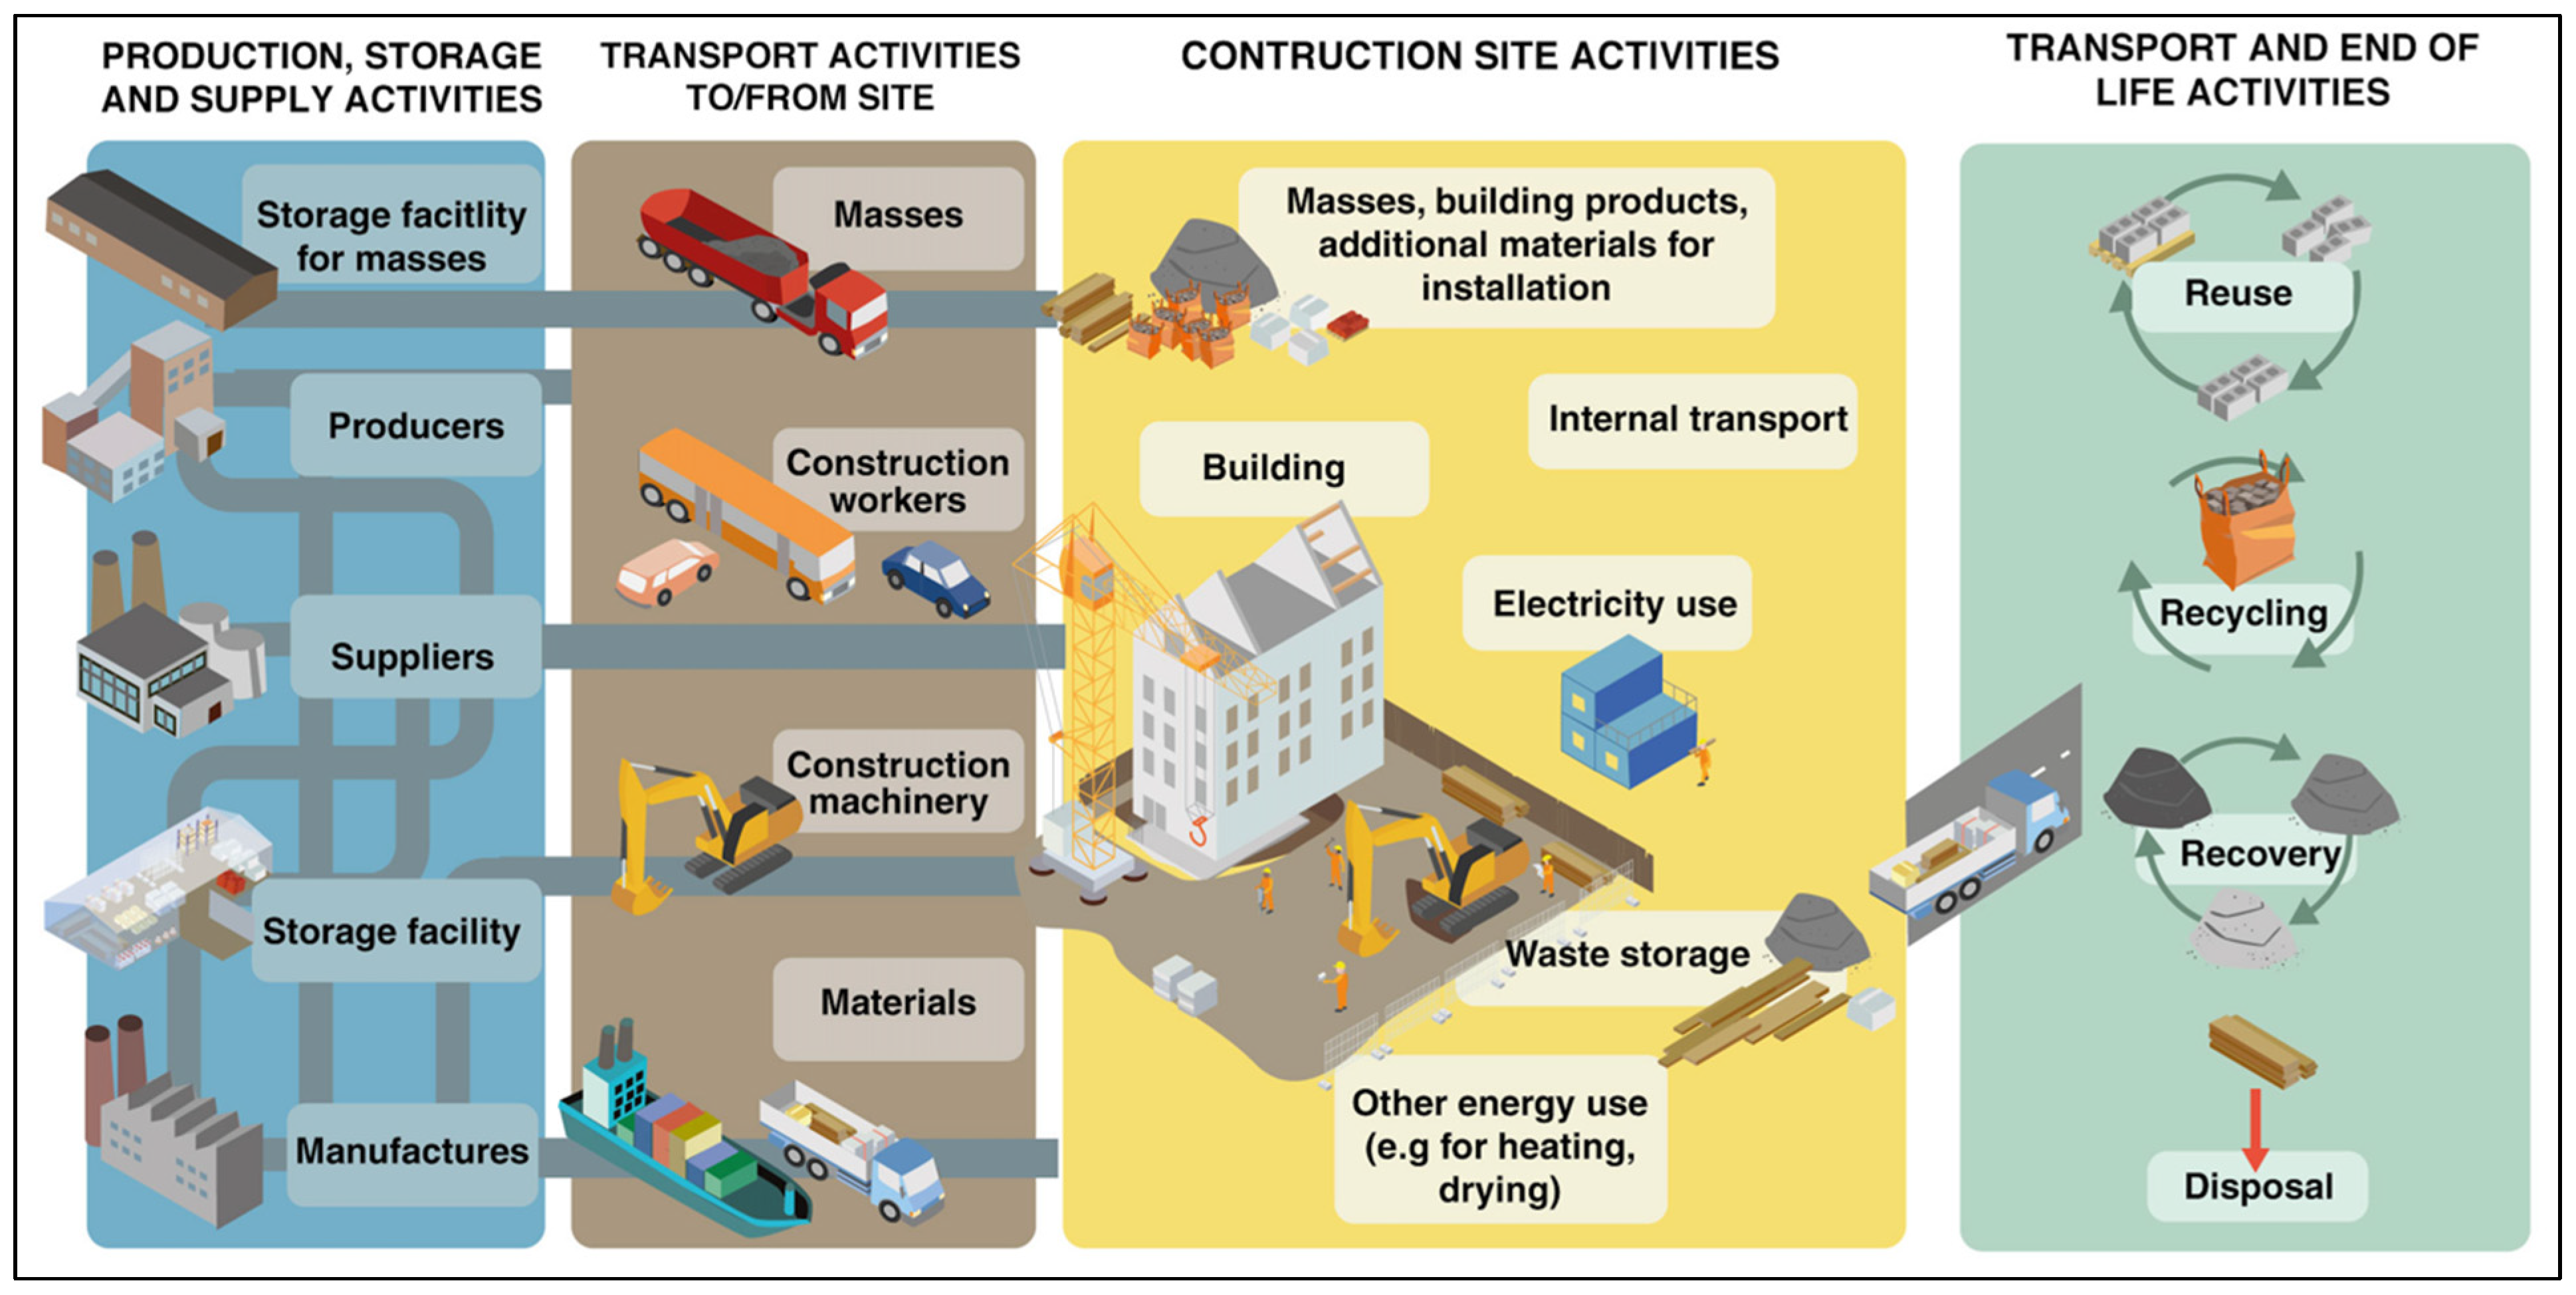
3.1. Case Study Description and System Boundaries

The considered pilot case in this paper is the City Campus construction site located in the Brussels-Capital Region (BCR). The project will ultimately result in a 17,600 m2 SME park for agri-food companies and social and student residences. The City Campus was selected in this paper as it was a demonstration case in the MIMIC project with access to relevant background data used for the analysis. Furthermore, this case was chosen as it is representative of large construction sites in the BCR, in terms of transport accessibility, material and volume requirements, local population density and the wide variety of vicinal stakeholders [21]. The construction site is promoted by a public–private collaboration between Brussels Mobility, the Brussels City Development agency (CityDev) and main building contractor, Van Roey Vastgoed. The area where the site is located has a population density of 6394.34 inhabitants/km2 and a total population of 108,940 inhabitants. The site is located within the Brussels Outer Ring (R0), offering a variety of relevant and potential transport accessibility entries and exits: the area is in proximity of major road axes such as the R0 ring of Brussels and the E19 highway, as well as the main navigable inland waterway axes of the Brussels-Charleroi Canal and the Willebroekse Vaart. The neighbourhood offers a rich diversity in vicinal stakeholders, including a shopping centre, a higher-education college and various local businesses. The construction traffic has a dedicated entrance and exits through the site, through which the vehicles can unload materials in an on-site delivery way.
As shown in Figure 2, the CL activities are divided into two main parts: (1) the transport of materials, mass, waste, machineries and workers to and from the construction site (referred to as “off-site CL activities”); and (2) operation of construction machineries, storage and installation of material; use of auxiliary/temporary installations; and materials and waste flows within the construction site (referred to as “on-site CL activities”). In this study, road and inland waterway transport modes were considered, covering off-site CL for (1) the transport of materials, (2) the transport of machinery and (3) the transport of waste to and from the site. The construction of workers was not included in this analysis. Geographically, the scope of the transport activities to and from the site was defined within the boundaries of the territory of Belgium, with a focus on the BCR. The entire life cycle was considered, including the production, the operation or transport usage and the end-of-life part.

3.2. Transport Data

Construction-related transport data were captured using on-board units (OBUs) for the duration of one year, from 1 November 2020 to 31 October 2021. The OBUs, GPS trackers, are mandatory for heavy goods vehicles (HGVs) with a maximal authorised mass superior to 3.5 tonnes driving in or through the Belgian territory, and were initially implemented in 2016 as part of the kilometre charge for this segment on the entire Belgian road network [30]. This forms a strong dataset because information is collected on both the trip level and the vehicle characteristics, as the kilometre tax is differentiated based on, amongst others, the distance travelled and how environmentally friendly the vehicle is. The traffic situation was based on assumptions based on data from Vlaams Verkeerscentrum [31], TomTom [32] and the Federal Planning Bureau [33] and was subdivided into 4 traffic scenarios: free flow (47.527%), over capacity (9.473%), congested (29.000%) and near capacity (14.000%). The trip information contains geometric data accurate on 30” intervals, for which an algorithm was developed to filter unique vehicles delivering to sites and deriving their origin–destination routes through their GPS string and GIS processing using ArcGIS Pro [34], resulting in travelled vehicle-kilometres (vkm) of the trip. Additionally, the road and environment type were derived by means of GIS processing [34]. On the vehicle level, OBUs directly capture information on the transport mode, its capacity (MAM), the vehicle’s propulsion type, its consumption (emission standard) and speed. The loading rate was based on EU averages differentiated on the trip’s used vehicle type and capacity [15]. As light commercial vehicles (LCVs) were not used as part of the implemented use case (except for the transport of workers, which is considered out of scope), no data were collected or analysed for this vehicle segment. Logistics data for alternative transport modes, i.e., inland waterway transport, were collected ad hoc during the implementation of the pilot case.

3.3. Scenarios

Next, a scenario evaluation was conducted, for which 4 alternative scenarios were calculated against a baseline scenario (business-as-usual, BAU), which are represented in Table 2. The scenarios were developed based on the CL goals as formulated in the “Good Move” mobility and logistics plan for the BCR [23]. These were then further detailed using a top-down approach in consultation with the above-mentioned partners, including financially viable options for the construction company (such as the implementation of a temporary water-bound consolidation hub for building materials in vicinity of the construction site and the available vehicle technology on the market [35,36]. The BAU scenario considers CL operations as they were during the period of analysis, i.e., the site being supplied primarily by HGVs, with dedicated inland waterway transport flows between May and August 2020 through the water-bound construction hub. Scenario 1 (increased material deliveries by barge transport) simulates the effect of delivering 37.26% of the total material volume compared to BAU by means of inland waterway transport in the same nearby construction hub used in the BAU scenario (2.1 vkm via road to the site). This represents the share of materials used in the construction of over 30 construction sites in Brussels, sourced via the Brussels Construction Consolidation Centre. This forms a realistic proxy for the share of materials that can easily be transported via inland waterways (with a material manufacturer located near navigable waterways and accessible (un) loading cargo type) [37]. The remaining transport flows are organised BAU. Last mile delivery from the hub (2.1 vkm) is organised using 34 t EURO 6 HGVs, which are the most common for BCR construction deliveries from the OBU dataset. Scenario 2 is based on Scenario 1 (37.26% IWT), with the exception that only tank-to-wheel zero-emission propulsion technologies are allowed for the last mile road delivery. This resonates with the ambition of Brussels of becoming a zero-emission zone (ZEZ) for transport, where road freight transport is organised by battery electric, hydrogen or hybrid vehicles [23]. IWT and rail are still allowed to travel with thermal engines. Finally, Scenario 3 starts from BAU and envisions the concrete delivery to the City Campus construction site to be operated by electric concrete trucks using the same concrete supplier as in BAU, located 1.3 vkm from the site. This scenario is in line with the envisioned ZEZ in Brussels, and assumes companies starting to invest in construction-specific zero-emission vehicles. The considered electric concrete trucks have a payload of 10 m3 (instead of the conventional 14 m3 on diesel) and a driving range of 150 km [35,36].

3.4. ECC and LCA Methodologies: Environmental Performance

ECC and LCA methods follow a life cycle perspective and cover two aspects of sustainability, namely, economic and environmental dimensions [14,26]. As these environmental nuisances are not included in the market price of transport activities, the polluter is not held financially responsible [38]. The ECC method therefore analyses the environmental damage costs and includes the monetarised effects of environmental and social impacts which are not directly covered by suppliers, producers, consumers or the government [39,40]. This can be measured for all considered transport modes (road, rail, inland waterway, maritime and aviation transport). The life cycle perspective includes both the direct (e.g., from the transportation itself) and the indirect (e.g., from production of the vehicle and fuel consumed during the transport usage) environmental impacts.
The LCA method uses GHG emission, in CO2-eq., and energy use, in cumulative energy demand, indicators to analyse the environmental performance of on-site and off-site construction logistic activities [38]. However, the ECC method evaluates the costs related to climate change, congestion, accidents, noise, air pollution, loss of habitat and well-to-tank. Both methodologies, with their respective scope, are thus complementary and necessary to gain a holistic view of the environmental and economic impact generated by construction logistic activities. For transport of materials, machinery and waste, both methods utilise the transport distance and vehicle characteristics as the main calculation variables. Table 1 summarises the scope and data used by the ECC and LCA methods.

4. Use Case Analysis and Results

The framework presented in the previous section was then deployed on a use case in the Brussels-Capital Region, which is explained in this section.

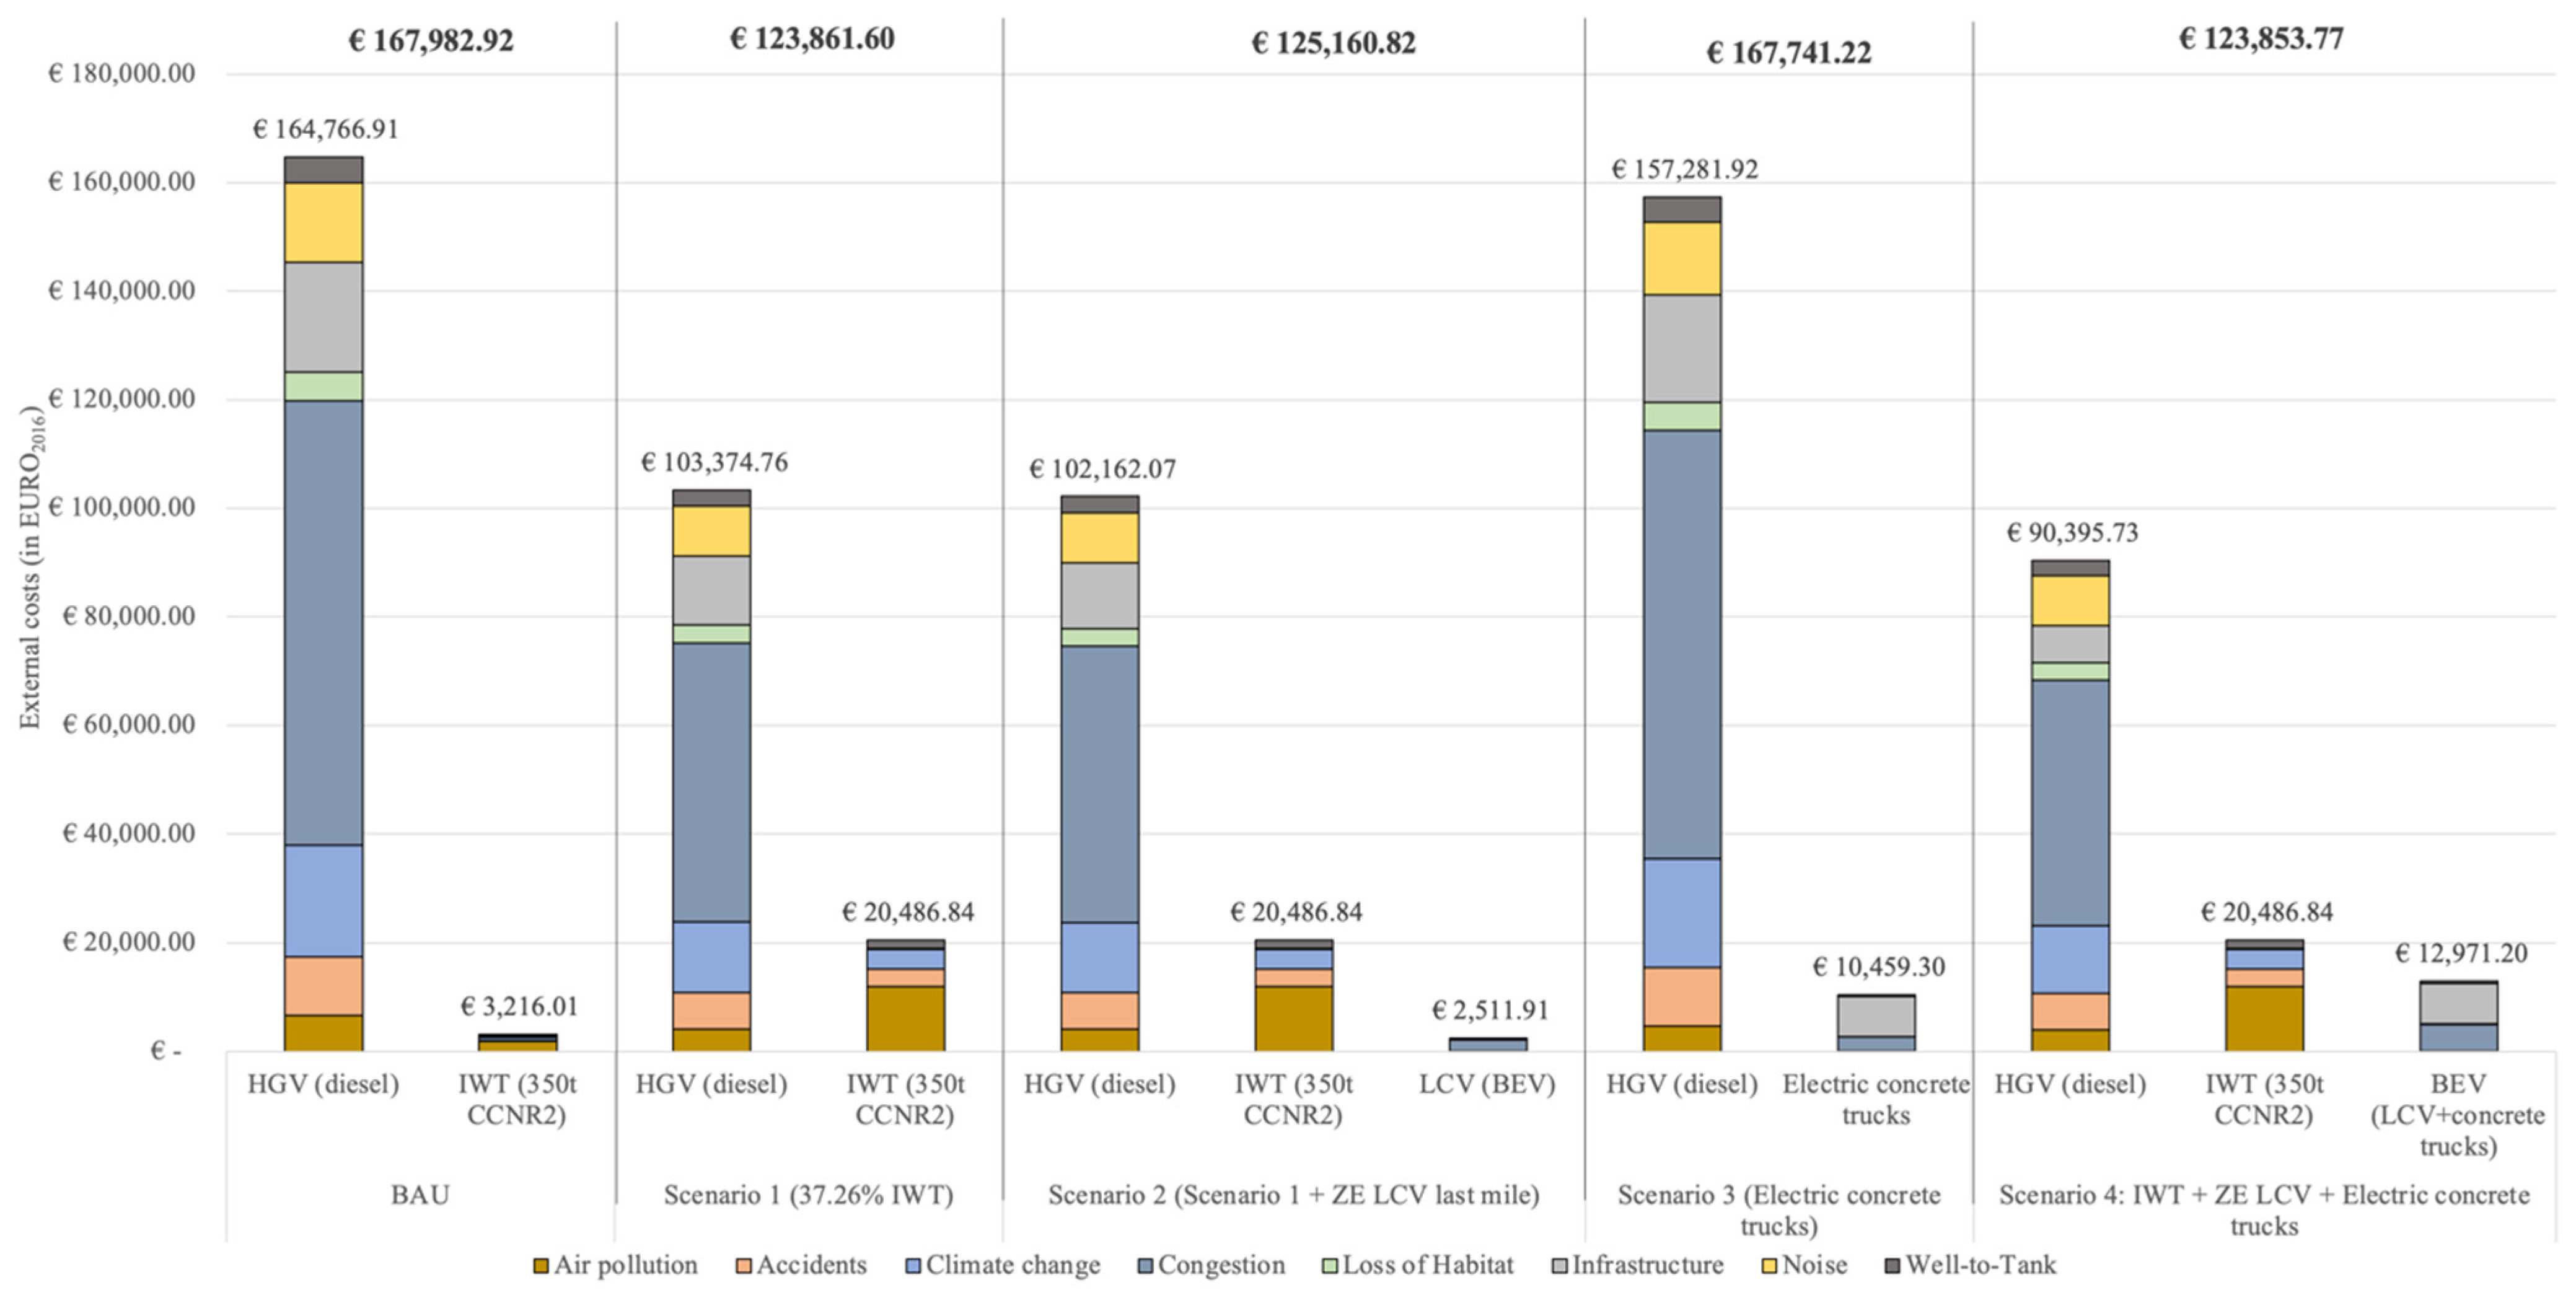
4.1. Impact Assessment Results

Figure 3 shows the month-over-month external costs and measured vehicle-kilometres generated by transport movement to and from the City Campus construction site in the BCR. The sparklines represent the measured vehicle-kilometres, subdivided in IWT (blue), urban road (red), suburban or rural road (yellow) and total (green) vkm per month. Analogically, the chart columns represent the engendered external costs per month with the same colour coding. February, April and May show subnormal production figures due to bad weather, which translates to a lower than usual number of deliveries. In addition, April and May were hit by a lockdown period in Belgium and Brussels, which implicated (1) the partial shutdown of construction activities and (2) the consideration and unavailability of foreign workers returning to Belgium respecting the mandatory quarantine period of 2 weeks. The month of July reflects the construction holiday period, a period of 3 weeks during which the construction sector is collectively and simultaneously inactive to optimise holiday schedules in the sector [41,42]. The months of March, July and September reflect large deliveries of concrete and reinforced steel for the foundation and superstructure of the building. Additionally, in September, approximately 3500 m3 of concrete, 97 t of steel (four heavy truck-trailers), 120 t of insulation materials (six 20 t truck-trailers), windows, roof and sealing were delivered to site. August and September show the transition from structural work (superstructure) to the sealing (wall, windows, roof, insulation) construction phases of the site. The construction also provisioned an internal material stock stored on-site for later months to compensate for strong material price increases in the market, explaining the lower volumes transported to the site in October 2021.
Following a stakeholder workshop on sustainable CL organised in November 2020 as part of the same MIMIC project [21], the construction firm, city development agency (and promotor of the pilot construction site) and the Port of Brussels sat together to identify possibilities to supply the site by means of alternative transport modes. This culminated in the implementation and trial of a water-bound construction hub located on the south end of the Brussels Canal Region, 2.1 km from the City Campus site. The construction hub supplied three large construction sites of the same construction firm in the same area, and remained active between May and August 2021. Each month, approximately 150 t of materials (mainly prefabricated composite beams for an equivalent of six 25 t trucks per month) for the City Campus site were delivered by barge to the construction hub, where they were transported by HDV for the last mile to site. Although reductions in external costs were noticeable, the construction hub was closed due to (1) too high processing, rental and transport costs (even with JIT benefit), which are typically borne by subcontractors, and (2) the additional risk of damage due to trans-shipment and theft (especially given the material price inflation) in the supply chain.
The densest material delivery paths to the City Campus site are found in the city’s quarter in and around the municipality of Anderlecht. However, the results show that a large part of the Brussels-Capital Region (BCR) bears the consequence of transport movements to this construction site, which has consequences for the traffic and road network as a whole. The heatmap represented in Figure 4 highlights that next to all roads in the BCR have been used (orange), and heavily used on the yellow and purple axes. The results show that the impact of this individual construction site is not limited to its own surface and immediate surroundings, but also the wider transport network (the Brussels Ring (R0), the E19 highway infrastructure and the road network along the canal region with the presence of construction material suppliers) and the city as a whole, as depicted by Fredriksson et al. [27].

4.2. Scenario Evaluation

The results in Table 3 and Figure 5 show that further use of a construction hub with deliveries (Scenario 1) reduces total external costs by 26.27% compared to BAU. This reduction is mainly realised by a reduction in congestion costs (−37.26%) due to fewer trucks on the road network infrastructure, and the use of otherwise unused inland waterway infrastructure for the majority of travelled vehicle-kilometres to site. Large reductions are also reflected in climate change costs (−21.85%), infrastructure costs (−37.58%) and noise nuisances (−37.26%). While the setup of using this water-bound hub is beneficial across the entire analysis, it needs to be noted that the impact of air pollution is higher than in BAU (+87.79%), which comes forward due to a lag in modern vessel engines and their outdated emission standards in the sector.
When the water-bound hub is coupled with zero-emission (battery-electric) LCVs to operate the last mile (Scenario 2), results show that overall external costs moderately increase compared to Scenario 1 (+1,04%). Although the zero-emission last mile delivery shows promising results in terms of air pollution, climate change and noise costs (important in an urban setting), their cumulative reduction is offset by increased congestion costs. As long as electric HGVs are not ubiquitous, zero-emission transport is likely organised by LCVs with a smaller capacity, leading to more vehicle-kilometres and associated costs in terms of time and congestion in an urban setting.
Scenario 3 comes to a similar conclusion—as electric concrete trucks have a slightly lower capacity (from 14 to 10 m3 compared to the conventional diesel concrete truck), the cost of the extra travelled vkm is also reflected in higher congestion costs compared to BAU. However, the emission reduction potential is higher, leading to an overall decrease —although limited—in external costs.
From the last considered scenario, it is shown that a combination of measures will be needed to achieve more sustainable off-site CL. Scenario 4 presents the combination in which 37,26% of the material volume was shipped over water and zero-emission vans stood in for the last mile delivery (cfr. Scenario 2), and all concrete was transported with electric concrete trucks (Cfr. Scenario 3).
Conclusively, off-site zero-emission construction vehicles are the way forward if cities want to achieve zero-emission logistics by 2035. However, we must consider market readiness to provide for vehicles with a sufficiently large transport capacity (size). Otherwise, the positive effects on air pollution, climate change and noise risk being offset by extra saturation of the road transport network and its associated congestion and infrastructure damage costs.

5. Conclusions and Limitations

In this paper, we present a sustainability assessment framework for the environmental impact assessment of both on-site and off-site CL. The framework is developed based on life cycle approaches and covers four main iterative steps: (1) goal and scope definition, (2) data identification and availability, (3) scenario and setup evaluation and (4) environmental performance of scenarios.
The developed framework is in line with challenges faced in the CL sector and (1) is flexible enough to cope with specific and detailed local constraints, whilst generic enough to allow comparability across the national demonstration cases and ultimately throughout urban CL; (2) can accommodate different scenario and setup scopes, up-scalable to the project or city size and needs, based on relevant key performance indicators (inherent to ECC and LCA methodologies); and (3) takes into consideration the data availability issue in the sector.
Specifically for the Brussels-Capital Region, the framework enables us to simulate and gain insights in various (future) CLS. Striking is the interplay between the path to decarbonisation and zero-emission transport activities, and the heavy burden on the road transport network if zero-emission heavy goods vehicles are not ubiquitous in the following decade. Hence, the readiness of the economic, manufacturing and infrastructure market should be taken into consideration to achieve zero-emission urban CL logistics. Otherwise, the positive effects on mainly air pollution, climate change and noise risk being offset by extra saturation of the road transport network and its associated congestion and infrastructure damage costs.
The presented use case implementation in this paper covers the main transport movements and activities. However, further research can be conducted to cover additional transport modes (e.g., cargo bike deliveries, which were not present in this case) and transport activities (such as the transportation of workers or detailed usage of on-site machinery). Although this case study is founded on robust and next to exhaustive calculation variables (vehicle-kilometres, road and environment type linked to detailed vehicle characteristics), OBUs do not capture the vehicle’s loading rate. Therefore, future research could try to solve for this assumption.

Author Contributions

Data curation, N.B. and K.M.; Methodology, N.B. and K.M.; Supervision, K.M.; Validation, K.M.; Visualisation, N.B.; Writing—original draft, N.B.; Writing—review and editing, N.B., S.M.F. and K.M. All authors have read and agreed to the published version of the manuscript.

Funding

This research is part of the MIMIC project (number 438.15.403) under the JPI Urban Europe research programme. The project receives funding from the European Union; the Brussels-Capital Region—Innoviris; the Swedish Governmental Agency for Innovation Systems (Vinnova); the Austrian Federal Ministry for Transport, Innovation and Technology (BMVIT) in the framework of the research programme “Stadt der Zukunft”; the Austrian Federal Ministry of Science, Research and Economy (BMWFW); and The Research Council of Norway.

Acknowledgments

The authors thank the implementation partners Van Roey Vastgoed, CityDev Brussels and Brussels Mobility for participating in this study and providing data used in this study, as well as Jackie Forzelius for the illustrations of Figure 1 and Figure 2.

Conflicts of Interest

The authors declare no conflict of interest.

References

  1. FIEC. Key Figures 2019: Construction Activity in Europe. Sustainability Report. 2020. Available online: https://www.aldi-nord.de/en/sustainability-report/2019/key-figures-2019.html (accessed on 30 March 2022).
  2. Lundesjö, G. Supply Chain Management and Logistics in Construction: Delivering Tomorrow’s Built Environment; Kogan Page Publishers: London, UK, 2015. [Google Scholar]
  3. Scholman, H.S.A. Uitbesteding Door Hoofdaannemers. In Subcontracting by Main Contractors; Economissch Instituut voor de Bouwnijverheid: Amsterdam, The Netherlands, 1997. [Google Scholar]
  4. Lindén, S.; Josephson, P.-E. In-housing or out-sourcing on-site materials handling in housing? J. Eng. Des. Technol. 2013, 11, 90–106. [Google Scholar] [CrossRef]
  5. Van Lier, T.; Macharis, C. Assessment Framework: Demonstrations and Assessment of Progress and Results; CIVIC: Gothenburg, Sweden, 2016. [Google Scholar]
  6. VIL. Bouwlogistiek. 2020. Available online: https://vil.be/project/bouwlogistiek/ (accessed on 30 March 2022).
  7. Fredriksson, A.; Janné, M.; Rudberg, M. Characterizing third-party logistics setups in the context of construction. Int. J. Phys. Distrib. Logist. Manag. 2021, 51, 325–349. [Google Scholar] [CrossRef]
  8. Dubois, A.; Hulthén, K.; Sundquist, V. Organising logistics and transport activities in construction. Int. J. Logist. Manag. 2019, 30, 620–640. [Google Scholar] [CrossRef]
  9. Wegelius-Lehtonen, T. Performance measurement in construction logistics. Int. J. Prod. Econ. 2001, 69, 107–116. [Google Scholar] [CrossRef]
  10. RazaviAlavi, S.; AbouRizk, S. Construction Site Layout Planning Using a Simulation-Based Decision Support Tool. Logistics 2021, 5, 65. [Google Scholar] [CrossRef]
  11. Wibowo, M.A.; Handayani, N.U.; Mustikasari, A.; Wardani, S.A.; Tjahjono, B. Reverse Logistics Performance Indicators for the Construction Sector: A Building Project Case. Sustainability 2022, 14, 963. [Google Scholar] [CrossRef]
  12. Wijewickrama MK, C.S.; Rameezdeen, R.; Ochoa, J.J.; Chileshe, N. Minimizing macro-level uncertainties for quality assurance in reverse logistics supply chains of demolition waste. Sustainability 2021, 13, 13069. [Google Scholar] [CrossRef]
  13. Studer, W.P.; De Brito Mello, L.C.B. Core Elements Underlying Supply Chain Management in the Construction Industry: A Systematic Literature Review. Buildings 2021, 11, 569. [Google Scholar] [CrossRef]
  14. Brusselaers, N.; Mommens, K.; Janné, M.; Fredriksson, A.; Venås, C.; Flyen, C.; Mommens, K.; Macharis, C. Economic, social and environmental impact assessment for off-site construction logistics: The data availability issue. IOP Conf. Ser. Earth Environ. Sci. 2020, 588, 32030. [Google Scholar] [CrossRef]
  15. van Essen, H.; van Wijngaarden, L.; Schroten, A.; Sutter, D.; Bieler, C.; Maffii, S.; Brambilla, M.; Fiorello, D.; Fermi, F.; Parolin, R.; et al. Handbook on the External Costs of Transport, Version 2019; CE Delft: Delft, The Netherlands, 2019. [Google Scholar] [CrossRef]
  16. Fredriksson, A.; Nolz, P.C.; Seragiotto, C. A mixed method evaluation of economic and environmental considerations in construction transport planning: The case of Ostlänken. Sustain. Cities Soc. 2021, 69, 102840. [Google Scholar] [CrossRef]
  17. Ghanem, M.; Hamzeh, F.; Seppänen, O.; Zankoul, E. A new perspective of construction logistics and production control: An exploratory study. In Proceedings of the 26th Annual Conference of the International Group for Lean Construction (IGLC 26), Chennai, India, 16–22 July 2018; Gonzalez, V.A., Ed.; International Group for Lean Construction (IGLC): Edmonton, AB, Canada, 2018; pp. 992–1001. [Google Scholar]
  18. Bellona Europa. Norwegian Cities Lead the Way in Reaching Zero-Emissions in Construction Sites. 2021. Bellona.org. Available online: https://bellona.org/news/climate-change/2021-03-norwegian-cities-lead-the-way-in-reaching-zero-emissions-in-construction-sites (accessed on 13 May 2021).
  19. Venås, C.; Flyen, C.; Fufa, S.M.; Janné, M.; Fredriksson, A.; Brusselaers, N.; Mommens, K.; Macharis, C. No or low emissions from construction logistics Just a dream or future reality? IOP Conf. Ser. Earth Environ. Sci. 2020, 588, 42003. [Google Scholar] [CrossRef]
  20. Fufa, S.M.; Wiik, M.K.; Mellegard, S.; Andresen, I. Lessons learnt from the design and construction strategies of two Norwegian low emission construction sites. IOP Conf. Ser. Earth Environ. Sci. 2019, 352, 012021. [Google Scholar] [CrossRef]
  21. Brusselaers, N.; Mommens, K.; Macharis, C. Building Bridges: A Participatory Stakeholder Framework for Sustainable Urban Construction Logistics. Sustainability 2021, 13, 2678. [Google Scholar] [CrossRef]
  22. Janné, M.; Fredriksson, A. Construction logistics governing guidelines in urban development projects. Constr. Innov. 2019, 19, 89–109. [Google Scholar] [CrossRef] [Green Version]
  23. Brussels Mobility. Good Move—Gewestelijk Mobiliteitsplan 2020–2030: Strategisch En Operationeel Plan. 2020. Available online: https://goodmove.brussels/nl/gewestelijk-mobiliteitsplan/ (accessed on 30 March 2022).
  24. MIMIC. About MIMIC, MIMIC. 2018. Available online: https://www.mimic-project.eu/en/about-mimic (accessed on 26 December 2021).
  25. Janné, M.; Fredriksson, A.; Billger, M.; Brusselaers, N.; Fufa, S.; Al Fahel, R.; Mommens, K. Smart Construction Logistics Governance—A systems view of construction logistics in urban development. In Proceedings of the 57th ISOCARP World Planning Congress, Doha, Qatar, 8–11 November 2021. [Google Scholar]
  26. Brusselaers, N.; Fufa, S.M. MIMIC Deliverable 2.2: Evaluation of the Construction Logistics Impact Assessment Framework. 2021. Available online: https://www.mimic-project.eu/sites/default/files/content/resource/files/20211213_d2.2_evaluation_of_the_application_of_impact_assessment_framework_of_construction_logistics_final.pdf (accessed on 30 March 2022).
  27. Fredriksson, A.; Flyen, C.; Fufa, S.M.; Venås, C.; Hulthén, K.; Brusselears, N.; Mommens, K.; Macharis, C. MIMIC Deliverable 1.1: Scenarios of Construction Logistics. 2020. Available online: https://www.mimic-project.eu/sites/default/files/content/resource/files/delivarable_1.1_final_1.pdf (accessed on 30 March 2022).
  28. van Lier, T. The Development of An External Cost Calculator Framework for Evaluating the Sustainability of Transport Solutions; Vrije Universiteit Brussel: Brussels, Belgium, 2014. [Google Scholar]
  29. Macharis, C. The importance of stakeholder analysis in freight transport. Q. J. Transp. Law Econ. Eng. 2005, 8, 114–126. [Google Scholar]
  30. ViaPass. ViaPass kilometer charge for HGVs of +3,5t tons since April 1st 2016. 2021. Available online: https://www.viapass.be/en/ (accessed on 30 March 2022).
  31. Vlaams Verkeerscentrum. Verkeersindicatoren. 2021. Available online: http://indicatoren.verkeerscentrum.be/vc.indicators.web.gui/indicator/index# (accessed on 30 March 2022).
  32. TomTom. Traffic Index Belgium. 2021. Available online: https://www.tomtom.com/en_gb/traffic-index/belgium-country-traffic (accessed on 30 March 2022).
  33. Federaal Planbureau. Aantal Voertuigkilometer Afgelegd Per Gewest, Wegtype En Voertuigcategorie Op Het Belgisch Grondgebied—Miljoen Voertuigkilometer (Ttbe_Tf_Rd_Km). 2017. Available online: https://www.plan.be/databases/PVarModal.php?lang=nl&VC=TTBE_TF_RD_KM&DB=TRANSP (accessed on 30 March 2022).
  34. Esri. ArcGIS, Pro 2.8; Esri HQ: Redlands, CA, USA, 2022. [Google Scholar]
  35. WTCB. Vrachtwagen Met Betonmixer Op Gas of Elektriciteit in Plaats Van Op Diesel. 2021. Available online: https://www.wtcb.be/nieuws/vrachtwagen-met-betonmixer-op-gas-of-elektriciteit-in-plaats-van-op-diesel/ (accessed on 30 March 2022).
  36. Volvo Trucks. Groundbreaking Collaboration to Accelerate Green Transport of Concrete. 2022. Available online: https://www.volvotrucks.com/en-en/news-stories/press-releases/2022/feb/volvo-trucks-groundbreaking-collaboration.html (accessed on 30 March 2022).
  37. Fredriksson, A.; Janné, M.; Fufa, S.M.; Venås, C.; Brusselaers, N. MIMIC Deliverable 1.2: Application of scenarios of construction logistics. 2021, pp. 1–23. Available online: https://www.mimic-project.eu/sites/default/files/content/resource/files/d1.2_application_of_scenarios_of_construction_logistics.pdf (accessed on 30 March 2022).
  38. ICCT. CO2 Emissions and Fuel Consumption Standards for Heavy-Duty Vehicles in the European Union. 2018. The ICCT Briefing Paper. Available online: https://www.theicct.org/publications/co2-emissions-and-fuel-consumption-standards-heavy-duty-vehicles-european-union (accessed on 30 March 2022).
  39. SPP Regions. Life Cycle Costing State of the Art Report. 2018. Available online: https://sppregions.eu/fileadmin/user_upload/Life_Cycle_Costing_SoA_Report.pdf (accessed on 30 March 2022).
  40. Rebitzer, G.; Hunkeler, D. Life Cycle Costing in LCM: Ambitions, opportunities, and limitations. Int. J. LCA 2003, 8, 253–256. [Google Scholar] [CrossRef]
  41. Bouwunie. 88% Van Bouwbedrijven Heeft Collectieve Vakantiesluiting En Dat Heeft Zo Zijn Voordelen. 2018. Available online: https://www.bouwunie.be/nl/news/bouwverlof-zomer2018 (accessed on 30 March 2022).
  42. Bouwverlof België. Bouwverlof per Regio. 2021. Available online: www.bouwverlof.com (accessed on 30 March 2022).
Figure 1. Off-site and on-site CL impact assessment framework [26].
Sustainability 14 08573 g001
Figure 2. System boundaries for physical activities [26].
Sustainability 14 08573 g002
Figure 3. Total external costs and vehicle-kilometres per month for business-as-usual scenario.
Sustainability 14 08573 g003
Figure 4. Heatmap of transport trips to and from the City Campus construction site.
Sustainability 14 08573 g004
Figure 5. External cost scenario evaluation for the Brussels pilot construction site.
Sustainability 14 08573 g005
Table 1. Scope and data used by the ECC and LCA methodologies [26].
External Cost Calculations (ECC)Life Cycle Assessment (LCA)
Damage costs or impact categoriesAll major transport-related externalities:
  • Air pollution (all regulated and important non-regulated air pollutants in g/pollutant and monetary values)
  • Climate change (in g/pollutant and monetary values)
  • Congestion (monetary)
  • Noise pollution (monetary)
  • Accidents (monetary)
  • Loss of habitat costs (monetary)
  • Well-to-tank costs (monetary)
Impact categories for LCA:
  • Climate change (GHG emissions in kg CO2-equivalent)
  • Resource use
Primary energy use (MJ)
Non-renewable energy use (MJ)
Renewable energy use (MJ)
Logistics activities (scope/physical system boundaries)Transport activities (all transport modes off-site: cargo bike, road, IWT, rail, maritime, air):
  • Transport of materials to and from the construction site
  • Transport of machinery to and from the site
  • Transport of waste
On-site and off-site logistics activities (road):
  • Transport on-site and off-site of building materials
  • Transport of construction machinery
  • Transport of waste (incl. packaging)
  • Transport of construction workers
  • Temporary work (production and transport)
Life cycle stages for logistics activities and geographical representativenessOff-site CL across all transport modes (cargo bike, road, IWT, rail, maritime, air):
  • IWT, hinterland and urban (or last mile) freight transport flows
  • (Inter)national and regional/local geographical level
The scope is clearly defined on the transport operation or vehicle usage part. Manufacturing and end-of-life are not considered.
Entire life cycle of on-site and off-site logistics activities, including:
  • Production of machinery, vehicles, temporary installations etc.
  • Operation of these (mainly energy use)
  • End-of-life of these
Geographical representativeness: international and regional/local geographical levels.
Granularity and differentiation of calculation variables (life cycle inventory)Calculation variables:
  • Origin–Destination (vkm/tkm): OD/route (GPS), road type, environment type (or receptor densities);
  • Time of the day
  • Traffic situation
  • Vehicle characteristics: transport mode, vehicle capacity, vehicle propulsion type, vehicle consumption (emission class), vehicle speed (link/segment), cargo type, loading rate
Type of data for life cycle inventory:
  • Vehicle and machinery type
  • Number of trips/distance;
  • Transport distance
  • Amount of fuel (or energy consumption)
  • Duration on site (e.g., vehicle, electricity)
  • Amount and type of products, temporary work/equipment (e.g., kg of fence, # of barracks)
  • Type and amount of waste
Table 2. Considered scenarios for the scenario evaluation of the demonstration case.
ScenarioDefinition
0. Business-As-Usual (BAU)Baseline scenario which considers construction operations as they have been operated during the period of analysis.
1. Increased material deliveries by barge (IWT)Scenario simulating the effect of delivering 37.26% of the total material volume compared to BAU by means of inland waterway transport in the same nearby construction hub used in the BAU scenario. Last mile delivery from the hub is organised using HGVs.
2. Zero-emission last mile deliveryScenario based on Scenario 1, with the exception that only zero-emission propulsion technologies are allowed or the last mile road delivery from the water-bound hub.
3. Electric concrete trucksScenario based on BAU, envisioning the concrete delivery to the City Campus construction site to be operated by electric concrete trucks using the same concrete supplier as in BAU.
4. Combination of measures (Sc.2 + 3)Scenario in which 37.26% of the material volume was shipped over water, zero-emission vans stood in for the last mile delivery and all concrete was transported with electric concrete trucks.
Table 3. Monetary impact of externalities for the considered scenarios (external costs expressed in EUR2016).
BAUScenario 1 (37.26% IWT)Scenario 2 (Scenario 1 + ZE LCV Last Mile)Scenario 3 (Electric Concrete Trucks)Scenario 4: IWT + ZE LCV + Electric Concrete Trucks
HGV (diesel)IWT (350 t CCNR2)HGV (diesel)IWT (350 t CCNR2)HGV (diesel)IWT (350 t CCNR2)LCV (BEV)HGV (diesel)Electric concrete trucksHGV (diesel)IWT (350 t CCNR2)BEV (LCV + concrete trucks)
Air pollution6646.921960.304170.2711,993.134162.5722,993.133.174756.944.534087.8622,993.137.71
Accidents10,780.59100.126763.743206.676755.753206.6773.8010,703.09108.456678.263206.67182.25
Climate change20,539.91592.9612,886.743627.7012,842.093627.700.0019,949.680.0012,408.803627.700.00
Congestion81,870.650.0051,365.640.0050,783.650.002158.7178,933.762603.4545,136.740.004762.16
Loss of habitat5192.99171.573258.0854.953249.3654.9533.195108.33118.493164.6954.95151.68
Infrastructure20,241.37131.4212,699.4315.8712,154.7115.8783.6819,911.367396.806869.4415.877480.48
Noise14,710.880.009229.610.009224.990.000.0013,272.610.009180.160.000.00
Well-to-tank4783.60259.643001.231588.512988.951588.51159.364646.14227.562869.771588.51386.92
SUM167,982.92123,861.60125,160.82167,741.22123,853.77
Publisher’s Note: MDPI stays neutral with regard to jurisdictional claims in published maps and institutional affiliations.

