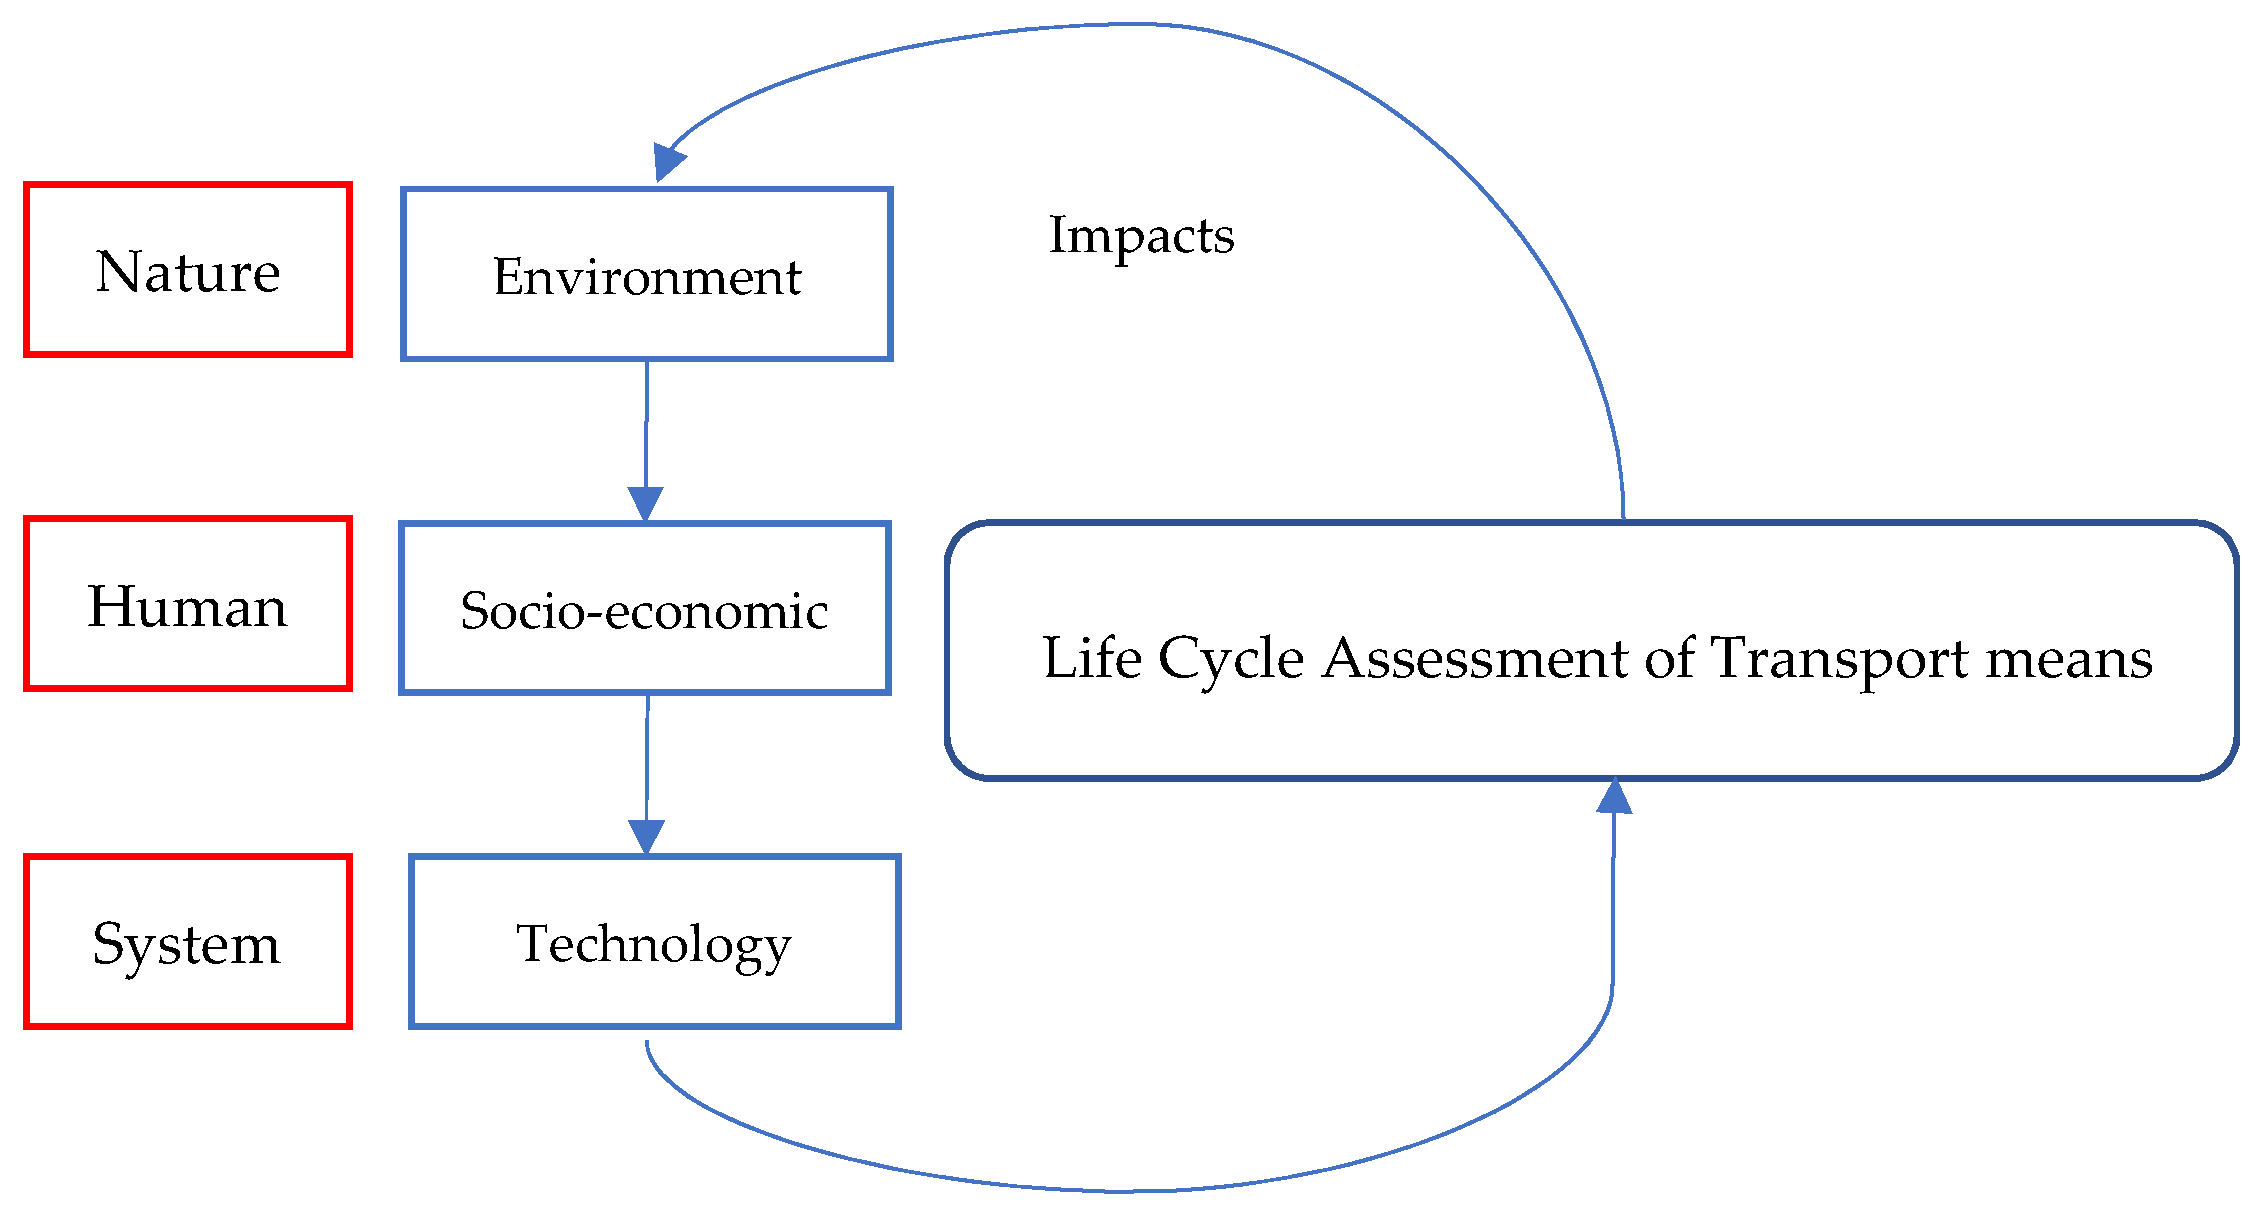
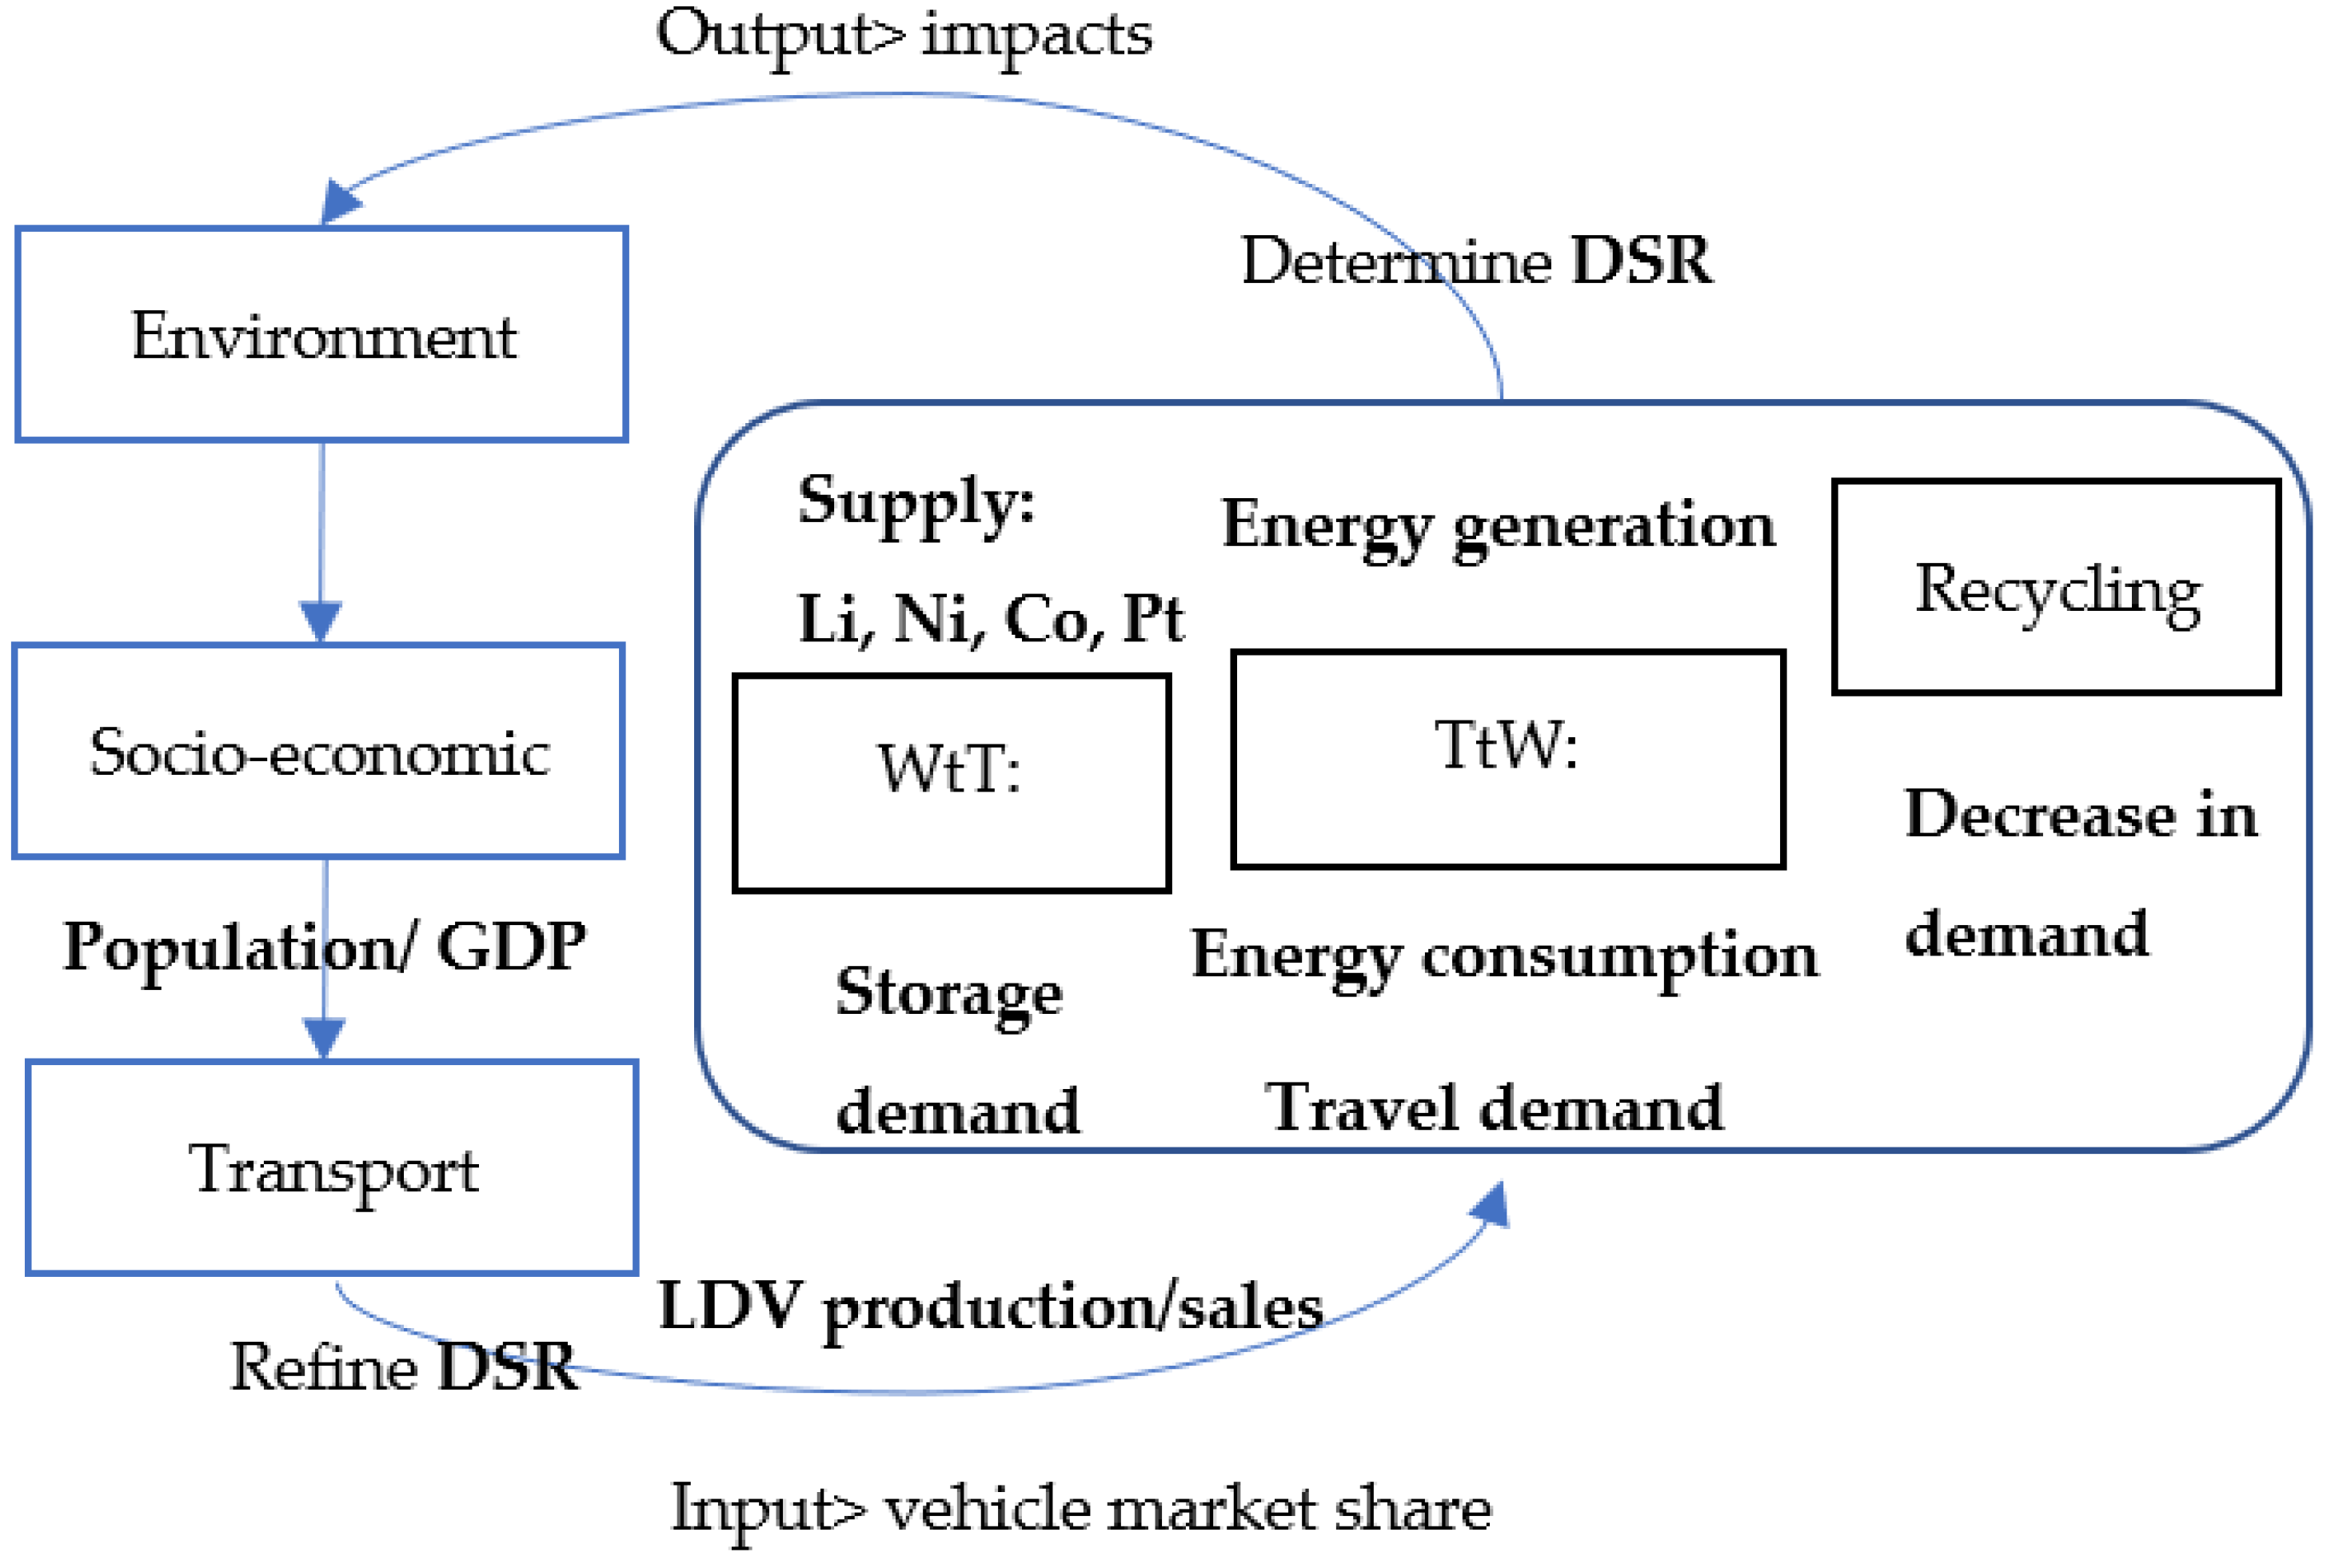
Article

Impact of the Light-Duty Vehicles’ Storage and Travel Demand on the Sustainable Exploitation of Available Resources and Air Pollution Abatement

by
Mihai Machedon-Pisu
* and
Paul Nicolae Borza
Department of Electronics and Computers, Transilvania University of Brașov, B-dul Eroilor Nr. 29, 500036 Brașov, Romania
*
Author to whom correspondence should be addressed.
Sustainability 2022, 14(14), 8571; https://doi.org/10.3390/su14148571
Submission received: 12 June 2022 / Revised: 5 July 2022 / Accepted: 9 July 2022 / Published: 13 July 2022
(This article belongs to the Special Issue Sustainability of Transport Infrastructures)

Abstract

:
Light-duty vehicles are the predominant means of road transport. As the world population is expected to increase significantly in the following decades, so too will the car fleet. Due to the rising population, and the implicitly higher travel demand, the energy demand of cars will increase too, and this will put a strain on current resources, with negative effects on the supply chain, possibly leading to more pollution. Many of the current sustainable transport models and frameworks attempt to predict the vehicle market share for different powertrains and the resulting impact based on scenarios that cater to the automotive market and industry demands. At the same time, most neglect aspects regarding resources’ depletion and storage demand. In this sense, this study proposes a coherent testing methodology based on the ratio between demand and supply in order to address the limitations of these studies, mainly related to the sustainable exploitation of available resources, which are analyzed herein in correlation with the current predictions. A sensitivity analysis is provided in order to evaluate the uncertainty of utilized predictions. As a result of this analysis, two novel scenarios for assessing the evolution of the vehicle market share are proposed by the authors. When compared to similar scenarios, it was shown that the proposed scenarios lead to noticeable benefits in reducing dependency on the resources associated with a demand of energy and raw materials and in mitigating air pollution, including related costs.

1. Introduction

Transport activities play an important part in the evolution of our society, assuring the mobility of people and goods [1]. In terms of market, environmental, and human health impacts [2], as well as society’s travel needs [1,2], light-duty vehicles (LDV) are the leading road transport means when compared to other transport means (more than 80% of the total fleet), such as buses (that exceed 3.5 tons) and heavy-duty vehicles (HDV), e.g., trucks [3]. The sustainability of transport activities is mainly modulated by two factors: (a) the technological and scientific evolution in the automotive domain [4,5]; (b) the improvement of the legislative frame followed by the implementation of appropriate policies [6]. In the case of LDVs, the evolution of the powertrain is relevant, starting from internal combustion engine vehicles (ICEVs) to hybrid vehicles such as hybrid electric vehicles (HEVs) and plug-in hybrid electric vehicles (PHEVs) to battery (all) electric vehicles (BEVs) and to fuel cell vehicles (FCVs) [4,5]. Each type of powertrain requires the improvement of specific components [5]. For example, in the case of electric and hybrid vehicles, energy storage (such as batteries) or generators (such as fuel cells) are essential to achieve high performance [4]. More recently, the development and improvement of autonomous vehicles [7] increased efficiency and safety in operation.
On the one hand, the technological progress is closely related to the evolution of the structure of transport systems and is extensively treated in [4]. On the other, one must take also into account the impact of the LDVs’ powertrain evolution on the demand for energy and raw materials in order to address the challenges imposed by the energy transition in [8]. This refers to energy generation including fossil fuels, renewables, and electromechanical sources (in BEVs and FCVs). The on-board energy efficiency, storage capacitance, and type of the LDV’s energy converter also play an important role in this sense, as depicted in [9]. Incorporated raw materials can be recovered to a certain degree by recycling and reintroduced in a new industrial cycle, which is a desideratum of circular economy [10]. Starting from the vehicle’s production to its end of life cycle, which covers the stages included in a life cycle assessment (LCA)-based analysis, as in [11,12], various studies have assessed the impact of the LDV powertrain related to air pollution [12,13] and the supply chain [14]. As highlighted in [8], the decarbonization of the energy sector can be obtained by opting for renewable energy sources (RESs), as shown in [15].
Many of these considerations are found in the different frameworks and models proposed for sustainable transport in [12,14,16,17,18,19,20,21,22,23,24,25,26,27]. Dedicated to the decarbonization of the energy sector, the energy–economy simulation models in [16,17,18,19,20] are based on user demand and air pollution abatement, mainly greenhouse gas (GHG) emissions, as detailed in [28,29]. Similar to [16,17,18,19,20,21], they offer no distinction between the different LDV powertrains when analyzing the various facets of sustainability. However, then, the environmental, economic, and energy impacts of different LDV powertrains are depicted in [12,14,22,23,24,25,26,27]. Based on various scenarios, the evolution of the vehicle market share for LDV powertrains (ICEVs, HEVs, PHEVs, HEVs, and FCVs) is predicted for all types in [14,23,27] until 2050 and beyond in [24].
Table 1 synthesizes the mentioned sustainable transport studies in terms of data on energy (generation and consumption) including fuels (petroleum, hydrogen), raw materials (supply and demand), storage (battery type and capacity), and on vehicle market share (evolution in time). As seen in Table 1, the main omissions of these studies refer to LDVs’ storage characteristics and required raw materials.
Figure 1 offers an image of sustainability which both synthesizes the main characteristics depicted in Table 1 and reflects the methodology to be described in the next chapters.
The paper is structured as follows. The introduction in Section 1 evokes the main LDV powertrain characteristics required in order to analyze the impacts of various sustainable transport models and frameworks mostly related to the exploitation of resources for covering the travel and storage demands and to the decarbonization of the energy sector (GHG emissions).
As a result of this analysis, the paper shortly defines a simplified sustainability framework which represents the basis for the methodology to be presented in the next sections. In Section 2, Materials, an overview of the evolution of LDV sales and production is portraited in correlation with the population and GDP evolutions until 2020, as well as electricity and fuel resources. Future predictions on LDVs’ production and travel demand are correlated also with the GDP and population evolution predictions from 2020 to 2050. Based on the LCA analysis, this overview is addressed also in the context of storage demand, which includes both the current battery technologies (mostly based on lithium, nickel, and cobalt) and the new batteries to be implemented (only lithium-based), as well as the decrease in the demand for materials important when recycling, as will be assessed in the next section. Section 3, Methods, includes the proposed methodology used in order to determine the demand over supply ratios (DSRs) for the scenarios proposed in [12,14,16,17,18,19,20,21,22,23,24,25,26,27], including two novel scenarios proposed herein. The new scenarios proposed in this section are based on a balanced DSR. In Section 4, Results, the most sustainable transport scenarios in terms of DSR that forecast the LDVs’ market share evolution are analyzed in terms of the dependency on resources related to energy and raw materials and air pollution abatement. The results are discussed in the final section, Discussion, which highlights the main findings of this study. The uncertainty of the utilized predictions in Section 2 and Section 3, which present strong correlations between GDP, population, travel demand, and LDV sales and production evolutions, is also assessed in the final section based on a sensitivity analysis of the projection parameters and their extrapolation.

2. Materials

Based on various reports [30,31,32,33,34], Figure 2 highlights the evolution of population [30], gross domestic product (GDP) [31], and LDV production [32] and sales [33,34] in the last 15–20 years. As seen in Figure 2b, the LDVs’ sales and production have a similar slope and show an almost ideal correlation for the study interval. When compared to Figure 2a, correlations can be also found between the evolution in LDVs’ production and sales and the evolution of population and GDP.
Various predictions for population [35,36,37,38,39,40,41,42] and GDP [36,37,43,44,45,46,47,48,49] by 2050 can be compared to the estimated evolution of LDVs’ production, depicted in Table 2 and Figure 3, based on three evolution scenarios.
Figure 3 displays only the prediction formulas for LN (natural logarithm). In Table 3 only LN and EXP (exponential) evolutions are considered since the Linear one is similar in values to LN. Other types of extrapolations, such as spline, e.g., a third or fourth order polynomial, were also tested; however, they present a poor correlation with the population and GDP predictions [35,36,37,38,39,40,41,42,43,44,45,46,47,48,49] in most cases. The degree of correlation (%) between the LN and EXP predictions in Table 2 and population and GDP predictions is depicted in Table 3. Various studies that predict the evolution of LDVs’ production and sales [14,23,24,25,27] confirm the feasibility of the adapted predictions shown in Table 2 for the low-demand scenario in [14], for the base and alternative cases in [24], and for the scenarios in [27].
The high demand scenarios in [14] and low stock scenarios in [25] are neglected due to overrated (high) and, respectively, underrated (low) estimated values, which are in contradiction with the population- and GDP-predicted evolutions. The extreme cases that do not match the reasonable assumptions are observed in Table 3 for the low valued predictions in [35] and for [36]. They are also displayed in Figure 4 and Figure 5, which forecast the GDP and population evolutions from 2020 to 2050.
Based on the LCA procedure, as shown in [11,12,13], three main parts (which represent together the whole life cycle) can be identified as Well to Tank (WtT), Tank to Wheel (TtW), and End of Life Cycle (EoL), which include the stages of extraction, manufacturing and assembly (related to WtT or production), and energy generation and distribution (between WtT and TtW), consumption (related to TtW or operation), and recycling (related to EoL). In the production cycle, the main resource indicators are steel, aluminum (Al), lithium (Li), cobalt (Co), nickel (Ni), and platinum (Pt), as presented in [24]. Other materials must be mentioned too, such as iron (Fe), manganese (Mn), copper (Cu), and phosphorous (P) [50]. Due to the high impact on the supply chain, only Li, Co, Ni, and Pt resources will be selected for analysis in the initial cycle, as presented in [14]. Figure 6 is based on the United States Geological Studies (USGS) reports that forecast the identified resources and reserves that are available per year [51].
The vehicle’s storage demand is crucial in determining how much of the identified resources or reserves to exploit, and this refers to the vehicle’s battery type and capacity. Table 4 synthesizes the storage demand per battery type. Since not all resources can be utilized in the production of LDVs, it is also essential to estimate how much of these resources can be allocated. Both aspects were treated in [14], and in the case of allocated resources, the following considerations were made herein: 40% of the total Li resources, 50% of the total Co resources, 10% of the total Ni resources, and 40% of the total Pt resources can be allocated to the production of LDVs.
By recycling, more resources will be available for manufacturing LDVs in the future, as will be presented at the end of this section, for the final cycle (EoL).
If, in the production cycle, the storage demand dictates the use of materials for producing the required car components, in the operation cycle, the travel demand must be determined in order to find out how many energy resources are necessary to cover the travel mission. Various predictions for the travel demand have been assessed in [52,53,54,55,56,57,58,59,60]. Figure 7 displays the estimated evolution of travel demand in Passenger km (Pkm) related to LDVs until 2050.
The correlations between these predictions and the population, GDP, car production, and sales predictions are synthesized in Table 5. As seen in Table 5, the predictions in [58,59] offer both reasonable degrees of correlation.
To satisfy the travel demand, the main energy resources, which are needed refer to gasoline reserves and their exploitation in order to fuel ICEVs, HEVs, and some PHEVs and the electricity required for charging PHEVs and BEVs, especially by using RESs, which can lead to the decarbonization of the energy sector [8].
Figure 8 presents the evolution of gasoline reserves in liters gasoline equivalent (LGE) [61] and their exploitation in terms of petroleum production and consumption, also in LGE [5,62,63]. Since not all the gasoline can be used for fueling LDVs [64,65,66], the estimated gasoline use in cars is assumed at 30%, according to the Baseline predictions in [14]. Based on the same predictions, the evolution of oil consumption per car (ICEV/HEV) is expected to drop from an average of 7 LGE/100 km in 2020 to 4 LGE/100 km in 2050, with a decrement of 1 LGE/100 km per decade.
When charging EVs, renewables (RESs) should come as the first option. The quantity of energy that was available until 2018 is depicted in Figure 9.
Based on estimations that reach the year 2050, as presented in the scenarios in [14], solar- and wind-based RESs could increase even by 15–20 times to 40,000 TWh. Table 6 highlights these estimations.
The energy demand is directly related to the energy intensity. According to the Baseline scenario in [14], it is estimated at around 20 kWh/100 km in 2020, at 16 kWh/100 km by 2030, at 14 kWh/100 km by 2040, and at 12.5 kWh/100 km by 2050 [67].
The final cycle, which refers to the recycling of car components, can be synthesized in Table 7 when it comes to the raw materials with the most impact on the supply chain, namely, Li, Co, Ni, Pt, as presented in [68].

3. Methods

The evolution of the battery capacity for storage-based LDVs: HEV, PHEV, BEV, and FCV is depicted in Figure 10 according to the estimations, predictions, and assumptions in [27,69,70,71,72,73,74,75,76,77,78,79,80,81]. Based on the data in Figure 10, the formulas that forecast BEVs’ and PHEVs’ battery capacity evolutions follow an extrapolation function similar to LN in Figure 3.
Just as important in defining the storage demand as the battery capacity is the adoption rate of the EV’s battery chemistry. According to [82], and based on [14] for an optimum ratio between NMC and NCA chemistries, Table 8 highlights the main lithium-based battery technologies that were the most adopted and predicted to be adopted for EVs in the following years.
Starting from the LDVs’ storage and travel demand, plus the decrease in demand of materials, and by taking into account the available resources associated with the production (WtT), operation (TtW), and end of the life cycle of LDVs, it is possible to establish the methodology in Figure 11 which aims to balance the demand over supply ratio (DSR) for various resources available throughout an LDV’s whole life cycle.
Based on the data in Figure 10, two main scenarios can be formulated for LDV’s battery capacity evolution up to 2050 in Table 9: business as usual (BAU), based on tempered storage demand, and natural logarithm-based (LN) predictions.
The primary inputs for the test methodology addressed in Figure 11, and the vehicle market shares are synthesized in Table 10.
Table 11 presents the demand in raw materials sensitive to exploitation (in kg of Ni, Li, and Co and g of Pt per vehicle) for the different LDV powertrains depending on the battery chemistry demand (kg/kWh) data in Table 4 on the scenario type: 72% NMC— 28% NCA, 100% Li-Air, and 100% NMC, based on Table 8, and on capacity evolution scenarios (kWh) BAU and LN in Table 9.
Based on two travel demand scenarios [58] for high demand (WCS) and [59] for low demand (BCS)—, in Figure 7, expressed in Pkm, and by taking into account the estimated consumption in LGE/km, the demand is determined in LGE in Table 12 for the years 2020, 2030, and 2050. Moreover, based on the high and low travel demands, Table 12 includes the available RES solar and wind energy demand in TWh in 2050 if an overall energy intensity of 0.15625 kWh/km is considered, according to the Baseline scenario in [67]. Table 13 synthesizes the available resources for two cases: WCS (low supply) and BCS (high supply) required for battery storage and fueling/charging the vehicle based on low-use scenarios in [14], which considers 0.1 (10%) for Ni, 0.4 (40%) for Li, 0.5 (50%) for Co, and 0.4 (40%) for Pt resources, to which recycling adds more by material recovery, as seen in Table 7.
In the case of gasoline and RES resources, the use ratio considered for conventional vehicles (ICEVs/HEVs) is 0.3 (30%) and, respectively, 0.3 (30%) for EVs (PHEVs/BEVs).
Based on the data from Table 9, Table 10, Table 11, Table 12 and Table 13, the following formulas are used in order to determine the demand over supply ratios (DSRs) for LN-WCS (high demand/low supply) and BAU-BCS (low demand/high supply) scenarios, where i = 1:5 in the sum ∑ for the 5 LDV powertrains, and the sum ∑year covers the period 2020–2050:
DSR_WCS = ∑year (∑ market sharei × high demandi)/Total low supply,
DSR_BCS = ∑year (∑ market sharei × low demandi)/Total high supply,
It must be mentioned that, in the case of gasoline resources, in formulas (1) and (2), the Total low supply equals the Total high supply, as seen in Table 13, while, for RES only, the high demand case (WCS) is considered. For simplicity, the sum of ICEVs’ and HEVs’ market shares is considered altogether in calculations for gasoline resources, and the sum of PHEVs’ and BEVs’ market shares is the same for RES resources. Based on this, the maximum vehicle market share of EVs (PHEVs and BEVs) that can be charged in WCS (high demand) in 2050 with the available energy (low supply) is around 50.33%.
Table 14 provides the DSR determinations based on the formulas for all scenarios.
As observed in Table 14, most scenarios either exceed the 90–100% range for DSR in WCS or have a very low value of DSR, below 30–40%, in cases mostly related to BCS. While it is unlikely to obtain a one size fits all scenario, which can stay, for example, within the 50–80% range, scenarios with more balanced DSR values can be formulated, such as the two novel scenarios presented in Table 15 together with the calculated DSR values in Table 16.
The two scenarios presented in Table 15 reflect two main battery chemistry evolutions from 2030 to 2050. The first, I Li-Air implies a full transition to Li-Air batteries, which puts the least strain on the supply chain. In the absence of Li-Air battery market penetration, II NMC-NCA proposes an optimum ratio between the two battery chemistries (72% for NMC; 28% for NCA) in terms of least impact on the Ni and Li supply chains. While the first scenario does not consider any restrictions on the Pt dependence of FCVs (46 g Pt per vehicle), the second assumes no Pt is present in FCVs (almost 0 g Pt per vehicle).

4. Results

Figure 12 synthesizes the average DSR values for Li, Ni, Co, and gasoline resources, which represents an average between BCS and WCS values, for the new scenarios: I Li-Air and II NMC-NCA, presented in Table 15, and for S-PHEV [23], Base [25], HER and LER scenarios for NMC and Li-Air in [14], and the Baseline scenario in [27], presented in Table 10. It also includes the DSR values for Pt and RES resources in WCS.
Figure 12 highlights the balanced DSR of the new scenarios, I Li-Air and II No-Pt, except for the case in which Pt will still be used when manufacturing FCVs. It must be mentioned that, in Figure 12f, for the II No-Pt scenario, the value is around 0 if Pt will not be used for FCVs. The value considered is in accordance with the other scenarios which follow the current assumption of a 46 g Pt demand per FCV. Only if the demand in Pt will decrease to 10–20 g per vehicle will the DSR value be acceptable for the II No-Pt scenario. Table 17 assesses the impact on the environment [13,70,71,72,77,83,84,85,86,87,88,89,90] and, implicitly, on health, including pollution abatement costs [91], and provides the LDV demand profiles of the main operation resources, i.e., gasoline, electricity, and hydrogen [67,70,92].
In order to calculate the total GWP- and PAC-related impacts in Mt CO2e and Billion EUR- and GEH-related demands in Billion LGE, TWh, and Billion Liters of Hydrogen for the 2020–2050 period (2020, 2030, and 2050); the travel demand in Pkm is added to the formula below, where i = 1:5 in the sum ∑ for the five LDV powertrains, and the sum ∑ year covers the period 2020–2050:
Impact GWP/PAC or Demand GEH= ∑year [∑ market sharei × (GWP*i/PACi or GEHi)] × travel demandyear,
The travel demandyear is calculated as an average between the predicted values in [58] and [59], and is 22.241 trillion Pkm (TPkm) in 2020, 29.072 TPkm in 2030, and, respectively, 46.971 TPkm in 2050. Regarding the GWP calculations, the BEV clean* value in Table 17 is not considered in 2020 due to the lack of meaningful global RES penetration; while, in the 2030–2050 period, only BEV clean* values are considered instead of BEV values due to the reduced impact on GWP, associated with clean energy (solar and wind).
Figure 13 presents the total impacts related to GWP and PAC up to 2050 for the nine scenarios according to the predicted vehicle market share.
Figure 14, Figure 15 and Figure 16 present the total demand associated with the consumption of gasoline, electricity, and liters of hydrogen required for operating the different LDV powertrains.
By analyzing Figure 12, Figure 13, Figure 14, Figure 15 and Figure 16, it can be concluded that the new scenarios manage not only to balance the DSR in most cases, and thus put less strain on the supply chain, which is related to the available resources’ exploitation, but also can prove beneficial in mitigating air pollution, which is mostly related to GHG emissions.

5. Discussion

Due to the uncertain nature of predictions related to the extrapolation functions, which are based on current trends, such as the ones presented in Section 2 and in the beginning of Section 3, it is necessary to provide a sensitivity analysis that can assess the limitations of such projections. Table 18, Table 19, Table 20, Table 21 and Table 22 evoke the projection parameters considered and the type of extrapolations (linear or nonlinear, if known) that modulate the degree of uncertainty, as well as their range when compared to other predictions. The travel demand projections assumed in the methodology depicted in Section 3 are based on a strong correlation with projections that guarantee a 95% confidence interval. Regarding the storage demand projections (modulated by battery’s capacity and type), the confidence interval is 80–95% based on the correlations with travel demand and LDV sales. The correlations between GDP, population, and LDVs’ travel demand evolutions and LDV sales and production projections are assessed in Table 3 and Table 5. The best correlations were those that have shown an almost perfect linear relationship, such as the r coefficient reached values of +0.99 and +1 (+99% to +100% in tables).
In the actual context, of less resources to use for fueling cars, e.g., gasoline, supply chain issues, due to the COVID-19 pandemic, e.g., semiconductor chip shortage and rising prices of gasoline and electricity due to the war in Ukraine, it is more and more important to balance the LDVs’ increasing demand of materials and energy with the available resources that must satisfy related travel and storage demands. These can be associated with GDP, population, and emerging technologies’ impacts on LDVs’ market evolution. The sustainable evolution of the automotive market is reflected also in the air we breathe. Yet, aiming to transition to less polluting cars should be performed without causing disruptions to the supply chain, wherein Li, Ni, Co, Pt, gasoline, hydrogen, and RES resources are at risk of misconduct. One must tackle this issue, as predictions for the vehicle market share are all over the place in terms of market dominance, whether of conventional LDVs (ICE-based) [23,27], of full-electric vehicles (FEVs), mostly BEVs [23,25], or of FCVs [14,25], at the same time almost entirely neglecting the storage demand (battery chemistry and capacity) when predicting the future vehicle market share of various LDV powertrains.
In this study, the authors have assessed the impact of the most exploited resources available to LDVs in terms of storage and travel demands. The demand forecast was correlated with the GDP, population, and LDV sales and production for the 2020–2050 period. In order to evaluate the impact on the supply chain, a methodology based on DSR was proposed by the authors for achieving the sustainable exploitation of the resources mentioned above at each stage: WtT (production), TtW (operation), and EoL (recycling), according to an LCA-based analysis. The basis of this methodology is represented by the range defined by the BCS and WCS scenarios that cover the extreme cases of DSR: low demand/high supply (BCS) and high demand/low supply (WCS). Out of the twelve scenarios that forecast the vehicle market share in Table 10, for which the DSR methodology was applied, seven were selected for further analysis, since their DSR values have remained within acceptable bounds. Moreover, based on a balanced DSR, two novel scenarios were proposed herein. These scenarios refer to the future battery chemistry evolutions that can cause less strain on the Ni, Li, Co, and Pt supply chains I Li-Air and II No Pt (72% NMC, 28% NCA), as presented in Figure 12. In terms of air pollution abatement, which aims to decarbonize the energy sector [8], the new scenarios with balanced DSR presented benefits in mitigating GHG emissions (GWP) and reducing related costs (PAC) when compared to the seven selected scenarios, as seen in Figure 13. Moreover, in terms of gasoline, hydrogen, and RES (solar and wind) demand, Figure 14, Figure 15 and Figure 16 validate that the novel scenarios stay within acceptable limits.
Other aspects that are just as important when making the transition to EVs or FCVs, that were not discussed or detailed in this article, since they are beyond its scope, refer to social and psychological factors, environmental regulations and associated health impact, infrastructure investments and various vehicle costs, and technology transition impacts, to mention a few.
As the system complexity of the future vehicles is expected to increase, wireless sensor networks (WSNs), connected to the cloud, perhaps in a mesh configuration [93,94,95], will operate beside the Controller Area Network (CAN) bus, and maybe even replace it altogether in the not so far away future, since cables take up a lot of space and require a considerable amount of copper. Moreover, the large deployment of Internet of Things (IoT) and Vehicle to Everything (V2X) permits both the improvement of the extensive traffic management and security and paves the way for autonomous vehicles [96]. Since Industry 4.0 is already here, it is possible that these vehicles will penetrate the automotive market [7]. However, an important aspect that was highlighted in this paper, and that should always work in conjunction with such smart networks based on IoT, is the necessity to charge and store the energy in an effective way. The dependence on energy and raw materials, which was addressed herein, will become more and more demanding in the evolution of LDVs. The energetic challenge also refers to finding new energy management solutions that include the development of communication protocols. The parameters considered are related to the energy and power capabilities of vehicles. Strictly related to the storage of energy, new features such as intelligent power control will facilitate the implementation of heterogeneous solutions such as Hybrid Energy Storage Systems (HESS). Because no single storage device can perfectly fit the applications’ requirements, electric hybrid storage solutions were developed in [97,98]. This implies the use of, at minimum, two different storage cells or storage device-like supercapacitors, batteries, and fuel cells [99,100]. Such solutions will increase the overall lifespan of the vehicles’ energetic sources, improving not only the energy efficiency, but also allowing a more efficient usage of raw materials for developing the new transport means. Regarding the materials sensitive to exploitation, e.g., Li and Ni, it is possible that new battery chemistries such as NaS and LFP 4680 could reduce this dependence should they become technologically mature. The novel methodology proposed in this study can be adapted accordingly in this sense.
The authors consider that, when addressing the future challenges related to LDV powertrains’ adoption, both the demand and supply of energy and raw materials play an important role in defining their market penetration. In this regard, the improvement of on-board electric storage technologies will represent a genuine catalyzer for the new LDVs.

Author Contributions

Conceptualization, M.M.-P.; methodology, M.M.-P.; software, M.M.-P. and P.N.B.; validation, M.M.-P. and P.N.B.; formal analysis, M.M.-P. and P.N.B.; investigation, M.M.-P. and P.N.B.; resources, M.M.-P.; data curation, M.M.-P. and P.N.B.; writing—original draft preparation, M.M.-P. and P.N.B.; writing—review and editing, M.M.-P. and P.N.B.; visualization, M.M.-P. and P.N.B.; supervision, M.M.-P. and P.N.B.; project administration, M.M.-P. and P.N.B.; funding acquisition, M.M.-P. and P.N.B. All authors have read and agreed to the published version of the manuscript.

Funding

This research received no external funding.

Institutional Review Board Statement

Not applicable.

Informed Consent Statement

Not applicable.

Data Availability Statement

The data presented in this study are available on request from the corresponding author.

Conflicts of Interest

The authors declare no conflict of interest.

References

  1. Dostál, I.; Adamec, V. Transport and its Role in the Society. Trans. Transp. Sci. 2011, 4, 43–56. [Google Scholar] [CrossRef] [Green Version]
  2. International Energy Agency. Energy Technology Perspectives 2012: Pathways to a Clean Energy System; International Energy Agency: Paris, France, 2012. [Google Scholar]
  3. Ager-Wick Ellingsen, L.; Hung, C.R. Research for TRAN committee—Battery-powered electric vehicles: Market development and lifecycle emissions. In-depth analysis. In Policy Department B: Structural and Cohesion Policies; Directorate-general for Internal Policies; European Parliament’s Committee on Transport and Tourism: Luxembourg, 2018. [Google Scholar] [CrossRef]
  4. Hayes, J.G.; Goodarzi, G.A. Electric Powertrain; John Wiley & Sons Ltd.: Hoboken, NJ, USA, 2017. [Google Scholar] [CrossRef]
  5. Mi, C.; Masrur, M.A.; Gao, D.W. Hybrid Electric Vehicles; John Wiley & Sons Ltd.: Hoboken, NJ, USA, 2011. [Google Scholar] [CrossRef]
  6. European Environment Agency Air Quality in Europe—2019 Report. 2019. Available online: https://www.eea.europa.eu/publications/air-quality-in-europe-2019 (accessed on 17 May 2022).
  7. Rafael, S.; Correia, L.P.; Lopes, D.; Bandeira, J.; Coelho, M.C.; Andrade, M.; Miranda, A.I. Autonomous vehicles opportunities for cities air quality. Sci. Total Environ. 2020, 712, 136546. [Google Scholar] [CrossRef]
  8. World Equestrian Center. World Equestrian Center. World Energy Trilemma 2016 Defining Measures to Accelerate the Energy Transition. In World Energy Council Report; World Equestrian Center: Ocala, FL, USA, 2016. [Google Scholar]
  9. Ehsani, M.; Gao, Y.; Emadi, A. Modern Electric, Hybrid Electric, and Fuel Cell Vehicles. In Modern Electric, Hybrid Electric, and Fuel Cell Vehicles; CRC Press: Boca Raton, FL, USA, 2017. [Google Scholar] [CrossRef]
  10. Heshmati, A. A review of the circular economy and its implementation. Int. J. Green Econ. 2017, 11, 251. [Google Scholar] [CrossRef] [Green Version]
  11. Machedon-Pisu, M.; Borza, P.N. Are Personal Electric Vehicles Sustainable? A Hybrid E-Bike Case Study. Sustainability 2019, 12, 32. [Google Scholar] [CrossRef] [Green Version]
  12. Requia, W.J.; Mohamed, M.; Higgins, C.D.; Arain, A.; Ferguson, M. How clean are electric vehicles? Evidence-based review of the effects of electric mobility on air pollutants, greenhouse gas emissions and human health. Atmos. Environ. 2018, 185, 64–77. [Google Scholar] [CrossRef]
  13. Hooftman, N.; Oliveira, L.; Messagie, M.; Coosemans, T.; Van Mierlo, J. Environmental analysis of petrol, diesel and electric passenger cars in a Belgian urban setting. Energies 2016, 9, 84. [Google Scholar] [CrossRef]
  14. Machedon-Pisu, M.; Borza, P.N. A methodological approach to assess the impact of energy and raw materials constraints on the sustainable deployment of light-duty vehicles by 2050. Sustainability 2021, 13, 11826. [Google Scholar] [CrossRef]
  15. Longo, M.; Yaïci, W.; Zaninelli, D. “Team play” between renewable energy sources and vehicle fleet to decrease air pollution. Sustainability 2015, 8, 27. [Google Scholar] [CrossRef] [Green Version]
  16. Keramidas, K.; Kitous, A.; Despres, J.; Schmitz, A. POLES-JRC model documentation. In JRC Technical Reports; Publications Office of the European Union: Luxembourg, 2017. [Google Scholar] [CrossRef]
  17. Capros, P.; van Regemorter, D.; Paroussos, L.; Karkatsoulis, P.; Fragkiadakis, C.; Tsani, S.; Revesz, T. GEM-E3 Model Documentation. In JRC Technical Reports; Publications Office of the European Union: Luxembourg, 2013. [Google Scholar] [CrossRef]
  18. Vilchez, J.J.G.; Julea, A.; Peduzzi, E.; Pisoni, E.; Krause, J.; Siskos, P.; Thiel, C. Modelling the impacts of EU countries’ electric car deployment plans on atmospheric emissions and concentrations. Eur. Transp. Res. Rev. 2019, 11, 40. [Google Scholar] [CrossRef]
  19. EU Commission. the PRIMES Energy Model. 2014. Available online: https://ec.europa.eu/clima/sites/clima/files/strategies/analysis/models/docs/primes_model_2013-2014_en.pdf (accessed on 9 July 2021).
  20. EU Commission. The TREMOVE Model and Baseline Description. 2006. Available online: https://ec.europa.eu/clima/sites/clima/files/transport/vehicles/docs/2006_tremove_en.pdf (accessed on 11 July 2021).
  21. Lopez-Arboleda, E.; Sarmiento, A.T.; Cardenas, L.M. Systematic Review of Integrated Sustainable Transportation Models for Electric Passenger Vehicle Diffusion. Sustainability 2019, 11, 2513. [Google Scholar] [CrossRef] [Green Version]
  22. Kieckhäfer, K.; Wachter, K.; Spengler, T.S. Analyzing manufacturers’ impact on green products’ market diffusion—The case of electric vehicles. J. Clean. Prod. 2017, 162, S11–S25. [Google Scholar] [CrossRef]
  23. Onat, N.C.; Kucukvar, M.; Tatari, O.; Egilmez, G. Integration of system dynamics approach toward deepening and broadening the life cycle sustainability assessment framework: A case for electric vehicles. Int. J. Life Cycle Assess. 2016, 21, 1009–1034. [Google Scholar] [CrossRef]
  24. Hao, H.; Liu, F.; Sun, X.; Liu, Z.; Zhao, F. Quantifying the Energy, Environmental, Economic, Resource Co-Benefits and Risks of GHG Emissions Abatement: The Case of Passenger Vehicles in China. Sustainability 2019, 11, 1344. [Google Scholar] [CrossRef] [Green Version]
  25. Mazur, C.; Offer, G.; Contestabile, M.; Brandon, N. Comparing the Effects of Vehicle Automation, Policy-Making and Changed User Preferences on the Uptake of Electric Cars and Emissions from Transport. Sustainability 2018, 10, 676. [Google Scholar] [CrossRef] [Green Version]
  26. Onat, N.C.; Aboushaqrah, N.N.; Kucukvar, M.; Tarlochan, F.; Hamouda, A.M. From sustainability assessment to sustainability management for policy development: The case for electric vehicles. Energy Convers. Manag. 2020, 216, 112937. [Google Scholar] [CrossRef]
  27. Tartakovsky, L.; Gutman, M.; Mosyak, A. Energy efficiency of road vehicles—Trends and challenges. In Energy Efficiency: Methods, Limitations and Challenges; Nova Science Publishers: New York, NY, USA, 2012. [Google Scholar]
  28. Enerdata. Global Energy Statistical Yearbook 2019: Total Energy Consumption; Enerdata: Grenoble, France, 2019. [Google Scholar]
  29. Enerdata. Costs and Benefits to EU Member States of 2030 Climate and Energy Targets; Enerdata: Grenoble, France, 2014. [Google Scholar]
  30. UNCTAD. Handbook of Statistics 2021; United Nations Conference on Trade and Development: Geneva, Switzerland, 2022; Available online: https://unctad.org/webflyer/handbook-statistics-2021 (accessed on 1 May 2022).
  31. World Bank Group. GDP (Current US$) 1960–2020. 2020. Available online: https://data.worldbank.org/indicator/NY.GDP.MKTP.CD (accessed on 20 May 2022).
  32. Statista. Estimated Worldwide Motor Vehicle Production from 2000 to 2021; Statista: Hamburg, Germany, 2021. [Google Scholar]
  33. Statista. Global Car Sales 1990–2019; Statista: Hamburg, Germany, 2020. [Google Scholar]
  34. International Energy Agency. Passenger Car Sales by Key Region, 2010–2020e; International Energy Agency: Paris, France, 2020. [Google Scholar]
  35. United Nations. World Population to 2300: United Nations; Department of Economic and Social Affairs/Population Division: New York, NY, USA, 2004. [Google Scholar]
  36. Economist Intelligence Unit. Long-Term Macroeconomic Forecasts: Key Trends to 2050; The Economist: London, UK, 2015. [Google Scholar]
  37. World Bank Group. The Road to 2050; Sustainable Development for the 21st Century. 2006. Available online: https://documents1.worldbank.org/curated/en/192421468341095824/pdf/360210rev0The0Road0to0205001PUBLIC1.pdf (accessed on 21 May 2022).
  38. IISD. World Population to Reach 9.9 Billion by 2050. 2020. Available online: https://sdg.iisd.org/news/world-population-to-reach-9-9-billion-by-2050/ (accessed on 21 May 2022).
  39. United Nations. World Population Prospects: The 2017 Revision, Custom Data Acquired via Website; Department of Economic and Social Affairs, Population Division: New York, NY, USA, 2017; Available online: https://www.un.org/en/desa/world-population-projected-reach-98-billion-2050-and-112-billion-2100 (accessed on 3 May 2022).
  40. UN DESAPD. World Population Prospects 2019; Department of Economic and Social Affairs: New York, NY, USA, 2017; Available online: https://population.un.org/wpp/publications/files/wpp2019_highlights.pdf (accessed on 3 May 2022).
  41. Roser, M. Future Population Growth. 2020. Available online: https://ourworldindata.org/future-population-growth (accessed on 5 May 2022).
  42. Adam, D. How far will global population rise? Researchers can’t agree. Nature 2021, 597, 462–465. [Google Scholar] [CrossRef]
  43. Foure, J.; Bénassy-Quéré, A.; Fontagne, L. The Great Shift: Macroeconomic Projections for the World Economy at the 2050 Horizon; CEPII Working Papers, 2012-03; CEPII: Paris, France, 2012. [Google Scholar] [CrossRef] [Green Version]
  44. Hawksworth, J.; Chan, D. The World in 2050: Will the shift in global economic power continue? PwC Anal. 2015. [Google Scholar] [CrossRef]
  45. OECD. Real GDP Long-Term Forecast. 2018. Available online: https://data.oecd.org/gdp/gdp-long-term-forecast.htm (accessed on 21 May 2022).
  46. Wood Mackenzie. Energy Transition May Shave 2% off Global GDP by 2050. 2022. Available online: https://www.woodmac.com/press-releases/the-economic-impact-of-an-accelerated-energy-transition/ (accessed on 21 May 2022).
  47. Buiter, W.; Rahbari, E. Global Growth Generators: Moving beyond Emerging Markets and BRICs. Citi Economics Forum 2011. Available online: https://www.willembuiter.com/3G.pdf (accessed on 24 May 2022).
  48. Sachs, G. The N-11: More Than an Acronym. In Global Economics Paper. 2007. Available online: https://www.goldmansachs.com/insights/archive/archive-pdfs/brics-book/brics-chap-11.pdf (accessed on 25 May 2022).
  49. European Environment Agency. Historic and Projected GDP in the EU, the US, the BRIICS Countries and Other Countries. 2017. Available online: https://www.eea.europa.eu/data-and-maps/figures/past-and-projected-global-economic-output-1 (accessed on 21 May 2022).
  50. Pistoia, G.; Liaw, B. Behaviour of Lithium-Ion. Batteries in Electric Vehicles. Battery Health, Performance, Safety, and Cost; Springer International Publishing: Cham, Switzerland, 2018; ISSN 1865-3529. [Google Scholar] [CrossRef]
  51. U.S. Geological Survey. Mineral. Commodity Summaries 2021; U.S. Geological Survey: Reston, VI, USA, 2021. [Google Scholar]
  52. ITF International Transport Forum. Transport Outlook 2017; OECD Publishing: Paris, France, 2017; Available online: https://www.oecd-ilibrary.org/transport/itf-transport-outlook-2017_9789282108000-en (accessed on 26 May 2022).
  53. Statista. Urban Passenger Mobility Demand Worldwide between 2010 and 2050; Statista: Hamburg, Germany, 2018. [Google Scholar]
  54. Kristalina, G.; Hart, S.; Laura, T.; Elif, K.; Nicholas, B. Global Mobility Report 2017. Tracking Sector Performance. 2017. Available online: https://sustainabledevelopment.un.org/content/documents/2643Global_Mobility_Report_2017.pdf (accessed on 26 May 2022).
  55. Moriarty, P.; Honnery, D. Forecasting world transport in the year 2050. Int. J. Veh. Des. 2004, 35, 151. [Google Scholar] [CrossRef]
  56. International Energy Agency. Global Transport Outlook to 2050. Targets and Scenarios for a Low-Carbon Transport Sector; International Energy Agency: Paris, France, 2012. [Google Scholar]
  57. Seixas, J.; Simões, S.; Dias, L.; Kanudia, A.; Fortes, P.; Gargiulo, M. Assessing the cost-effectiveness of electric vehicles in European countries using integrated modeling. Energy Policy 2015, 80, 165–176. [Google Scholar] [CrossRef]
  58. Khalili, S.; Rantanen, E.; Bogdanov, D.; Breyer, C. Global transportation demand development with impacts on the energy demand and greenhouse gas emissions in a climate-constrained world. Energies 2019, 12, 3870. [Google Scholar] [CrossRef] [Green Version]
  59. European Union Road Federation. Passenger Transport 2020. 2020. Available online: https://erf.be/statistics/passenger-transport-2020/ (accessed on 22 May 2022).
  60. Koster, A.; Kuhnert, F.; Stürmer, C. Five trends transforming the Automotive Industry. PwC, 2018. Available online: https://www.pwc.com/gx/en/industries/automotive/assets/pwc-five-trends-transforming-the-automotive-industry.pdf (accessed on 27 May 2022).
  61. Statista. Proved Crude Oil Reserves Worldwide from 1990 to 2020; Statista: Hamburg, Germany, 2021. [Google Scholar]
  62. Statista. Daily Global Crude Oil Demand 2006–2026; Statista: Hamburg, Germany, 2021. [Google Scholar]
  63. BP Energy outlook. Statistical Review of World Energy, 70th ed.; BP Energy Outlook: London, UK, 2021. [Google Scholar]
  64. Eurostat. OIL-Final-Energy-Consumption-by-Sector-EU28-1990–2014: Statistics Explained; Eurostat: Luxembourg, 2016. [Google Scholar]
  65. Statista. Leading Oil Demanding Sectors in the OECD 2019; Statista: Hamburg, Germany, 2021. [Google Scholar]
  66. Lopez, G.; Independent Commodity Intelligence Services. Petchems Demand for Crude Oil Set to Boom Despite Rising Recycling Rates—IEA. 2019. Available online: https://www.icis.com/explore/resources/news/2019/11/13/10443245/petchems-demand-for-crude-oil-set-to-boom-despite-rising-recycling-rates-iea (accessed on 15 January 2021).
  67. Hou, F.; Chen, X.; Chen, X.; Yang, F.; Ma, Z.; Zhang, S.; Guo, F. Comprehensive analysis method of determining global long-term GHG mitigation potential of passenger battery electric vehicles. J. Clean. Prod. 2021, 289, 125137. [Google Scholar] [CrossRef]
  68. Xu, C.; Dai, Q.; Gaines, L.; Hu, M.; Tukker, A.; Steubing, B. Future material demand for automotive lithium-based batteries. Commun. Mater. 2020, 1, 99. [Google Scholar] [CrossRef]
  69. The International Council on Clean Transportation. Race to Electrify Light-Duty Vehicles in China, The United States, and Europe: A Comparison of Key EV Market Development Indicators. 2021. Available online: https://theicct.org/publication/race-to-electrify-light-duty-vehicles-in-china-the-united-states-and-europe-a-comparison-of-key-ev-market-development-indicators/ (accessed on 24 May 2022).
  70. Wang, N.; Tang, G. A Review on Environmental Efficiency Evaluation of New Energy Vehicles Using Life Cycle Analysis. Sustainability 2022, 14, 3371. [Google Scholar] [CrossRef]
  71. Bouter, A.; Hache, E.; Ternel, C.; Beauchet, S. Comparative environmental life cycle assessment of several powertrain types for cars and buses in France for two driving cycles: “Worldwide harmonized light vehicle test procedure” cycle and urban cycle. Int. J. Life Cycle Assess. 2020, 25, 1545–1565. [Google Scholar] [CrossRef]
  72. Puig-Samper Naranjo, G.; Bolonio, D.; Ortega, M.F.; García-Martínez, M.J. Comparative life cycle assessment of conventional, electric and hybrid passenger vehicles in Spain. J. Clean. Prod. 2021, 291, 125883. [Google Scholar] [CrossRef]
  73. Ziemann, S.; Müller, D.B.; Schebek, L.; Weil, M. Modeling the potential impact of lithium recycling from EV batteries on lithium demand: A dynamic MFA approach. Resour. Conserv. Recycl. 2018, 133, 76–85. [Google Scholar] [CrossRef]
  74. Pesaran, A.A.; Markel, T.; Tataria, H.S.; Howell, D. Battery requirements for plug-in hybrid electric vehicles—Analysis and rationale. In Proceedings of the 23rd International Electric Vehicle Symposium, Anaheim, CA, USA, 2–5 December 2007; McMaster University: Hamilton, ON, Canada, 2007. [Google Scholar]
  75. The National Academies. Assessment of Fuel Economy Technologies for Light-Duty Vehicles; The National Academies: Washington, DC, USA, 2011. [Google Scholar] [CrossRef]
  76. Vermeulen, I.; Helmus, J.R.; Lees, M.; van den Hoed, R. Simulation of future electric vehicle charging behavior-effects of transition from PHEV to FEV. World Electr. Veh. J. 2019, 10, 42. [Google Scholar] [CrossRef] [Green Version]
  77. Hirz, M.; Nguyen, T.T. Life-Cycle CO2-Equivalent Emissions of Cars Driven by Conventional and Electric Propulsion Systems. World Electr. Veh. J. 2022, 13, 61. [Google Scholar] [CrossRef]
  78. Statista. Estimated Average Battery Capacity in Electric Vehicles Worldwide from 2017 to 2025, by Type of Vehicle; Statista: Hamburg, Germany, 2018. [Google Scholar]
  79. Jung, H.; Li, C. Emissions from Plug-in Hybrid Electric Vehicle (PHEV) During Real World Driving Under Various Weather Conditions. 2018. Available online: https://rosap.ntl.bts.gov/view/dot/35123. (accessed on 24 May 2022).
  80. Green Car Reports. Analysis Finds Hybrids Make Better Use of-Scarce Batteries than Pure EVs. 2019. Available online: https://www.greencarreports.com/news/1123815_analysis-finds-hybrids-make-better-use-of-scarce-batteries-than-pure-evs (accessed on 24 May 2022).
  81. Car and Driver. Battery Taxonomy: The Differences between Hybrid and EV Batteries. 2021. Available online: https://www.caranddriver.com/news/a15345397/battery-taxonomy-the-differences-between-hybrid-and-ev-batteries/ (accessed on 24 May 2022).
  82. Salgado, R.M.; Danzi, F.; Oliveira, J.E.; El-Azab, A.; Camanho, P.P.; Braga, M.H. The latest trends in electric vehicles batteries. Molecules 2021, 26, 3188. [Google Scholar] [CrossRef]
  83. Granovskii, M.; Dincer, I.; Rosen, M.A. Economic and environmental comparison of conventional, hybrid, electric and hydrogen fuel cell vehicles. J. Power Sources 2006, 159, 1186–1193. [Google Scholar] [CrossRef]
  84. Sharma, I.; Chandel, M.K. Will electric vehicles (EVs) be less polluting than conventional automobiles under Indian city conditions? Case Stud. Transp. Policy 2020, 8, 1489–1503. [Google Scholar] [CrossRef]
  85. Wu, Z.; Wang, M.; Zheng, J.; Sun, X.; Zhao, M.; Wang, X. Life cycle greenhouse gas emission reduction potential of battery electric vehicle. J. Clean. Prod. 2018, 190, 462–470. [Google Scholar] [CrossRef]
  86. Congress, G.C. Green Car Congress. 2018. Available online: https://www.greencarcongress.com/2017/09/20170918-diesellca.html (accessed on 30 May 2022).
  87. Zeng, D.; Dong, Y.; Cao, H.; Li, Y.; Wang, J.; Li, Z.; Hauschild, M.Z. Are the electric vehicles more sustainable than the conventional ones? Influences of the assumptions and modeling approaches in the case of typical cars in China. Resour. Conserv. Recycl. 2021, 167, 105210. [Google Scholar] [CrossRef]
  88. Van Mierlo, J.; Messagie, M.; Rangaraju, S. Comparative environmental assessment of alternative fueled vehicles using a life cycle assessment. Transp. Res. Procedia 2017, 25, 3435–3445. [Google Scholar] [CrossRef]
  89. Hooftman, N.; Messagie, M.; Joint, F.; Segard, J.B.; Coosemans, T. In-life range modularity for electric vehicles: The environmental impact of a range-extender trailer system. Appl. Sci. 2018, 8, 1016. [Google Scholar] [CrossRef] [Green Version]
  90. Shi, S.; Zhang, H.; Yang, W.; Zhang, Q.; Wang, X. A life-cycle assessment of battery electric and internal combustion engine vehicles: A case in Hebei Province, China. J. Clean. Prod. 2019, 228, 606–618. [Google Scholar] [CrossRef]
  91. Ahmadi, P. Environmental impacts and behavioral drivers of deep decarbonization for transportation through electric vehicles. J. Clean. Prod. 2019, 225, 1209–1219. [Google Scholar] [CrossRef]
  92. Greene, D.L.; Park, S.; Liu, C. Public policy and the transition to electric drive vehicles in the U.S.: The role of the zero emission vehicles mandates. Energy Strategy Rev. 2014, 5, 66–77. [Google Scholar] [CrossRef]
  93. Machedon-Pisu, M.; Nedelcu, A.V.; Szekely, I.; Morariu, G.; Miron, M.; Kertész, C.Z. Energy-efficient tracking for wireless sensor networks. In Proceedings of the IEEE International Workshop on Robotic and Sensors Environments, ROSE, Lecco, Italy, 15–16 October 2010. 2009. [Google Scholar] [CrossRef]
  94. Nedelcu, A.V.; Talaba, D.; Stoianovici, V.C.; Machedon-Pisu, M.; Szekely, I. Conceptual integration of wireless sensor networks with 3D virtual environments. In Proceedings of the IEEE International Conference on Wireless Communications, Networking and Information Security (WCNIS), Beijing, China, 25–27 June 2010; Volume 2. [Google Scholar] [CrossRef]
  95. Machedon-Pisu, M. The impact of propagation media and radio interference on the performance of wireless sensor networks with MicaZ motes. In Proceedings of the International Conference on Optimization of Electrical and Electronic Equipment, OPTIM, Bran, Romania, 22–24 May 2014. [Google Scholar] [CrossRef]
  96. Wang, J.; Shao, Y.; Ge, Y.; Yu, R. A survey of vehicle to everything (V2X) testing. Sensors 2019, 19, 334. [Google Scholar] [CrossRef] [Green Version]
  97. Grama, A.; Petreus, D.; Borza, P.; Grama, L. Experimental determination of equivalent series resistance of a supercapacitor. In Proceedings of the 32nd International Spring Seminar on Electronics Technology, Brno, Czech Republic, 13–17 May 2009; pp. 1–4. [Google Scholar] [CrossRef]
  98. Puşcaş, A.M.; Carp, M.C.; Kertész, C.Z.; Borza, P.N.; Coquery, G. Thermal and voltage testing and characterization of supercapacitors and batteries. In Proceedings of the International Conference on Optimisation of Electrical and Electronic Equipment, OPTIM, Brasov, Romania, 20–22 May 2010; pp. 125–132. [Google Scholar] [CrossRef]
  99. Stanca, A.C.; Borza, P.N.; Romanca, M.; Paun, R.; Zamfir, S. Model of supercapacitor-starter assembly used for internal combustion engines starting. In Proceedings of the International Conference on Optimisation of Electrical and Electronic Equipment, OPTIM, Brasov, Romania, 20–22 May 2010; pp. 943–948. [Google Scholar] [CrossRef]
  100. Carp, M.C.; Puşcaş, A.M.; Borza, P.N. Energy Management System and Controlling Methods for a LDH1250HP Diesel Locomotive Based on Supercapacitors. In Camarinha-Matos, Technological Innovation for Sustainability. DoCEIS; Camarinha-Matos, L.M., Ed.; IFIP Advances in Information and Communication Technology; Springer: Berlin, Germany, 2011; Volume 349. [Google Scholar] [CrossRef] [Green Version]
Figure 1. Simplified sustainable transport framework based on the methodology proposed.
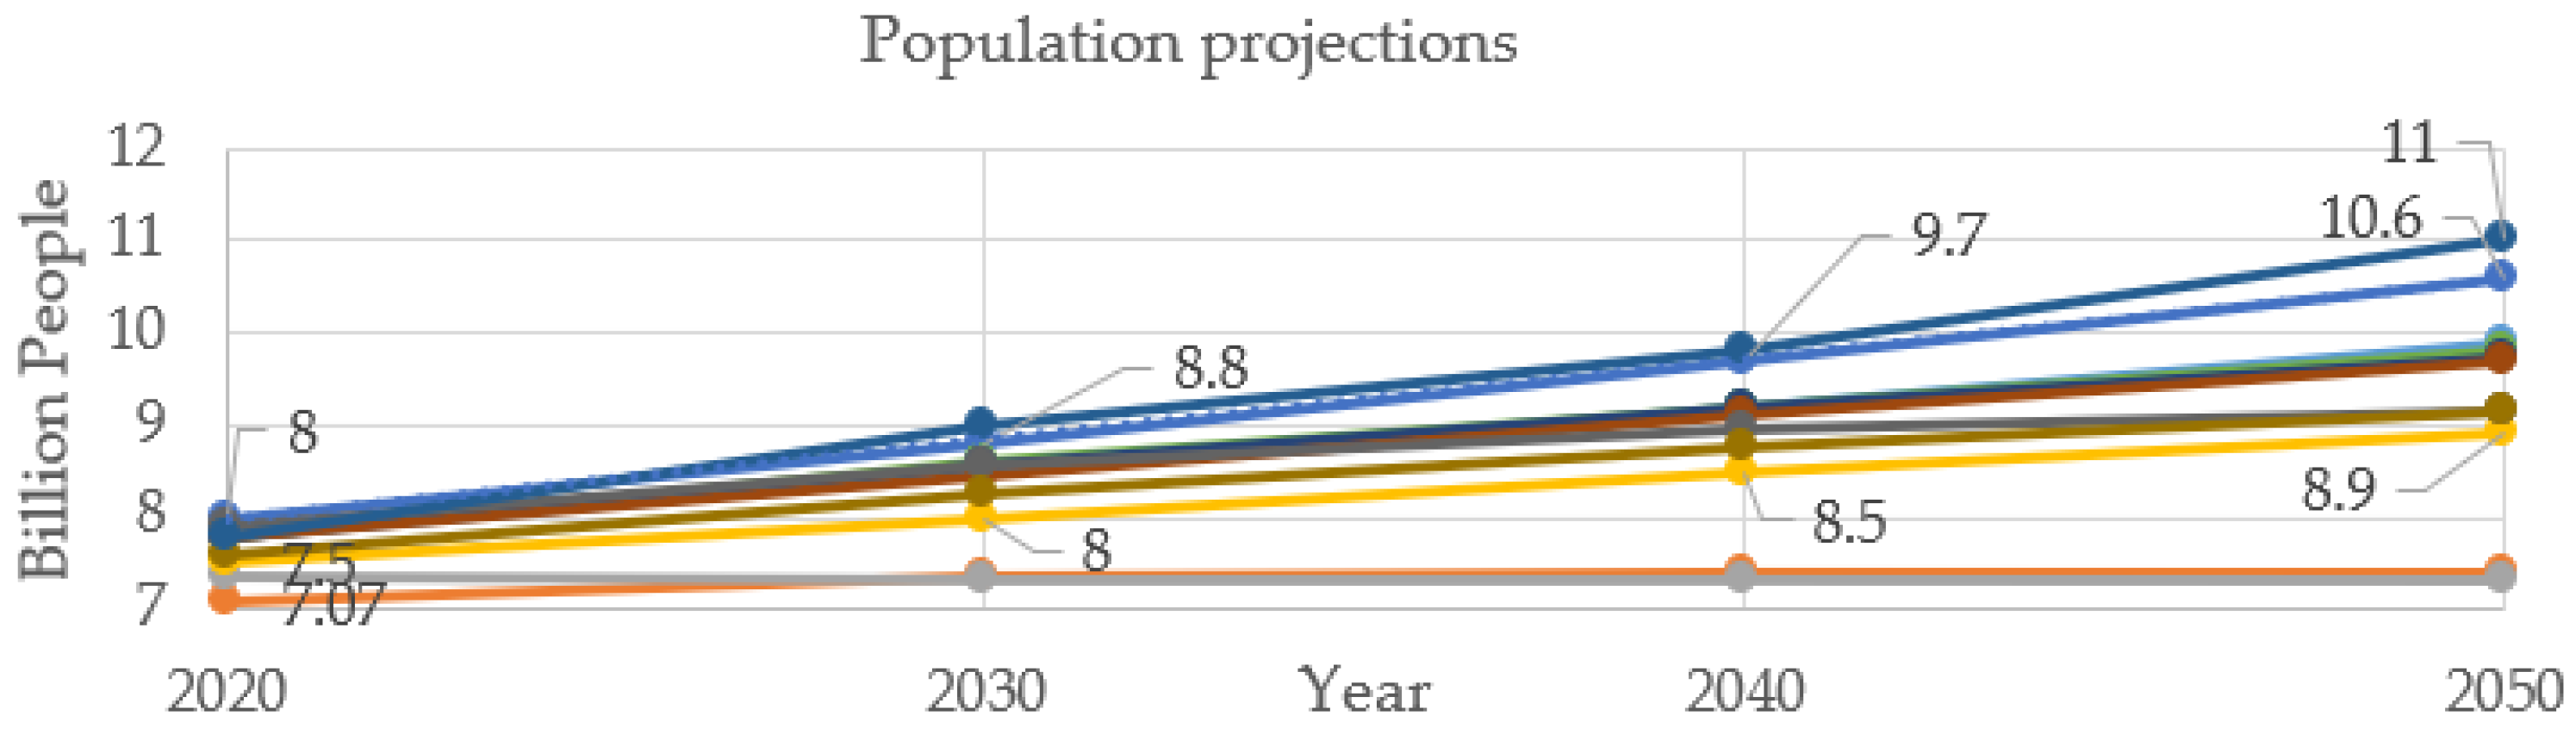
Sustainability 14 08571 g001
Figure 2. Evolution of: (a) population and GDP from 2000 to 2020; (b) LDVs’ production and sales from 2005 to 2020.
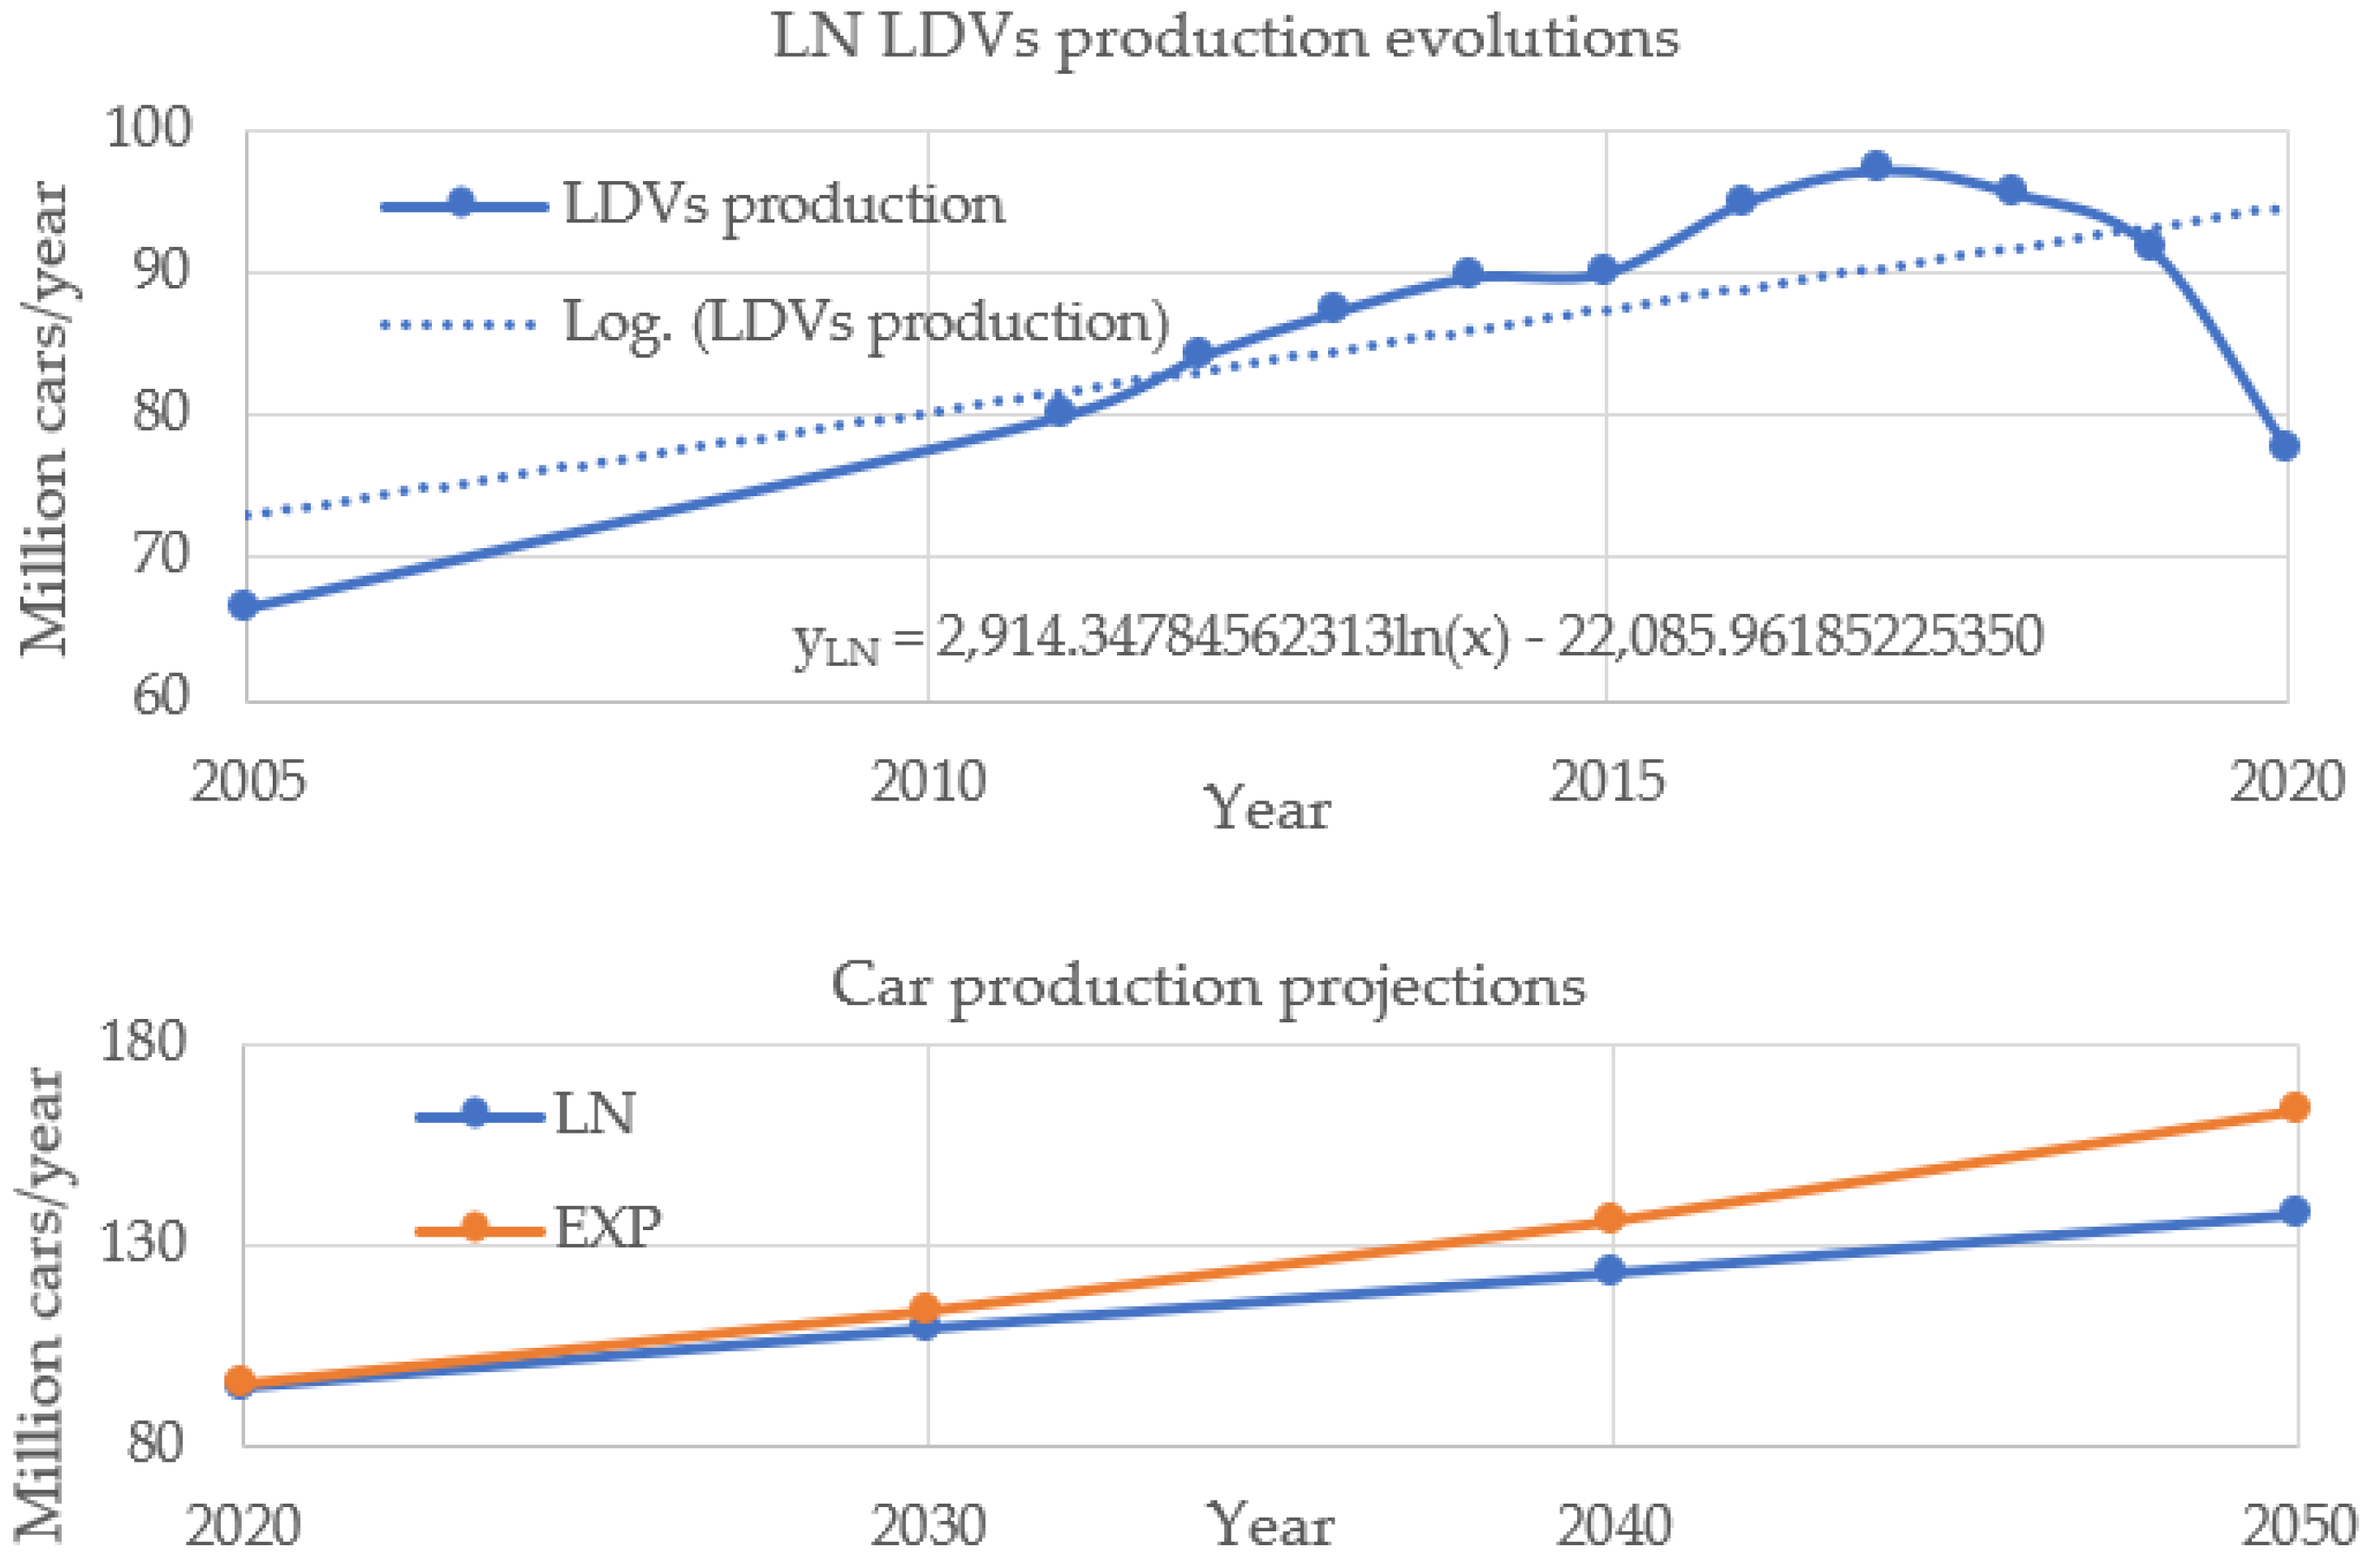
Sustainability 14 08571 g002
Figure 3. Nonlinear evolution and prediction scenarios (LN and EXP) for LDVs’ production including formulas where x = year and y = annual car production.
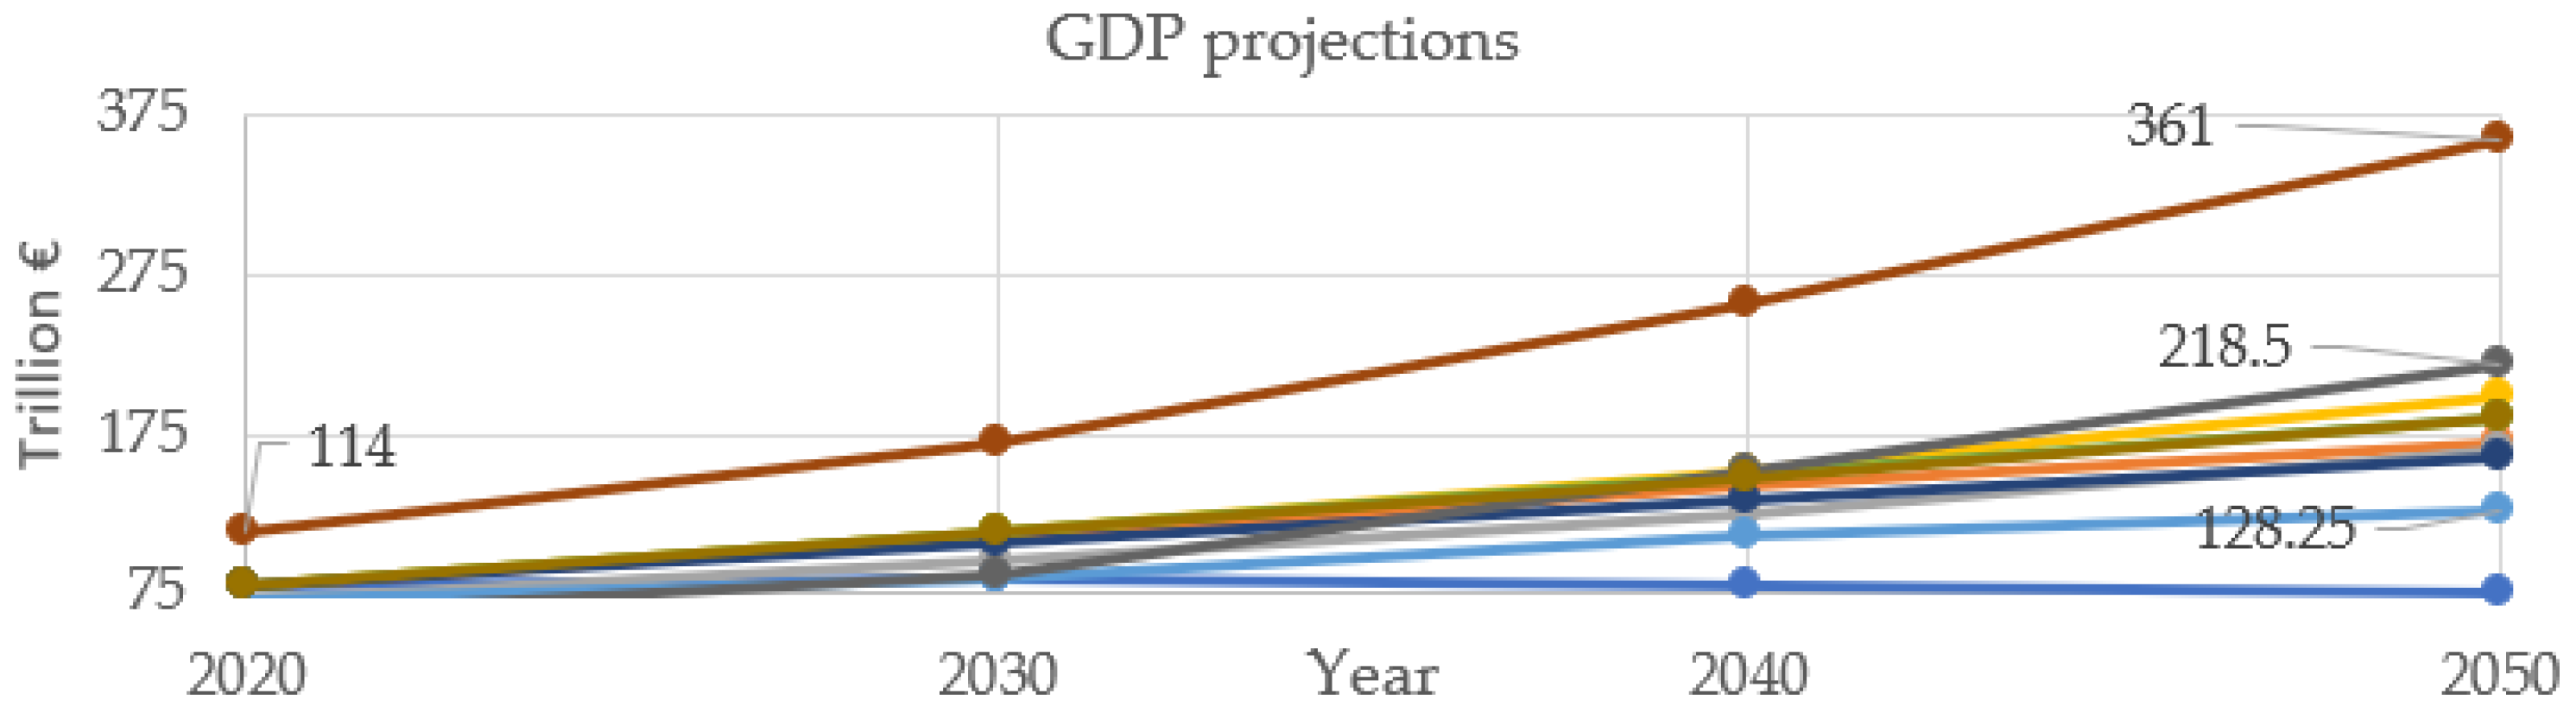
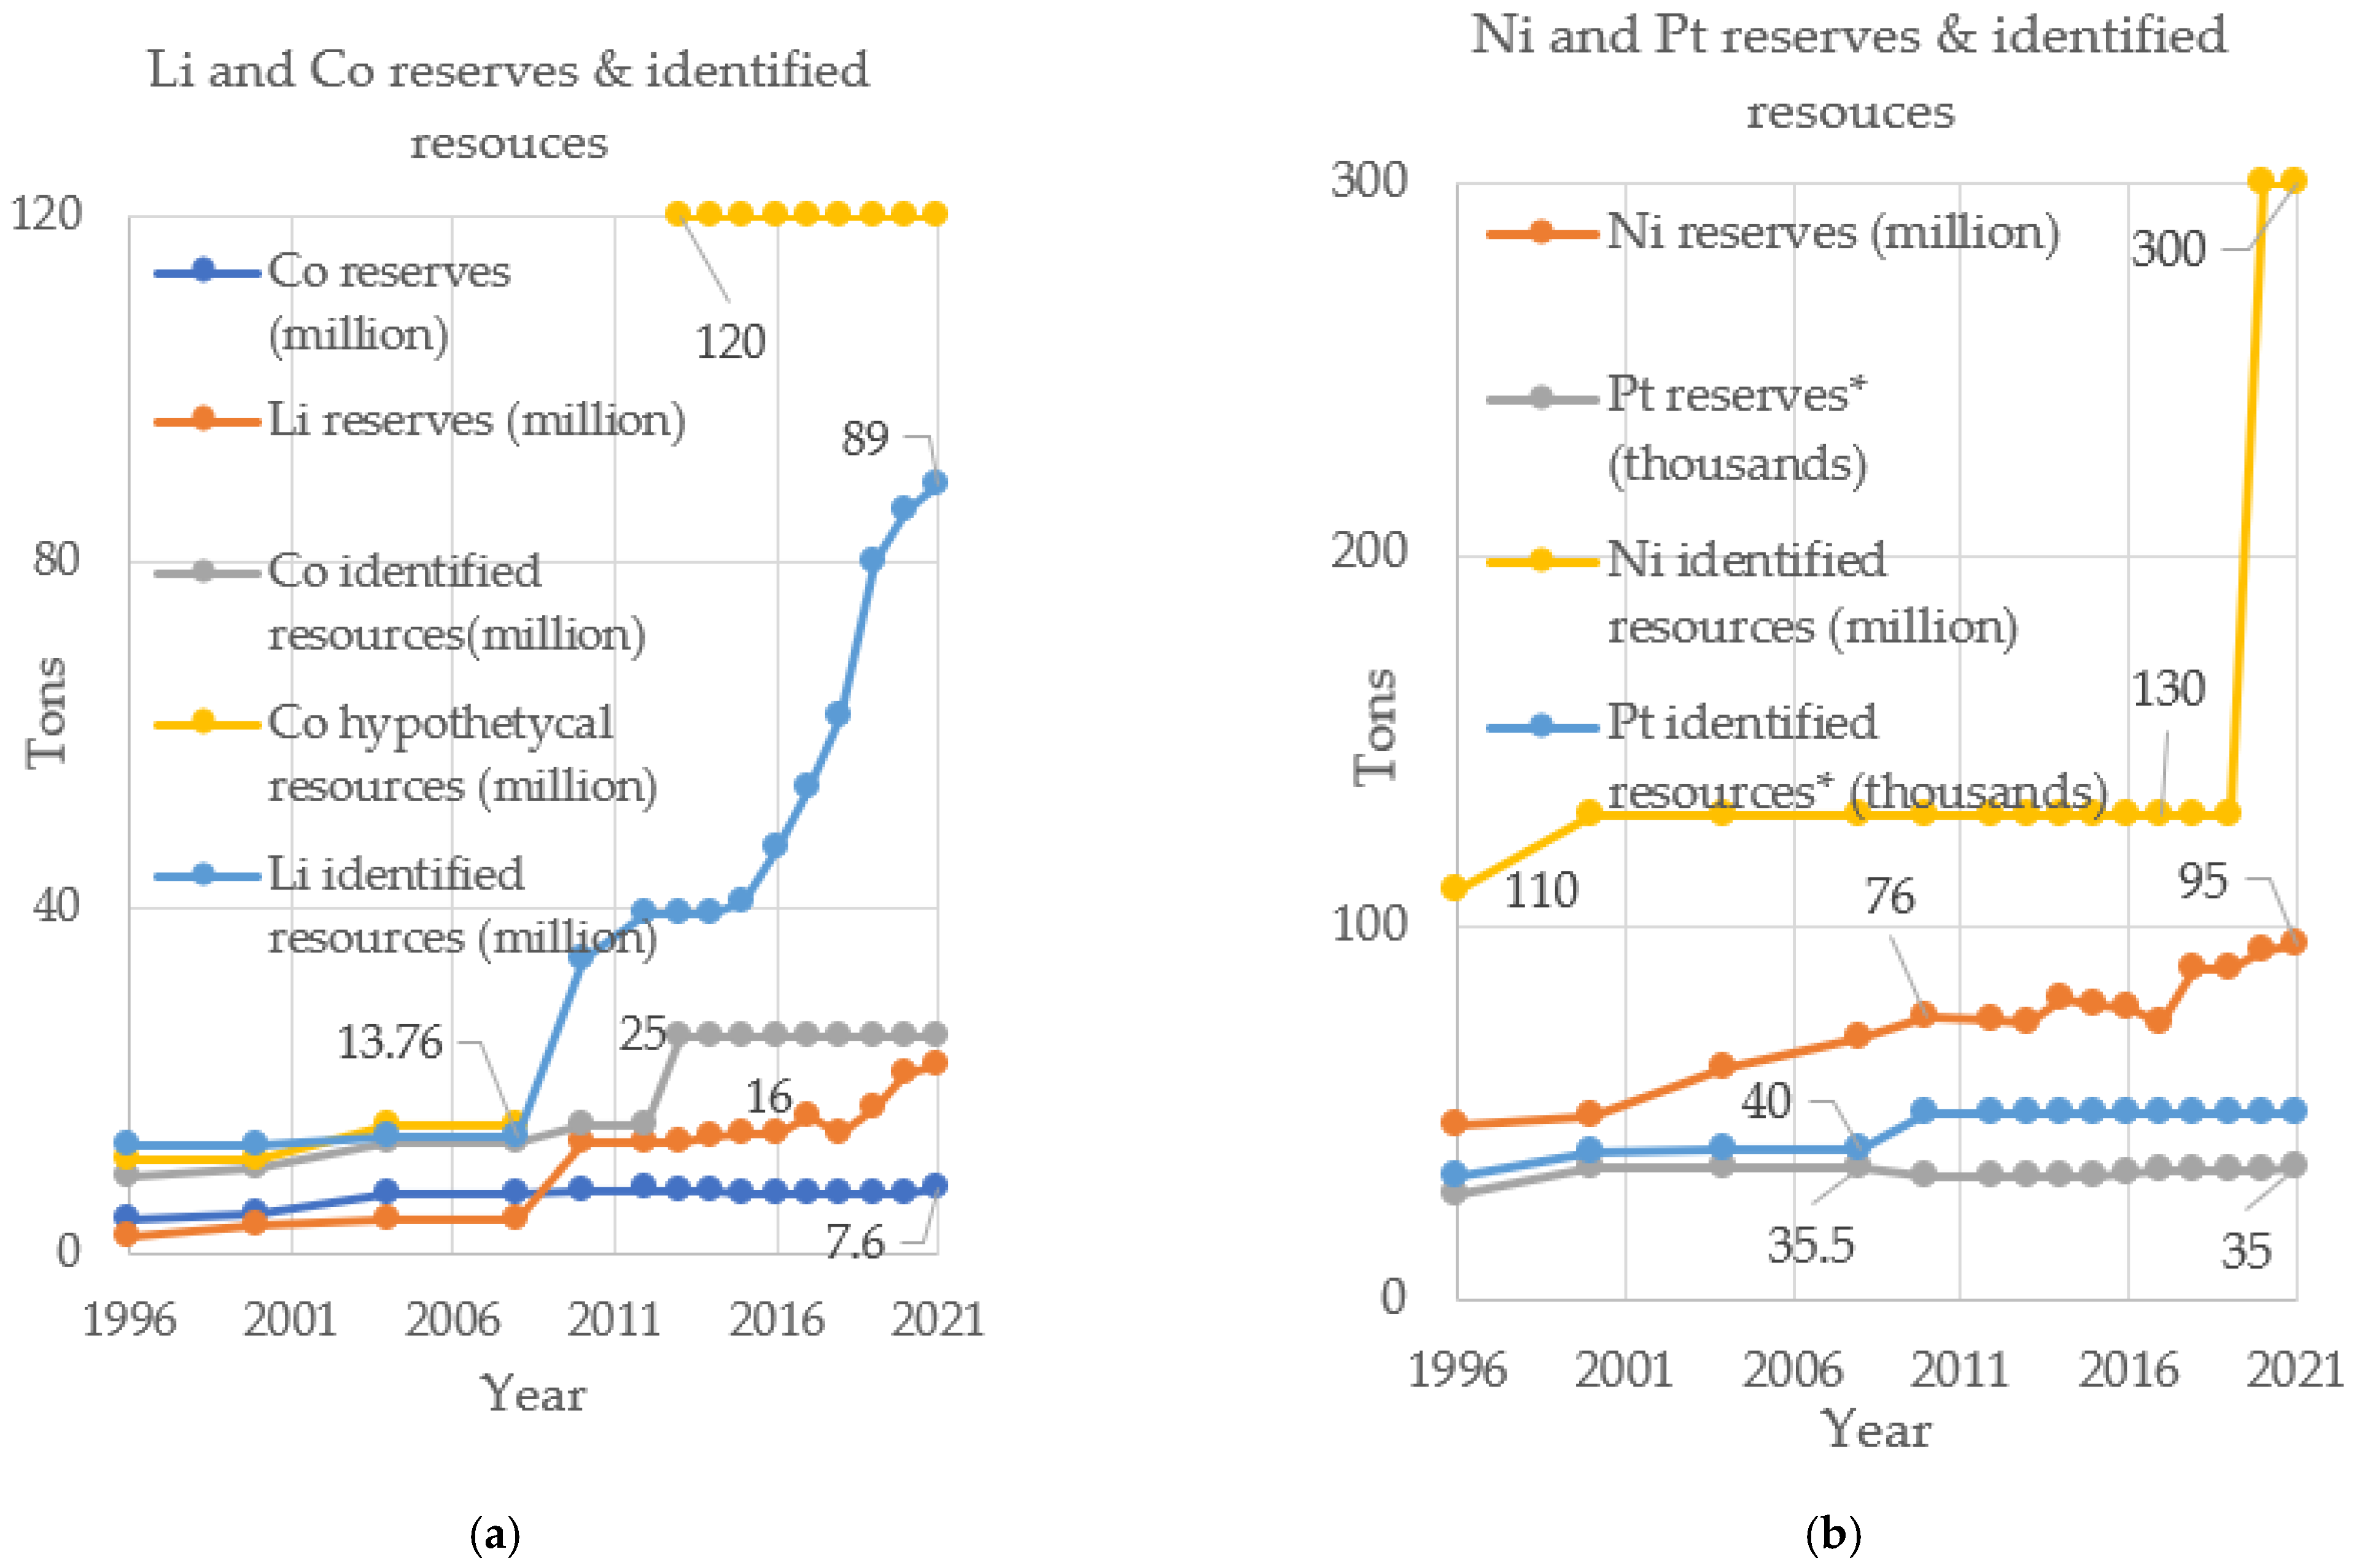
Sustainability 14 08571 g003
Figure 4. Population predictions from 2020 to 2050 [35,36,37,38,39,40,41,42].
Sustainability 14 08571 g004
Figure 5. GDP predictions from 2020 to 2050 [36,37,43,44,45,46,47,48,49].
Sustainability 14 08571 g005
Figure 6. Evolution of the identified resources and reserves by USGS for: (a) lithium and cobalt; (b) nickel and platinum from 1996 to 2021. * Pt reserves and resources represent 50% of the total Platinum-group metals (PGM) reserves and resources in [51].
Sustainability 14 08571 g006
Figure 7. LDVs’ travel demand predictions from 2020 to 2050 [52,53,54,55,56,57,58,59,60].
Sustainability 14 08571 g007
Figure 8. Evolution of: (a) ail reserves, from 2005 to 2020; (b) oil exploitation, from 1990 to 2020.
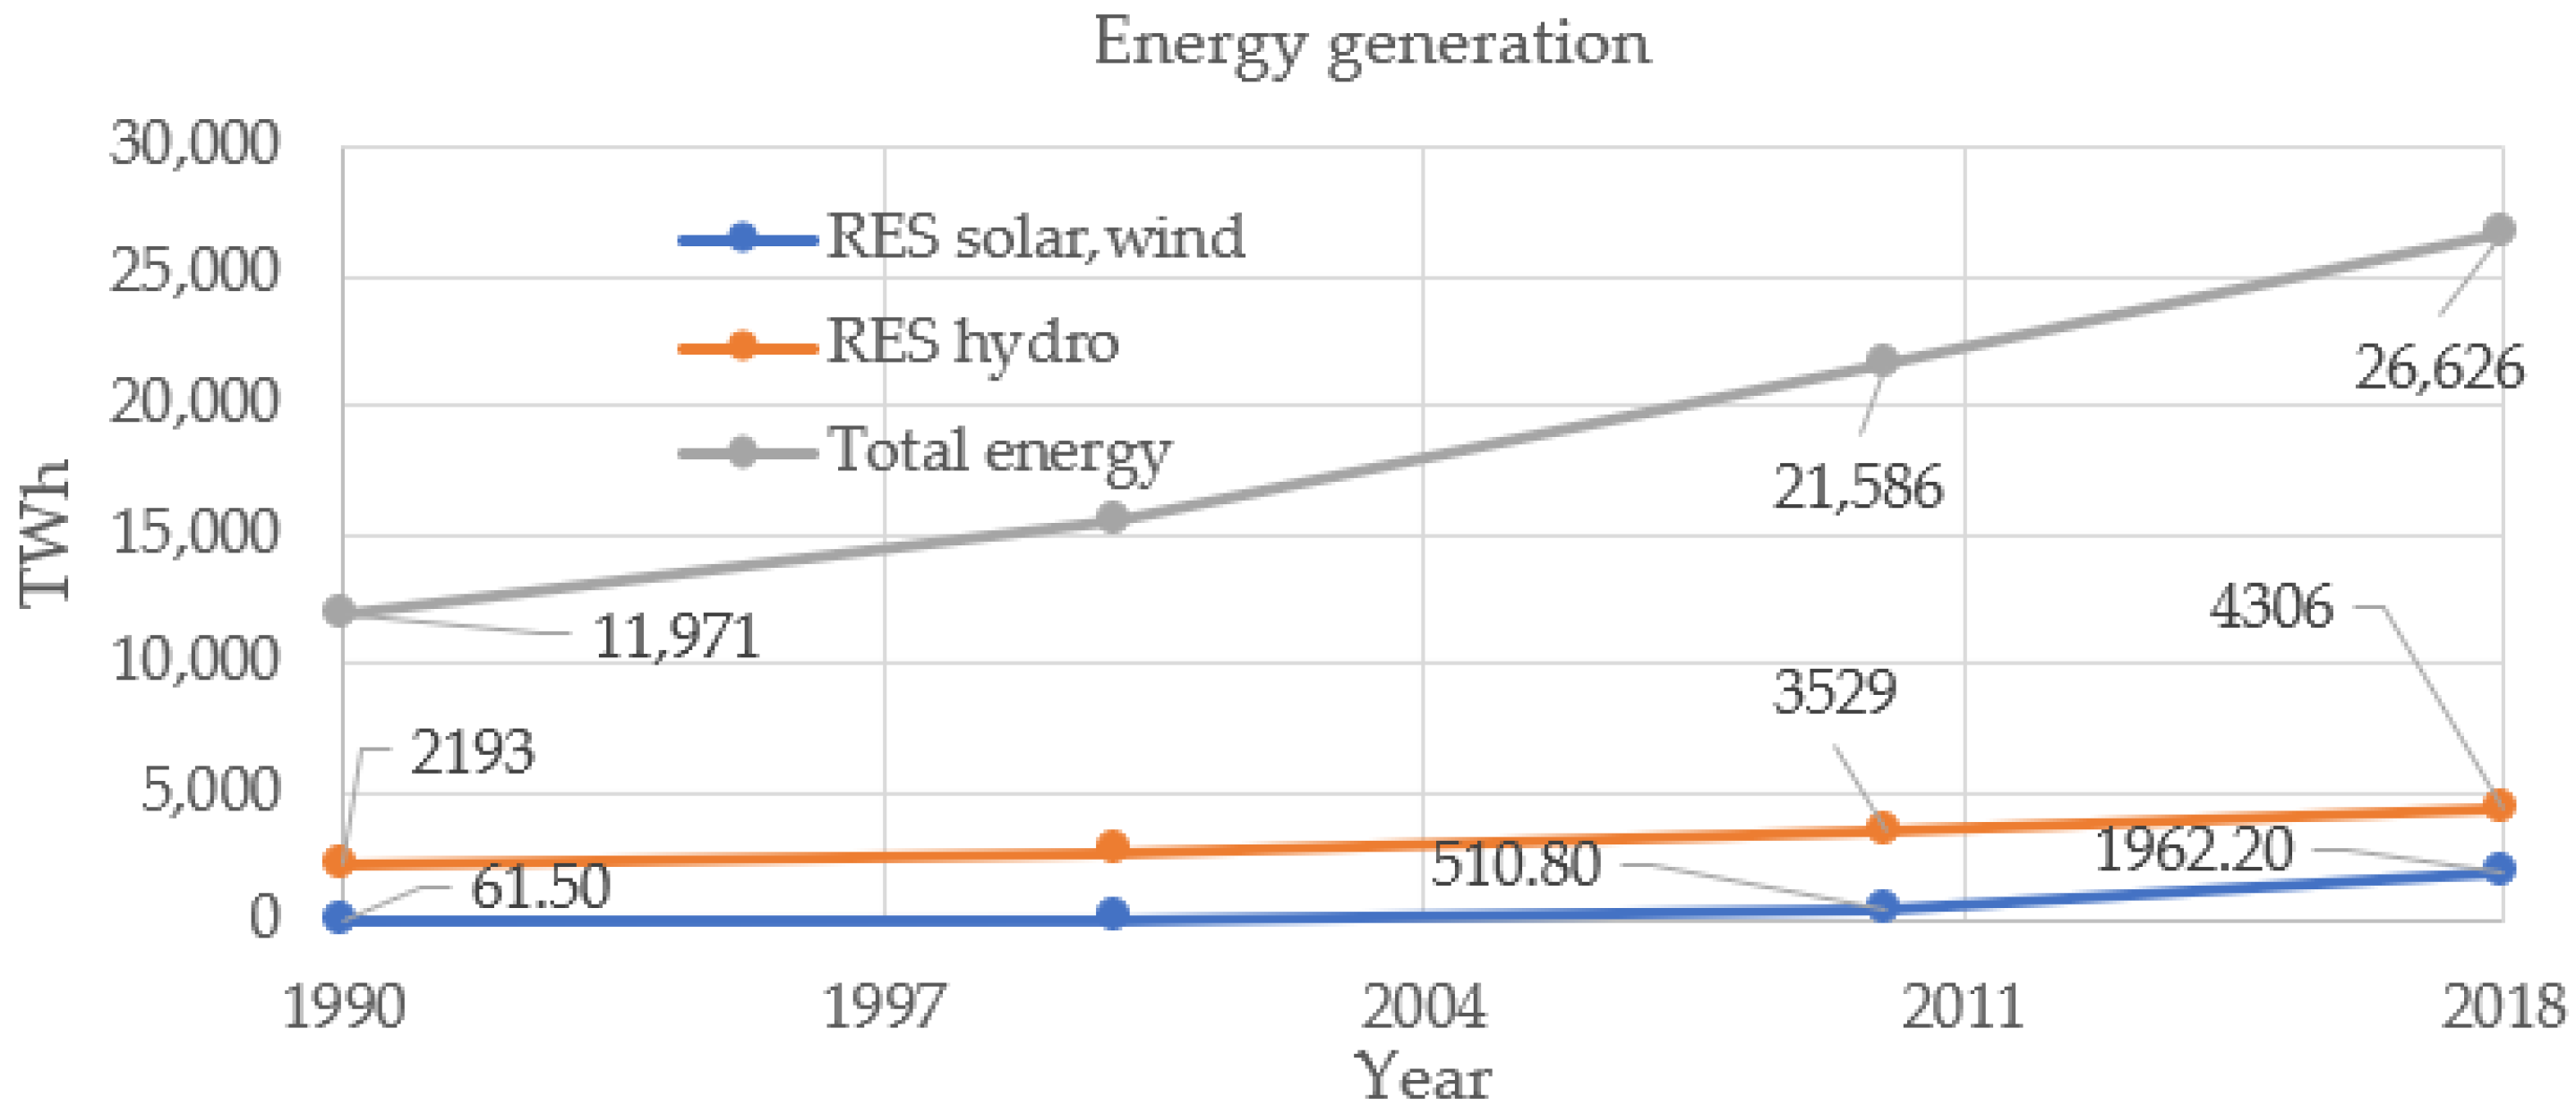
Sustainability 14 08571 g008
Figure 9. Energy generation from 1990 to 2018.
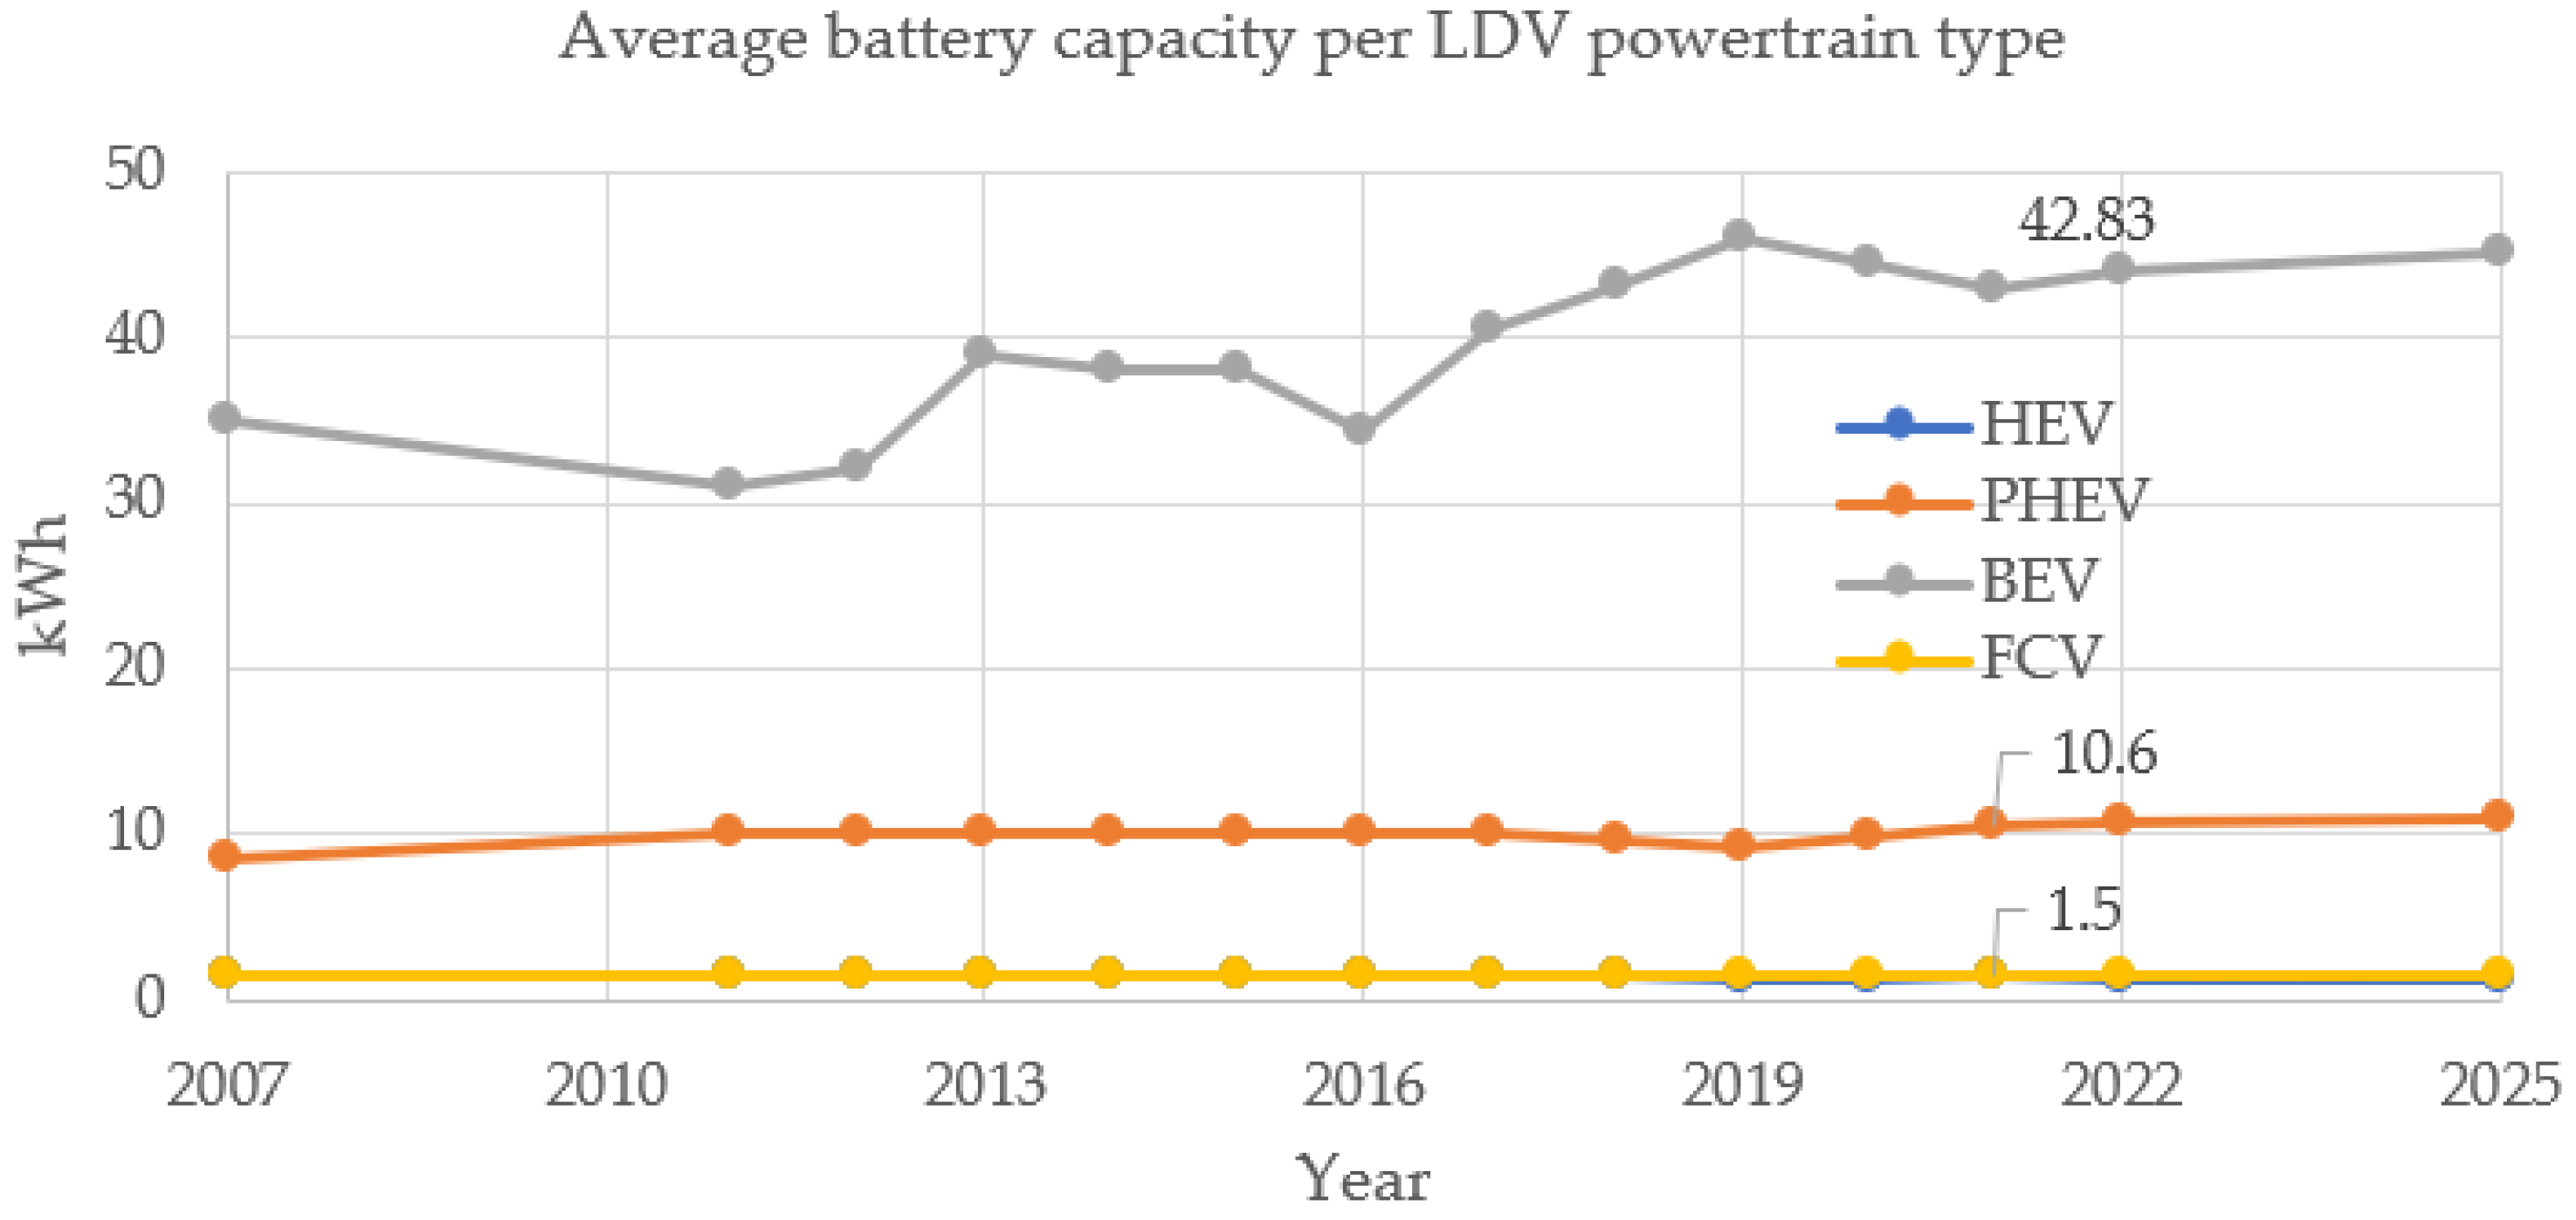
Sustainability 14 08571 g009
Figure 10. Estimated and predicted evolution of the battery capacity of storage-based LDVs from 2007 to 2025.
Sustainability 14 08571 g010
Figure 11. Proposed methodology.
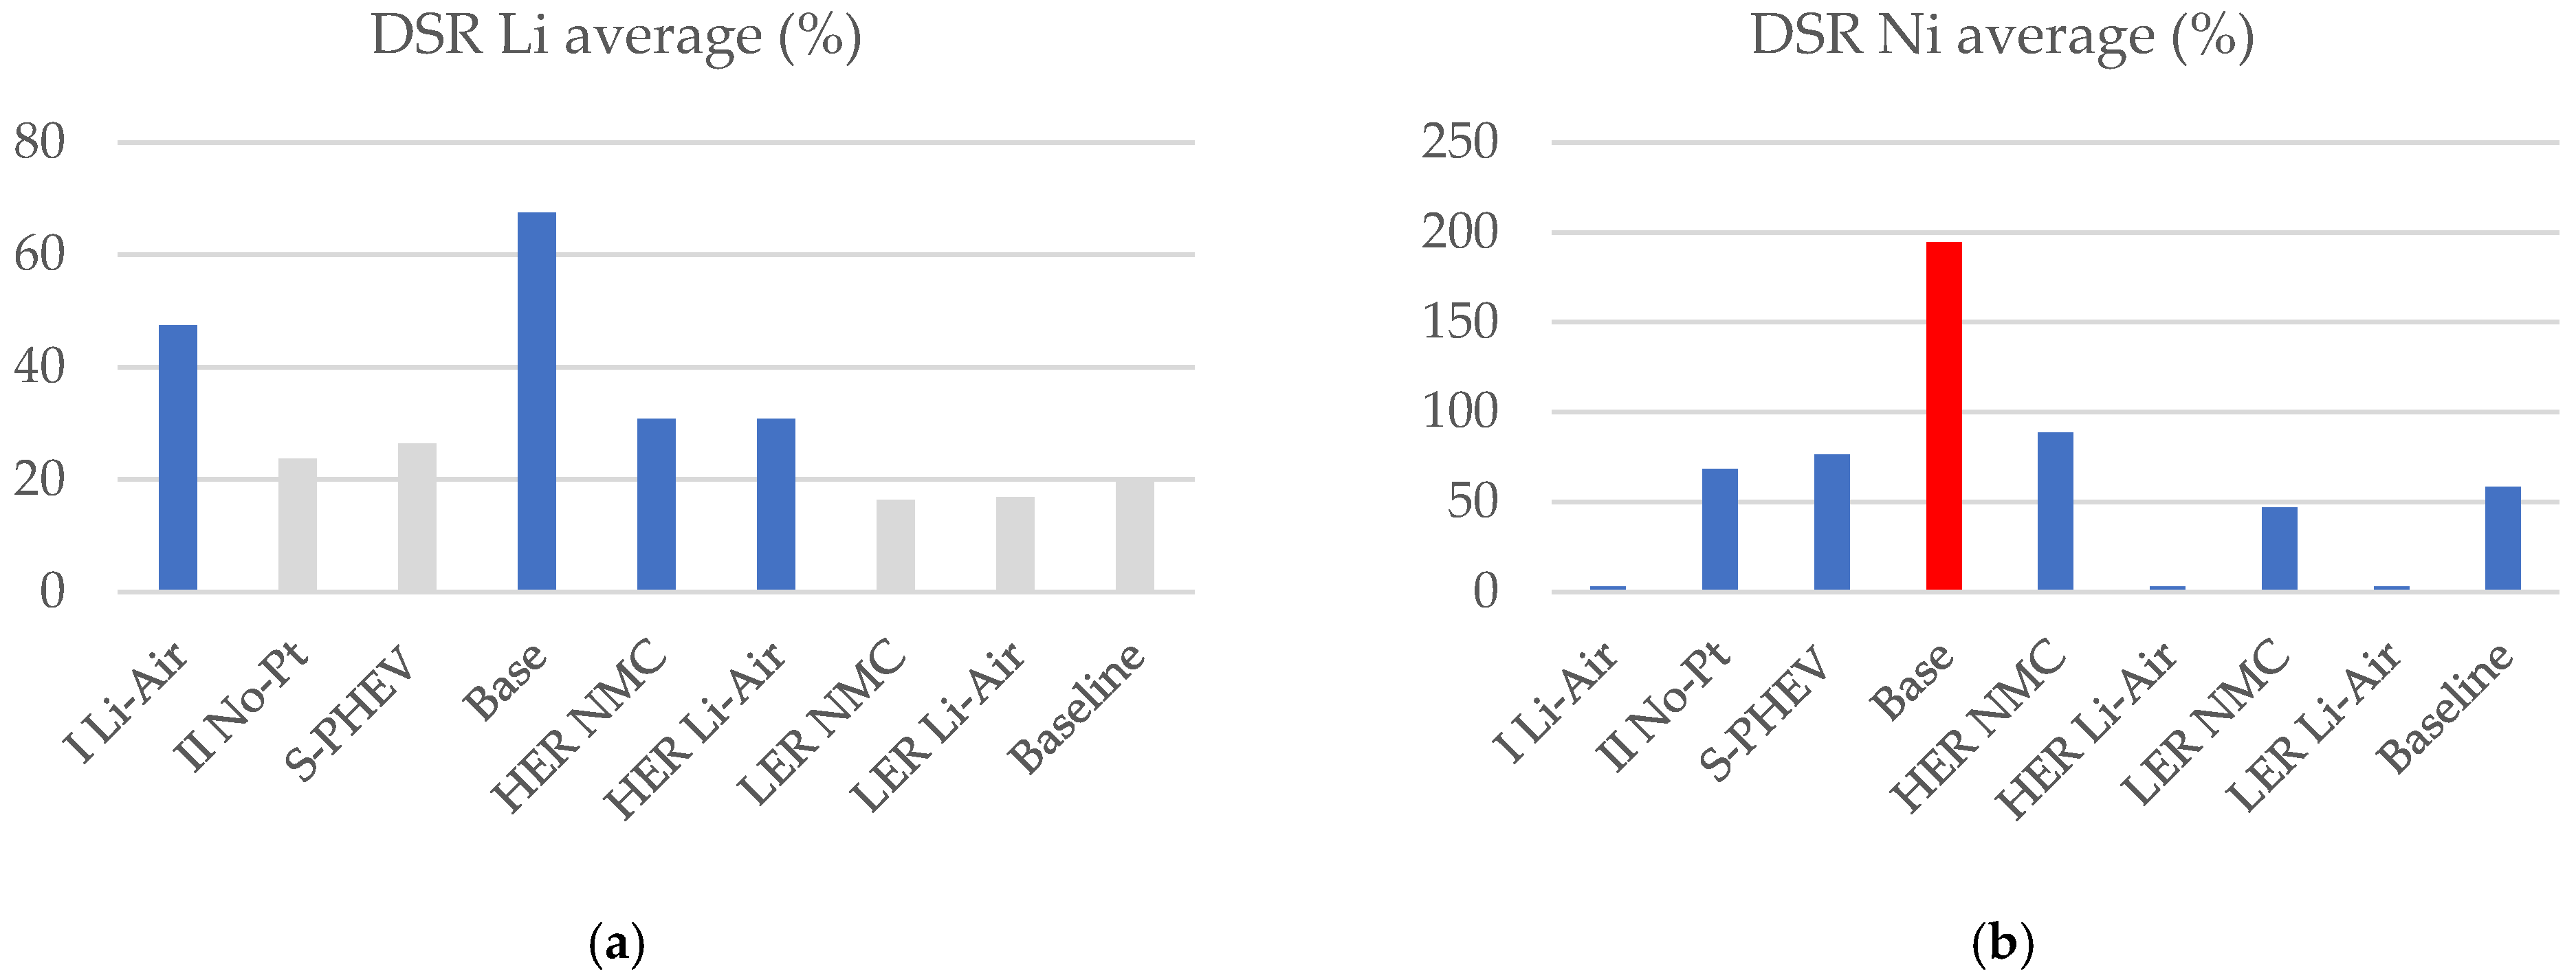
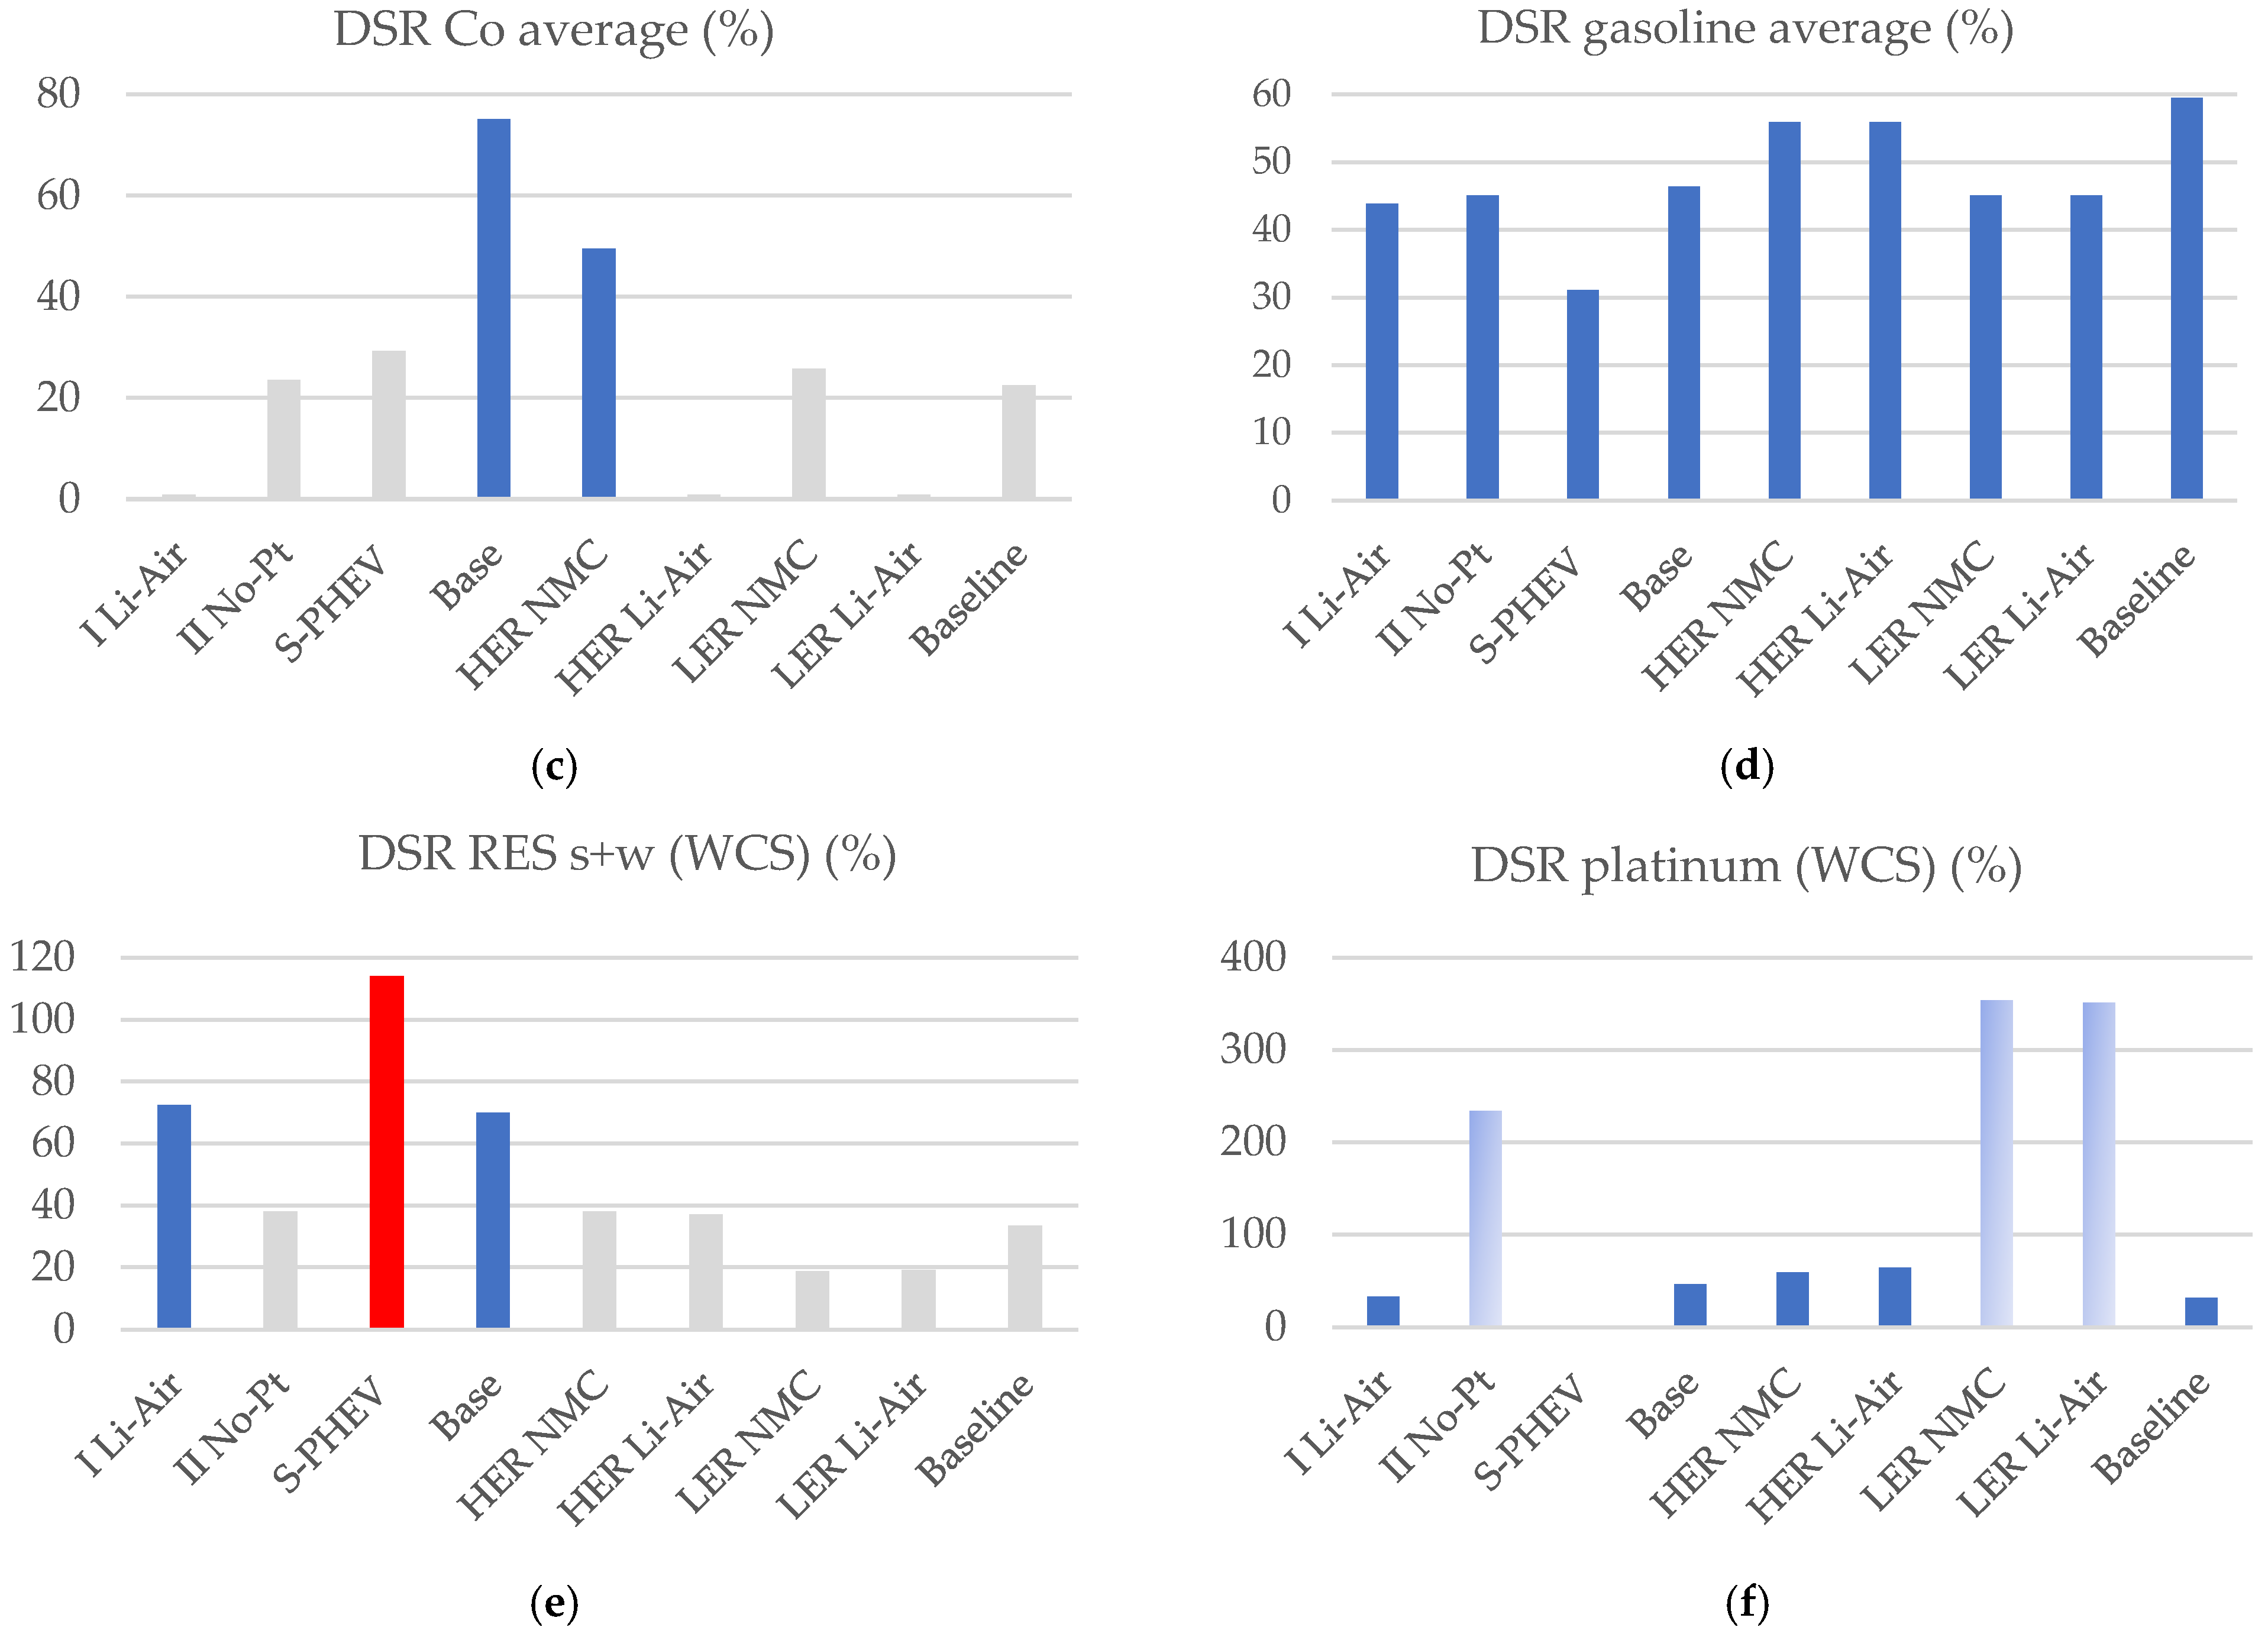
Sustainability 14 08571 g011
Figure 12. DSR determinations for (a) lithium-based storage (average), from 2020 to 2050; (b) nickel-based storage (average), from 2005 to 2020; (c) cobalt-based storage (average), from 2020 to 2050; (d) gasoline resources (average), from 2020 to 2050; (e) RES solar and wind resources (WCS), in 2050; (f) platinum resources (WCS), from 2005 to 2020, according to nine scenarios.
Sustainability 14 08571 g012aSustainability 14 08571 g012b
Figure 13. Estimated impacts on: (a) GWP; (b) PAC, from 2020 to 2050, according to nine scenarios.
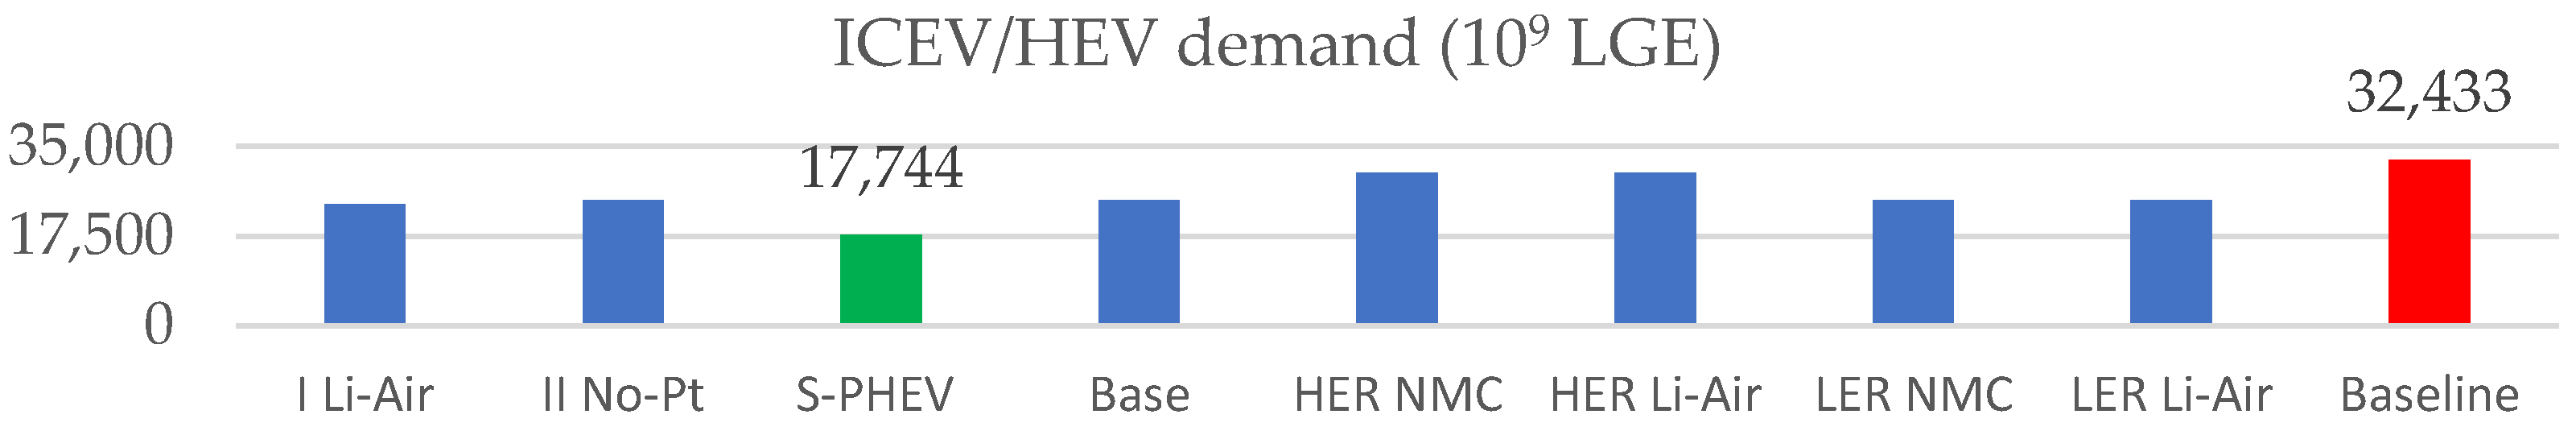
Sustainability 14 08571 g013
Figure 14. Estimated demand in Billion LGE required for fueling ICEVs and HEVs from 2020 to 2050, according to nine scenarios.
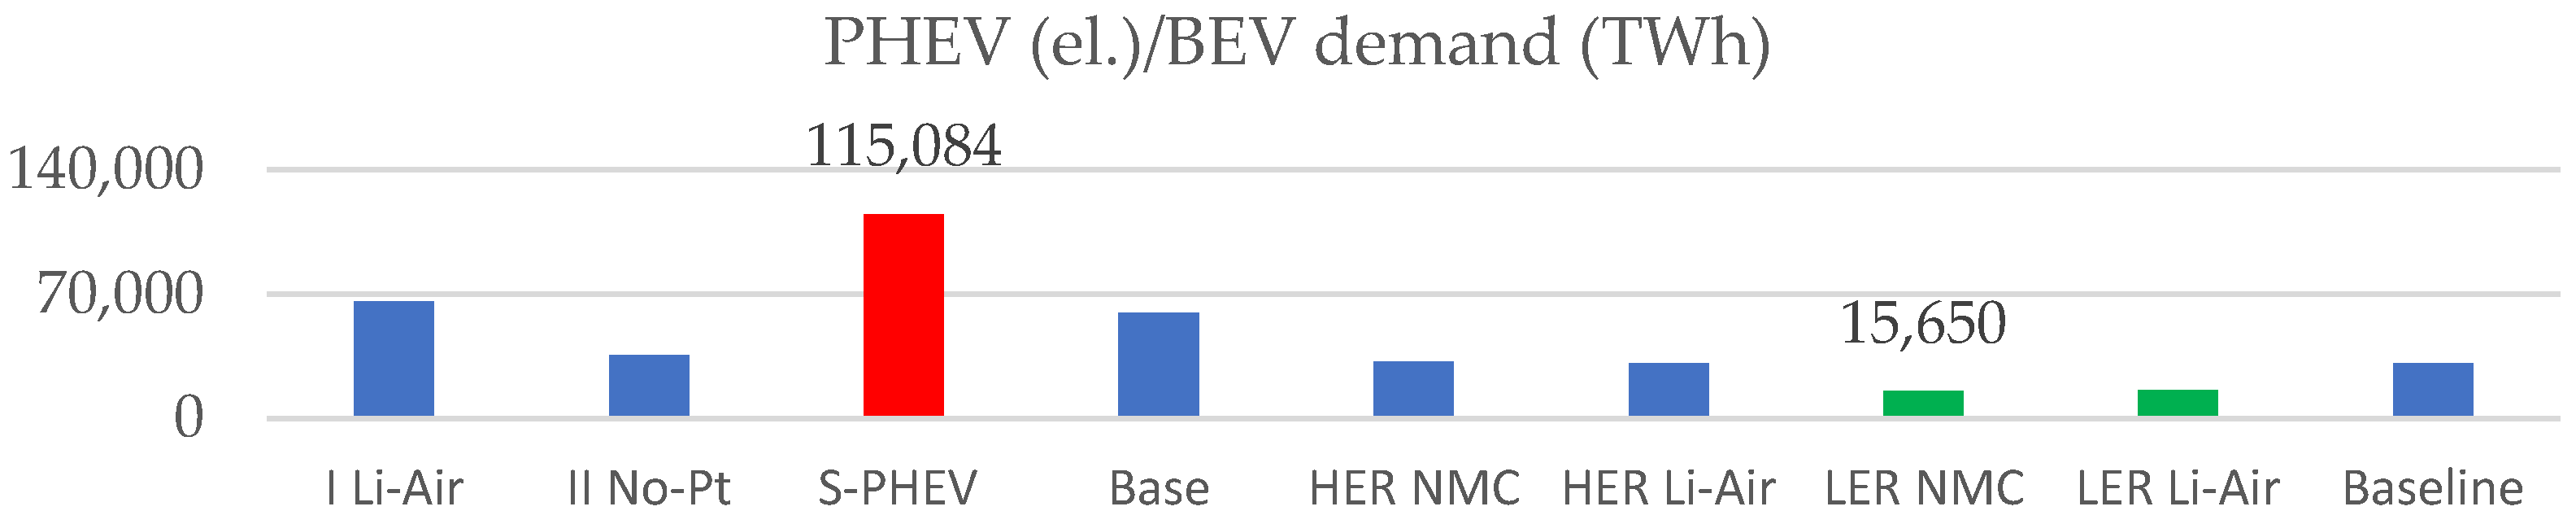
Sustainability 14 08571 g014
Figure 15. Estimated demand in TWh required for charging PHEVs (electric) and BEVs from 2020 to 2050, according to nine scenarios.
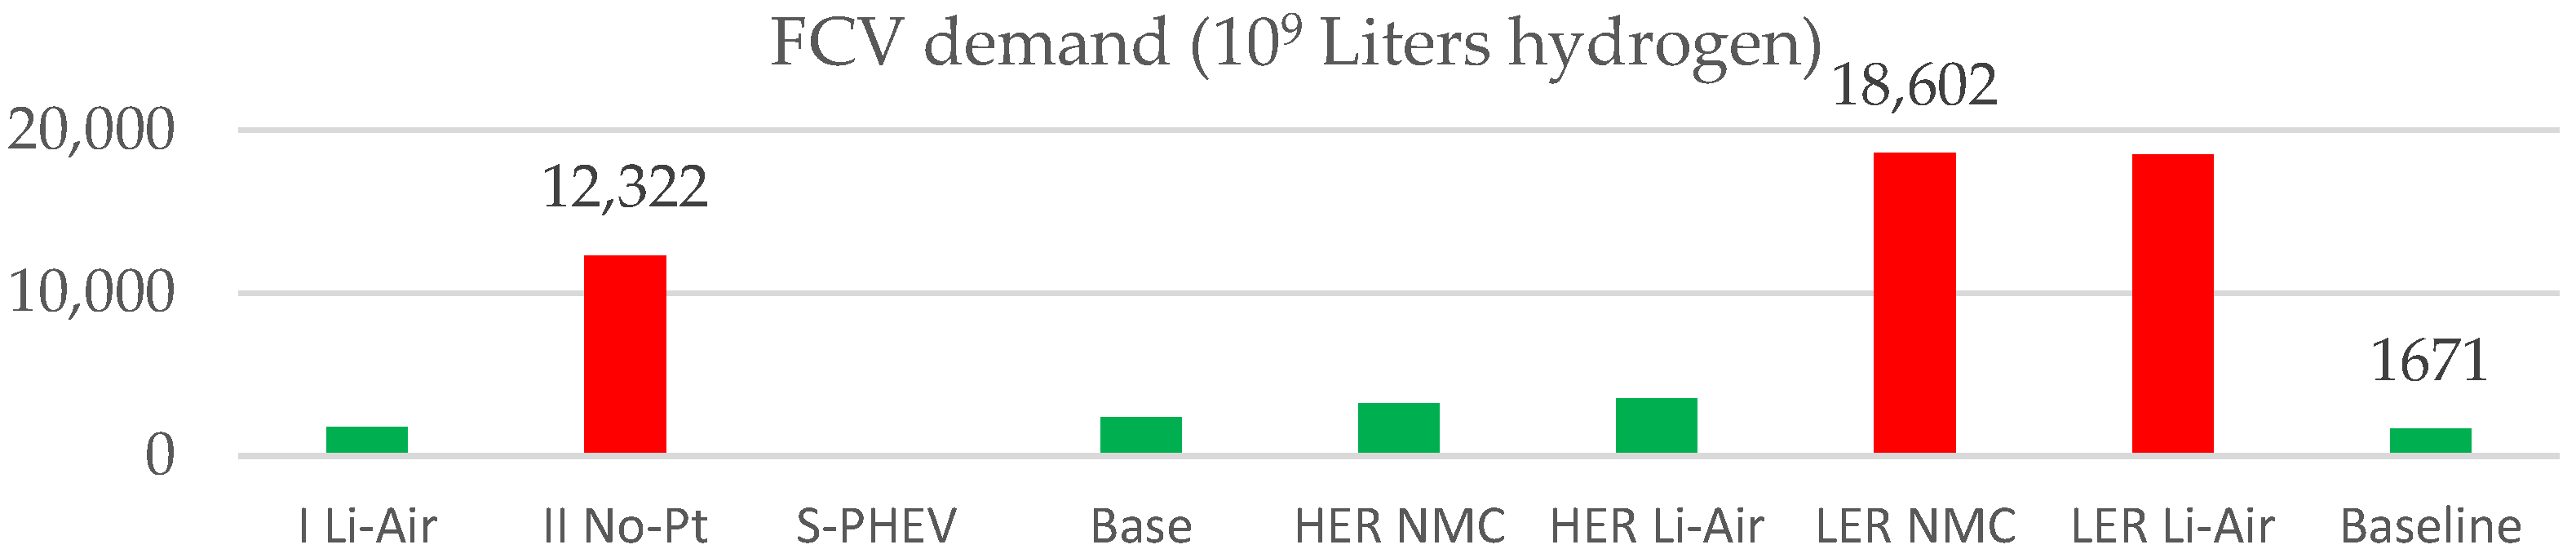
Sustainability 14 08571 g015
Figure 16. Estimated demand in Billion Liters of Hydrogen required for fueling FEVs from 2020 to 2050, according to nine scenarios.
Sustainability 14 08571 g016
Table 1. Comparison between mentioned models and frameworks in terms of data provided based on sustainable transport considerations.
LinkEnergy for LDVsRaw Materials for LDVsLDV StorageVehicle Market Share
Gen./Cons.Fuels/RESSupplyDemandBattery Type and Cap.LDV PowertrainPeriod
[12] Yes/noYes/yesNoNoNoBEV, PHEV 12010–2015
[14] Yes/yesYes/yesYesYesYesAll types2020–2050
[16] Yes/yesYes/yesNoNoNoNone-
[17] Yes/yesYes/noNoNoNoNone-
[18] No/yesYes/noNoNoNoBEV, PHEV 12017–2030
[19] Yes/yesYes 2/yesNoNoNoNone-
[20] Yes/yesYes/noNoNoNoICEV, HEV-
[21]No/noYes/noNoNoNoAll types-
[22] No/noYes/noNoNoNoAll types2010–2030
[23] Yes/yesYes/noNoNoNoAll types2010–2050
[24] Yes/yesYes 2/yesNoYesNoAll types2020–2100
[25] No/yesYes 2/noNoNoNoAll except HEV2015–2050
[26] Yes/yesYes/yesNoNoNoAll except FCV-
[27] No/yesYes 2/noNoNoNoAll types2010–2050
1 Only regional, 2 Hydrogen included, Gen. = generation, Cons. = consumption.
Table 2. Values in million cars/year based on the evolution scenarios for LDVs production.
YearLinearLNEXP
2030109.1791109.1025114.0415
2040123.6438123.4236136.5359
2050138.1086137.6747163.4674
LN = natural logarithm, EXP = exponential interpolations.
Table 3. Approximated degree of correlation (%) between Population and GDP predictions and LN and EXP predictions for the LDVs’ production from 2020 to 2050 (2020, 2030, 2040, 2050).
Population Predictions Versus LN/EXP LDV Production Predictions
[35] 1[35] 2[36][35] 3, [37][38][39][40] 1[41] [42] 1[42] 1[40] 2
100/10086/82−100/−99100/99100/100100/99100/99100/9996/9499/98100/99
GDP predictions versus LN/EXP LDV production predictions
[36][43][44] 3[44] 1[37][45][46][47][48][49]
−63/−69100/10099/100100/10099/99100/100100/10099/10098/99100/100
1 High-, 2 Low-, 3 Medium-valued predictions.
Table 4. LDV batteries’ Li, Co, Ni, and Pt demand per vehicle.
Battery TypeLithium (kg/kWh)Cobalt (kg/kWh)Nickel (kg/kWh)Platinum (kg)
For FCV0.046
For BEV/PHEV/HEV
NMC/NCM0.1330.320.435-
NCA0.2420.1420.79-
LFP0.168-0.01-
Li-S0.412---
Li-Air0.136---
Table 5. 
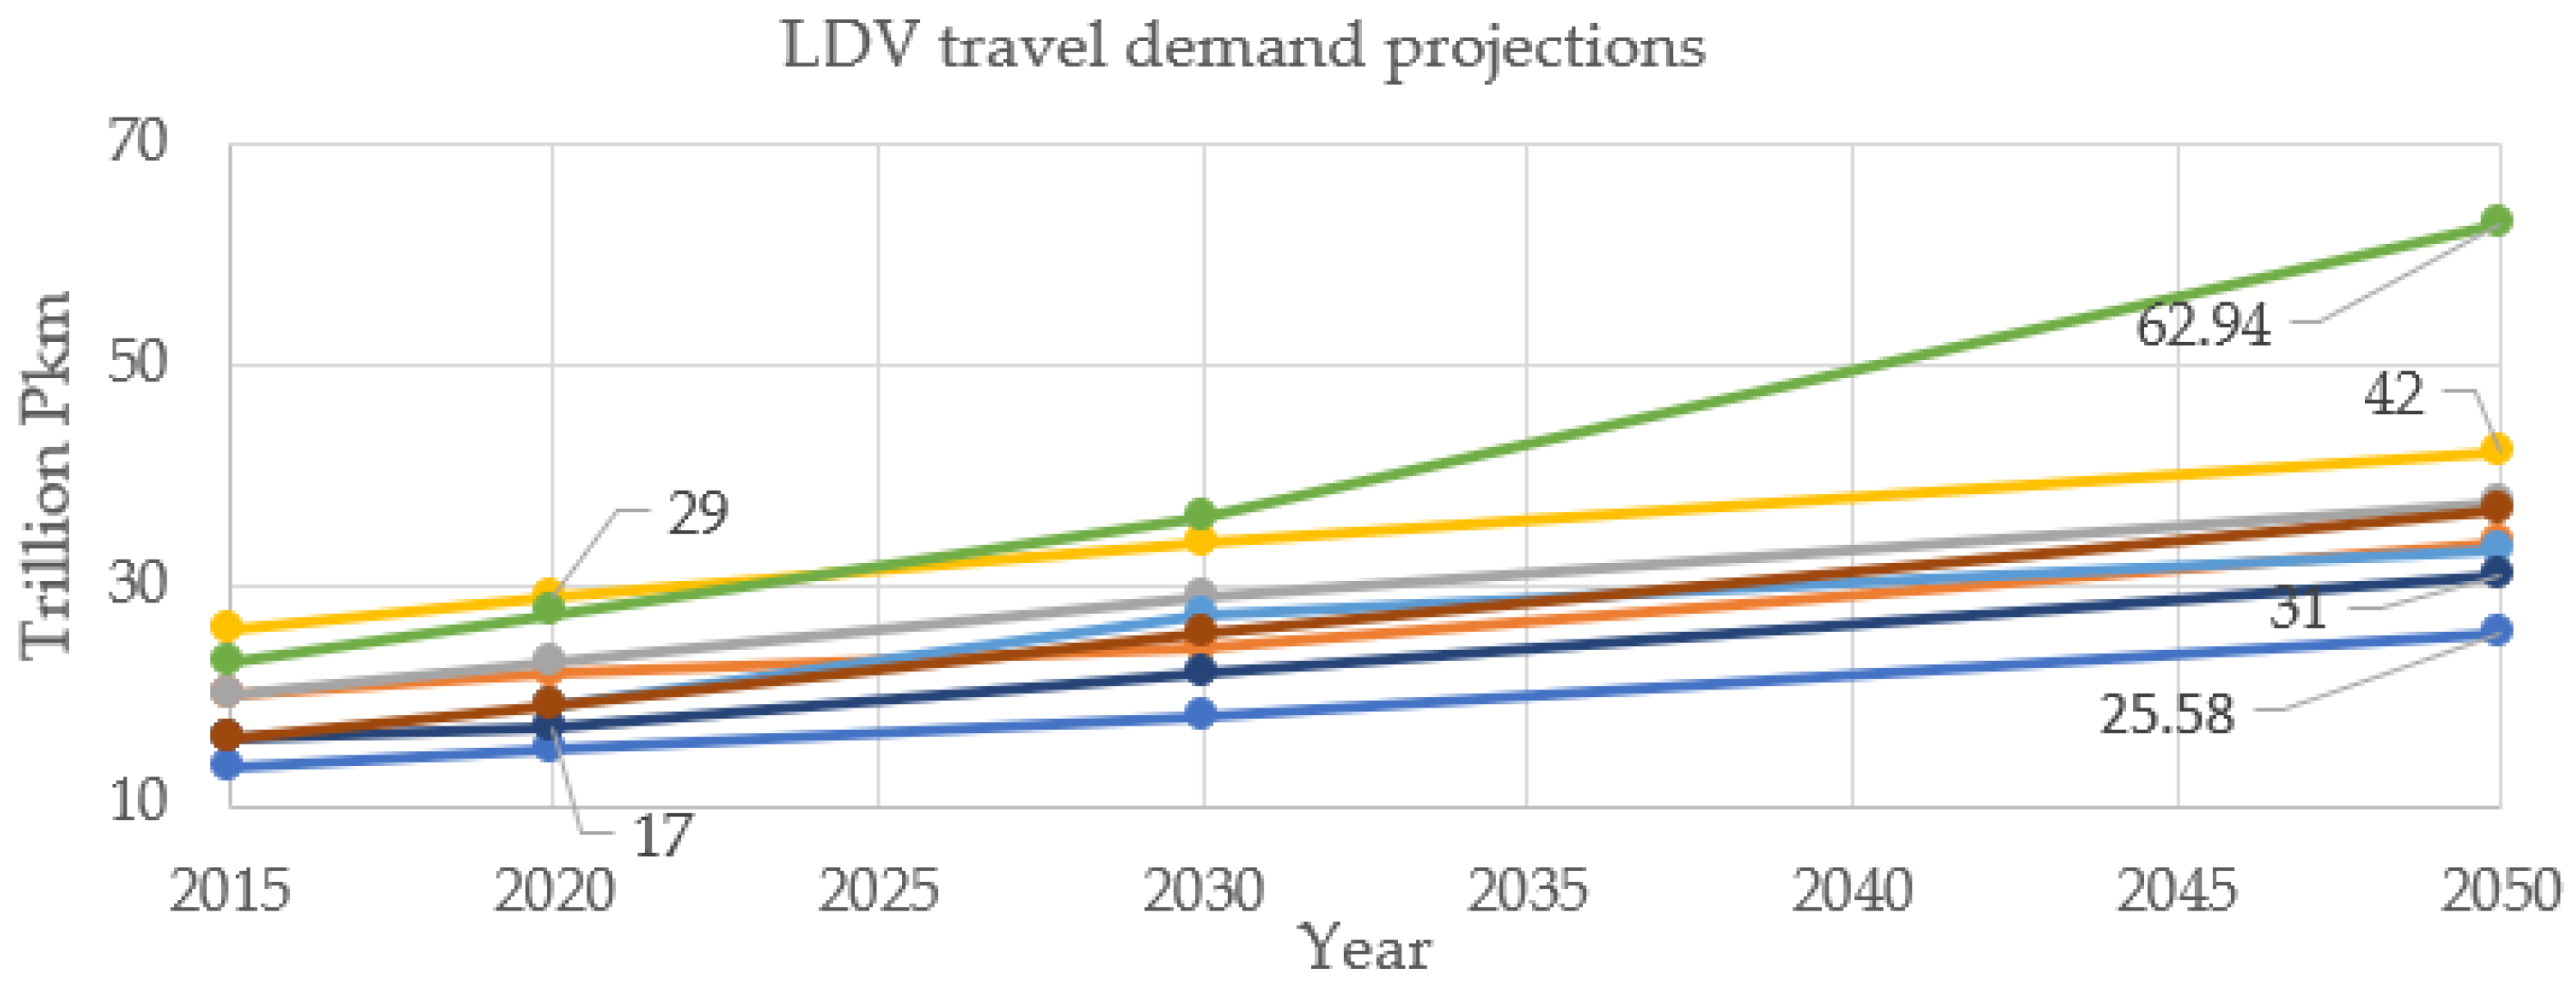
Approximated overall degree of correlation (%) between population, GDP, car production and sales predictions, and predictions for the LDVs’ travel demand from 2015 to 2050 (2015, 2020, 2030, 2050).
LN/EXP LDV Production and Sales (Including GDP, Population) Predictions Versus LDV Travel Demand Predictions
[52][53][54,55][56][57][58][59][60]
100/10099/99100/99100/9996/9499/100100/100100/100
Table 6. Worst-case scenario (WCS) and best-case scenario (BCS) predictions for solar and wind RESs’ generation in TWh.
YearWCSBCS
202025003500
2030800016,000
205016,50040,000
Table 7. Projected decrease in demand for materials (%) from 2020 to 2050.
YearLiNiCoPt
20200.15% 0.13% 0.25% 0.01%
20306% 5% 8% 6%
204020% 22% 30% 20%
205030% 32% 42% 50%
Table 8. Estimated and projected rate of adoption per battery chemistry in EVs (%), assuming no Li-S or Li-Air market penetration for the 2020–2030 period.
YearNMCLFPNCA
2018 [83]45% 15% 39%
2019 [83]53% 3% 43%
2020 [83]58% 0% 42%
2025 [83]64% 0% 36%
2030 [14]72% 0% 28%
Table 9. Battery capacity per vehicle (kWh) estimations and predictions for the 2020–2050 period.
Scenario and YearHEVPHEVBEVFCV
BAU-LN 20201.41044.41.5
BAU 20301.511461.5
BAU 20501.512501.5
LN 20301.711.2511.7
LN 205021367.62
Table 10. Vehicle market share (%) estimations and predictions for the 2020–2050 period.
Scenario and YearICEVHEVPHEVBEVFCV
BAU [23] 202091.67.21.1640.0010
BAU [23] 203087.69.52.9240.0010
BAU [23] 20508410.85.2170.0010
S-HEV [23] 202080.319.20.5010.0010
S-HEV [23] 203053.546.10.3340.0010
S-HEV [23] 20500100000
S-PHEV [23] 202080.34.914.78600
S-PHEV [23] 203053.53.343.19100
S-PHEV [23] 20500010000
S-EV [23] 202080.34.90.50114.2870
S-EV [23] 203053.53.30.33442.4580
S-EV [23] 20500001000
Base [25] 202082.7121.240.1
Base [25] 203033.955380.1
Base [25] 20500.5102059.510
Alt. 1 [25] 202082.7121.240.1
Alt. 1 [25] 203017.94715200.1
Alt. 1 [25] 20500001000
Alt. 2 [25] 202082.7121.240.1
Alt. 2 [25] 2030164715202
Alt. 2 [25] 205000152065
Scenario [27] 202088.56.5320
Scenario [27] 20306818.57.551
Scenario [27] 205045.519.518116
HER av. NMC [14] 202076.61319.1530.9543.180.1
HER av. NMC [14] 203056241.765.86512.375
HER av. NMC [14] 205029.729.79.36231.2070.031
HER av. Li-Air [14] 202076.68519.1720.9333.110.1
HER av. Li-Air [14] 203056241.7215.73512.544
HER av. Li-Air [14] 205029.729.79.15630.5190.925
LER av. NMC [14] 202076.61319.1530.9543.180.1
LER av. NMC [14] 203049211.4964.98523.519
LER av. NMC [14] 205015.56515.5653.67112.23752.962
LER av. Li-Air [14] 202076.68519.1720.9333.110.1
LER av. Li-Air [14] 203049211.4634.87523.662
LER av. Li-Air [14] 205015.56515.5653.8112.752.36
Alt. = alternative case, HER = high exploitation rate, LER = low exploitation rate, av. = average.
Table 11. Demand in raw materials (in kg Ni, Li, Co, and g Pt per vehicle) for the BAU and LN battery capacity scenarios based on battery chemistry in 2020, 2030, and 2050.
Scenario and YearBattery ChemistriesRaw MaterialsHEVPHEVBEVFCV
BAU-LN 202058% NMC—42% NCANi0.817745.84125.934040.87615
BAU 203072% NMC—28% NCA0.80165.878424.58240.8016
100% NMC0.65254.78520.010.6525
100% Li-Air0000
BAU 205072% NMC—28% NCA0.80166.412826.720.8016
100% NMC0.65255.2221.750.6525
100% Li-Air0000
LN 203072% NMC—28% NCA0.908485.9852827.25440.90848
100% NMC0.73954.87222.1850.7395
100% Li-Air0000
LN 205072% NMC—28% NCA1.06886.947236.125441.0688
100% NMC0.875.65529.4060.87
100% Li-Air0000
BAU-LN 202058% NMC—42% NCALi0.2502921.78787.9378320.26817
BAU 203072% NMC—28% NCA0.245281.798727.521920.24528
100% NMC0.19951.4636.1180.1995
100% Li-Air0.2041.4966.2560.204
BAU 205072% NMC—28% NCA0.245281.962248.1760.24528
100% NMC0.19951.5966.650.1995
100% Li-Air0.2041.6326.80.204
LN 203072% NMC—28% NCA0.2779841.8314248.339520.277984
100% NMC0.22611.48966.7830.2261
100% Li-Air0.23121.52326.9360.2312
LN 205072% NMC—28% NCA0.327042.1257611.053950.32704
100% NMC0.2661.7298.99080.266
100% Li-Air0.2721.7689.19360.272
BAU-LN 202058% NMC—42% NCACo0.3433362.452410.888660.36786
BAU 203072% NMC—28% NCA0.405242.9717612.427360.40524
100% NMC0.483.5214.720.48
100% Li-Air0000
BAU 205072% NMC—28% NCA0.405243.2419213.5080.40524
100% NMC0.483.84160.48
100% Li-Air0000
LN 203072% NMC—28% NCA0.4592723.02579213.778160.459272
100% NMC0.5443.58416.320.544
100% Li-Air0000
LN 205072% NMC—28% NCA0.540323.5120818.262820.54032
100% NMC0.644.1621.6320.64
100% Li-Air0000
BAU-LN 2020–2050 -Pt00046
Table 12. Estimated demand in gasoline (billion LGE) in 2020, 2030, and 2050 and in RES energy (TWh) in 2050.
DemandYearWCS (High)BCS (Low)
Gasoline 20201923.741190
20302168.71320
20502517.681240
RES energy 20509834.6884843.75
Table 13. Supply (resources) for LDVs’ storage and energy (fuel/electricity) available by 2050.
Supply UnitTypeWCS (Low)BCS (High)
Storage for EVsMillion tonsNi13.4942.6
Li11.4446.28
Co16.579.2
Resources for FCVKilotonsPt16.523.5
Energy for ICEV/HEVBillion LGEGasoline73,440
Energy for PHEV/BEVTWhRES solar + wind16,50040,000
Table 14. DSR (%) determinations for the current scenarios for the 2020–2050 period.
Scenario Nickel WCS/BCSLithium WCS/BCSCobalt WCS/BCSPlatinum WCS/BCSGasoline WCS/BCSRES Solar Wind WCS
BAU [23] 9.6/2.53.5/0.74/0.70/091/526.65
S-HEV [23] 19.3/4.37/1.28/1.20/094/53.40.5
S-PHEV [23] 121/31.843.7/950/8.60/038.6/23.6114
S-EV [23] 601/132217/37247/360/038.6/23.6113.7
Base [25] 321/67.6116/19132/18.346.2/27.458/3570
Alt. 1 [25] 529/112191/31.5218/30.30.64/0.4343.6/26.7103
Alt. 2 [25] 200/4872/13.482.2/12.8306/18243.6/26.754.7
Scenario [27] 95/21.934.3/6.239/5.932.1/19.475.5/43.533.4
HER NMC [14]146/31.352.7/8.886.8/12.159.3/39.870.9/4138
HER Li-Air [14]4.3/1.452.7/8.81.5/0.364.2/42.870.9/4137.1
LER NMC [14]76.9/17.327.7/4.945/6.6354/21856.7/33.418.7
LER Li-Air [14]4.3/1.428.8/51.5/0.3352/21756.7/33.419
Table 15. Vehicle market share (%) for the two novel scenarios for the 2020–2050 period.
Scenario and YearICEVHEVPHEVBEVFCV
I Li-Air 202076.619.113.20.1
I Li-Air 203044.520.113.518.53.4
I Li-Air 205013.520.325.4373.8
II NMC-NCA 202076.619.113.20.1
II NMC-NCA 203049219516
II NMC-NCA 205015.615.62212.234.6
Table 16. DSR (%) determinations for the two novel scenarios for the 2020–2050 period.
Scenario Nickel WCS/BCSLithium WCS/BCSCobalt WCS/BCSPlatinum WCS/BCSGasoline WCS/BCSRES Solar Wind WCS
I Li-Air 4.43/1.480.6/14.21.52/0.333.7/21.255.2/32.472.4
II NMC-NCA 111.2/25.740.2/7.240.1/7~0/~0 *56.7/33.438
* DSR is almost 0 for no Pt PCVs. If under current conditions (46 g Pt per vehicle), then DSR = 234/145.
Table 17. Global Warming Potential (GWP) expressed in kgCO2 e/km, Pollution Abatement Costs (PAC) in EUR/km, and Gasoline, Electricity, and Hydrogen (GEH) consumption in LGE/km, kWh/km, and, respectively, Liter of Hydrogen/km for various LDV powertrains, based on estimations, forecast, and assumptions, for the 2020–2050 period.
Impact and YearICEVHEVPHEVBEVBEV Clean *FCV
GWP 20200.220.20.180.150.040.15
GWP 20300.190.180.160.130.030.14
GWP 20500.1450.140.120.10.020.13
PAC 2020–20500.0470.0410.0420.036-0.046
GEH 2020 **6.55.52117-7
GEH 2030 **4.233.76321916-6
GEH 2050 **3.05762.3521612.5-5
* Based only on solar and wind RES energy, ** LGE/km for ICEV and HEV, kWh/km for PHEV (electric) and BEV, Liter of Hydrogen/km for FCV.
Table 18. Population projections.
Link–YearExtrapolation *ParametersValuesUncertainty—Confidence Interval
[35]–2004NonlinearFertility, life expectancyL to HMortality—80–95%
[36]–2015Almost linearGDP, growth rateLNot assessed
[37]–2006UnknownFertility, growth rate, life expectancyMNot assessed
[38]–2020UnknownFertilityM-HNot assessed
[39]–2017NonlinearFertility, growth rate, life expectancyMNot assessed
[40]–2019NonlinearFertility-mortality, growth rate-ageing, migrationM to HFertility, mortality, migration—95%
[41]–2017NonlinearFertility, growth rate, life expectancy, educationMNot assessed
[42]–2021NonlinearFertility, life expectancyMFertility, ageing, stagnation—0–95%
This studyNonlinearFertility, life expectancy, growth rate, mortalityM to HMigration, fertility, ageing—90–95%
* Based on current trends, L = low-, M = medium-, H = high-valued predictions.
Table 19. GDP projections.
Link–YearExtrapolation *ParametersValuesUncertainty—Confidence Interval
[36]–2015Almost linearGrowth rate, capital, populationLPopulation decline—none
[37]–2006UnknownGrowth rate, production–consumptionL-MGlobal public policies—none
[43]–2012NonlinearGrowth rate, capital, education, energy–productivityMEnergy price—none
[44]–2015NonlinearCapital, education, population, energy–productivityMGeopolitical context—none
[45]–2018UnknownCapital, income, population, and employment dataMNot assessed
[46]–2022UnknownEnergy transitionLNot assessed
[47]–2017NonlinearInvestment opportunitiesHNot assessed
[48]–2021NonlinearGrowth rate, environment scoresM-HNot assessed
[49]–2021LinearUnknownMUnknown
This studyNonlinearCapital, population, energy–productivityL to HEducation, energy price—95%
* Based on current trends, L = low-, M = medium-, H = high-valued predictions by comparison.
Table 20. LDV sales and production projections.
Link–YearExtrapolation *ParametersValuesUncertainty—Confidence Interval
[14]–2021NonlinearPopulation, GDP, travel demandM to HVehicle market share—80–95%
[23]–2016NonlinearPopulation, income, vehicle market shareL-MFuel economy, behavior—none
[24]–2019NonlinearFuel economy **L to MNot assessed
[25]–2018Almost linearVehicle market share, purchase probability ***MNot assessed
[27]–2012NonlinearPopulation, GDPHNot assessed
This studyNonlinearPopulation, GDP, energy–materials dependencyL to HVehicle market share, prices—95%
* Based on current trends, L = low-, M = medium-, H = high-valued predictions when compared to our predictions (this study), ** Based on Chinese and *** U.K. vehicle market reports.
Table 21. LDV travel demand projections.
Link–YearExtrapolation *ParametersValuesUncertainty—Confidence Interval
[52]–2017Almost linearGDP, population, travel preferencesLEconomic growth—none
[53]–2018UnknownUnknownMNot assessed
[54]–2017UnknownGDP, population, travel preferences, technologyMNot assessed
[55]–2004LinearTravel preferencesMNot assessed
[56]–2012NonlinearGrowth rate, travel preferencesM-HNot assessed
[57]–2015NonlinearGrowth rateMFuel prices—none
[58]–2019Almost linearGDP, populationHNot assessed
[59]–2020Almost linearUnknownL-MNot assessed
[60]–2018NonlinearPopulation, travel preferencesMNot assessed
This studyNonlinearGDP, population, growth rate, technologyL to HEconomic growth, prices—90–95%
* Based on current trends, L = low, M = medium, H = high-valued predictions by comparison.
Table 22. Battery capacity data estimations and projections.
Link–YearStudy IntervalVehicle Type (Except ICEV)Estimation (Studies) or Projection (Uncertainty)
[69]–20212012–2019BEVEst.: Based on real data/literature (many studies)
[70]–20222011–2021Almost all *Est.: Based on real data/literature (many studies)
[71]–20202019BEV, PHEV, HEVEst.: Only one study case
[72]–20212021BEV, HEVEst.: Only one study case
[73]–20182013BEV, PHEV, HEVEst.: Only one study case
[74]–20072007BEV, PHEV, HEVEst.: Based on real data/literature (many studies)
[75]–20112007BEV, PHEV, HEVEst.: Based on real data/literature (many studies)
[76]–20192019PHEV, BEVEst.: Based on real data/literature (many studies)
[77]–20222013BEV, PHEV, HEVEst.: Based on real data/literature (a few studies)
[78]–20182017–2025BEV, PHEVPro.: Uncertainty not assessed (based only on 2 years)
[79]-20182015–2016HEVEst.: Only two study cases
[80]-2019UnknownBEV, PHEV, HEVEst.: Based on real data/literature (many studies)
[81]-20212021BEV, PHEV, HEVEst.: only one study case
This study2007–2050Almost all *Est.: Based on literature, Pro.: 80–95% confidence
* FCV is neglected for some years, Est. = estimation, Pro. = projection.
Publisher’s Note: MDPI stays neutral with regard to jurisdictional claims in published maps and institutional affiliations.

