

Abstract
In order to solve the problem of the high cost of coal-based solid waste bulk stacking and paste filling in the large-scale coal electrification base in East NingXia, in this study, fly ash is skillfully used to replace the broken coal gangue as the mixed filling material. As using a jaw crusher for crushing large coal gangue is expensive, and its energy consumption is relatively high, paste filler using fly ash as aggregate is studied through micro and macro test analyses. Using response surface methodology design software, 29 groups of mix proportion schemes are designed to obtain the best mix proportion. In addition, the radar results of slump, slump flow, and comprehensive strength are obtained by the normalization method. According to the radar chart results of the three normalized indexes, the optimal ratio parameters are as follows: the fly ash in solid phase is 79%, the mass of fly ash to the mass of cement (FA/C) is 6:1, the solid mass concentration is 78%, the fly ash to gasification slag is 1:1, and the results show that σ3d = 2.20 MPa, slump = 205 mm, and flow = 199 mm. Taking the solid mass concentration, FA/C, the fly ash content in solid phase, and the coal gangue-to-gasification slag ratio as independent variables, the influence of single-factor and multi-factor interactions of the independent variables are analyzed based on the response surface model. It is found that the solid mass concentration and FA/C have a very significant effect on the early strength. Replacing coal gangue base with fly ash base can effectively reduce the crushing cost and energy consumption and provide low-cost and highly reliable technical reserves for large-scale filling.
1. Introduction
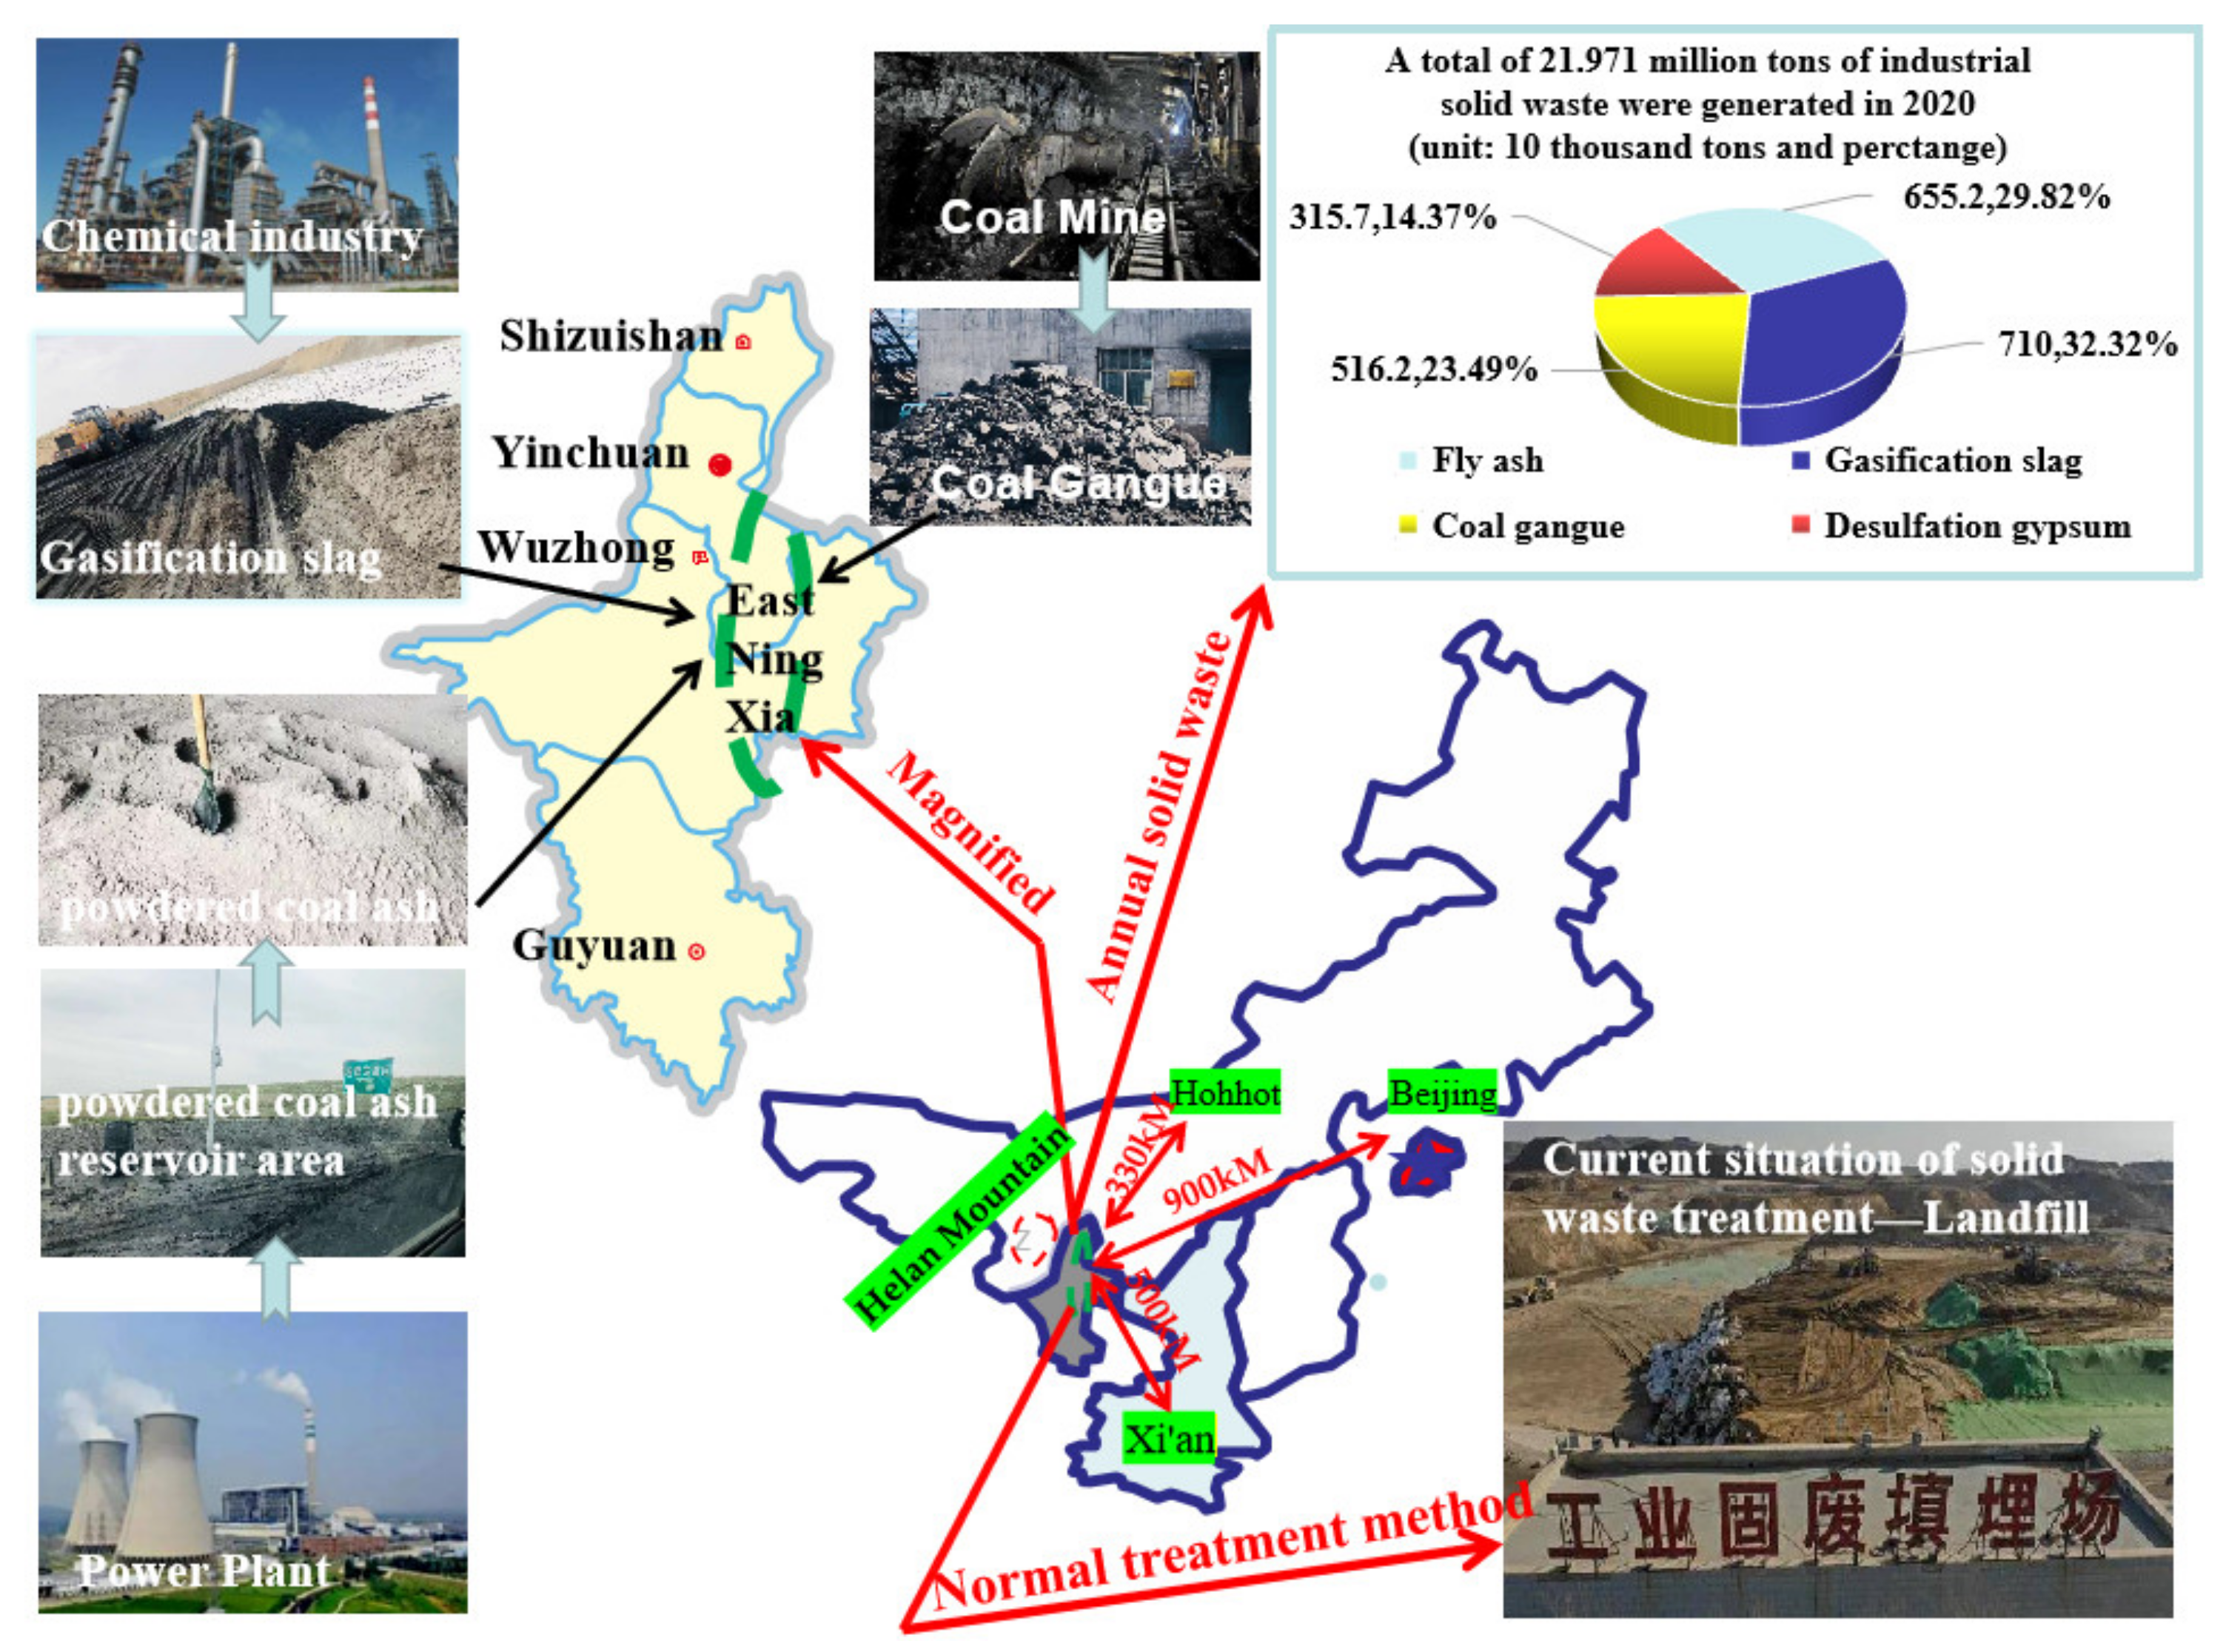
As a major coal producer and consumer, China’s coal-based energy system will not change for a long time [1]. In addition, with the rapid development of China’s coal, chemical, and other industries, more than 3.3 billion tons of industrial solid waste are produced per year. The cumulative stock is more than 60 billion tons, and this number is accelerating [2]. The East NingXia coal and electricity base is one of the 1400 million-ton coal bases. From the perspective of the East NingXia coal and electricity base, with the rapid development of the modern coal chemical industry, the ecological risk level of the coal industry base in East NingXia urgently needs to be effectively controlled [3]. Industrial solid waste—mainly fly ash, gasification slag, coal gangue, desulfation gypsum, and bottom slag—has increased rapidly. Since 2016, the annual increase in solid waste at the East NingXia base has exceeded 10 million tons. In NingXia’s modern coal chemical industry, the solid waste treatment methods are mainly landfill and outbound transportation [4]. Furthermore, the coal-fired thermal power and chemical industry bases in East NingXia (Figure 1), Yulin (Shaanxi), and Ordos (Inner Mongolia) together form the “Golden Triangle” of the national energy and chemical industry [5]. The geographical location is far from the eastern coastal market and more than 100 km away from the surrounding large cities, including Xi’an and Beijing, as shown in Figure 1. In addition, the original storage and new displacement volumes are large, and the market capacity is small [6]. The transportation of coal-based solid waste, such as fly ash, increases costs invisibly. According to the data, transportation around the East NingXia mining area is convenient, so automobile and coal railway transportation can be considered the transportation scheme. On the basis of the comprehensive quota of the auxiliary cost of coal mine shaft construction and roadway engineering in 2015, the cost of automobile waste discharge is 2.5 CNY/(kilometer × ton). The railway construction cost was calculated to be 25 million CNY/kilometer, the railway maintenance cost was calculated to be 2.5% of the initial cost, and the shared cost per ton of solid waste is 0.1 CNY/ton. The material unloading cost was calculated to be 4.3 CNY/ton, and the annual filling material transporting and unloading cost is very high too. According to statistics from the East NingXia base, solid waste production increased from 4.4 million tons in 2010 to 24 million tons in 2020, of which gasification slag production exceeded 7 million tons. Due to the high cost of treatment, the utilization of solid waste such as gasification slag, and technical difficulties, the comprehensive utilization rate of solid waste at the East NingXia base in 2020 was only 43%. The accumulation of a large amount of coal slag not only takes up a lot of land resources but also causes serious environmental problems, such as soil pollution, air pollution, and geological disasters [7]. On the basis of the East NingXia coal and electricity base, traditionally, paste filling can be the first choice because of a lower investment at the early stage, less ground solid stacking, and less surface ecological damage after filling. However, the first option for the coal mine filling gelling agent is cement. The high cement cost not only affects the operation of the coal mine but also restricts the popularization of filling mining technology [8]. Many scholars have conducted research using coal gangue as a filling material. A three-dimensional simulation method for the compaction fracture of crushed rock and coal particles was proposed, and the effects of the strength and size of crushed samples on the fracture characteristics and stress evolution of the crushing model during loading were further discussed [9]. Coal gangue smaller than 20 mm was used as aggregate to prepare downhole filling materials, and the particle gradation, fluidity, and strength of the filling materials were studied. The influence of coal gangue gradation and different raw material content on the fluidity and compressive strength of the filling material by response surface methodology was studied [10]. This study focused on the method of estimating the load and strength of the pillar system, pointed out the main factors for evaluating the stability of the coal pillar, and concluded that the failure criterion of the coal pillar is an important factor for calculating the strength of the coal pillar. According to the statistics, the power consumption of crushing operations accounts for more than 50% of the total power consumption of the concentrator. The total power consumption for crushing operations in the country is more than 2 × 10⁹ [11]. With increases in the crushing cost of coal gangue, the energy consumption becomes larger, and the particle size requirement becomes higher, which is no longer conducive to emission reductions and economic benefits.
Figure 1.
Generation, Stockpiling and geographical location of solid waste in coal–thermal power–chemical industry base in East NingXia.
The microstructure and physicochemical properties of the filler were analyzed by various research methods by examining the proportion of coal-based solid waste filler with fly ash as the aggregate and gasification slag combined with coal gangue. The particle size of fly ash was obtained using a laser particle size analyzer, and the particle size of cement was calculated. The phase and composition of raw materials were analyzed using an X-ray diffractometer. The filler was designed using the response surface methodology with fly ash as the main material and gasification slag and coal gangue as the auxiliary material. Through comparison, the influence of single-factor and multi-factor interaction on the early strength and fluidity of the filler was analyzed considering the influence of solid mass concentration, fly ash content, and other factors on the early strength and other mechanical properties of the filler. The best ratio of fly-ash-based solid waste filler with good fluidity, low cost, and high-strength reliability provides basic parameters for the large-scale utilization of coal-based solid waste in the Eastern NingXia mining area.
2. Analysis on Physical Properties of Solid Waste Filling Material and Experiment Plan Design
2.1. Raw Materials and Their Physical Properties
The gasification slag, fly ash, and coal gangue used in this study were, respectively, taken from East NingXia Base No.1 Waste Slag Reservoir, the coal-to-liquid branch of the National Energy Group NingXia Coal Industry Co., Ltd. (Yinchuan, China), and Renjiazhuang coal mine, a subsidiary of NingXia Coal Industry Group Co., Ltd.
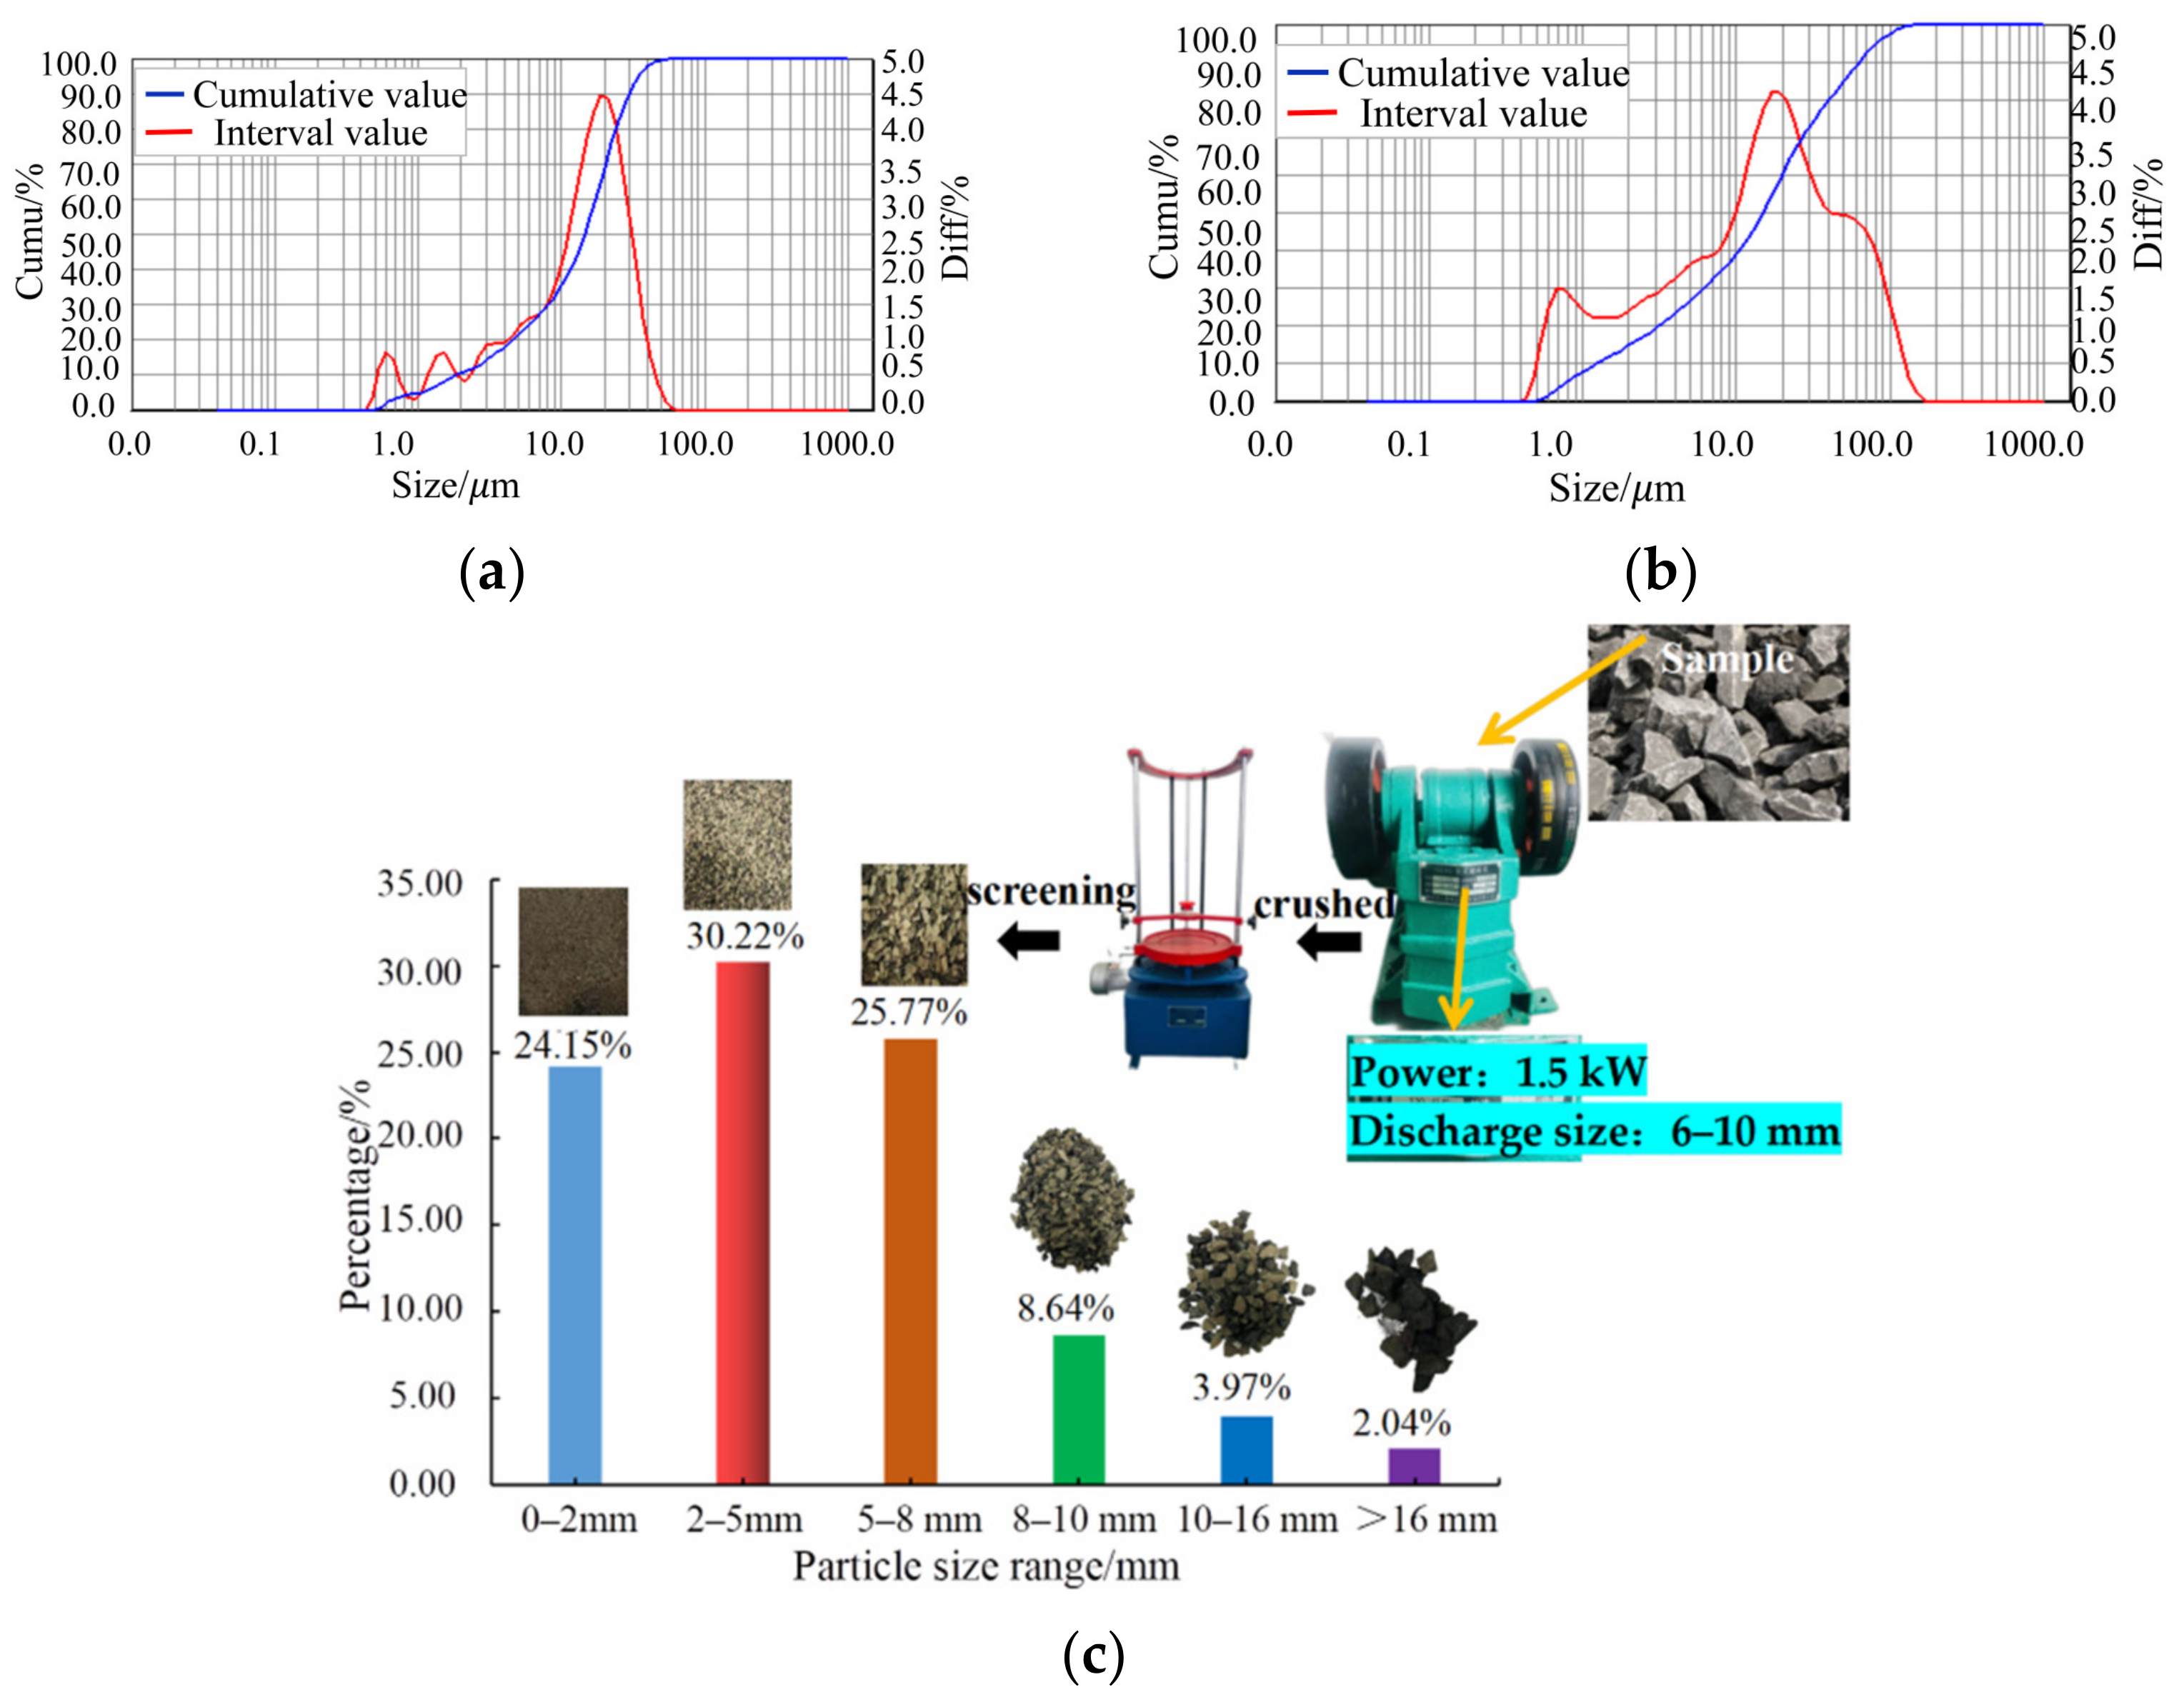
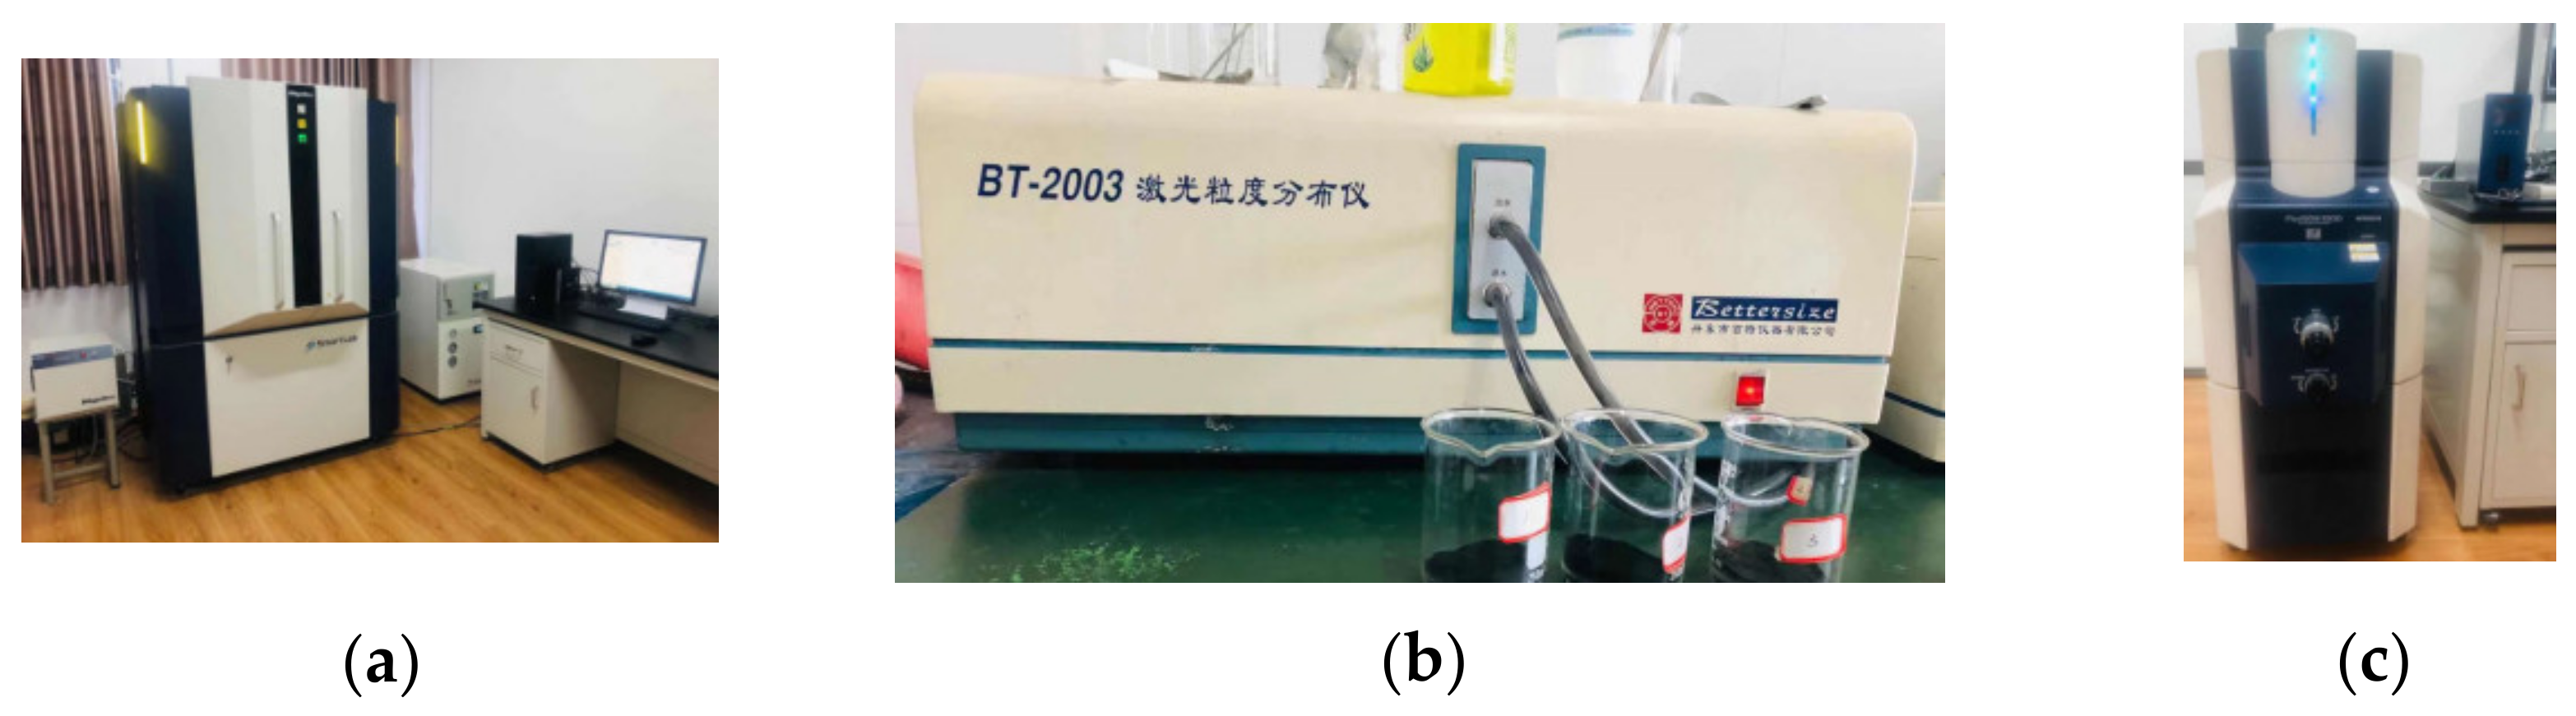
The instrument used for the test was procured from the Analysis and Test Center of the Anhui University of Science and technology, as shown in Figure 2. The parameters of the BT-2003 laser particle size analyzer were as follows: the test range was 0.04–1000 μm, the reproducibility was <1%, and the sampling speed was 3500 times/s. The parameters of the Smartlab X-ray diffractometer were as follows: power was 3 kW, minimum step diameter was 0.0001°, and goniometer radius was 300 mm. The parameters of the FlexSEM 1000 scanning electron microscope (SEM) were as follows: the acceleration voltage was 0.3–20 kV, the resolution was 4 nm, and the magnification was 6–300,000×. The main mineral phase of the cement was calcium silicate, followed by tricalcium silicate, which determined its early strength. In addition, the particle size distribution was measured using a laser particle size analyzer, and the result is shown in Figure 3a. The main particle size of the cement used was less than 100 μm. The particles with a particle size of 10–40 μm accounted for the majority, and the particles were relatively fine.
Figure 2.
Micro testing instrument for multi-source coal based solid waste. (a) SmartLab X-ray diffractometer; (b) laser particle size analyzer; (c) SEM instrument.
Figure 3.
The particle size test results and process of proportioning raw materials. (a) Distribution curve of cement particle size; (b) distribution curve of fly ash particle size; (c) statistical diagram of coal gangue crushing and particle size distribution.
2.1.1. Fly Ash
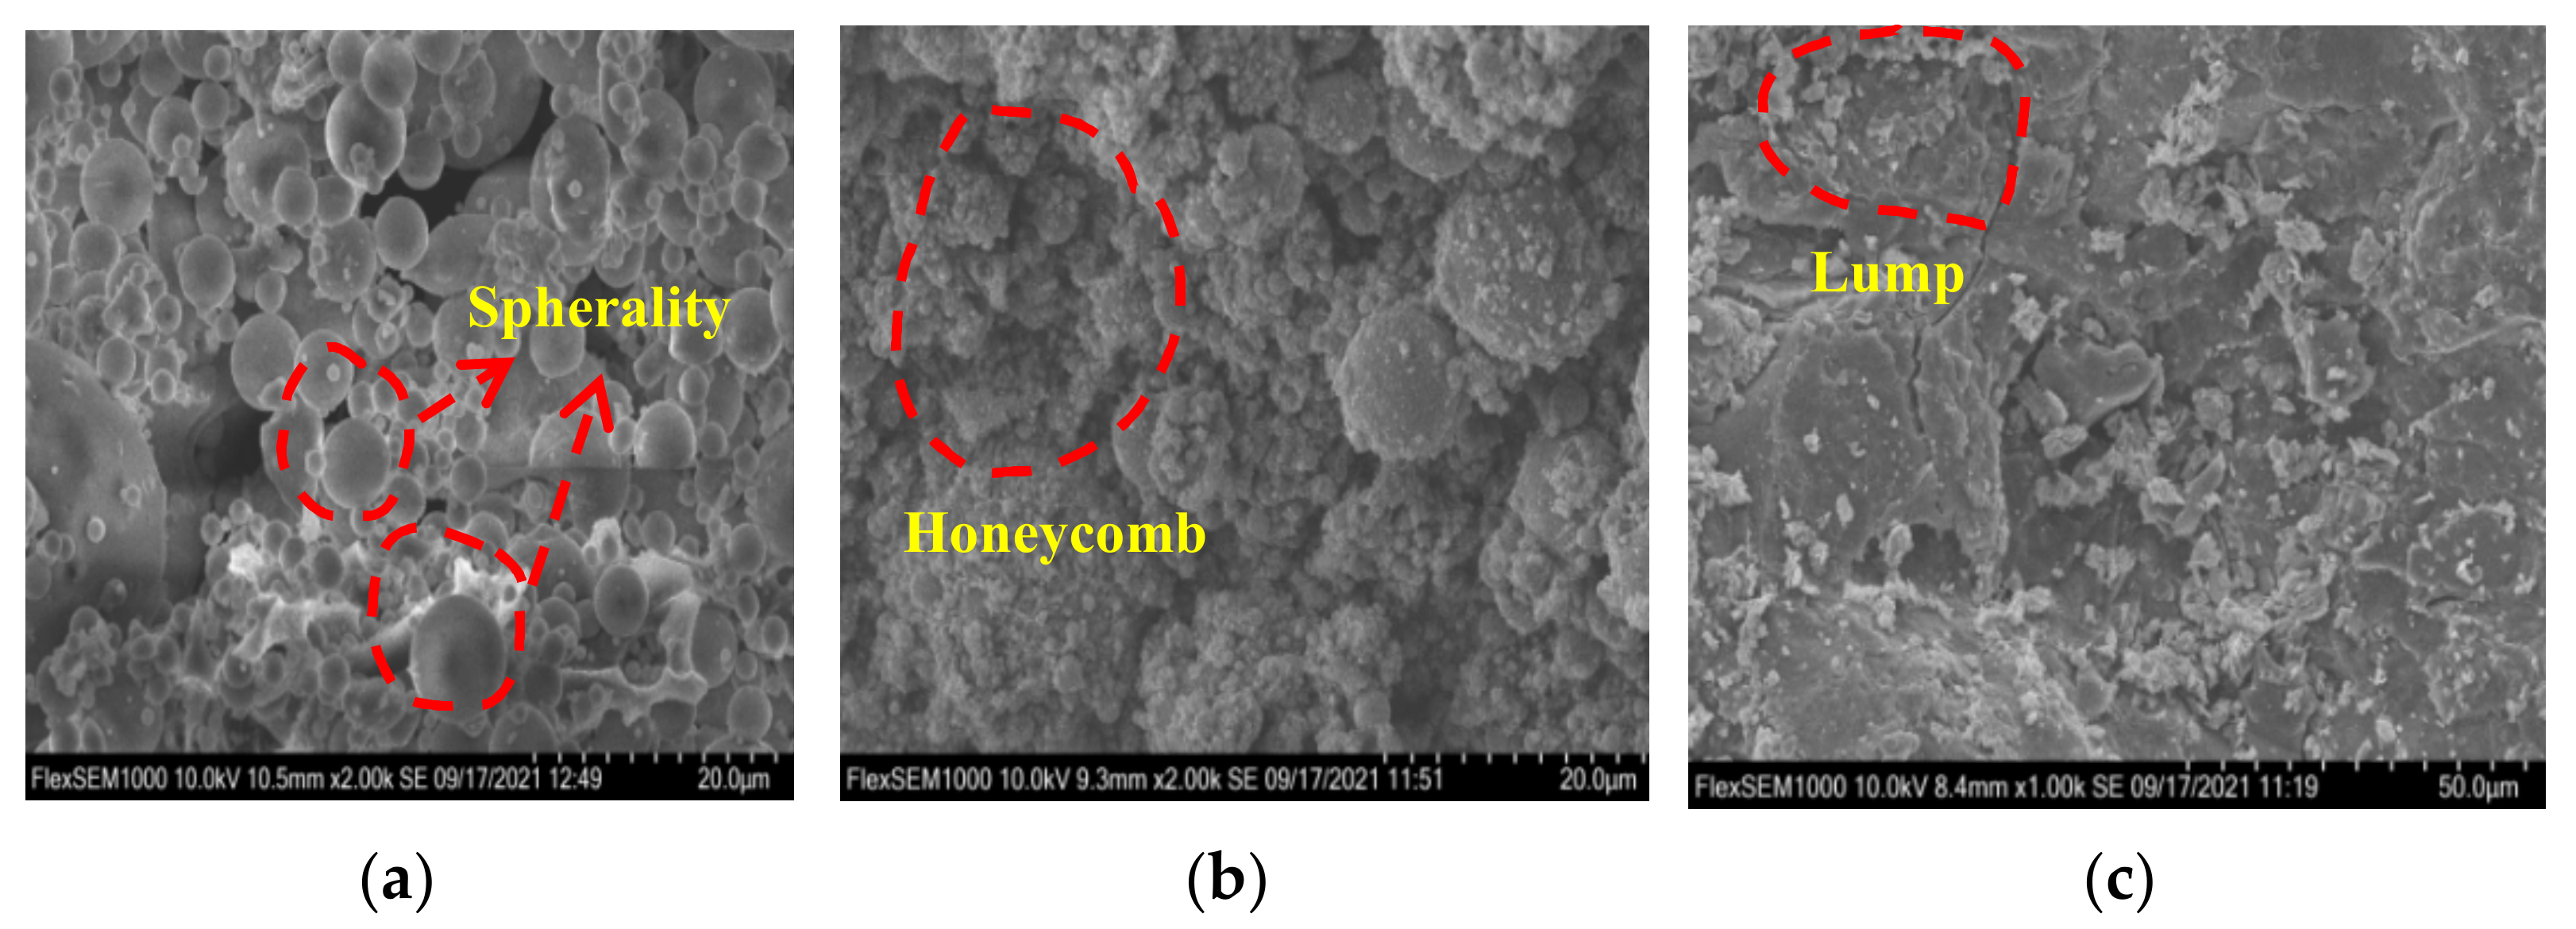
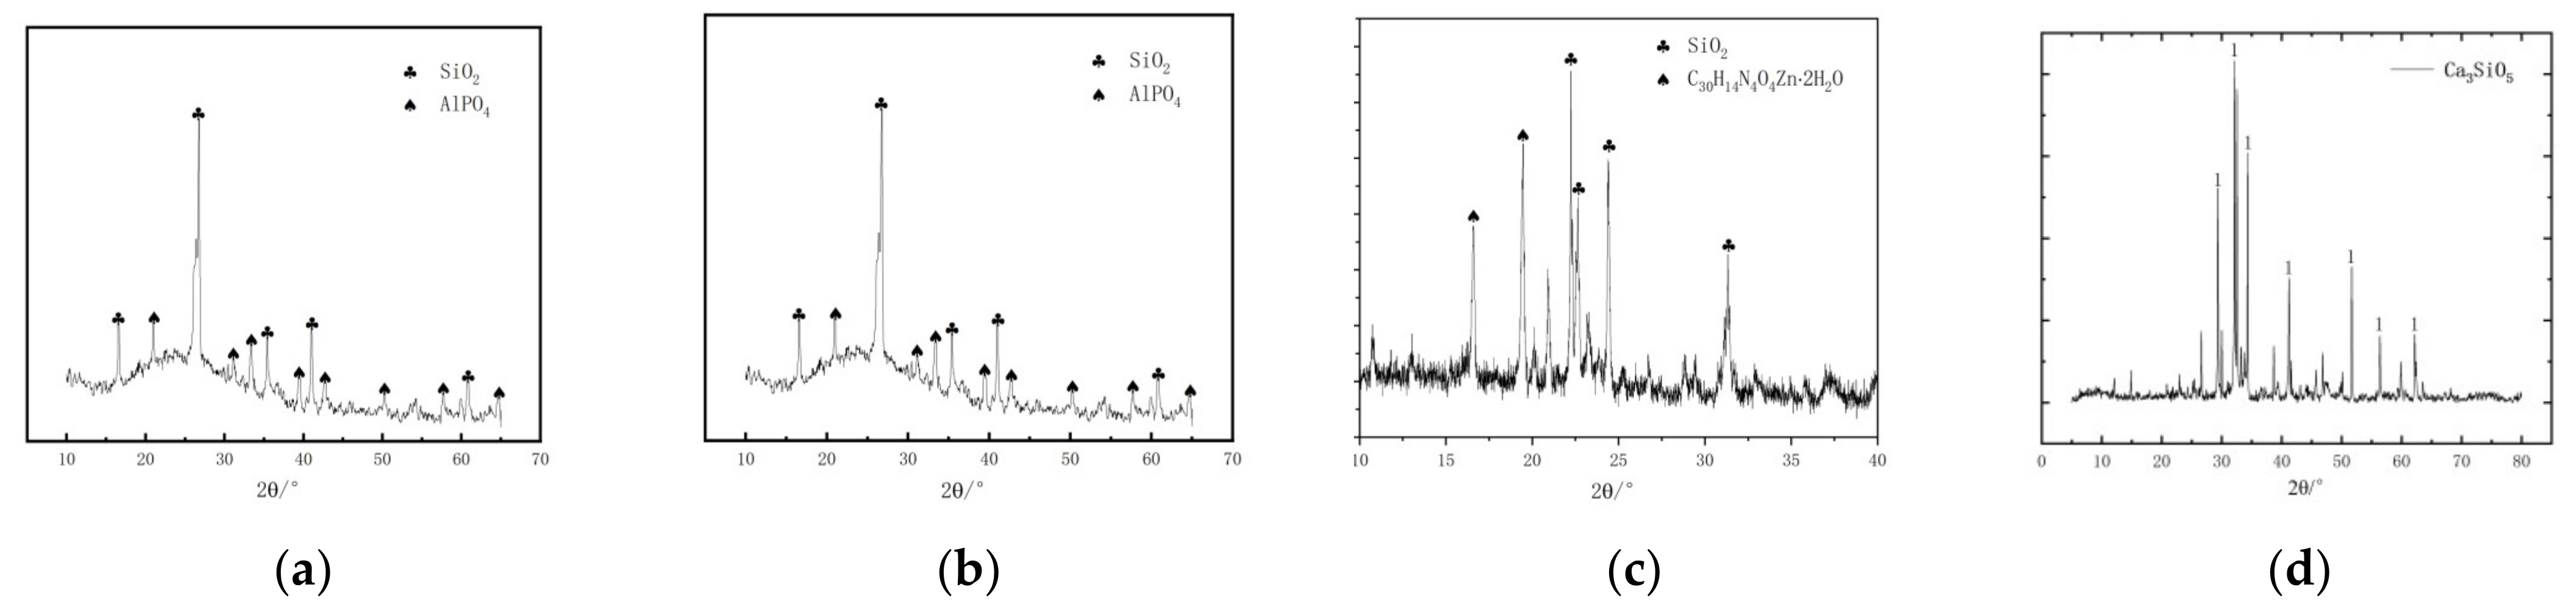
As a coal-based solid waste, fly ash is high-quality external ash with small particle size. Its particle size distribution was measured using a laser particle size analyzer. The fly ash particle size distribution curve is shown in Figure 3. The main microscopic morphology of fly ash is shown in Figure 4a. The fly ash mainly comprised particles with a particle size of less than 200 μm. The majority of particles were of size 10–80 μm. The use of aggregates was beneficial to improve the early strength of the filling body. The analysis of fly ash using X-ray diffraction (XRD) is shown in Figure 5a. It was mainly composed of spherical states with different particle sizes, but the difference in particle size was small. Adjacent spherical particles overlapped and had a better encapsulation effect on large-size aggregates.
Figure 4.
SEM scanning of solid wastes in the coal–electricity–chemical process. (a) Fly ash; (b) gasification slag; (c) coal gangue.
Figure 5.
X-ray diffraction (XRD) patterns of filling materials. (a) Fly ash; (b) coal gangue; (c) gasification slag; (d) cement.
2.1.2. Gasification Slag
As a product of coal chemical utilization, gasification slag is the waste residue produced by coal gasification reaction at high temperatures. The microstructure of lead was observed using an SEM (Figure 4b). Using XRD analysis (Figure 5c), it was concluded that the main chemical composition of the gasification slag was quartz, besides lead arsenate. The particles mainly existed in an irregular honeycomb state, with large differences in particle size. Therefore, it was concluded that as the content of gasification slag increases. When other factors were the same, the strength of the consolidated product decreased.
2.1.3. Coal Gangue
The coal gangue used in this study was taken from the Renjiazhuang coal mine. It was in the form of a gray-black block. The experiment used a two-stage jaw crusher (Figure 3c) to crush the coal gangue to a maximum particle size of 16 mm. Then, 5 kg of the randomly collected gangue was crushed by the sieve analysis method and screened using a standard vibrator. The particle size distribution of coal gangue after crushing was obtained. The statistical distribution is shown in Figure 3c [12]. Scanning using an SEM (Figure 4c) showed that the microscopic morphology comprised blocks of different sizes, and the pores between adjacent blocks were relatively large. Meanwhile, the method specified in the standard for test methods of Geotechnical Engineering (GB/T50123-2019) was used as the benchmark. The main chemical component was kaolinite, accompanied by quartz. The XRD analysis findings are shown in Figure 5b.
The cement used was ordinary 42.5 Portland cement. Figure 5d shows the XRD analysis of the cement [13].
The optimization idea of using fly-ash-based filler instead of crushed coal gangue-based filler was put forward. The energy consumption of coal gangue in the laboratory was estimated. For this, 15 kg crushed coal gangue was selected, and the experiment was completed in 30 min. On the basis of the crusher nameplate information in Figure 3, the power of the two-stage jaw crusher was 1.5 kW; thus, the total energy consumption this time was 0.45 . According to the industrial electricity price of RMB 1 per day, the laboratory needed to consume RMB 0.75 to crush 15 kg coal gangue. It was estimated that the crushing cost of coal gangue was increased by at least RMB 50 per ton.
2.2. Proportion Optimization Experiment Plan
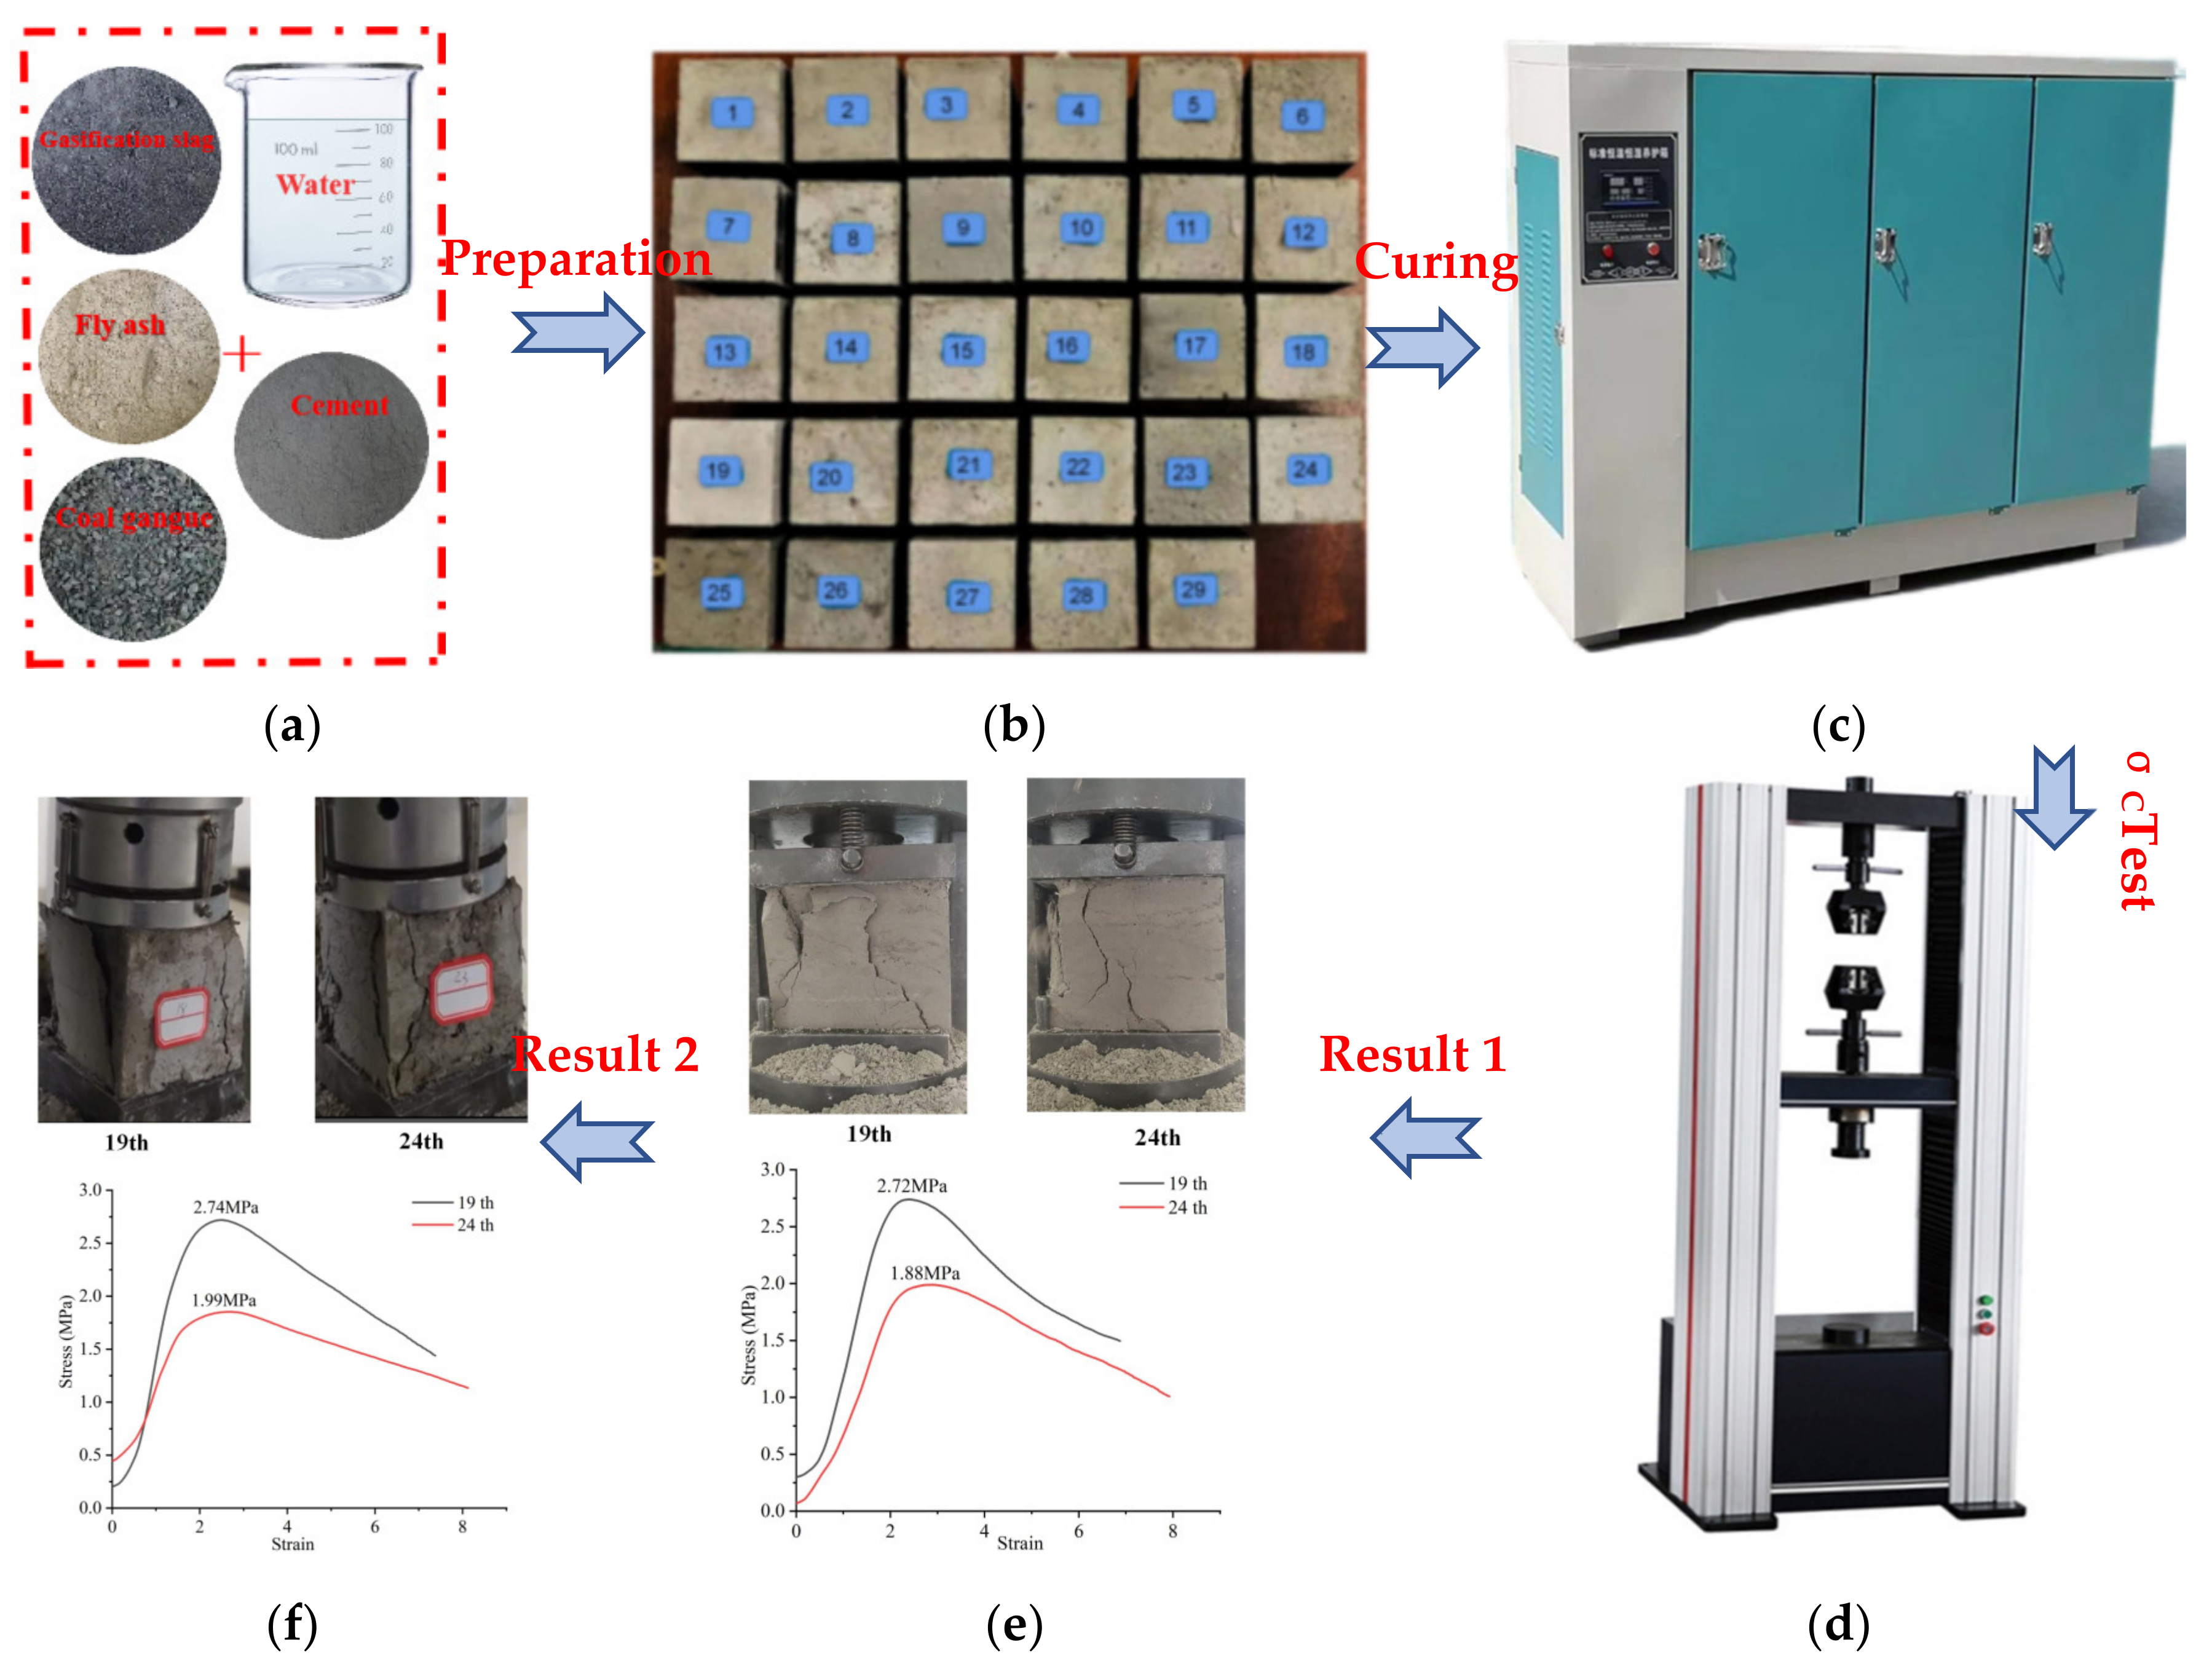
The results of the optimized filling test scheme were deeply analyzed by microanalysis, probability analysis, and response surface methodology to obtain a low-cost and highly reliable coal-based solid waste filling material ratio scheme, referring to the requirements of the concrete strength test standard [14]. In the experiment, a triple mold with a length × width × height of 70.7 × 70.7 × 70.7 mm3 (Figure 6a) was used. The fly ash was used as the aggregate, gasification slag was added, and two kinds of solid waste coal gangue were mixed and stirred evenly for 180 s to form a specimen of 70.7 × 70.7 × 70.7 mm3 (Figure 6b). The test blocks were placed in a box with constant temperature and humidity (temperature of 20 °C and humidity of 95%) (Figure 6c) [15]. The blocks were taken out after reaching the age of 3 and 7 days. The early compressive strength test of the specimens was completed on an automatic compression test machine (Figure 6d–f).
Figure 6.
Making and uniaxial compression test of paste filling material specimens. (a) Triple mold; (b) test block; (c) curing box; (d) pressure machine; (e) σc of 3 d age; (f) σc of 7 d age.
By reading relevant documents, combined with the characteristics of large coal-based solid waste storage yards in the mining area of the eastern base of NingXia [16]. These characteristics mainly included fly ash, gasification slag, and coal gangue. Considering the cost of the bulk crushing of coal gangue and the performance requirements of coal-based solid waste fillers, coal gangue with particle size less than or equal to 16 mm after crushing was adopted [17]. Using fly ash as the aggregate, the experimental factors and levels were obtained, as shown in Table 1.
Table 1.
Factors and gradients based on response surface design.
A design based on the Box–Behnken design (BBD) method of response surface methodology (RSM) was used for the factors affecting the performance of the filling body, as shown in Table 1. Different gradient-based numerical arrangements were made for the four design factors to get a more in-depth and rigorous experimental scheme. By designing the influencing factors and gradients of filling material performance, the quality of fly ash and cement was simplified to FA:C.
3. Analysis of Experimental Results Based on Response Surface Methodology
3.1. Early Strength Analysis of Filling Material
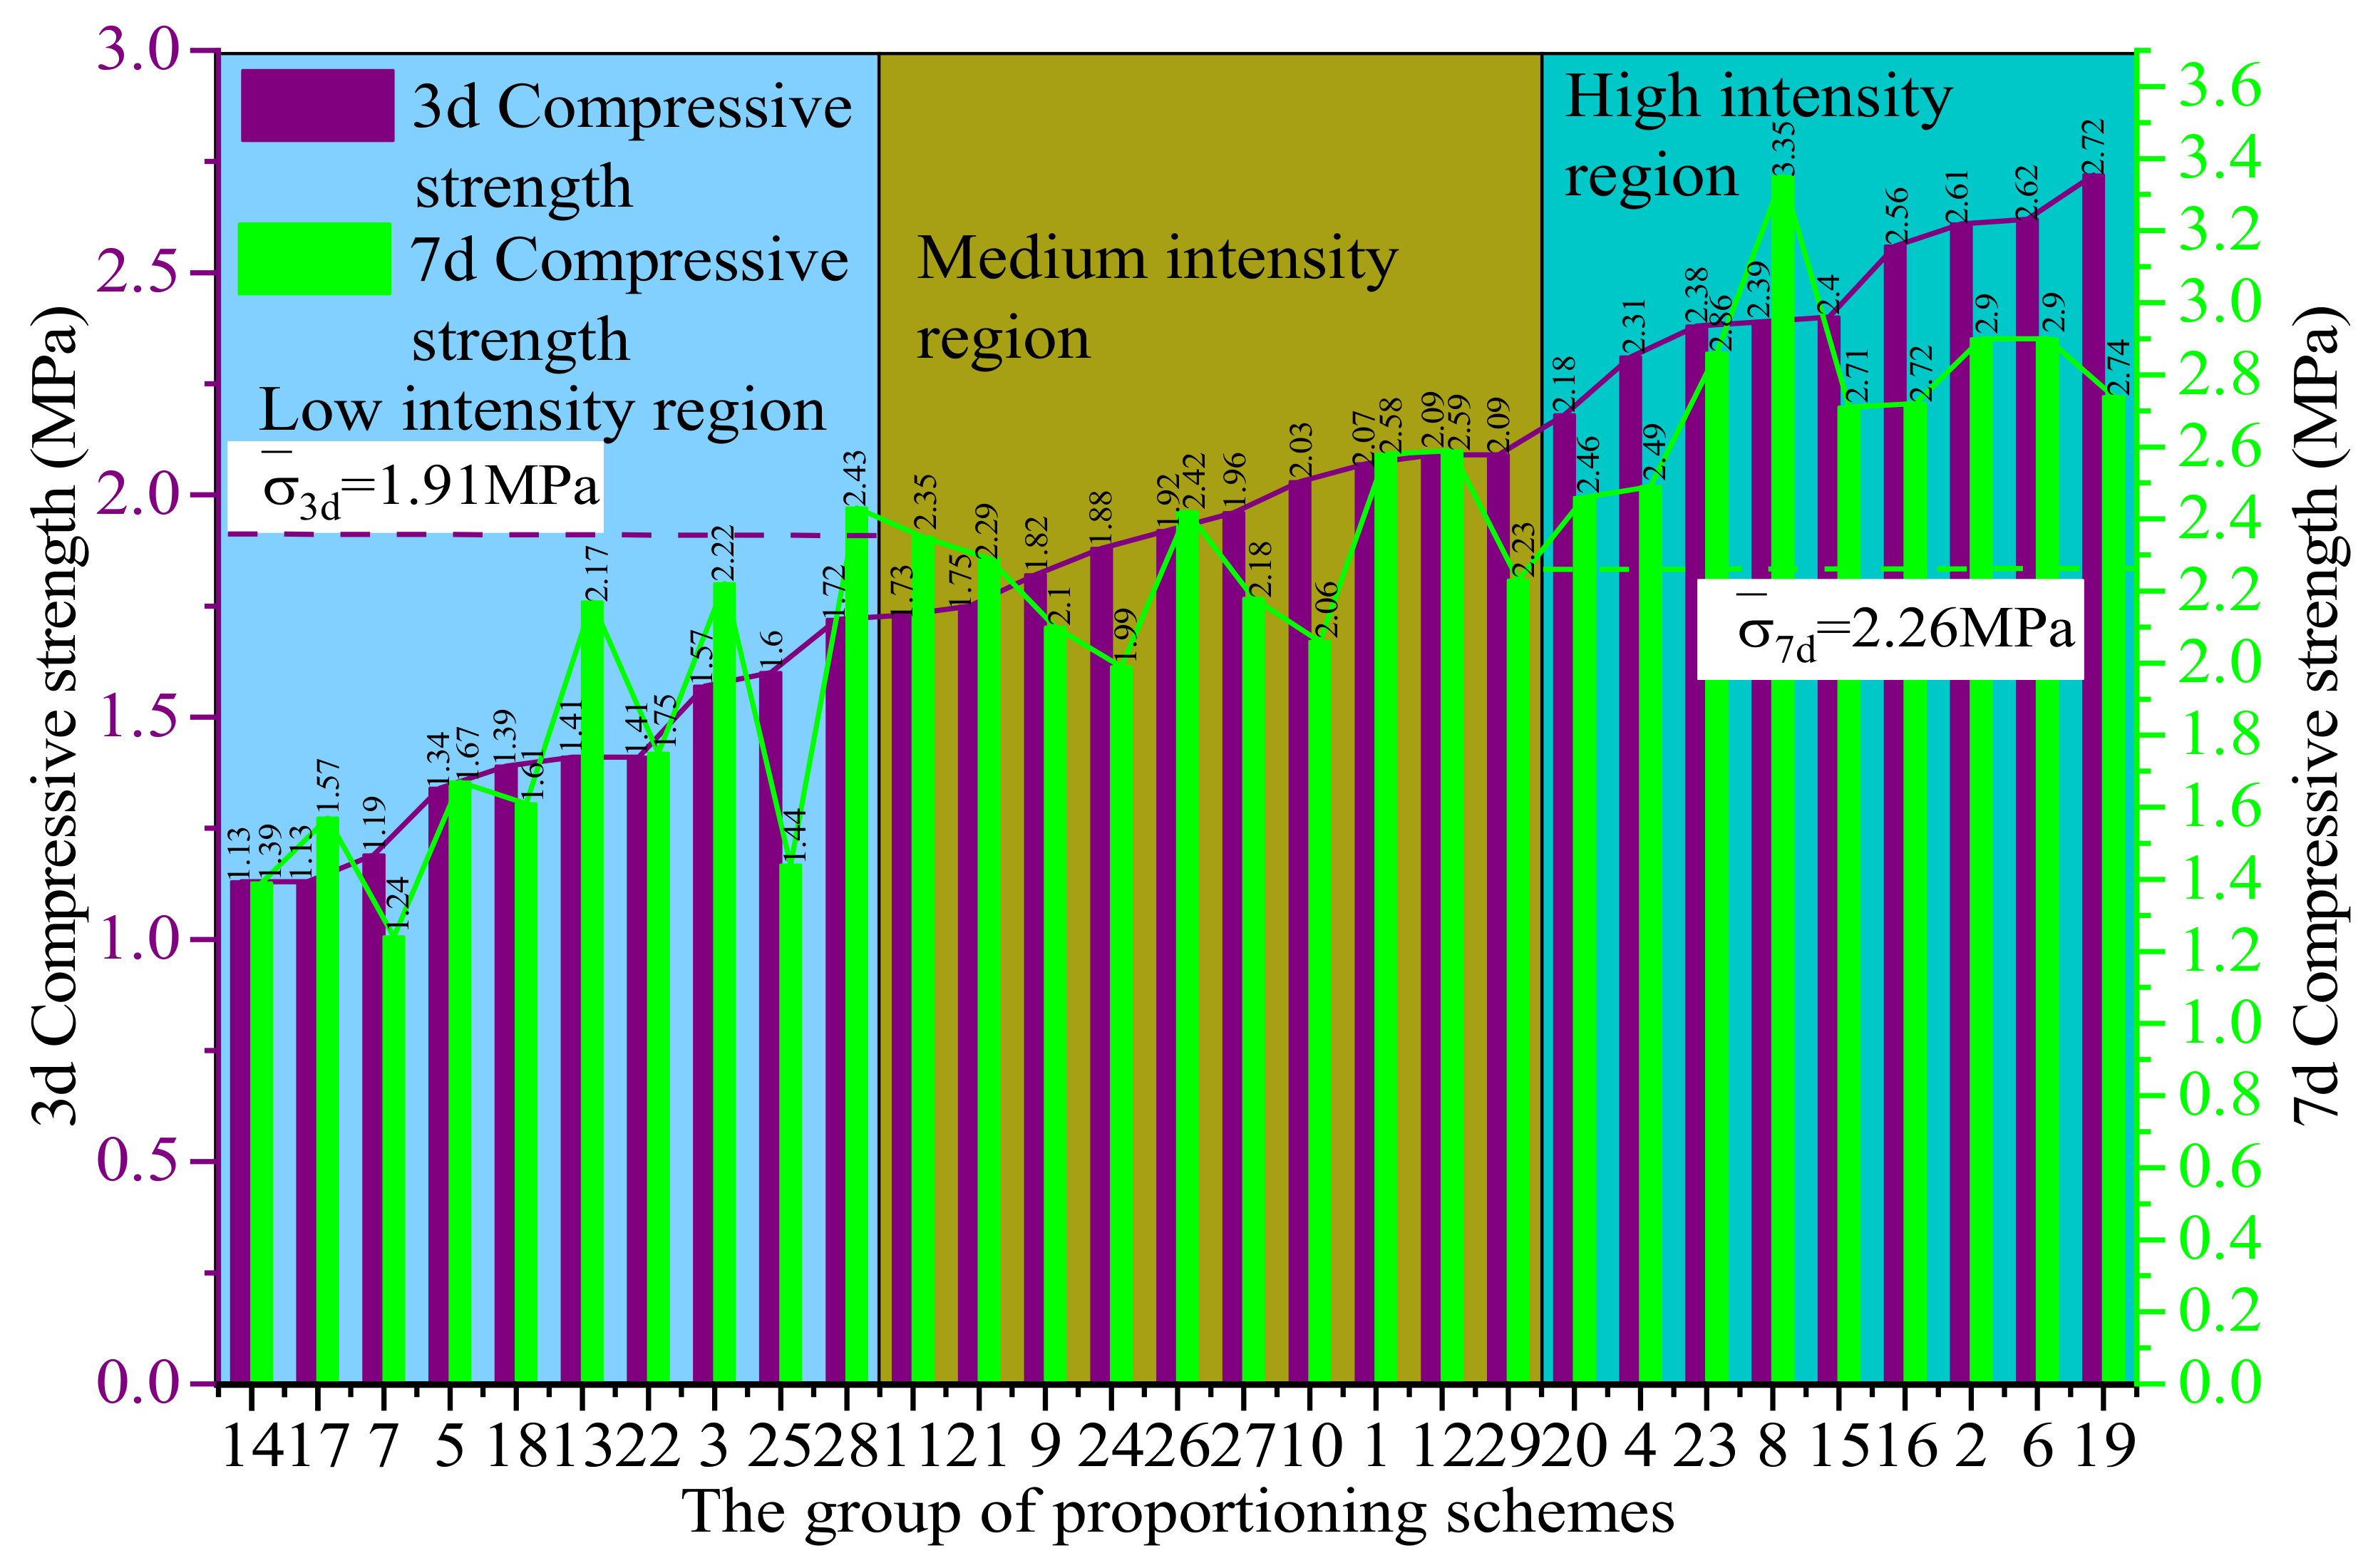
It was necessary to study the proportioning scheme, such as parameters of paste filling materials for rapid filling and solidification, to realize the parallel operation of coal mining and filling in the working face. Therefore, 3-day early strength was more effective than 7-day strength. Using the BBD method, 29 groups of four-factor and three-level filler proportioning test schemes were designed. The 3-day and 7-day uniaxial compressive strength of the response surface experimental design scheme is shown in Figure 7.
Figure 7.
Statistical histogram of compressive strength at different ages.
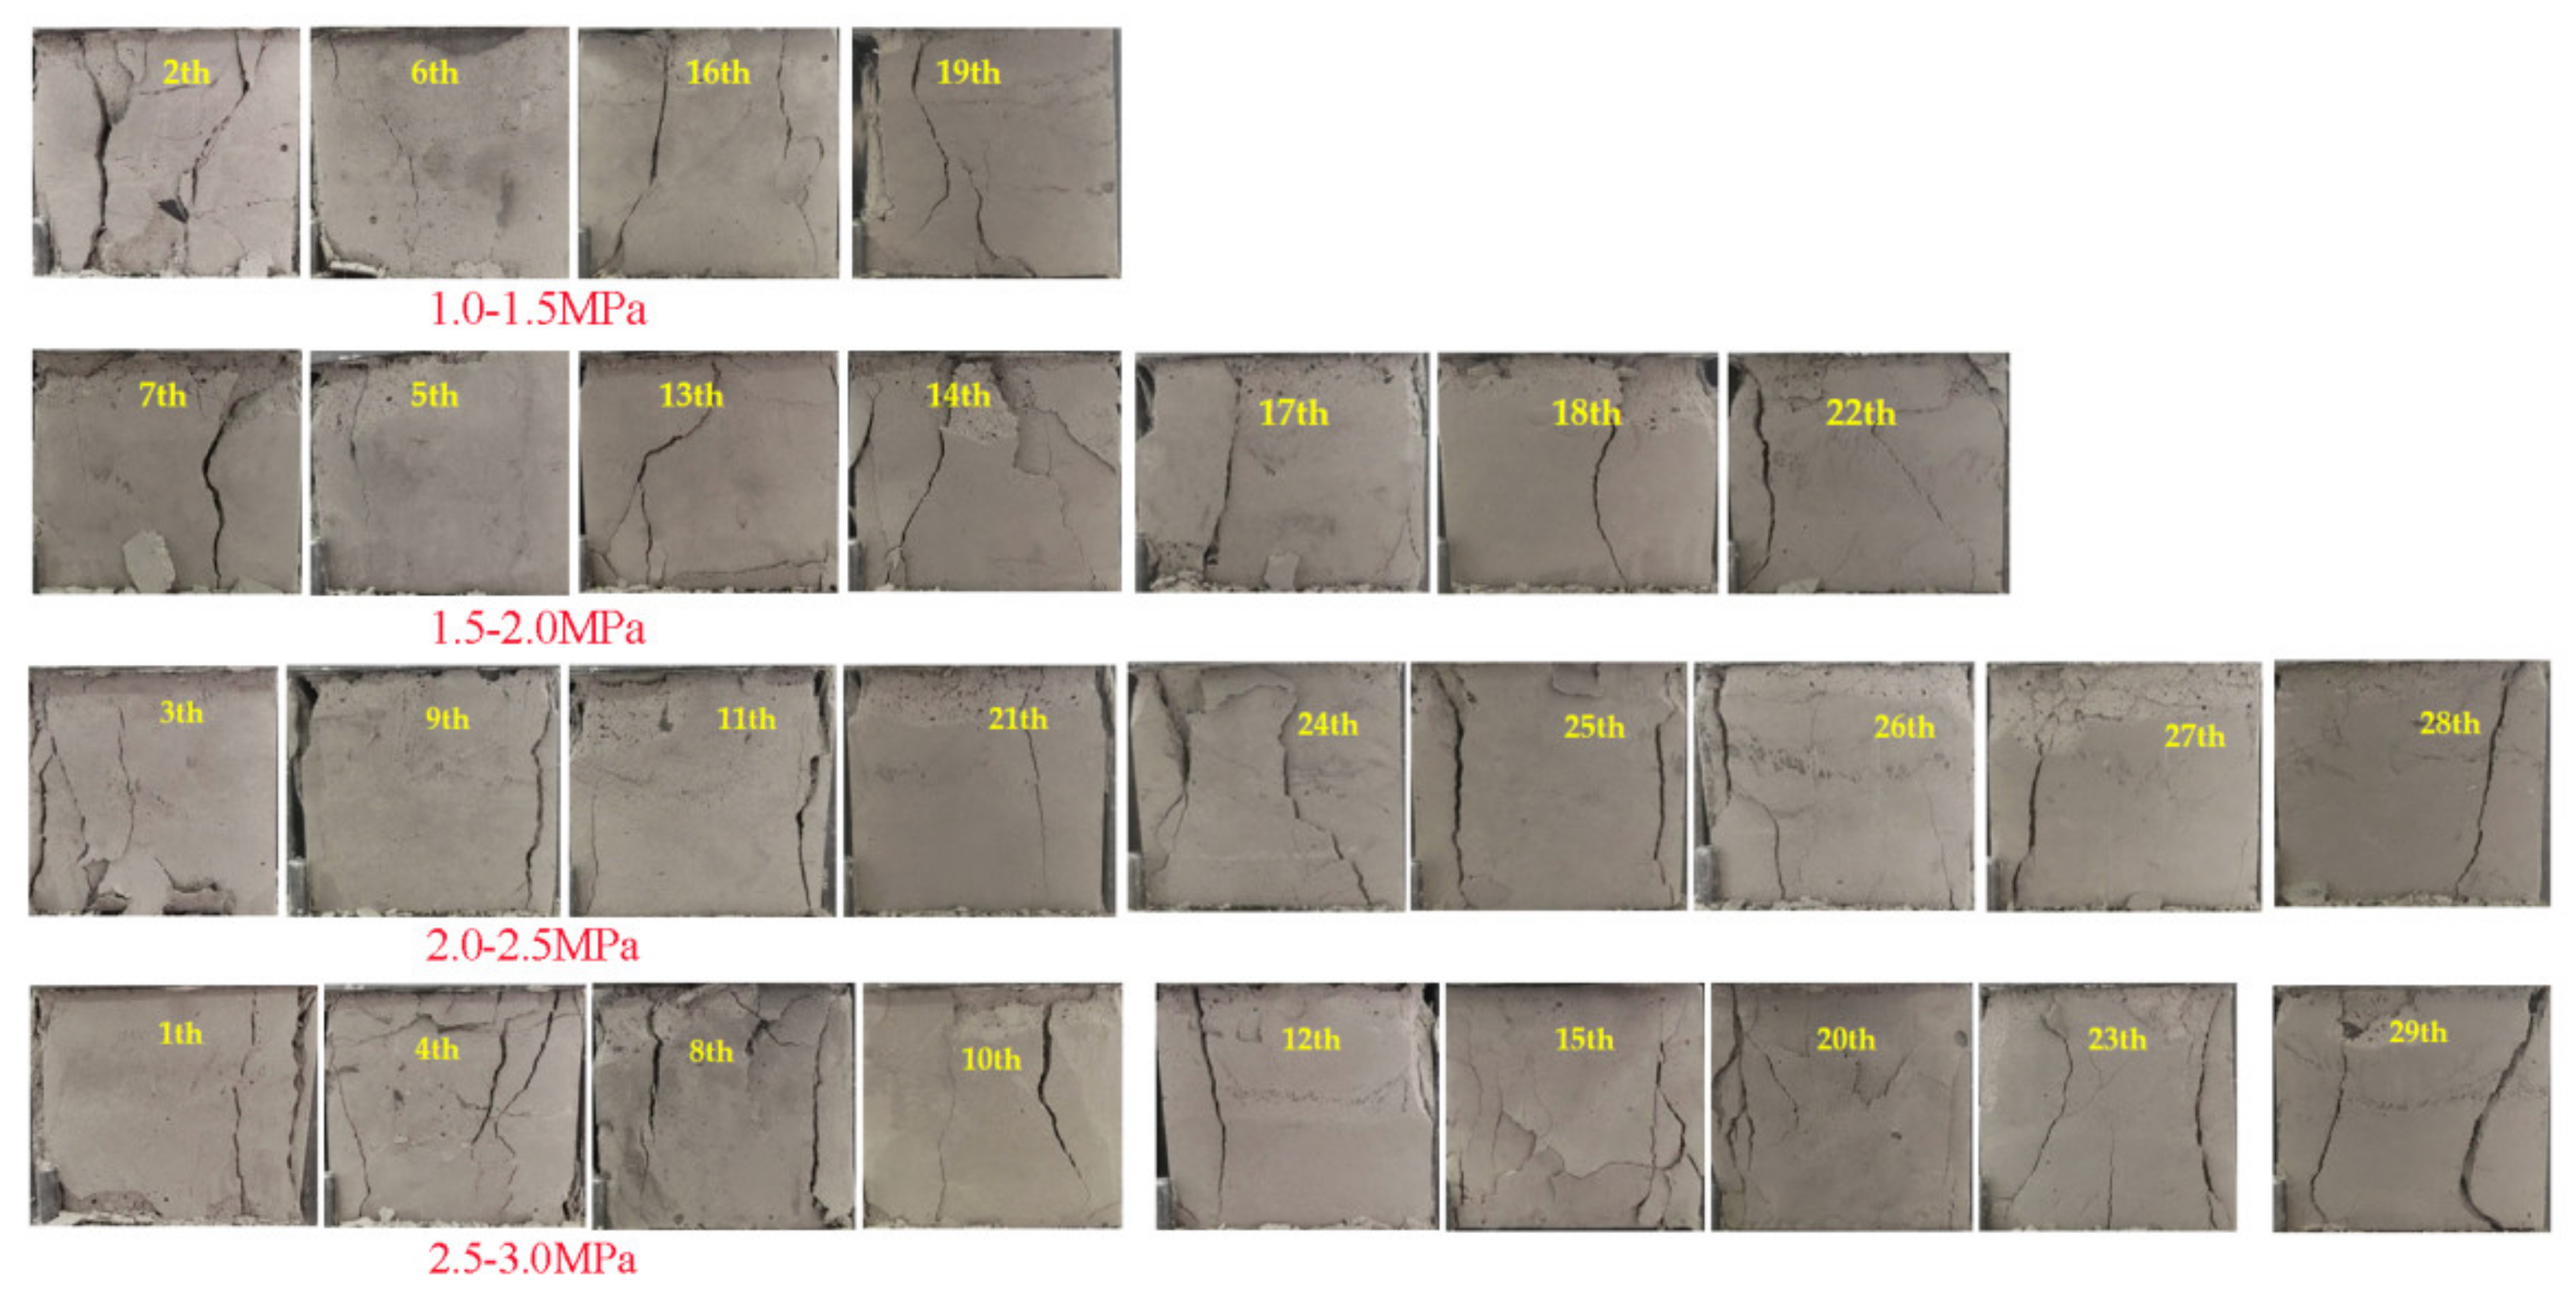
According to the three levels of low, medium, and high, 29 groups of proportioning schemes were divided into 10 groups, 10 groups, and 9 groups, respectively. The 3-day and 7-day compressive strengths in the filling material scheme were sorted from small to large. The uniaxial compressive strength of all schemes was calculated for 3 and 7 days, which was 1.91 MPa and 2.26 MPa, respectively. Using this uniaxial compressive strength, the early compressive strength at 3 days was selected. The strength of most groups of filling schemes was greater than the average value, and the same was true under the age of 7 days. Furthermore, the crack growth diagrams of filling materials in the five high-strength groups at the age of 3 days were randomly selected. The filling body under this strength followed two-way vertical crack growth. It provided an optimized coal-based solid waste filling material scheme with the intersection of fluidity and uniaxial compressive strength for subsequent analysis.
According to the calculation of the mean value of the 3-day compressive strength of the filling body, this study divided the compressive strength data of 29 groups of 3-day design schemes into four gradients, as shown in Figure 8. The reliability of the optimized proportioning scheme was further improved by comparing the divided compressive strength range with the strength of the optimized proportioning scheme. According to the failure characteristics of the test block at the age of 3 days, the brittleness of the test block was large, the surface block fell off greatly during fracture failure, and the development of cracks after failure was chaotic [18].
Figure 8.
Fracture morphology of mix proportion test block at three days of age under different schemes.
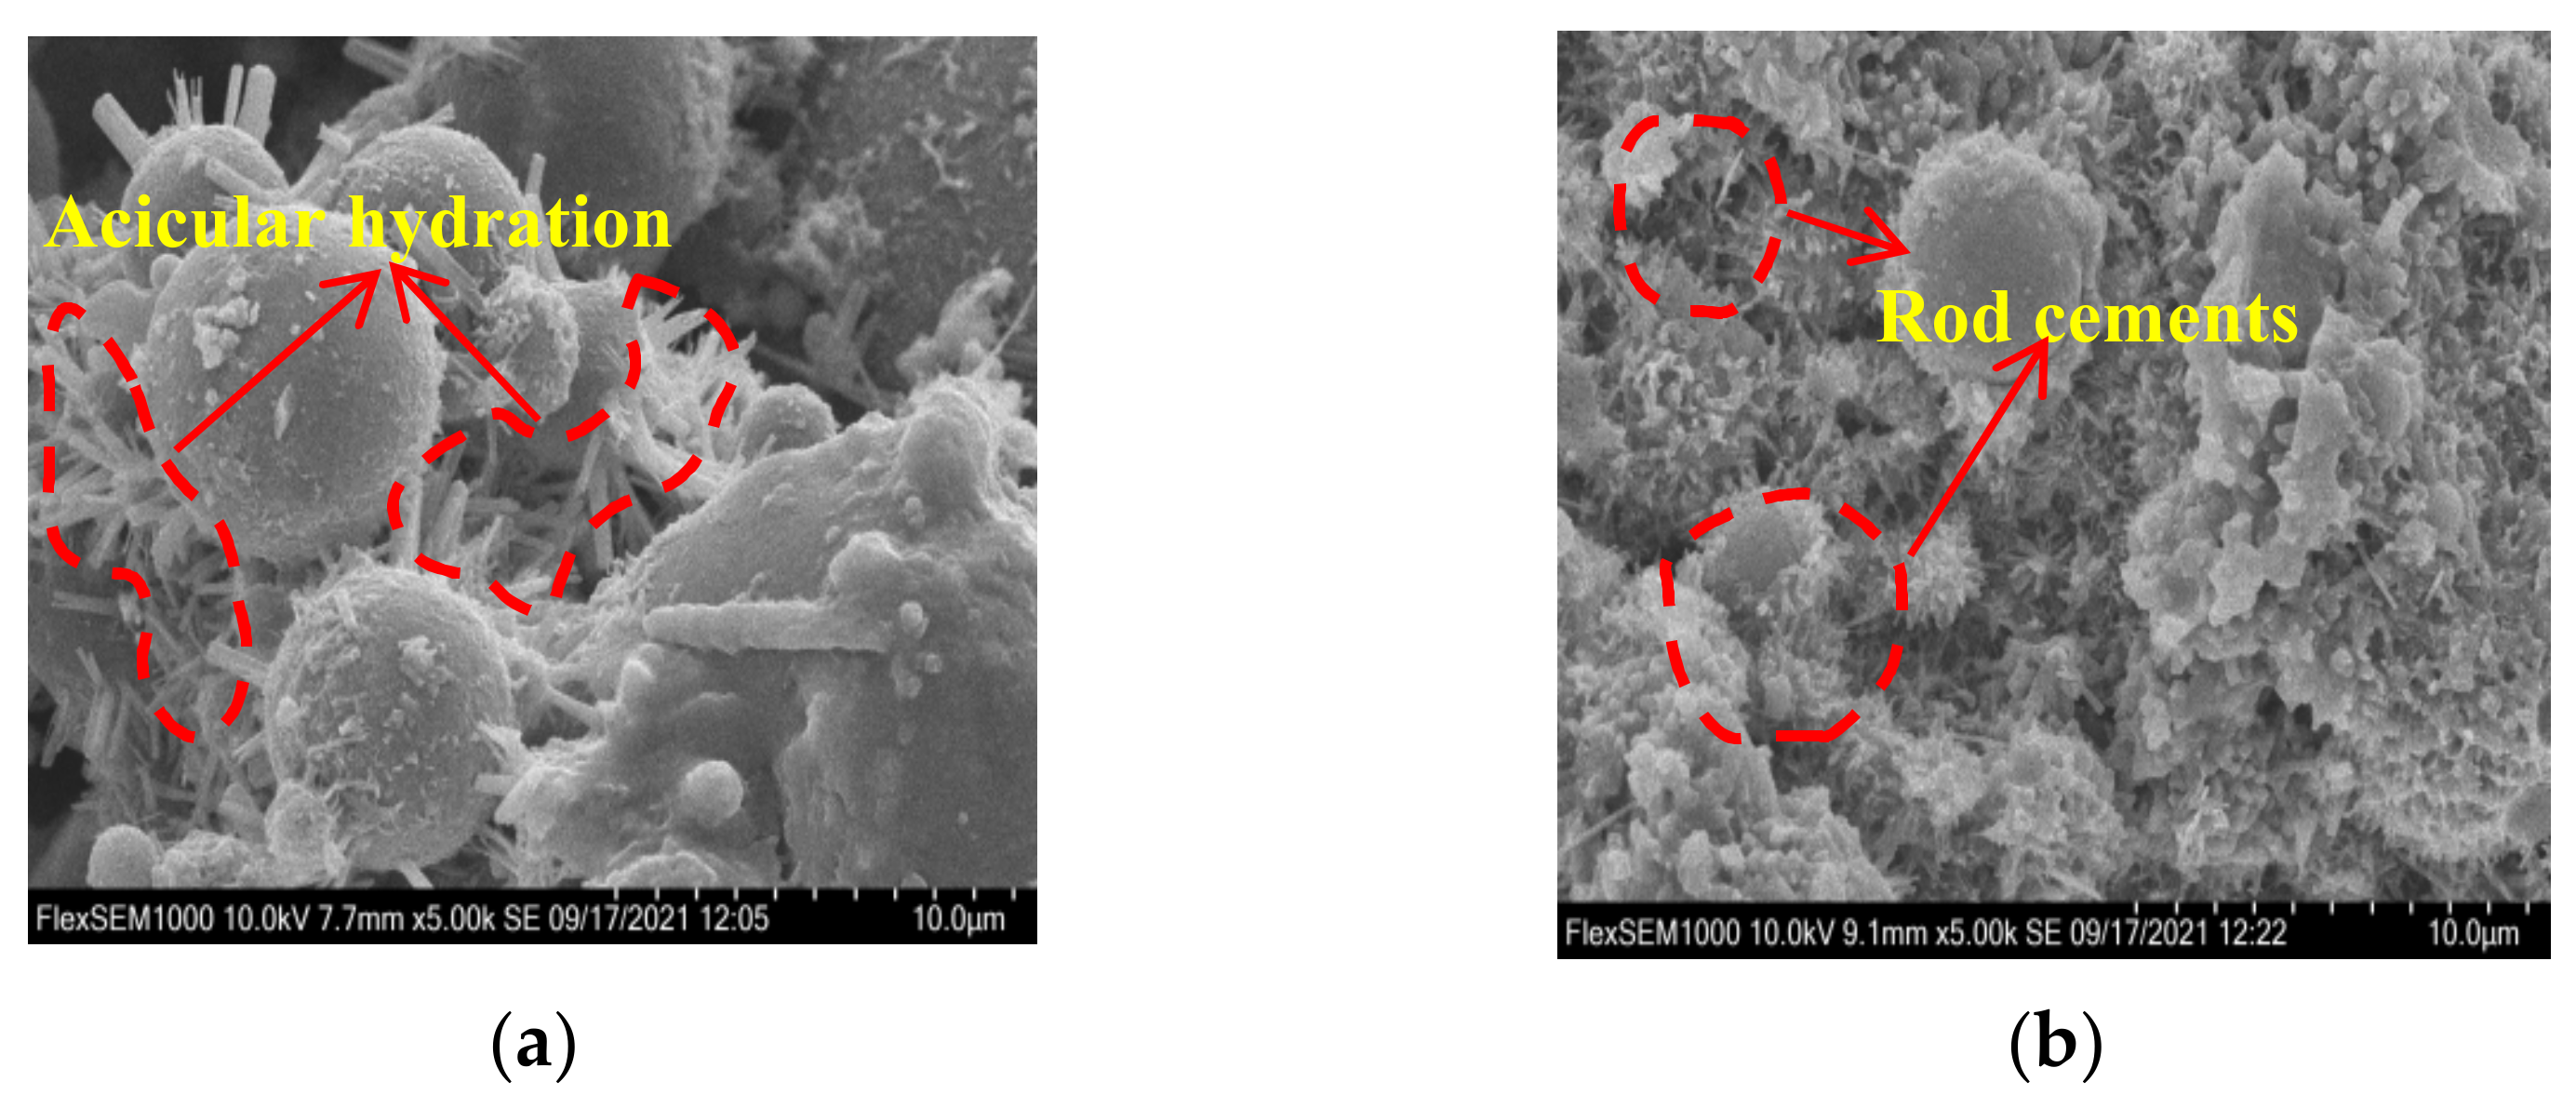
The analysis of early compressive strength and propagation crack of the test block (Table 2), combined with the SEM analysis of fly ash, revealed that the spherical structure of fly ash increased with the increase in the filler ratio [19]. The coating effect for coarse-grained auxiliary materials was better; therefore, the early compressive strength of the filling body also increased slowly. In the meantime, when the solid mass concentration of the filling material paste increased, the compressive strength of the filling body was also positive. With the gradual increase in the mass concentration of the test block, it was concluded that the compressive strength basically tended to increase, while the content of fly ash in the test block decreased. The SEM analysis of the selected test block showed that the internal hydration products of the high-strength test block were rich, as shown in Figure 9. The SEM image in Figure 9 shows that the concentration of needle-like hydration products in the two groups of test blocks was obvious. As shown in Figure 9a, the spherical structure of powdered coal ash with different particle sizes had more hydration products in the place where fly ash accumulated, but with more pores. However, as shown in Figure 9b, the hydration products of each material were dense. As the solid mass concentration increased, cement and powdered coal ash packed more coarse particles, and the compressive strength increased. The compressive strength of the test block of the filling material ratio significantly reduced with the increase in the content of the gasification slag. The gasification slag had a porous honeycomb structure, and hence the wrapping effect for each admixture was poor. In addition, the amount of cement was relatively small to control the cost of the filling paste. It was also seen that the early compressive strength increased significantly with the increase in cement content.
Table 2.
Code and level of response surface design factors.
Figure 9.
SEM image of the hydration products in 3 d. (a) The 12th set of proportioning test block; (b) the 19th set of proportioning test block.
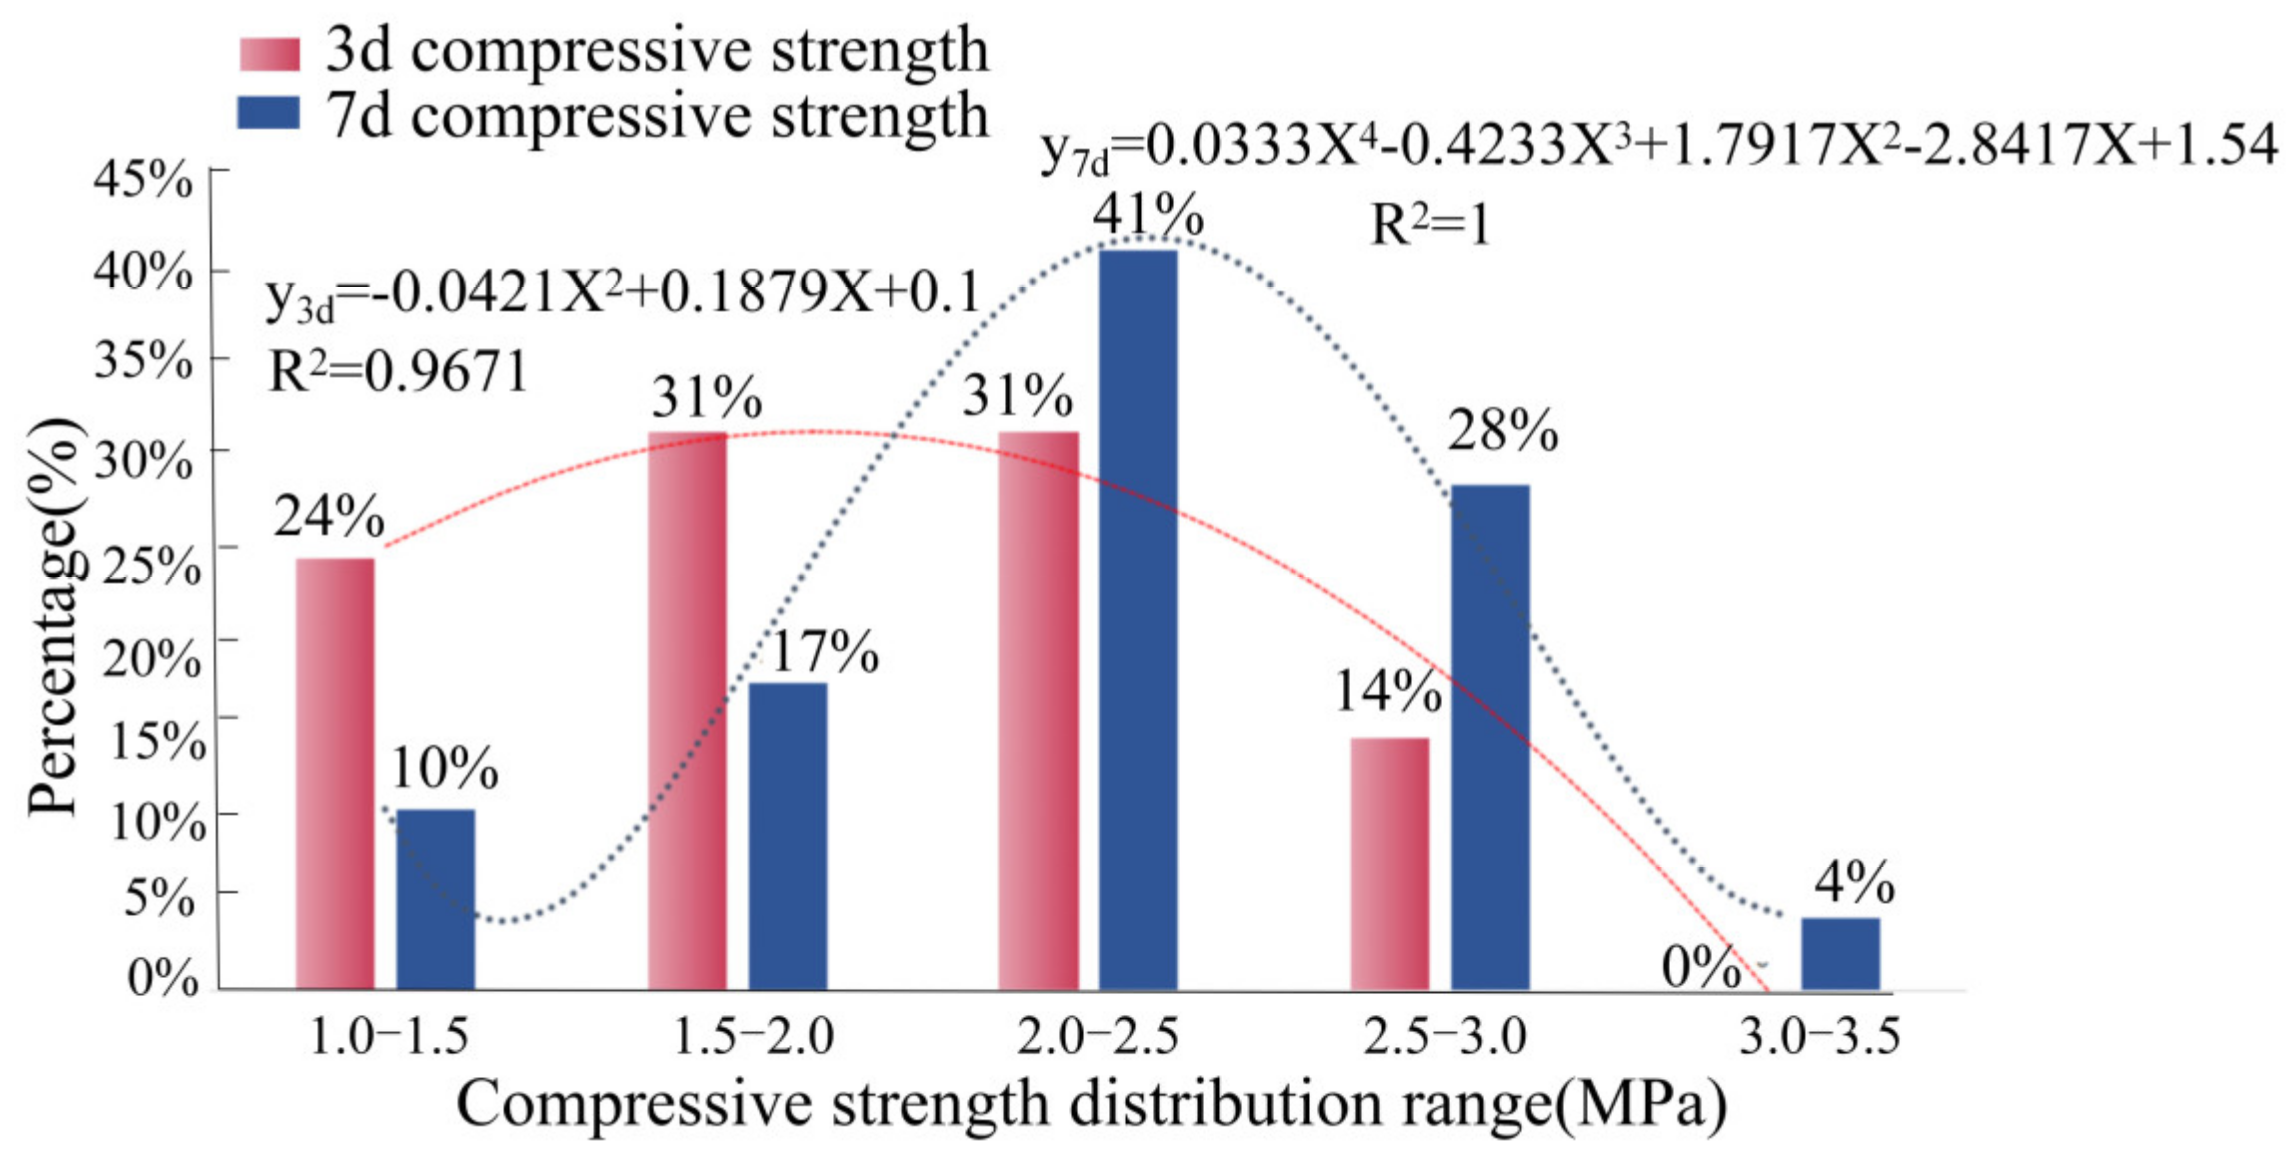
Referring to Figure 9, the distribution trend of early compressive strength at the age of 3 days under the ratio test scheme of 29 groups of filling materials was analyzed. The compressive strength was mostly distributed in 1.5–2.5 MPa, and the early compressive strength at the age of 7 days was mostly distributed in 2.0–3.0 MPa. It was seen that the distribution law of the early compressive strength under each plan is more obvious. After establishing the Weibull model of early compressive strength at the age of 3 and 7 days, the fitting variance of model Equations (1) and (2) was R2 = 0.9671 and R2 = 1, respectively. The fitting variances were close to 1, which was more accurate.
The strength curve fitting of different ages showed that with the increase in strength, the early compressive strength of multi-component mix containing gasified slag and fly ash gradually decreased. In general, the strength of fly-ash-based filler slurry was relatively low, and its early compressive strength was mainly distributed in 2.0–2.5 MPa. The analysis of the statistical results of strength distribution showed that the experimental results of the proportioning scheme had low discreteness. The reliability was guaranteed in terms of strength.
3.2. Analysis of Optimal Mix Proportion of Filling Materials Based on Low Cost and High Reliability
The paste mass concentration was generally 75–85% to adapt to the low-cost and high-reliability filling material ratio of a Renjiazhuang coal mine in the eastern mining area of NingXia [20]. Combined with the mass concentration level, the mass concentration of the final selected filling material was 75–79% [21]. Then, the best parameter combination of the filler slurry mix proportion was finally obtained using RSM and fitting module analysis, as shown in Table 2 [22].
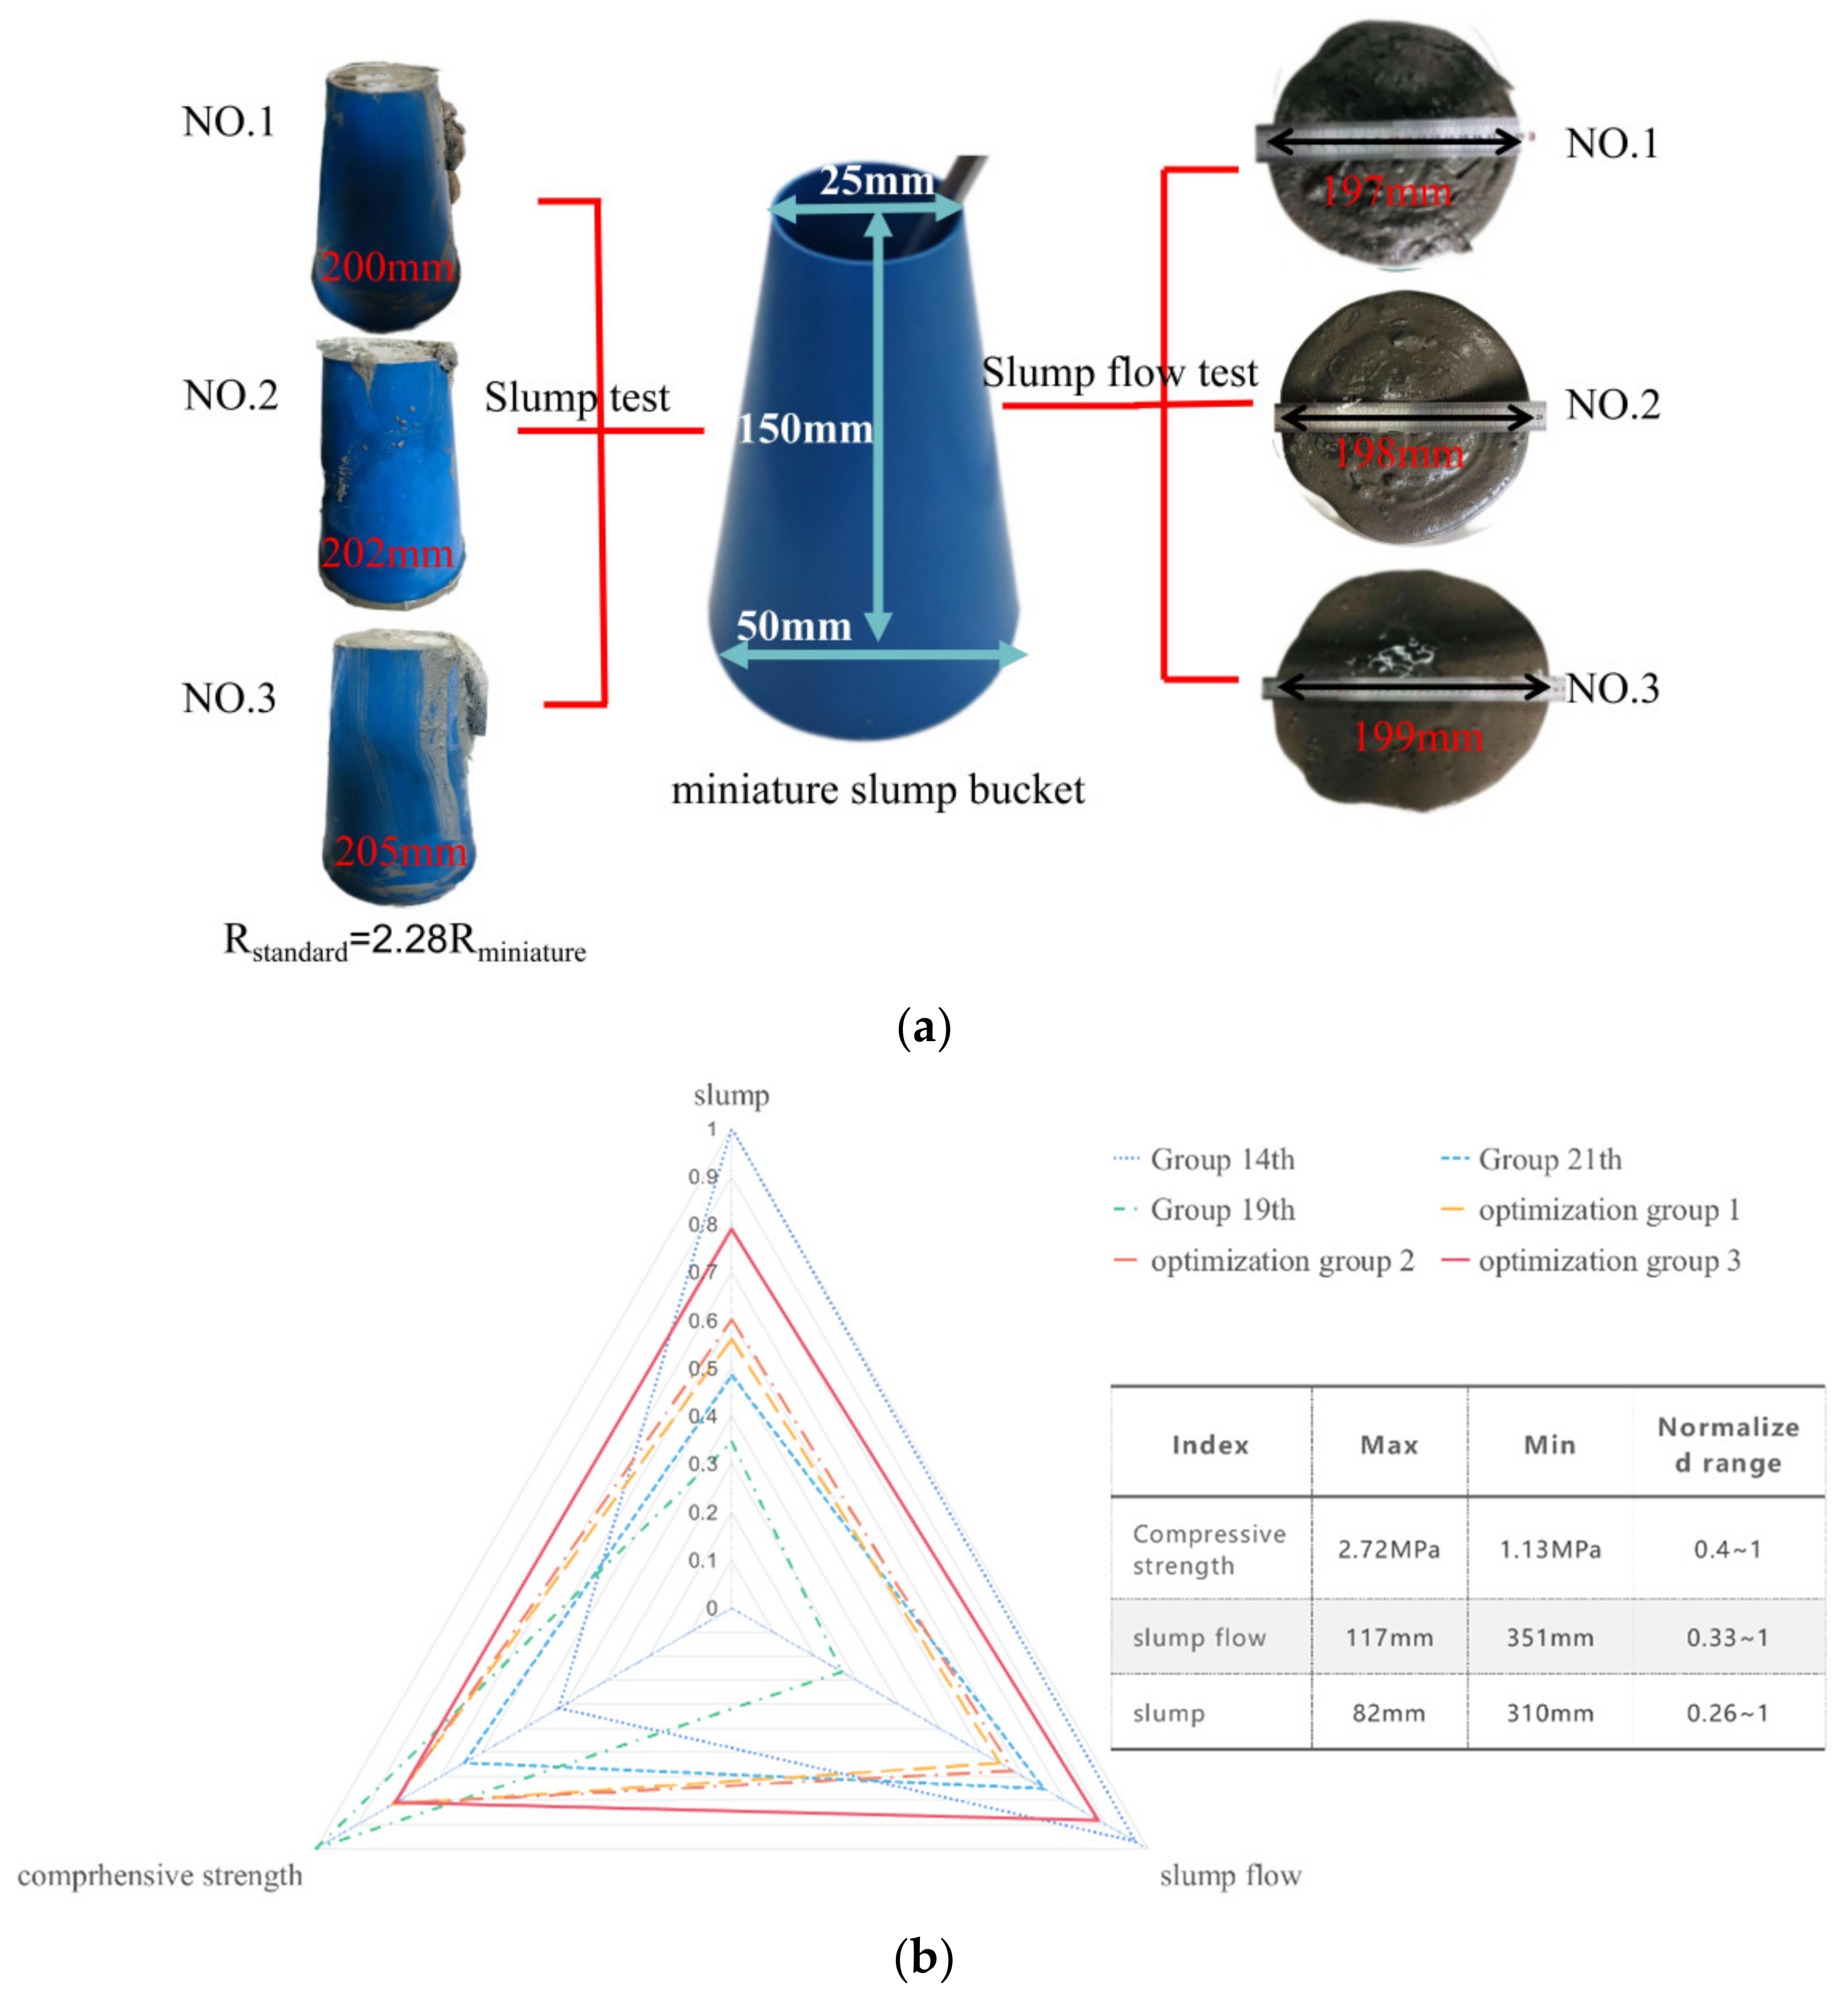
In this study, the optimized mix proportion was based on the early strength reliability of the backfill. Meanwhile, combined with the current situation of coal-based solid waste disposal in the eastern mining area of NingXia, the slump in the three groups of filling materials in the RSM optimization fitting module was obtained. The partial fluidity experiment of the expansion degree was performed, as shown in Figure 10. In this study, the micro-slump test was performed to characterize the flow properties of the filling material, and the test was conducted in accordance with the National Standardization Committee GB/T50080 standard. According to the conclusion drawn by Ouattara et al. [23], the coefficient of proportionality between the micro-slump value and the corresponding value of the standard slump cone was 2.28 [24]. The specific size of the slump is shown in Figure 10. The slump value indicated the initial flow capacity of the filling material and could reflect the cohesion and friction resistance of the slurry.
Figure 10.
Distribution trend of compressive strength range at different ages.
The test results of each group of schemes were obtained based on the aforementioned experiment and analysis [25]. The slump of the filling paste in the first group was 200 mm, and the slump flow was 197 mm, as shown in Figure 11a (No. 1). The slump of the filling paste in the second group was 202 mm, and the slump flow was 198 mm, as shown in Figure 11a (No. 2). The slump of the third group of the filling paste was 205 mm, and the slump flow was 199 mm, as shown in Figure 11a (No. 3) [26].
Figure 11.
Test and analysis of fluidity and compressive strength of experimental group and optimization group. (a) Simple mobility test process and results; (b) radar analysis of fluidity and compressive strength data.
To ensure that the three columns of data were of the same order of magnitude, No. 1 was selected as 1, and the other numbers in the same column were divided by it; No. 2 was selected as 1 for the slump, and the other numbers in the same column were divided by it; and No. 9 was selected as 1 for 3-day compressive strength, and the other numbers in the same column were divided by it. The typical mix proportion of filling materials at low, medium, and high levels was obtained through the correlation analysis of the uniaxial compressive strength of multiple groups of schemes in Section 2 of Part III. Based on this, the compressive strength and fluidity indexes of nine groups of filling materials were selected. The radar diagram was analyzed with the optimized mix proportion of three groups of filling materials obtained based on RSM. As shown in Figure 11b, among the 12 groups of batching schemes including low, medium, and high strength and optimization, optimization group 3 presented a stable equilateral triangle. Under the restriction of three factors, the correlation performance of proportioning number was consistent. This was consistent with the mix proportion obtained by RSM analysis and optimization, which had high reliability. The reliability of the regression model was verified from the theoretical and on-site perspectives. The optimal mix ratio for the bulk coal-based solid waste disposal in the East NingXia mining area was obtained. The fly ash content in solids was 79%, the solid mass concentration was 78%, the FA:C was 6:1, and the coal gangue:gasification slag was 1:1, which had a certain guiding significance and reference value for the optimization of low-cost and high-reliability filling materials [27].
4. Multiple Factors Affect the Results and Discussion
4.1. Discussion
For the aforementioned multivariate linear equation with early compressive strength as the dependent variable obtained using RSM, the optimal model equation was obtained by analyzing the correlation coefficients of multiple models [28]. The prediction correlation coefficient R2pred was 0.6399, which confirmed that the model was highly accurate and the modified model had multiple regressions, as shown in Table 3. Furthermore, as shown in Table 4, the optimal model R2 ranked fourth among the multiple models. However, its complex correlation coefficient R2pred ranked second in the model. The comprehensive coefficient should be close to 1, which was called a significant model. The multiple correlation coefficient R2 was 0.8208 and the corrected correlation coefficient R2Adj was 0.7611, which were very close. Therefore, the aforementioned discussion showed that the modified model was the best; see Formula (1) for the linear equation obtained from the model.
Table 3.
Response surface methodology R2 analysis of the fit degree of each model.
Table 4.
Analysis of variance of response surface regression model.
In addition, the significance of the model was determined using the F value and the P value. The larger the F value, the smaller the P value and the more significant the impact. The F value of the established regression model was 13.74; the P value was < 0.0001, which showed that the regression effect of the model was significant. The first term, quadratic term, and cross terms were all statistically significant. The model fit the experimental values well. The single factor resulted in the significance ranking as , and the factor interaction affected the significance ranking . The model was used to determine the correlation coefficient to evaluate the accuracy and reliability of the regression model. Meanwhile, the model for determining the correlation coefficient explained the difference between the response surface and the real value. The fit degree of each model was analyzed using RSM. The evaluation results are shown in Table 4. The closer the correlation coefficient was to 1, the higher the credibility of the model. The contour line of the equation and the 3-day response surface represented the interactive result of each factor, which could not only predict and optimize the response value but also analyzed the interaction of any two factors to obtain the interaction law.
After discussing and analyzing the fitting degree and model value of the aforementioned models, the response mass concentration, fly ash content, coal gangue:gasification slag, and FA:C were obtained through multiple linear regression fitting of the data according to the experimental results and software design-export10:
4.2. Analysis of Influencing Factors under Response Surface Methodology
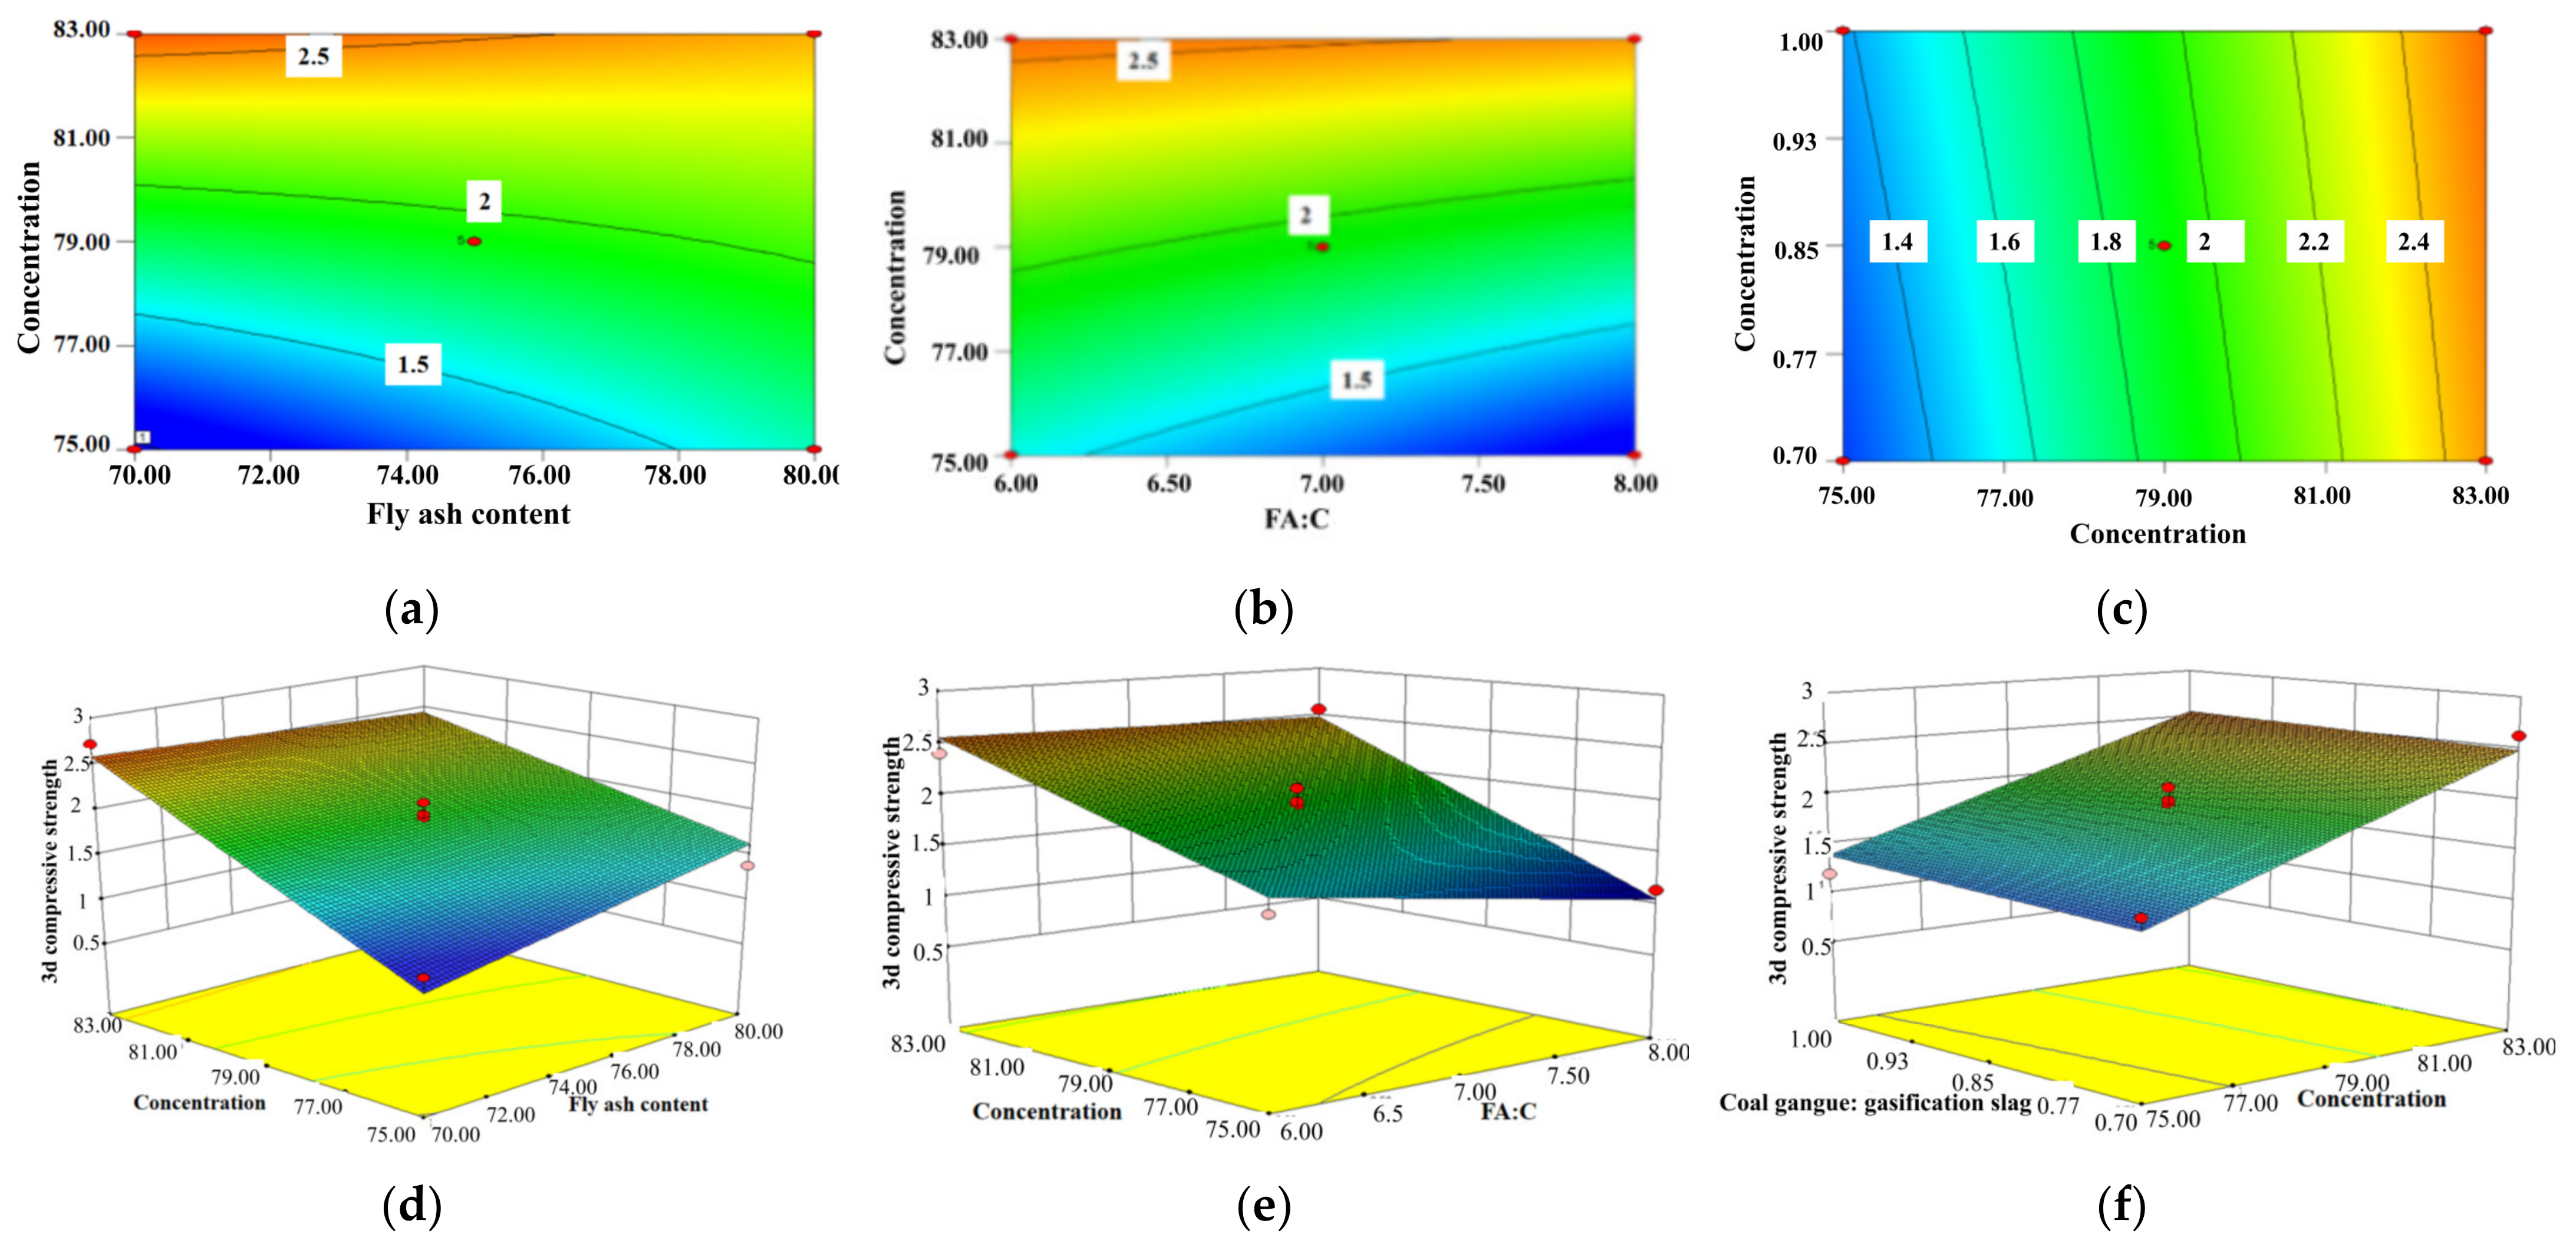
The study next aimed to obtain the correlation law of the content of fly ash, gasification slag, coal gangue, and cement on the early compressive strength of filling materials. According to the regression model, the contour plots (Figure 12a–c) and response surface plots (Figure 12d–f) of the early compressive strength varying with the factor level were drawn.
Figure 12.
Influence analysis of strength response surface factor interaction on 3 d. (a) A relationship contour map between strength and ; (b) relationship contour map between strength and ; (c) relationship contour map between strength and ; (d) relationship response surface plot between strength and ; (e) relationship response surface plot between strength and ; (f) relationship response surface plot between strength and .
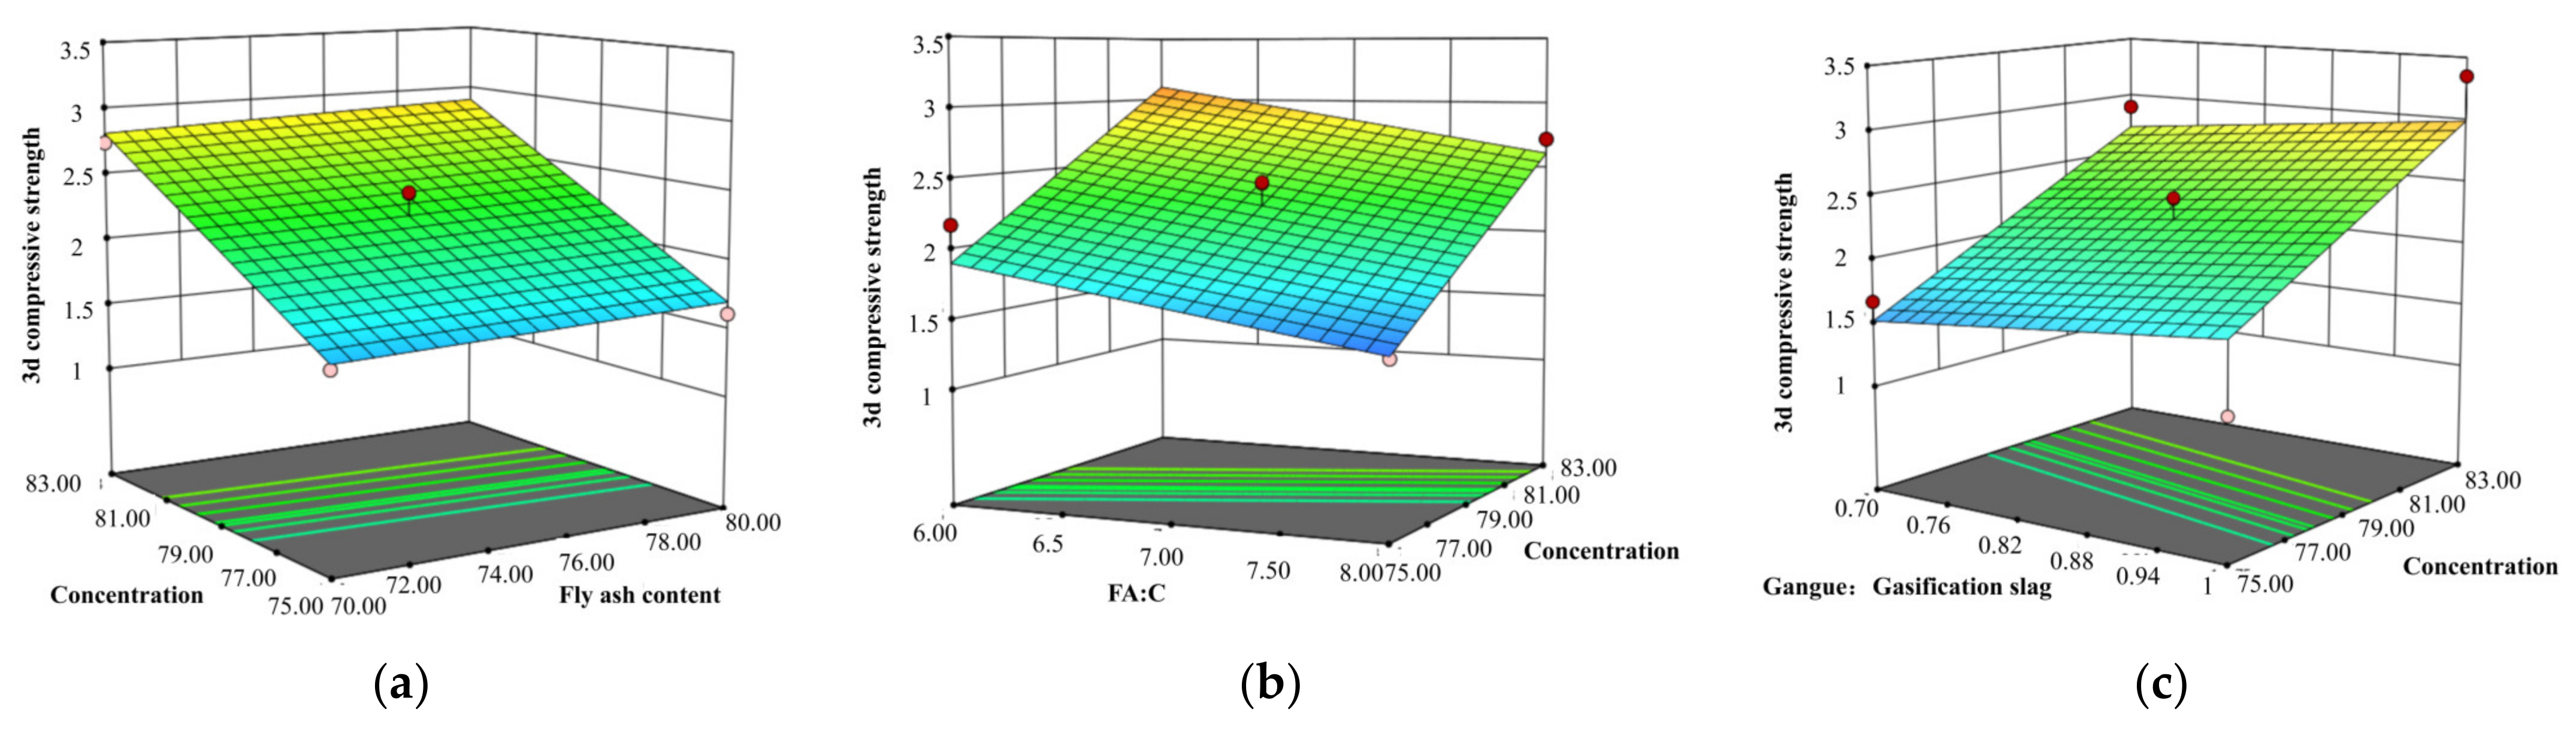
Meanwhile, we also analyzed the 7-day two-factor interaction regression model to demonstrate the two-factor interaction model under 3-day early compressive strength. The 7-day regression model was consistent with the 3-day regression model. As shown in Figure 13a–c, the solid mass fraction had a significant effect on the compressive strength.
Figure 13.
Influence analysis of strength response surface factor interaction on 7 d. (a) A relationship response surface plot between strength and ; (b) relationship response surface plot between strength and ; (c) relationship response surface plot between strength and .
The results of the analysis of variance and factor interaction showed that the three-dimensional compressive strength of the backfill was sensitive to the response of the single factor. Meanwhile, the interaction among various factors also showed strong significance, as shown in Table 4. A single factor affected the order of significance: solid mass concentration () > FA:C () > the amount of fly ash in the solid () > coal gangue:gasification coarse slag (). The interaction between solid mass concentration and FA:C () was the decisive factor affecting the early strength of the backfill. The second was the interaction between solid mass concentration and fly ash content (). The interaction between solid mass concentration and coal gangue:gasification slag () had the least effect. The analysis results of single-factor and double-factor interaction showed that the factors of filling materials with different fluidity and compressive strength requirements were also different. High-strength and low-fluidity filling materials could be controlled to have high concentration and high FA:C. Low-strength and high-fluidity materials could be controlled to have low concentration and low FA:C. High-strength and high-fluidity materials could be controlled to have medium concentration.
5. Conclusions
In this study, the BBD method was used to carry out the experiment, and the response surface regression model of fly ash content, mass concentration, coal gangue:gasification slag, and FA:C was established. Then, the normalization method was used to optimize the coal-based solid waste mix proportion. Finally, the optimal solution was obtained. A low-cost and high-reliability filling material was proposed, which provided important support for large-scale utilization and low-risk mining of solid waste. The main conclusions of this study were as follows:
- (1)
- The particle size distribution of the main components was studied. The particle size distribution of fly ash and cement was below 100 µm, accounting for 79% of the crushed coal gangue below 8 mm. The application showed that the coal gangue was massive. The main component of fly ash was quartz, which was spherical. The gasification residue contained toxic lead arsenate in the form of honeycomb. The economic value was estimated. The crushing cost of coal gangue was increased by at least RMB 50 per ton.
- (2)
- Further, 29 groups of experimental schemes were designed, and the filling proportion scheme and parameters with low cost and high reliability were optimized. Using the normalization method and radar visualization, the mix proportion was further analyzed to verify the reliability of the optimization results. The optimal proportioning parameters were obtained. The fly ash content in solids was 79%, the solid mass concentration was 78%, FA:C was 6:1, and coal gangue:gasification slag was 1:1.
- (3)
- The influence laws of strength and various factors were analyzed, and the significance ranking of various factors was obtained. The effect of mass concentration on compressive strength and fluidity was significant. High-strength and low-fluidity filling materials were controlled to have high concentration and high FA:C. Low-strength and high-fluidity filling materials were controlled to have low concentration and low FA:C. High-strength and high-fluidity materials were controlled to have medium concentration.
Author Contributions
Conceptualization, D.C. and K.Y.; methodology, T.C.; software, C.L. and R.C.; validation, D.C., K.Y., and C.L.; resources, K.Y.; data curation, D.C. and R.Q.; writing—original draft preparation, T.C.; writing—review and editing, T.C. All authors have read and agreed to the published version of the manuscript.
Funding
This work is supported by National Key Research and Development Program of China: (2019YFC1904300), the institute of Energy, Hefei Comprehensive National Science center under Grant No.21kzs217, the University of Synergy Innovation Program of Anhui Province No.GXXT-2021-017, No.GXXT-2020-008, and the National Natural Science Foundation of China (Grant No. 51974008).
Data Availability Statement
Not applicable.
Conflicts of Interest
The authors declare no conflict of interest.
References
- Qian, M.G.; Xu, J.L.; Miao, X.X. Coal mine green mining technology. J. China Univ. Min. Technol. 2003, 32, 343–348. [Google Scholar]
- Wang, L.; Yu, Y.; Ren, H.B.; Liang, X.F. How to get out of the embarrassment of “buried and buried” with the accumulation of over 60 billion tons of industrial solid waste. Resour. Regen. 2020, 40–42. Available online: https://www.sohu.com/a/477984877_121123735 (accessed on 4 May 2022).
- Wang, J.S.; Li, J.; Chen, B.X.; Fu, Z.Q.; Zhang, Z.L. Ecological Risk Assessment of Coal Industry in the Energy and Chemical Base of Eastern NingXia. Resour. Sci. 2013, 35, 2011–2016. [Google Scholar]
- Wei, T.; Wu, L.X. Restrictive Factors and Development Suggestions for the Development of Modern Coal Chemical Industry in NingXia. Coal Econ. Res. 2021, 41, 65–69. [Google Scholar]
- Li, J. “The Development of the Golden Triangle” of Energy and Chemical Industry Have Been Upgraded to a National Strategy. NingXia Dly. 2019. Available online: http://www.ocn.com.cn/free/201009/huagong150940.htm (accessed on 4 May 2022).
- Han, X.Y.; Liu, R.A. Research on Comprehensive Utilization, Storage and Disposal Countermeasures of Industrial Solid Waste in East NingXia Base. Resour. Conserv. Environ. Prot. 2015, 2015, 66–67. [Google Scholar]
- Li, J.; Wang, J. Comprehensive utilization and environmental risks of coal gangue: A review. J. Clean. Prod. 2019, 239, 117946. [Google Scholar] [CrossRef] [Scilit]
- Zhang, C.; Wang, X.L.; Li, S.G.; Liu, C.; Xue, J.H. Proportion optimization of modified lye for treating hydrogen sulfide in the coal mine based on response surface method. J. China Coal Soc. 2020, 45, 2926–2932. [Google Scholar]
- Zhu, D.F.; Tu, S.H.; Yuan, Y. 3D DEM method for compaction and breakage characteristics simulation of broken rock mass in goaf. Acta Geotech. 2021. Available online: https://www.cnki.com.cn/Article/CJFDTotal-YTLX201803034.htm (accessed on 4 May 2022).
- Tang, Y.; Zhang, L.; Lu, H. Experimental study on optimization of coal-based solid waste preparation filling material ratio. J. Min. Sci. 2019, 4, 327–336. [Google Scholar]
- Li, L. Research on Energy Consumption and Tooth Plate Structure Parameters of Jaw Crusher; Central South University: Changsha, China, 2009. [Google Scholar]
- GB/T 50123—2019; Geotechnical Test Method Standard. Chinese Standard: Beijing, China, 2019.
- Huo, X.; Lu, C. Influence of Portland Cement Mineral Composition and Fineness on Concrete Durability. People’s Yangtze River 2020, 51, 294–296. [Google Scholar]
- JGJ/T 70-2009; Standard for Basic Performance Test Method of Building Mortar. Chinese Standard: Beijing, China, 2009.
- Cui, Z.T.; Sun, H.H. Preparation and performance of coal gangue conglomerate-like filling material. J. China Coal Soc. 2010, 35, 896–899. [Google Scholar]
- Yan, P. The mechanism of fly ash in the hydration process of composite cementitious materials. J. Chin. Ceram. Soc. 2007, 167–171. Available online: https://kns.cnki.net/kcms/detail/detail.aspx?dbcode=CJFD&dbname=CJFD2007&filename=GXYB2007S1025&uniplatform=NZKPT&v=KwyYkQjFzYwbMxuNE-DcwYaIPCqQk4z9GgkWX0l3d4WEgPTrccAVbdT4_OoOZjV8 (accessed on 4 May 2022).
- Sun, Q.W.; Zhu, H.; Cui, Z.L. Study on Preparation and Performance of fly ash-Coal Gangue Based Cemented Filling Material. China Saf. Sci. J. 2012, 22, 74–80. [Google Scholar]
- Zhang, C.; Zhao, Y.; Han, P.; Bai, Q. Coal pillar failure analysis and instability evaluation methods: A short review and prospect. Eng. Fail. Anal. 2022, 138, 106344. [Google Scholar] [CrossRef] [Scilit]
- Liu, S.; Li, G.; Liu, G.; Wang, F.; Wang, J.; Qi, Z.; Yang, J. Optimization of slag-based solid waste cementitious material ratio based on response surface methodology. Silic. Bull. 2021, 40, 187–193. [Google Scholar]
- Hu, B.N. My country’s coal mine filling mining technology and its development trend. Coal Sci. Technol. 2012, 40, 1–5, 18. [Google Scholar]
- Wu, A.X.; Wang, Y.; Wang, H.J. Current Status and Trend of Paste Filling Technology. Met. Mine 2016, 1–9. Available online: https://kns.cnki.net/kcms/detail/detail.aspx?dbcode=CJFD&dbname=CJFDLAST2016&filename=JSKS201607002&uniplatform=NZKPT&v=WZAV0-oV9UAmGGpVjXyDEFfCTur-iuXGED_lrh-DhKDKRh7ElgEhuvAOIdt6Tfc7 (accessed on 4 May 2022).
- Li, L.; Zhang, S.; He, Q.; Hu, X.B. Application of Response Surface Method in Experimental Design and Optimization. Lab. Res. Explor. 2015, 34, 41–45. [Google Scholar]
- Ouattara, D.; Belem, T.; Mbonimpa, M.; Yahia, A. Effect of superplasticizers on the consistency and unconfined compressive strength of cemented paste backfills. Constr. Build. Mater. 2018, 181, 59–72. [Google Scholar] [CrossRef] [Scilit]
- Qiu, J.; Guo, Z.; Yang, L.; Jiang, H.; Zhao, Y. Effect of tailing fineness on flow, strength, ultrasonic and microstructure characteristics of cemented paste backfill. Constr. Build. Mater. 2020, 263, 120645. [Google Scholar] [CrossRef] [Scilit]
- Zhang, X.G.; Jiang, N.; Zhang, Y.H.; Jiang, X.Y.; Zhang, B.L. Experimental study on fly ash used as underground filling material. Met. Mine 2012, 135, 127–131. [Google Scholar]
- Wang, Y.Z. Experimental study on coal gangue fly ash used as underground filling material. Non-Ferr. Met. Eng. 2019, 10, 108–113. [Google Scholar]
- Hu, H.; Sun, H. Development of Mine Filling Technology and New Paste-like Filling Technology. China Min. 2001, 10, 49–52. [Google Scholar]
- Dou, Y.; Liu, F.; Zhang, W. Comparative analysis of response surface modeling methods. J. Eng. Des. 2007, 14, 359–363. [Google Scholar]
Publisher’s Note: MDPI stays neutral with regard to jurisdictional claims in published maps and institutional affiliations. |
© 2022 by the authors. Licensee MDPI, Basel, Switzerland. This article is an open access article distributed under the terms and conditions of the Creative Commons Attribution (CC BY) license (https://creativecommons.org/licenses/by/4.0/).