Article

A Decarbonization Roadmap for Taiwan and Its Energy Policy Implications

1
Low Carbon Energies, Bellaire, TX 77401, USA
2
Department of Chemical and Biomolecular Engineering, Rice University, Houston, TX 77005, USA
*
Author to whom correspondence should be addressed.
Sustainability 2022, 14(14), 8425; https://doi.org/10.3390/su14148425
Submission received: 3 June 2022 / Revised: 6 July 2022 / Accepted: 7 July 2022 / Published: 9 July 2022
(This article belongs to the Section Energy Sustainability)

Abstract

:
The objective of this paper is to propose a decarbonization roadmap for Taiwan to achieve net-zero emissions by 2050 by analyzing the status of fossil and non-fossil energies, screening applicable decarbonization technologies for their effectiveness, and then proposing an energy mix for the future. The novelty of this work lies in the screening process, which considers six, instead of one or two, categories: sustainability, security, affordability, reliability, technology readiness, and technology impact. Based on this screening, a decarbonization roadmap is proposed and compared with the announced net-zero emissions (NZE) plan. The proposed roadmap requires renewable electricity to grow at an average annual growth rate of 7% between now and 2050, instead of the 10.1% required by the NZE plan, which is more achievable based on issues identified with renewable energies during our screening exercise. The proposed roadmap improves on the NZE plan in the following aspects: (1) using clean coal technologies to decarbonize existing coal-fired power plants, (2) relying more on gas than wind and solar energies to replace coal and nuclear energy for power generation, (3) accelerating carbon capture and storage (CCS) implementation, (4) delaying the phaseout of nuclear energy until 2050, and (5) using blue instead of green hydrogen to decarbonize the transport and industry sectors. Implications of this roadmap for future research and development and energy policies are also discussed.

1. Introduction

With a population of 23 million and a GDP of 669 billion dollars in 2020, Taiwan is the sixth largest economy in Asia by GDP and 22nd in the world [1]. It has a growing electronics industry, which is ranked among the world’s most advanced. In 2020, Taiwan’s primary energy consumption (PEC) was 1338 TWh [2], and its total CO2 emission was 273 Mtpa, making it the sixth largest CO2 emitter in Asia [3].

1.1. Taiwan’s Energy Quadrilemma

Taiwan needs to balance its requirement for energy security, sustainability, and affordability, commonly known as the energy trilemma [4]. It is vulnerable to energy insecurity, as it imported 98% of its total primary energy supply (TPES) in 2020 from overseas, mostly from Saudi Arabia (33%), Kuwait (20%), and the USA (20%) [5]. Taiwan’s energy affordability is affected by volatility in oil and natural gas prices, such as the recent hike caused by the post-COVID-19 economic recovery and the Russia–Ukraine conflict. Taiwan’s energy sustainability is tied to its CO2 emission coming from the combustion of fossil fuels. In 2020, Taiwan’s per capita CO2 emission ranked 19th in the world at 11.78 tons/person [6].
In this study, we add to the energy trilemma the additional consideration of energy reliability, hence the energy quadrilemma. Energy reliability deals with energy availability as measured by its capacity factor. Our own calculations show that among renewable energies in Taiwan, solar photovoltaic and wind have the lowest capacity factors of 11% and 28%, respectively, due to their daily variability [7]. Therefore, for the same amount of electricity generation, more solar PV and wind capacity will be needed compared to other forms of energy. This is an important consideration, because the 2050 net-zero emissions (NZE) plan announced by Taiwan’s authorities relies heavily on solar PV and wind [8].

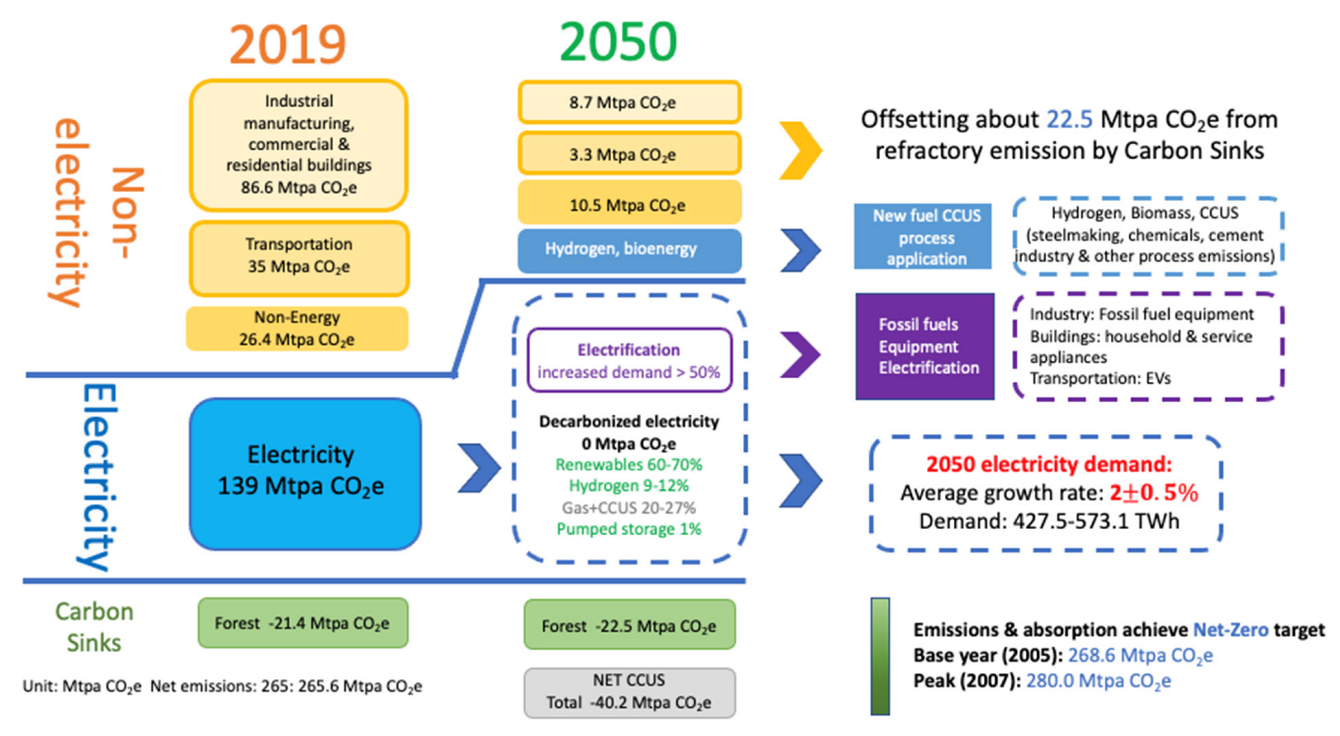
1.2. Taiwan’s Net-Zero Plan

Taiwan intends to achieve net-zero emissions by 2050 and has published a NZE plan, shown in Figure 1 [8]. In 2020, Taiwan’s electricity generation comprised 82% fossil fuels, 11% nuclear, and 7% renewable energies. Taiwan has set an ambitious “20-30-50” goal to have 20% of electricity generated by renewables, 30% by coal, and 50% by gas in 2025. By 2050, 60–70% of electricity generation will come from renewables, with the balance coming from gas and hydrogen. The increase in renewable electricity will come mostly from solar PV and wind. Their combined installed capacity will grow from 6.7 GW in 2020 to 40 GW in 2030. Furthermore, 60% of car sales will be electric vehicles (EVs) by 2035 and 100% by 2040. The planned increase in renewable energies specified by this NZE plan has already created a booming renewable market in Taiwan. The authorities have announced they will spend nearly 30 billion USD by 2030 to implement the NZE plan [8,9]. Private sector investment will be even higher. It has been estimated that current unfinished wind and solar projects in Taiwan are worth approximately 83 billion dollars [10].

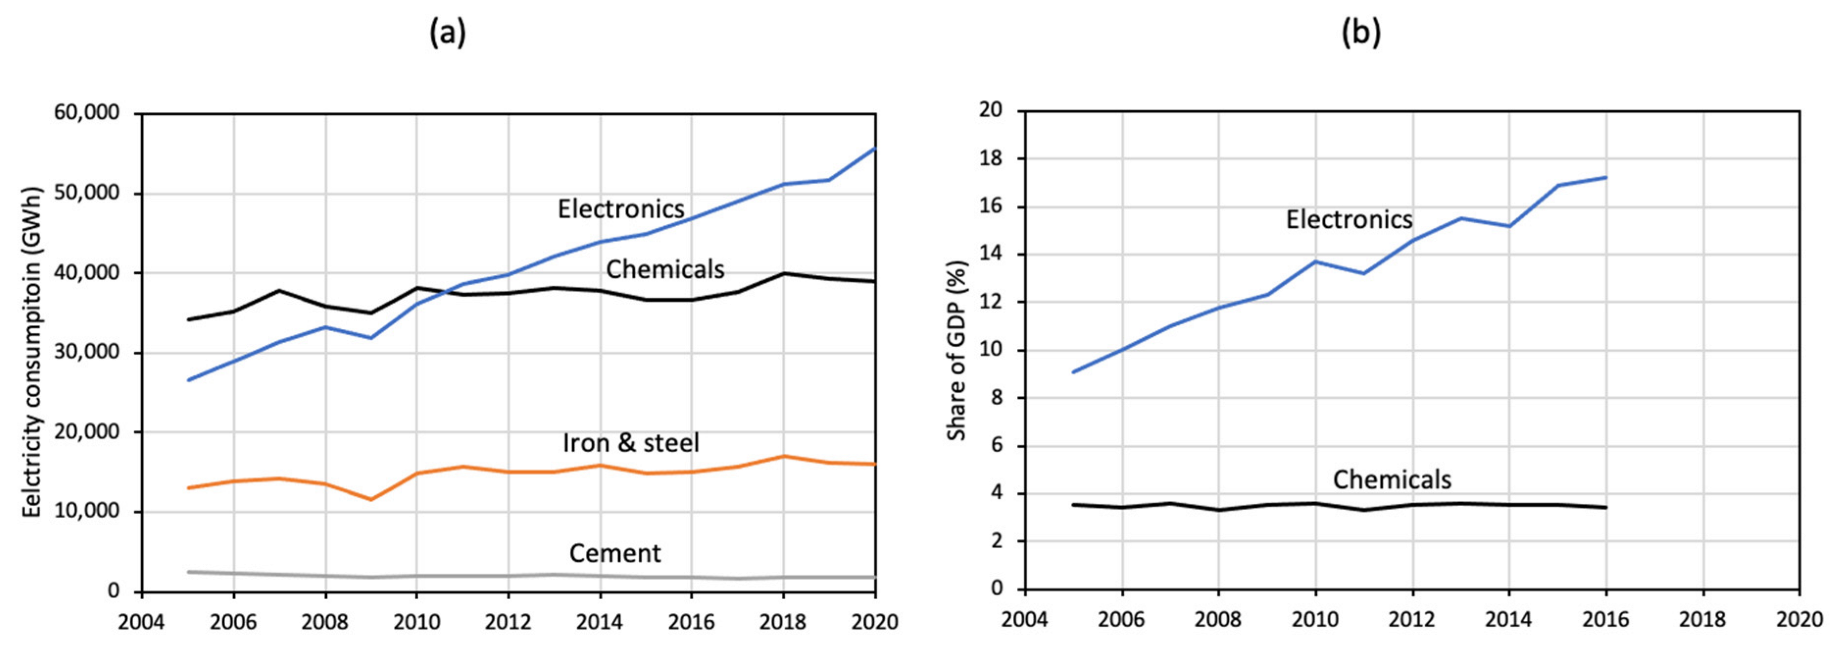
1.3. Taiwan’s Conundrum: Balancing Energy Consumption among Industries

One unique feature of Taiwan’s energy landscape is the competition between the fast-growing electronics (semiconductor) industry and the conventional chemical industry for electricity. Figure 2a shows the history of Taiwan’s electricity consumption by sector [5]. Among manufacturing industries, the electronics and chemicals industries are the first and second biggest consumers of electricity, with the former outstripping the latter in 2011. However, in 2016, the electronics industry contributed to 17% of Taiwan’s GDP compared to 3.4% by the chemical industry, and it has been the growth engine of Taiwan in the last two decades (Figure 2b) [11]. However, continued growth of the electronics industry will depend on increasing and stable electricity supply. Therefore, if electricity supply is limited, e.g., due to premature phaseout of nuclear energy, Taiwan will face the unfortunate situation of rationing electricity between these industries.

1.4. Liberalization of Taiwan’s Energy Market

Another feature of Taiwan’s energy landscape is that its electricity and LNG markets are yet to be fully liberalized. Currently, Taiwan’s electricity transmission and distribution networks are operated by state-owned Taipower. The Electricity Act (EA) of 2017 ended its monopoly on electricity supply, and it will be restructured into two companies to oversee electricity generation and distribution. EA will allow independent power producers (IPPs) to sell electricity directly to customers, either via their own distribution lines or through the existing grid owned by Taipower. Currently, Taiwan’s household electricity price is the second lowest in the world, while its industrial electricity price is the seventh lowest globally due to public subsidy [12]. More liberalization of the electricity market will be needed to encourage private investment. In the natural gas market, state-owned CPC Taiwan and Taipower are the only importers of LNG, with the former owning two LNG import terminals, with a combined capacity of 18.8 Mtpa. Two more LNG terminals with combined capacity of 5.8 Mtpa are under construction by Taipower. Taipower aims to add 13.5 GW of gas-fired capacity by 2025 and a further 3.5 GW by 2028 [10].
To encourage usage of renewable energy, the NZE plan has established a target of 20 GW of solar PV by 2025. In addition, Taiwan has launched a Thousand Wind Turbines Project with a goal of achieving 5.5 GW of wind capacity by 2025 [13]. There is also a plan to achieve 10 GW of offshore wind capacity by 2035 [8]. However, realization of these ambitious goals is hampered by the lack of local expertise and legal protection for private investors, among others [12,14,15,16].

1.5. Research on Taiwan’s Energy Transition Policy

There is a growing body of literature addressing policy aspects of Taiwan’s energy transition [17,18,19,20,21,22,23]. A large part of Taiwan’s energy transition has been based on increasing the share of renewable energies in power generation. Among renewable energies, the biggest recent additions in capacity have been in solar PV and wind energy. Analysis by Tan (2021) shows that between 2000–2010, there has been rapid growth of onshore wind capacity, due partially to favorable feed-in tariff. However, since then, growth has plateaued at around 800 MW due to restriction on available land [17]. On the other hand, offshore wind has grown from nothing in 2016 to 237 MW by 2021. Wang et al. (2021) applied the optimal control theory to study the optimal energy mix for power generation for Taiwan to balance the need for energy security and reduced CO2 emission [18]. Based on simulation results using a computable general equilibrium model, Feng et al. (2022) point out that offshore wind energy alone would be insufficient for Taiwan’s decarbonization. They advocate promulgation of a carbon tax of USD 50–100/t CO2 to ensure a just energy transition [19]. Chen (2021) analyzes the emissions–energy–economy interaction using the Lotka–Volterra model [20]. Results show that Taiwan’s energy transition cannot be accomplished by technological progress alone but will require institutional and human behavior changes. To minimize power blackout, Chen suggests retaining nuclear energy as part of the energy mix, improving energy efficiency, building a smart grid, and developing carbon capture and storage technologies [20]. Calculations by Kung and McCarl (2020) show that Taiwan’s renewable sources can only replace 74% of nuclear electricity [21]. Furthermore, renewable resources such as biomass, municipal waste, and onshore wind are almost fully utilized, leaving solar PV the only renewable energy with significant growth potential [21]. Gao et al. (2021) note that Taiwan’s research and development (R&D) is insufficient to support its ambitious goal to grow offshore wind energy [22]. Their work shows there is insufficient R&D justifying the high feed-in-tariff proposed for offshore wind. In addition, Taiwan’s use of administrative rules instead of legislation to promote offshore wind could cause large investment uncertainty for offshore wind developers. Furthermore, Gao et al. (2018) argue that liberalization of the energy market can have negative effects on renewable energies, as customers may shun expensive renewable electricity in favor of cheaper fossil electricity [23].
The aforementioned studies show that choosing the right roadmap for the ongoing energy transition of Taiwan is a topic of keen interest for policy makers, investors, scientists, and engineers. However, there is no consensus on the right decarbonization roadmap. This study will contribute to the ongoing discussion on Taiwan’s energy transition by proposing a decarbonization roadmap based on analysis of existing data.

2. Objective and Methodology

The objective of our study is to propose a decarbonization roadmap for the power, transport, and industry sectors of Taiwan to enable it to achieve net-zero CO2 emissions by 2050. Our methodology, shown in Figure 3, has four steps. First, we review the status of fossil and non-fossil energies in Taiwan by analyzing the primary energy consumption (PEC), electricity generation, and sector-specific CO2 emission. Second, we subject a set of 20 sector-specific decarbonization technologies (Table A1) to sustainability screening (Table 1), energy quadrilemma screening (Table 2), and technology mapping to choose those with the highest potential of being achieved. The criteria for these screening and mapping exercises are given in Table A2, Table A3, Table A4, Table A5 and Table A6. Third, we propose the future energy mix to arrive at a decarbonization roadmap. Fourth, this roadmap is compared with the published NZE plan [8], the difference between them is discussed, and implications for energy policies are then drawn.
The novelty of this study lies in three areas. First, unlike other studies, we use a holistic approach to screen decarbonization technologies according to six categories: sustainability, security, affordability, reliability, technology readiness, and technology impact. This provides a more balanced view of a technology’s potential. Second, we consider the unique energy landscape of Taiwan in conducting the technology screening, including availability of energy resources and carbon sinks, land and space limitations, and the current state of R&D. Third, the decarbonization roadmap proposed by this study, though drawing from the NZE plan, improves on it.
There are several limitations to this study. First, it only deals with the supply side of decarbonization. Therefore, demand-side approaches such as improving energy efficiency, use of less carbon-intensive materials, and adoption of a circular economy are outside the scope of this study. Second, some decarbonization technologies with low technology-readiness level, such as direct air capture and biofuels with CCS, are also not included in our study. Third, the technology mapping exercise is best done by a group of experts who have in-depth knowledge of the decarbonization technologies being screened.

3. Status of Fossil and Non-Fossil Energies

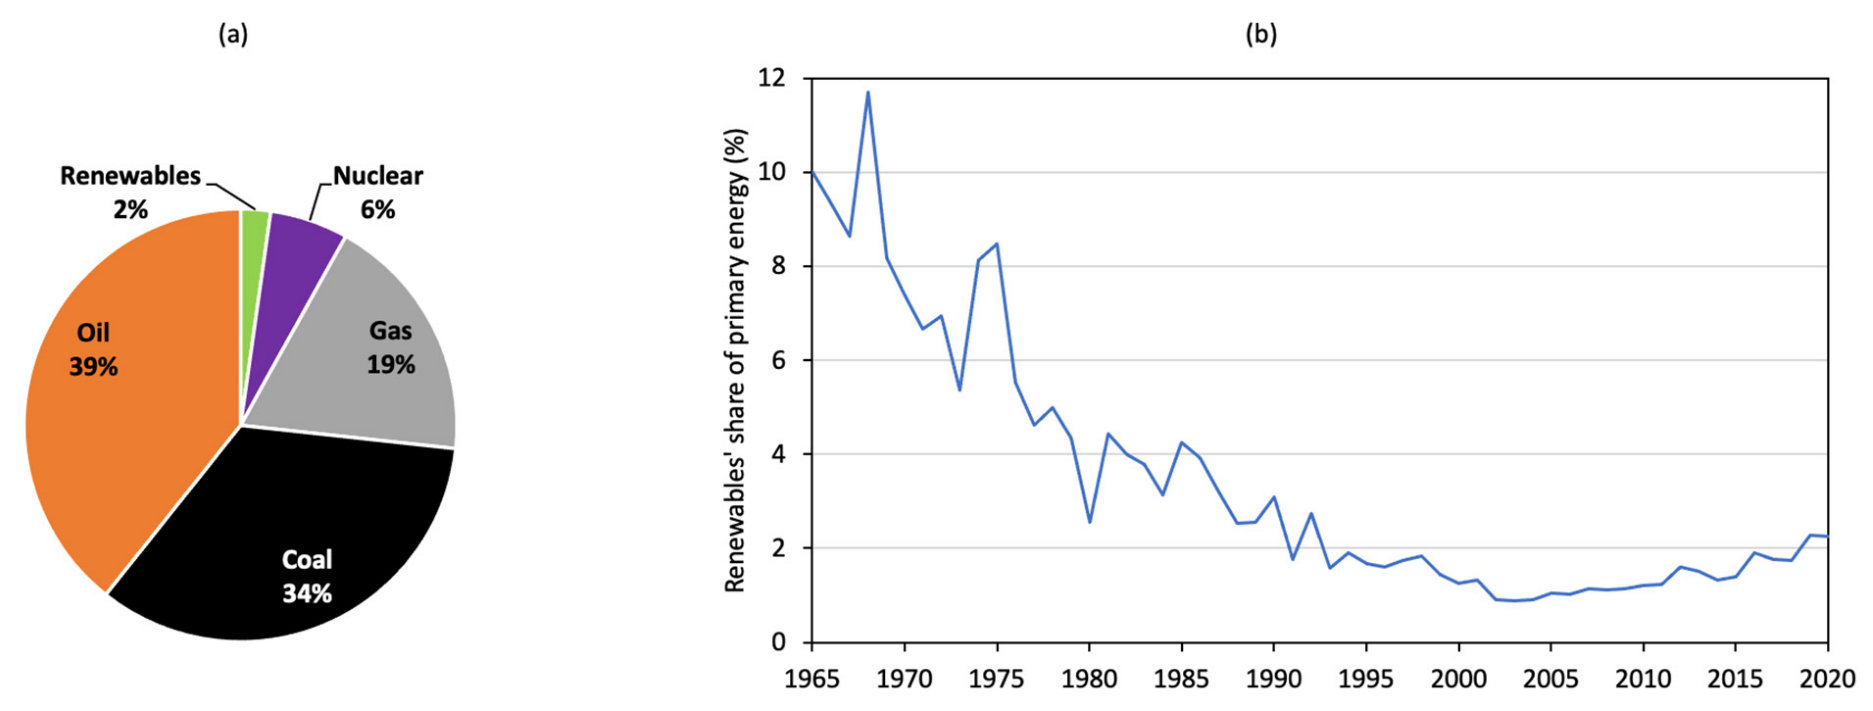
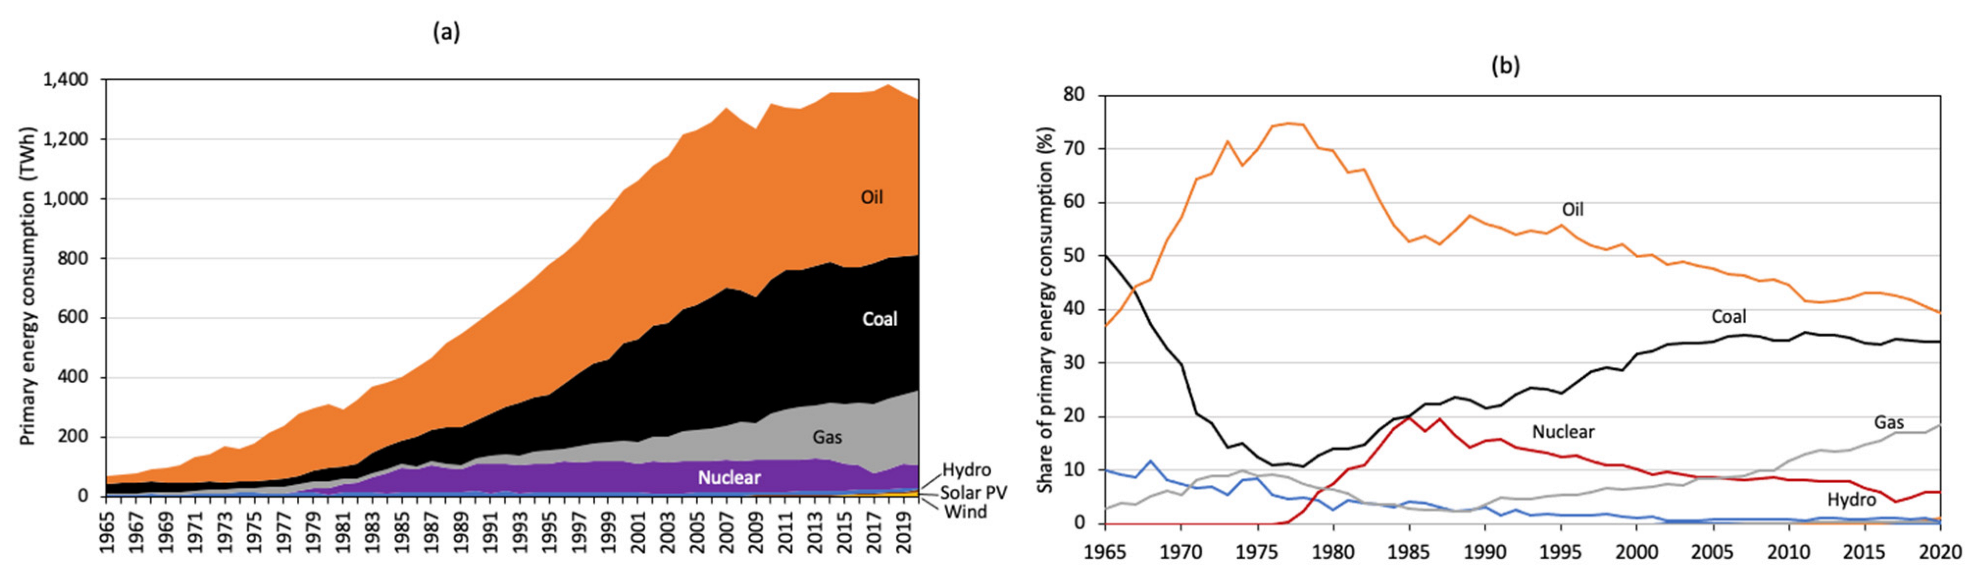
3.1. Primary Energy Consumption

Figure 4 gives the history of Taiwan’s PEC cumulatively (Figure 4a) and by fuel type (Figure 4b) [2]. In 2020, Taiwan’s PEC comprised 39% oil, 34% coal, 19% gas, 6% nuclear, and 2% renewables (Figure 5a). For most of the last two decades, renewable energies contributed to less than 2% of PEC (Figure 5b). Nuclear energy’s contribution to PEC peaked at 20% in 1985 and had declined to 6% by 2020.

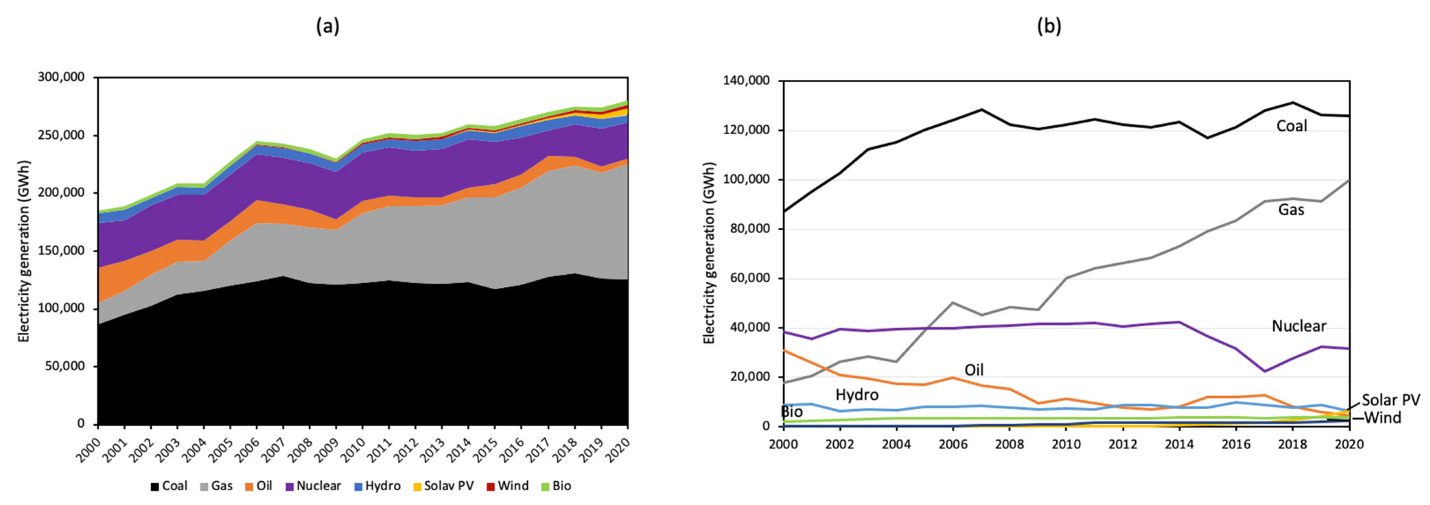
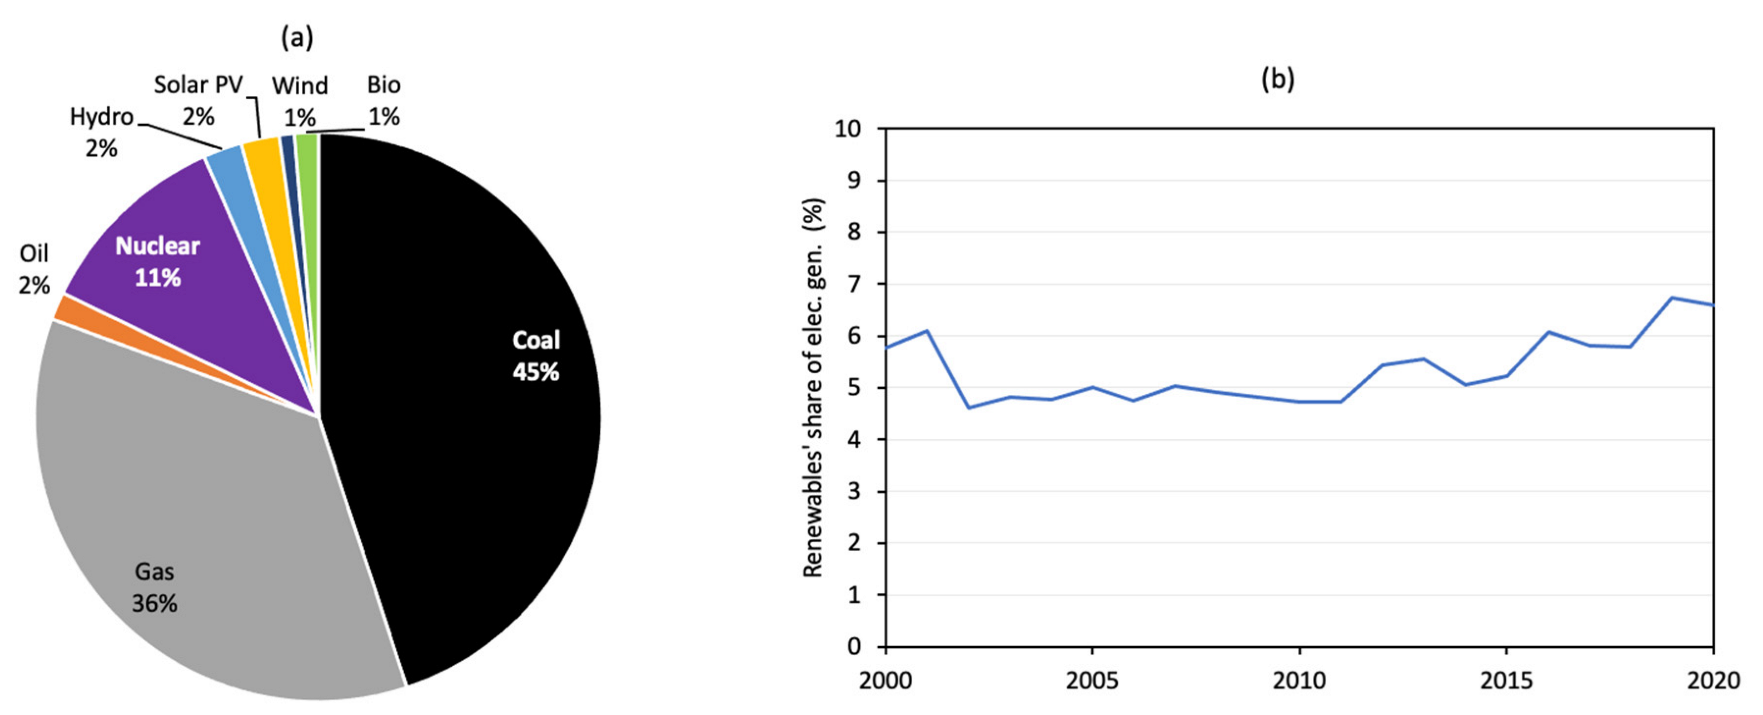
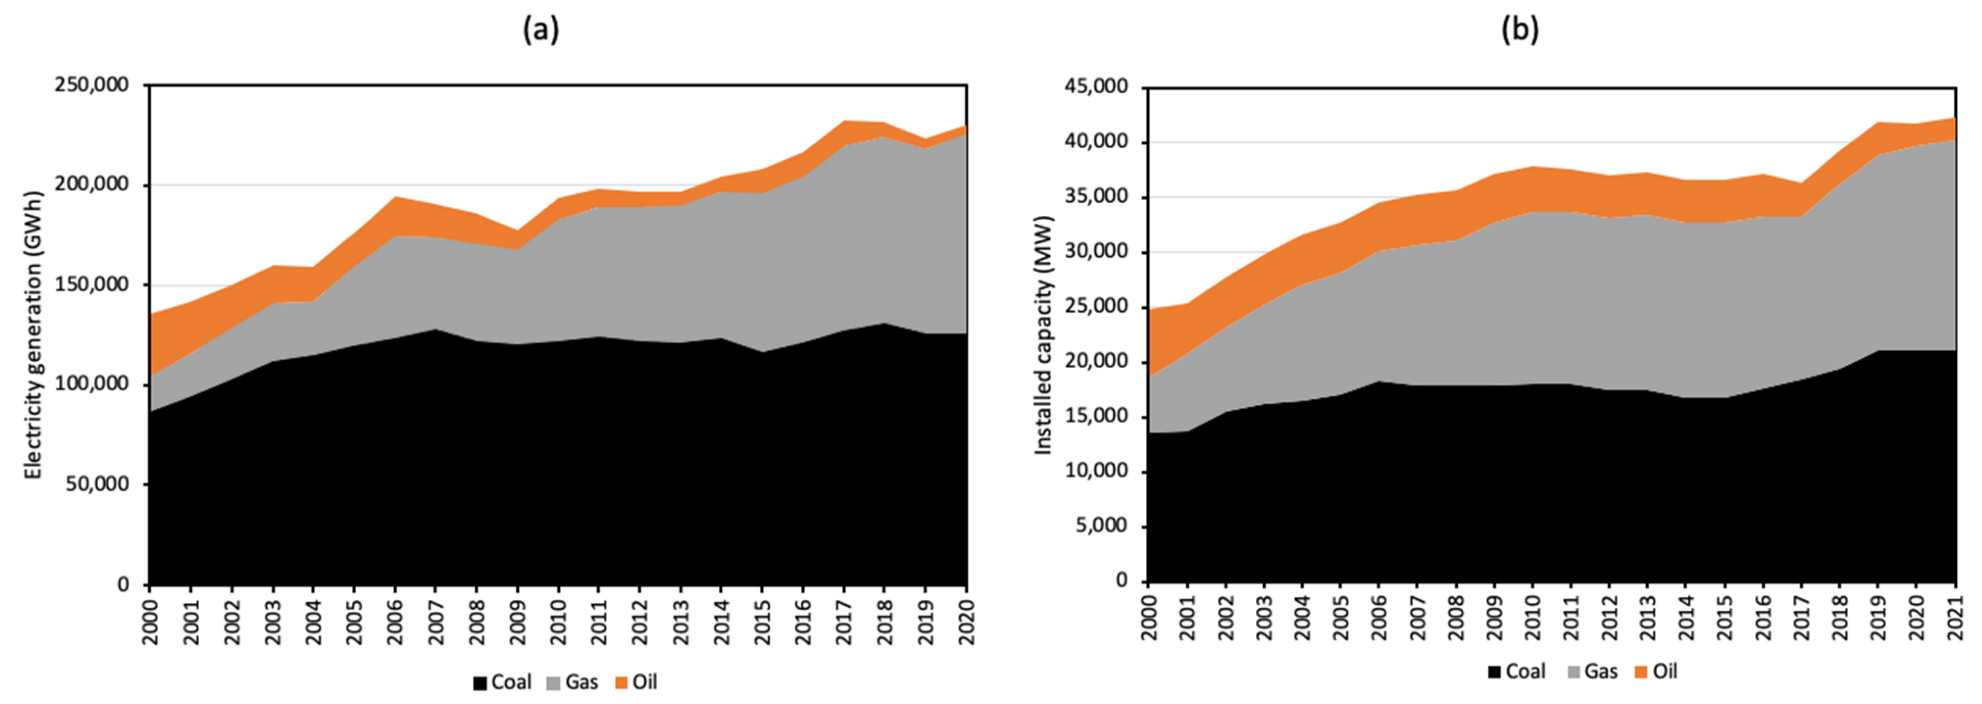
3.2. Electricity Generation
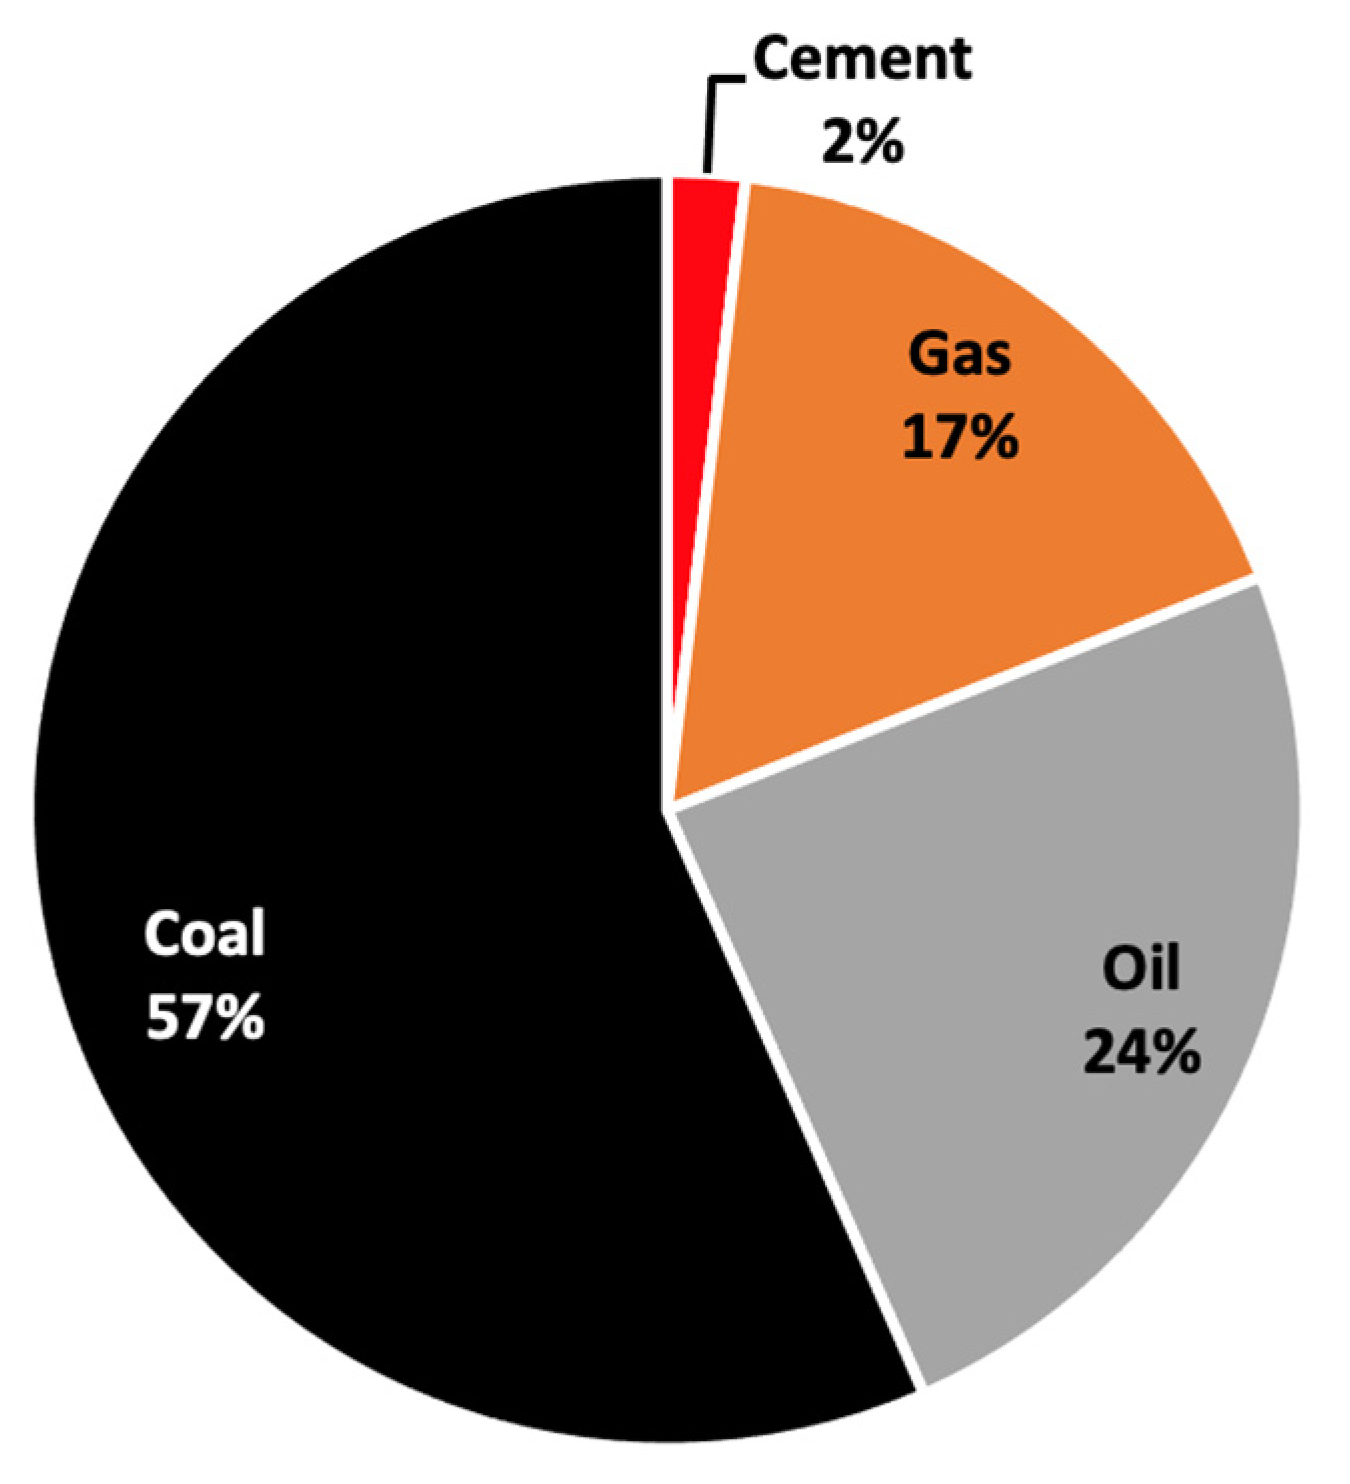
Electricity generation in Taiwan in the last two decades had been dominated by coal and gas (Figure 6) [24]. In 2020, 45% of Taiwan’s electricity was produced from coal, 36% from gas, 2% from oil, 11% from nuclear, and 6% from renewables (Figure 7a). In fact, renewable energies contributed to less than 6% of Taiwan’s electricity in the last two decades (Figure 7b). Figure 8a shows the history of Taiwan’s installed electricity capacity by fuel type. Among renewable energies, solar PV has the highest installed electricity capacity, followed by hydropower, wind, and bioenergy (Figure 8b). Solar PV was the only renewable energy with significant capacity additions in the last decade. The dominance of coal in Taiwan’s power sector is noteworthy. This is also where the biggest reduction in CO2 emission can be obtained by using clean coal technologies, implementing CCS, and switching to gas for power generation.

3.3. CO2 Emission

Figure 9 shows the history of Taiwan’s CO2 emission by source [3]. In 2020, 57% of Taiwan’s CO2 emission came from coal, 24% from oil, and 17% from gas (Figure 10). Consequently, by switching from coal to gas for power generation, Taiwan can reduce its CO2 emission by roughly 80 Mtpa (Figure 9a), as gas emits about half as much CO2 as coal when combusted.

4. Status of Renewable and Nuclear Energies in Taiwan

Figure 11 shows the history of Taiwan’s renewable electricity generation and installed capacity [24]. In 2020, hydroelectricity, which includes both conventional dam-based hydropower and pumped storage, had the biggest contribution (47%) to Taiwan’s renewable electricity generation (Figure 11a). This is followed by solar PV (22%), bioenergy (21%), onshore wind (9%), and then offshore wind (1%). It is worthwhile to note that although solar PV had the highest installed capacity (5.8 GW or 48%) in 2020 (Figure 11b), it contributed to only 6,095 GWh or 22% of renewable electricity generation (Figure 11a). This was due to its low capacity utilization of around 12%, based on our calculations.

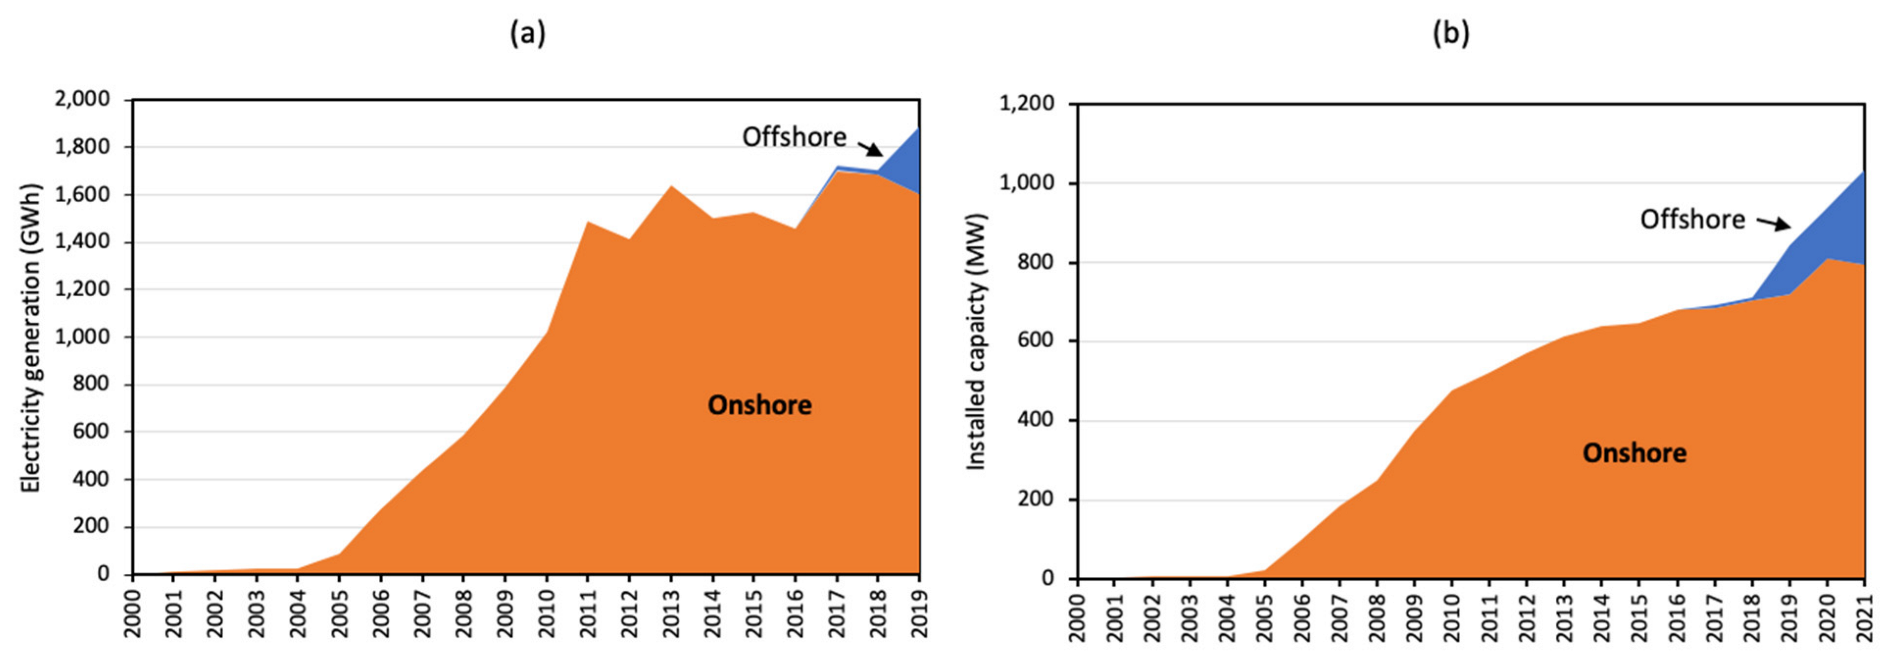
4.1. Status of Wind Energy

Figure 12 shows the history of Taiwan’s electricity generation and installed capacity by wind. As of 2021, Taiwan had 1.033 GW of wind energy capacity. Of this, 0.796 GW came from onshore wind and 0.237 GW from offshore wind (Figure 12a). However, the growth of onshore wind capacity has slowed in recent years due to land constraints [17]. Offshore wind installation began in 2017 and has been growing ever since [25,26,27,28]. However, this growth is constrained by several issues. First, offshore wind is mostly limited to the west coast of Taiwan, where the average wind speed approaches 10 m/s or higher, which is conducive to wind turbine operations. However, during the summer months, Taiwan is also subject to typhoons with wind speed exceeding 50 m/s. Strong winds and waves can damage wind turbine blades, towers, mooring systems, and substructures of offshore wind turbines. Consequently, offshore wind turbines in Taiwan need to be typhoon-resistant [29,30,31,32,33]. At present, the most advanced wind turbines are designed for North Sea operations and are inadequate to withstand typhoon conditions. More focused R&D is needed on typhoon-resilient wind turbines. Some innovations being considered include stronger material for the tower, flexible and shorter blades, backup power for nacelle yawing during strong winds, and vertical axis wind turbines. In addition, there are sustainability issues with offshore wind in Taiwan. For example, the west coast of Taiwan is a habitat for the endangered Indo-Pacific humpback dolphin [34]. Furthermore, sites designated for offshore wind development are also rich fishing grounds for coastal communities. Installation of offshore wind farms, which may interrupt or prohibit the use of marine resources on Taiwan’s west coast, will encounter resistance from local communities [34].

4.2. Status of Solar PV

Figure 13a,b shows the history of Taiwan’s electricity generation and installed capacity of solar PV, respectively [24]. Solar PV capacity has grown rapidly in the last decade [35,36,37,38,39,40]. In 2020, solar PV generated 6095 GWh of electricity, which was 2.2% of total electricity and 33% of renewable electricity. However, installation of solar PV has encountered local resistance due to a number of issues, including lack of environment impact assessment, unsuitable land being assigned, and lack of transmission lines [36]. Taiwan’s NZE plan will install 20 GW of solar PV capacity by 2025, with 8 GW on rooftops and 12 GW on the ground [39]. As of 2021, only 7.7 GW of solar PV capacity has been installed (Figure 13) [24], mostly by IPPs [41]. It is unlikely that another 12.3 GW, or 1.6 times current solar PV, will be installed by 2025.

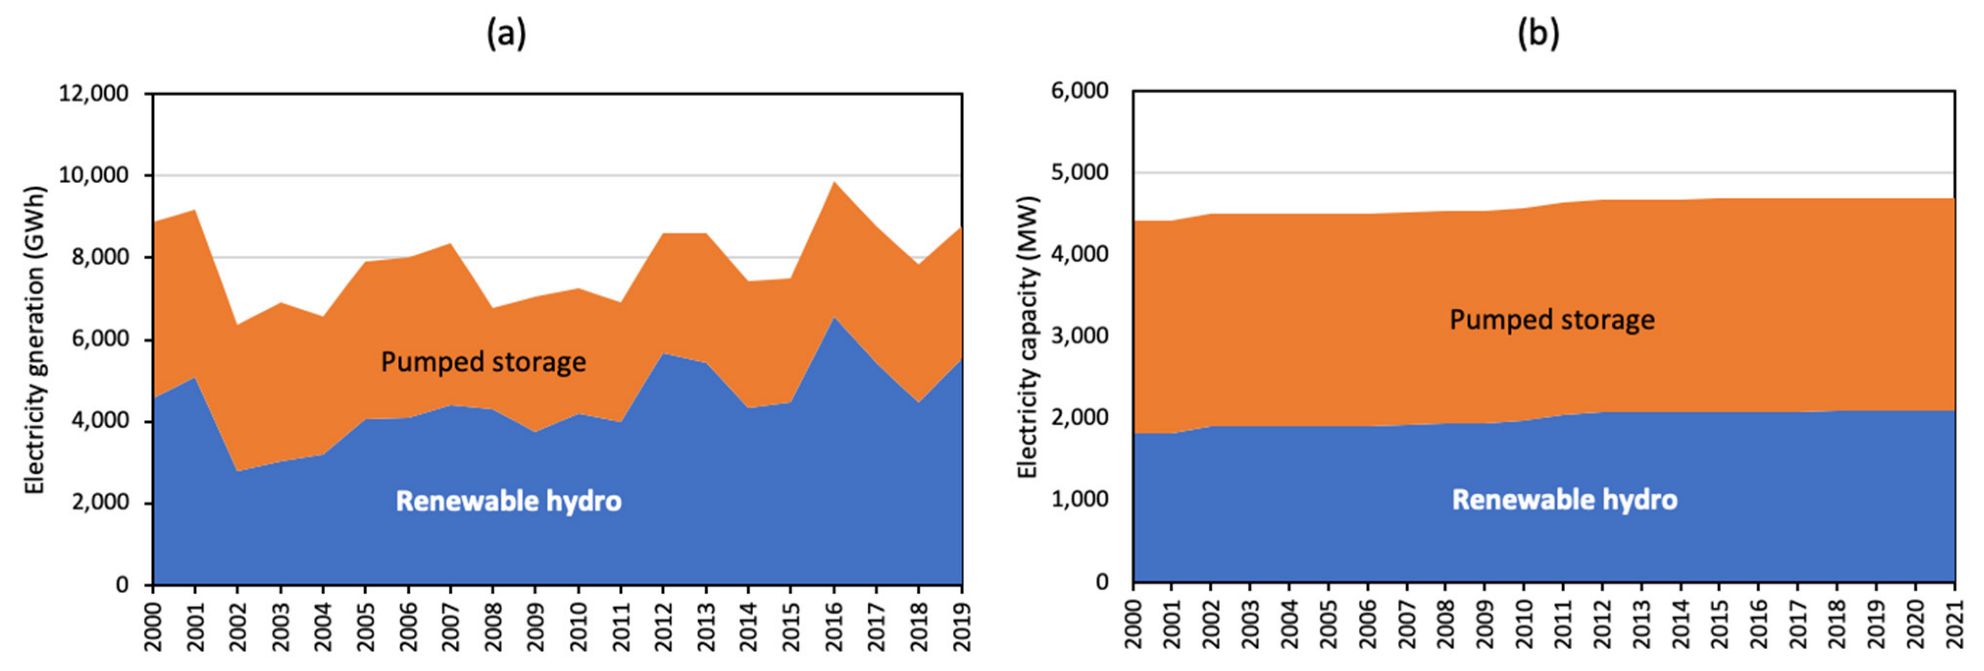
4.3. Status of Hydropower

As Taiwan receives an abundance of rainfall annually, hydroelectricity is the largest source of renewable electricity, despite challenges in water resource management such as dense population, mountainous terrain, typhoons, and droughts [41,42,43]. Figure 14 shows the history of Taiwan’s hydropower [24], consisting of conventional hydroelectricity and pumped storage. The capacity of both has remained constant over the last two decades (Figure 14b), as development has already been saturated [44]. Taiwan’s hydropower plants are evenly distributed across the island. The Dajiaxi power plant in Taichung and the Mingtan power plant in Nanton are the largest [41]. Future increase in hydropower will likely consist of smaller run-of-the-river stations with less environmental impact [45].

4.4. Status of Bioenergy

Figure 15 shows the history of Taiwan’s electricity generation by and capacity for bioenergy, which consists of renewable municipal waste and solid biofuels [24]. Municipal waste can further be categorized as household, commercial, or industrial. Taiwan’s rapid industrial growth has resulted in significant growth in industrial waste. In 2020, renewable municipal waste energy accounted for 19% of all renewable electricity generation in Taiwan [24]. In the 1980s, Taiwan faced a massive waste crisis due to limited landfill capacity. Since then, Taiwan has used incineration to convert waste treatment into ash, heat, and gas. Today, there are 24 incineration plants in Taiwan. Taiwan’s annual household waste generation is 7.2 Mt or 0.8 kg/person per day [42]. There is concern that incinerators may result in release of toxic heavy metals and particulate matter (PM2.5) to the environment. There is room for Taiwan’s incinerators to be upgraded to reduce their environmental impact. Taiwan also produces a small amount of solid biofuels from wood and other plants. However, Taiwan does not have a biocrop industry [42,44]. Recently, some researchers have shown interest in using waste from rice paddies to generate biofuels [46]. Given its large population, limited arable land, and the high value Taiwan places on its forests as CO2 sinks, it is unlikely that biocrop plantation will increase significantly in the future.

4.5. Status of Geothermal Energy

Located in the middle of the “Ring of Fire”, Taiwan has good potential for geothermal energy [45,47,48,49,50,51]. It has been estimated that Taiwan’s geothermal resources amount to 27 GWe within 2 to 3 km from the earth’s surface. Nine high-geothermal-gradient areas have been identified [50]. However, large-scale development of geothermal energy in Taiwan has yet to begin. Built in 2021, the Qingshui Geothermal Power Plant in Yilan county is Taiwan’s only operating geothermal power plant. It produces 180 °C hot water for power generation from a geothermal reservoir located 1.2–2.1 km below the earth’s surface and has an installed capacity of 4.2 MW [48].

4.6. Status of Nuclear Energy

Figure 16 shows the history of Taiwan nuclear electricity generation and installed capacity [24]. Taiwan has three operating nuclear power plants with a combined capacity of 3.87 GW, which produced 31.44 TWh of electricity or 11% of total electricity generation in 2020 [24]. A fourth power plant was under construction but was cancelled. In response to Japan’s Fukushima nuclear incident in 2011, Taiwan’s NZE plan will phase out nuclear power by 2025 [8,52,53,54,55,56,57]. However, some researchers have warned this will cause a shortfall of electricity [57].

5. Status of Fossil Energies in Taiwan

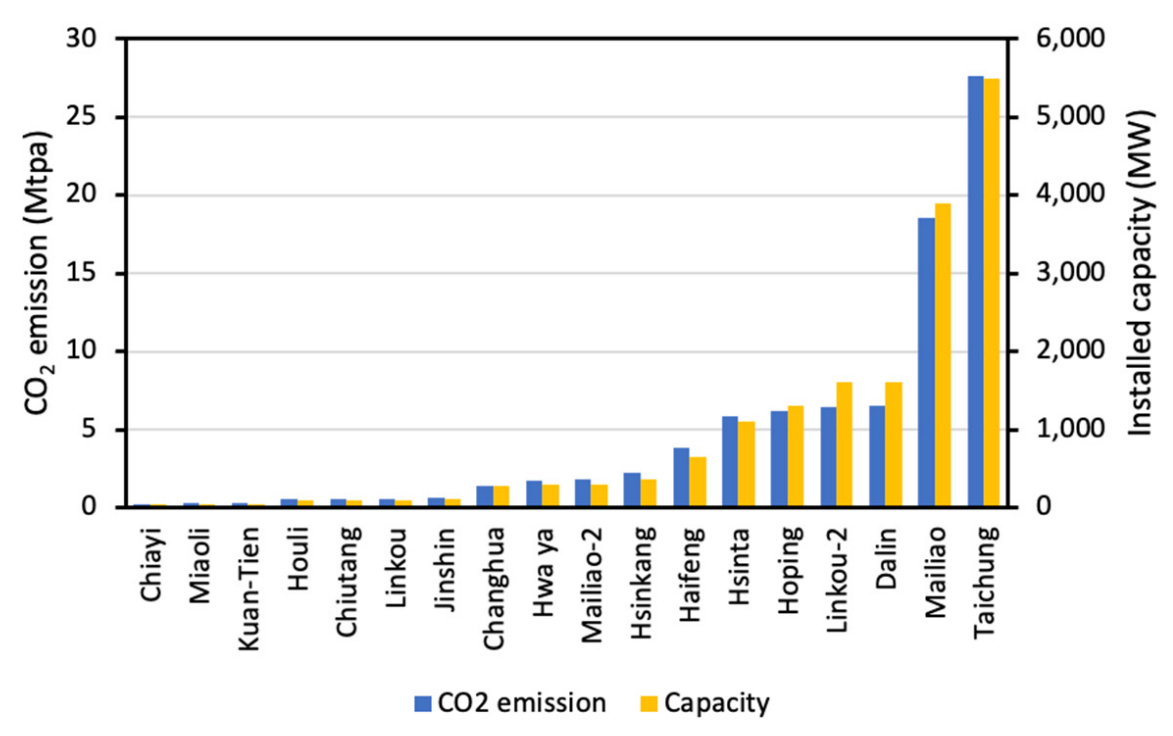
5.1. Status of Coal-Fired Power Plants

Figure 17 shows the history of Taiwan’s fossil electricity generation and capacity [24]. In 2020, coal, gas, and oil contributed to 45%, 36%, and 1.6%, respectively, of Taiwan’s total electricity generation (Figure 17a). Their installed capacity was 21 GW, 19 GW, and 2.1 GW, respectively, representing 35%, 32%, and 3.5% of Taiwan’s electricity capacity in 2021 (Figure 17b). According to the NZE plan, there will be no new coal-fired plants after 2025, and all coal-fired power plants will be phased out by 2050 [8].
There are 20 coal-fired power stations in Taiwan, with a combined capacity of 21 GW in 2021 [58]. Together, they produced 86 Mtpa CO2 [59]. Figure 18 shows the CO2 emission and capacity of coal-fired power plants in Taiwan [59]. The Taichung and Mailiao power plants are the biggest coal-fired fired power plants in Taiwan, with capacity of 5.5 GW and 3.9 GW, respectively. They emit 28 Mtpa and 19 Mtpa CO2, respectively, and are therefore candidates for application of clean coal technologies. If all coal-fired power plants are replaced by gas-fired power plants, Taiwan’s CO2 emission can be reduced by 43 Mtpa or by 15%.

5.2. Status of Gas-Fired Power Plants

There are 11 gas-fired power plants in Taiwan, with a combined capacity of 19 GW in 2021 [24]. They emitted about 32 Mtpa CO2 [59]. Figure 19 shows the CO2 emission and installed capacity of gas-fired power plants in Taiwan. Taiwan imported 17.7 Mtpa of LNG in 2020, with 84% being used for generation of electricity and cogeneration [5].

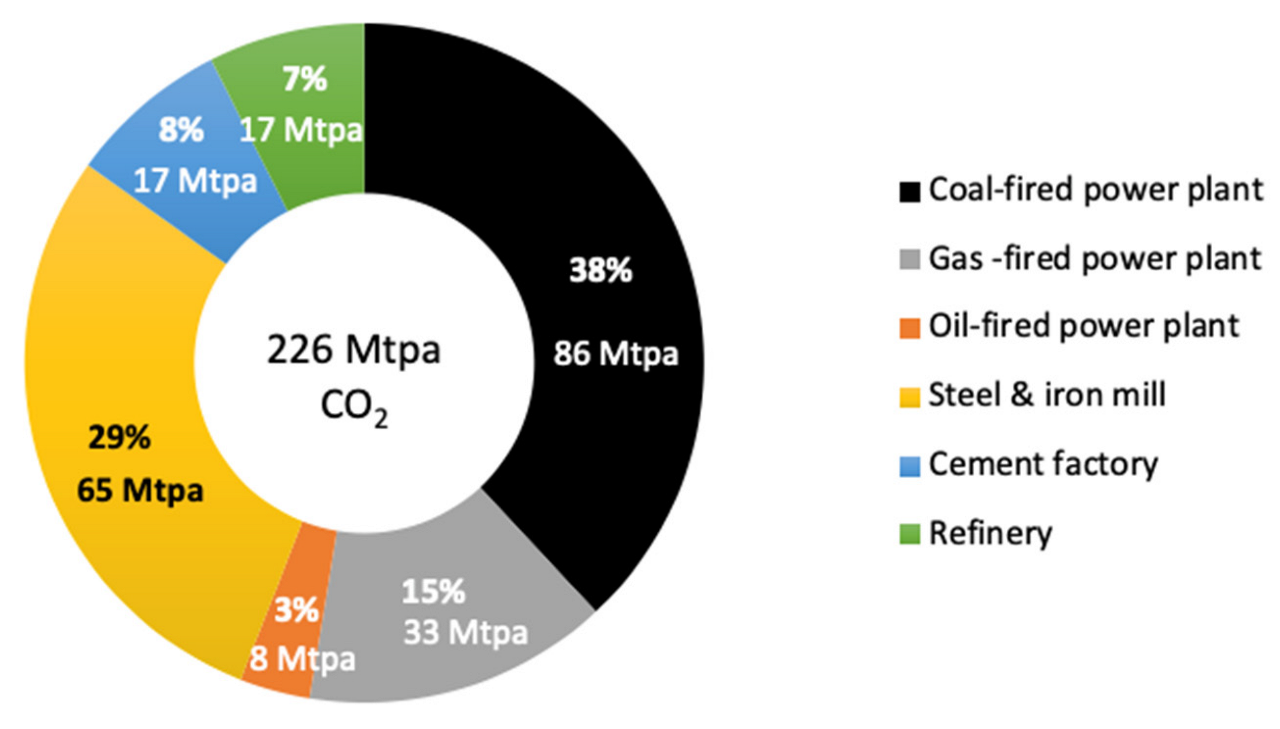
5.3. Fossil-Related CO2 Emission

Figure 20 shows Taiwan’s fossil-related CO2 emission by sector [60,61]. In 2011, the power, industry, transport, and building sectors contributed to 56%, 27%, 13%, and 4% of Taiwan’s CO2 emission, respectively (Figure 20b). In 2011, the power sector alone emitted 155 Mtpa CO2, the industry sector 75 Mtpa, and the transport sector 35 Mtpa (Figure 20a). This suggests that switching from coal to gas in the power and industry sector can have a significant impact on reducing overall CO2 emission. In addition, applying CCS to gas-fired power and industry plants can also contribute to significant reduction in overall CO2 emission.
Figure 21 shows CO2 emission from the power and industry sectors of Taiwan in 2020 [59]. In the industry sector, iron and steel, cement factories, and refineries produced 65, 17, and 17 Mtpa CO2, respectively.

6. Decarbonization Technologies

Table A1 lists a set of 20 decarbonization technologies for the power, transport and industry sectors, which have been discussed in recent publications [62,63,64]. In this study, we screen these technologies according to six categories (sustainability, security, affordability, reliability, readiness, and impact) to determine those with the most potential for Taiwan.

6.1. Sustainability Screening

In sustainability screening, we rank each technology on five categories: CO2 emission, material footprint, and impact on people, animals, and environment. The criteria used are given in Table A2, Table A3 and Table A4 in the Appendix A. The details of the screening are given in Table A8 and Table A9 in Appendix B. Results are given in Table 1. It is worthwhile to note that renewable electricity technologies including hydro, solar PV, wind, and geothermal rank high in material footprint due to large amounts of materials needed to produce each TWh of electricity, according to estimates by the US Department of Energy (Table A8). This also causes green hydrogen to rank high in material footprint. EV is ranked high in material footprint because of large amounts of material extracted and processed per EV battery (Table A9). Nuclear, hydro, wind, and bio have medium rank in impact on people, animals, and environment, with details given in Table A9.
Table 1. Sustainability screening for decarbonization technologies.
SectorTechnologyCO2 EmissionMaterial
Footprint
Impact on
People
Impact on
Animals
Impact on
Environ.
AllGreen H2LHLL to ML to M
CCULL to HLLL
PowerNuclearLLMMM
HydropowerLHMMM
Solar PVLHLLM
Onshore windLHLMM
Offshore windLHLMM
BioenergyLMMMM
GeothermalLHLLL
Coal→gasMLLLL
CP-CCSLMLLL
GP-CCSLLLLL
Clean coalMMLLL
TransportEVLHLLL
HFCVLLLLL
H2-marineLLLLL
Bio-aviationLMMMM
IndustryCoal→H2-CCSLMLLL
Gas→H2-CCSLLLLL
Ind-CCSLLLLL
Color code: Green, yellow, and red signify low, medium, and high, respectively.

6.2. Energy Quadrilemma Screening

Energy quadrilemma refers to energy sustainability, security, affordability, and reliability. The criteria for ranking in energy quadrilemma are given in Table A5. The results of sustainability ranking are carried forward to energy quadrilemma ranking. Energy security refers to whether the energy resource is available domestically. A low rank means the energy resource is either unavailable domestically or has to be imported. Energy affordability refers to whether the technology is readily affordable for large-scale application. We rank a technology’s reliability according to its capacity factor, i.e., the percent of time in a year that this technology can be operated. The capacity factors for Taiwan’s electricity technologies, based on the authors’ estimates using data published in [24], are given in Table A7.
Ranking results are given in Table 2. Green hydrogen, hydropower, solar PV, wind, geothermal, and EV are ranked low (red) in one or more categories of the energy quadrilemma. Green hydrogen is ranked low (red) in affordability, because it is unavailable in industrial quantities in Taiwan and is expensive ($3–7/kg) [65]. Solar PV is ranked low (red) in reliability because of its low capacity utilization (11%) (Table A7). In addition, green hydrogen, hydro, solar PV, wind, geo, and EV are ranked low in sustainability because of their high material footprint (Table 1).
Table 2. Energy quadrilemma screening for decarbonization technologies.
SectorTechnologySustainabilitySecurityAffordabilityReliability
AllGreen H2LLLH
CCUMHHH
PowerNuclearMMHH
HydropowerLHHM
Solar PVLHHL
Onshore windLHHM
Offshore windLHHM
BioenergyMHHH
GeothermalLMHH
Coal→gasMMHH
CP-CCSMMHH
GP-CCSHMHH
Clean coalMMHH
TransportEVLHHH
HFCVHHHH
H2-marineHHMH
Bio-aviationMHMH
IndustryCoal→H2-CCSMMMH
Gas→H2-CCSHMMH
Ind-CCSHHHH
Color code: green, yellow, and red signify high, medium, and low ranking, respectively.

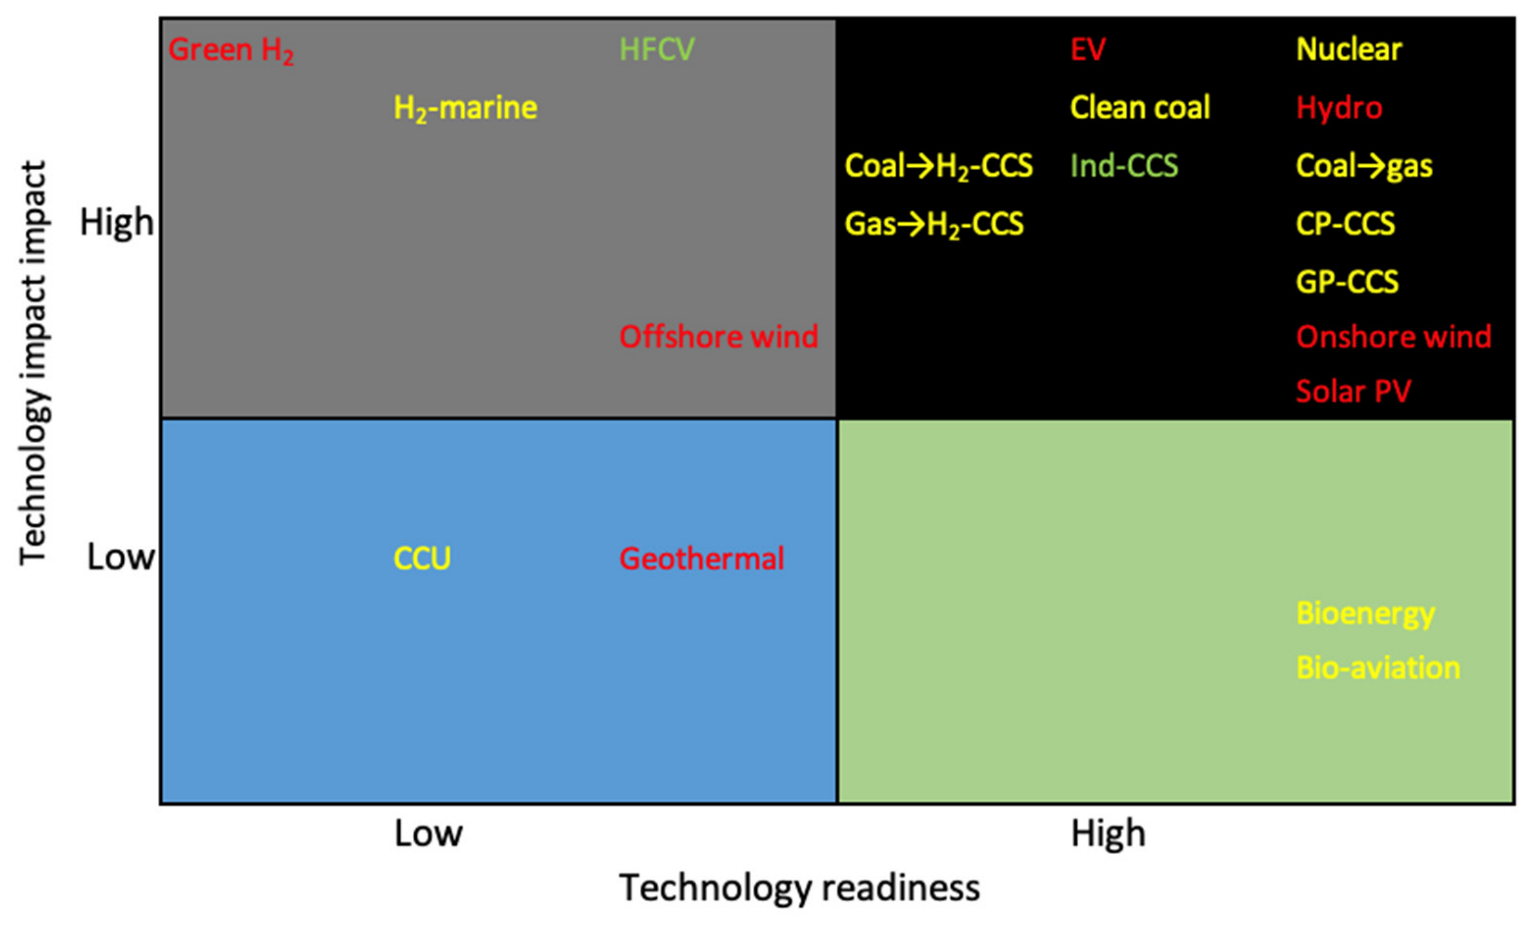
6.3. Technology Mapping

Each decarbonization technology is also ranked according to its readiness level and impact on decarbonization. The criteria for the mapping are given in Table A6. Results are given in Figure 22. The color of different quadrants is unimportant, but the color of the technology carries meaning. Red color denotes a low ranking (red) in one or more categories of the energy quadrilemma. Yellow color denotes a medium ranking (yellow) in one or more category in the energy quadrilemma and no red ranking. Green color denotes a high ranking (green) in all categories of the energy quadrilemma. Technologies that are ranked high in impact and low in readiness (upper left quadrant in Figure 22) are those that need more R&D before large-scale applications can be made.

6.4. Composite Ranking

Figure 23 shows the composite ranking of the 20 decarbonization technologies in radar charts. In each chart, a technology is ranked according to six categories: sustainability, security, affordability, reliability, readiness, and impact. Rankings of 1, 2, and 3 refer to low, medium, and high ranking in each respective category. Of all the technologies, only Ind-CCS has a high ranking in all six categories. GP-CCS, HFCV, EV rank high in five out of six categories. Seven technologies (hydro, bio, solar PV, nuclear, coal→gas, CP-CCS, and Clean coal) rank high in four out of six categories. Four technologies (Onshore wind, CCU, bio-aviation, Gas→H2-CCS) rank high in three out of six categories. Figure 22 and Figure 23 can be used together to determine a technology’s potential for decarbonization and areas that need more R&D.

7. Proposed Decarbonization Roadmap

Based on the technology ranking exercises described in the previous section, technologies that have the most potential for Taiwan’s decarbonization are listed in Table 3. Technologies are divided into three tiers according to their potential.

7.1. Power Sector Decarbonization

7.1.1. Clean Coal Technologies

In 2020, 45% of Taiwan’s electricity generation came from coal-fired power plants, which had a combined capacity of 21 GW. Together, they emitted 86 Mtpa CO2 or 31% of Taiwan’s total annual CO2 emission. The NZE plan will stop construction of new coal-fired power plants by 2025 and phase out all coal-fired power plants by 2050. However, before existing coal-fired power plants are decommissioned, there is an urgent need to reduce their CO2 emission. The International Energy Agency (IEA) has identified four groups of clean coal technologies (CCTs) which have the capability to reduce CO2 emission from coal-fired power plants: coal upgrading, efficiency improvement, advanced technologies, and CCS [66]. Coal upgrading includes coal washing, drying, and briquetting, which can reduce CO2 emissions by as much as 5%. In addition, efficiency improvements in existing conventional sub-critical plants can achieve thermal efficiencies of up to 40% and reduce CO2 emission by up to 22%. They include heating pulverized coal to produce supercritical (540–566 °C and 250 bar) or ultra-supercritical (590 °C and 250 bar) steam for high-efficiency (up to 45%) electricity generation. Advanced technologies include integrated gasification combined cycle (IGCC) and pressurized fluidized bed combustion. They can reduce CO2 emission up to 25%. There is much room for improving the thermal efficiencies of Taiwan’s coal-fired power plants. The prime targets for decarbonization are the sub-critical Taichung and Mailiao coal-fired power plants, which emit 28 and 19 Mtpa CO2, respectively (Figure 18). In this study, we exclude CCS from CCTs, as it is discussed separately.

7.1.2. CP-CCS

Installing CCS in Taiwan’s coal-fired power plants will enable them to reduce CO2 emission to near-zero. Post-combustion carbon capture can be retrofitted into existing coal-fired power plants [67]. Recently, Zhang et al. (2022) have suggested capturing CO2 from power and industry plants in Taiwan and transporting it to the Tiechenshan gas field for CO2-enhanced gas recovery or to saline aquifers in the West Taiwan Basin for permanent storage [59].

7.1.3. Coal→Gas

Replacing coal with gas for power generation will go a long way toward decarbonizing Taiwan’s power sector. If all coal-fired power plants are converted to gas-fired power plants, CO2 emission in Taiwan will be reduced by 43 Mtpa or 16%. This will be a significant reduction. Some of Taiwan’s coal-fired power plants have installed new gas-fired units. However, retiring old coal-fired units and replacing them with new gas-fired units will make a significant contribution to Taiwan’s decarbonization.
Wholesale replacement of coal-fired power plants by gas-fired power plants will require securing more long-term LNG contracts and building additional LNG terminals. Taiwan is the world’s fifth-largest LNG importer, receiving 17.7 Mtpa LNG in 2020, with 28% from Qatar, 27% from Australia, and 13.5% from Russia [5]. Taiwan has two LNG import terminals and plans to build two new ones to increase LNG importing capacity to 30 Mtpa by 2027 [68].

7.1.4. GP-CCS

Installing CCS in current and future gas-fired power plants will be important for Taiwan to achieve net-zero by 2050. Collateral learnings from Norway’s Longship and the UK’s East Coast Cluster projects will be useful [69,70].

7.1.5. Nuclear Power Plants

Taiwan’s NZE plan will phase out all nuclear power by 2025 [8]. In 2020, the three nuclear power plants in Taiwan generated 31.44 TWh or 11% of Taiwan’s electricity [24]. They have a combined capacity of 3.872 GW. Retiring all of them by 2025 may result in power shortage, as it is unlikely that wind or solar PV will completely replace nuclear by then [57]. We recommend a gradual phasing out of nuclear energy by 2050.

7.1.6. Onshore Wind

According to Figure 12b, installed capacity of onshore wind has plateaued at around 800 MW since 2020, due to lack of suitable land [17]. The NZE plan includes 40 GW of wind power installed by 2030, with 10 GW in onshore wind [8]. It is unlikely that this goal will be reached by 2030 due to limited available land.

7.1.7. Offshore Wind

As discussed in Section 4, offshore wind faces headwind due to the lack of typhoon-resilient design and water depth limitation to 120 m [71]. Other technology barriers include a lack of installation vessels and local companies with sufficient manufacturing capability [20]. More R&D is needed to mature typhoon-resistant wind turbine design in Taiwan. Furthermore, sustainability concerns for the effect of offshore wind turbines on marine life and fishing activities need to be addressed. Offshore wind turbines had a capacity of 237 MW in 2021 [24]. The NZE plan will increase it to 30 GW by 2030 [8]. Given the low technology readiness of offshore wind (Figure 22), it is unlikely that this goal can be achieved.

7.1.8. Solar PV

Despite its rapid growth, solar PV contributed to only 2.18% of total electricity generation in Taiwan and 10% of total installed capacity in 2020. Taiwan’s NZE plan will increase solar PV capacity from 7.7 GW in 2021 to 20 GW in 2025 [8]. There are three types of solar PV in Taiwan: rooftop, on ground, and on water. Rooftop solar PV will eventually be limited due to space constraints. On-ground solar PV faces competition for scarce arable land and other types of land usage. On-water solar PV is limited to relatively calm water or inland lakes. Furthermore, solar PV suffers from a low capacity-utilization factor of around 11% by our calculations. Practically, this means that more solar PV capacity is needed to produced the same output of electricity compared to other forms of renewable or fossil energy. There is no consensus as to rooftop solar PV’s potential in Taiwan. Chen et al. (2010) estimate it to be 65 TWh/y [72], Yue and Huang (2011) estimate it to be 36.1 TWh/r [73], and Ko et al. (2015) estimate it to be 15.4 TWh/y [74]. It is unlikely that solar PV will reach 20 GW by 2025, as per the NZE plan, due to space limitation, high capital investment, and decreasing feed-in tariffs [39].

7.1.9. Hydropower

Taiwan’s hydropower capacity has stayed constant at 4.695 GW in the last decade [24]. Furthermore, Taiwan’s hydropower stations are old and require modernization. There is currently no plan to increase hydropower capacity. Construction of new dams in large rivers will face sustainability issues including loss of sediment, adverse impact on fishery, biodiversity, and impact on riparian communities. There may be room for small run-of-the-river hydropower plants to be installed, especially in mountainous areas [45].

7.1.10. Hydrogen

At present, there is no industrial production of either blue or green hydrogen for power generation. Electricity generation by green hydrogen will be more expensive than any form of renewable electricity [65]. Although the NZE plan mentions the use of hydrogen for power generation, there is no detail. It probably will not occur until there is an abundance of renewable electricity. However, Taiwan needs a hydrogen strategy as part of its national energy policy.

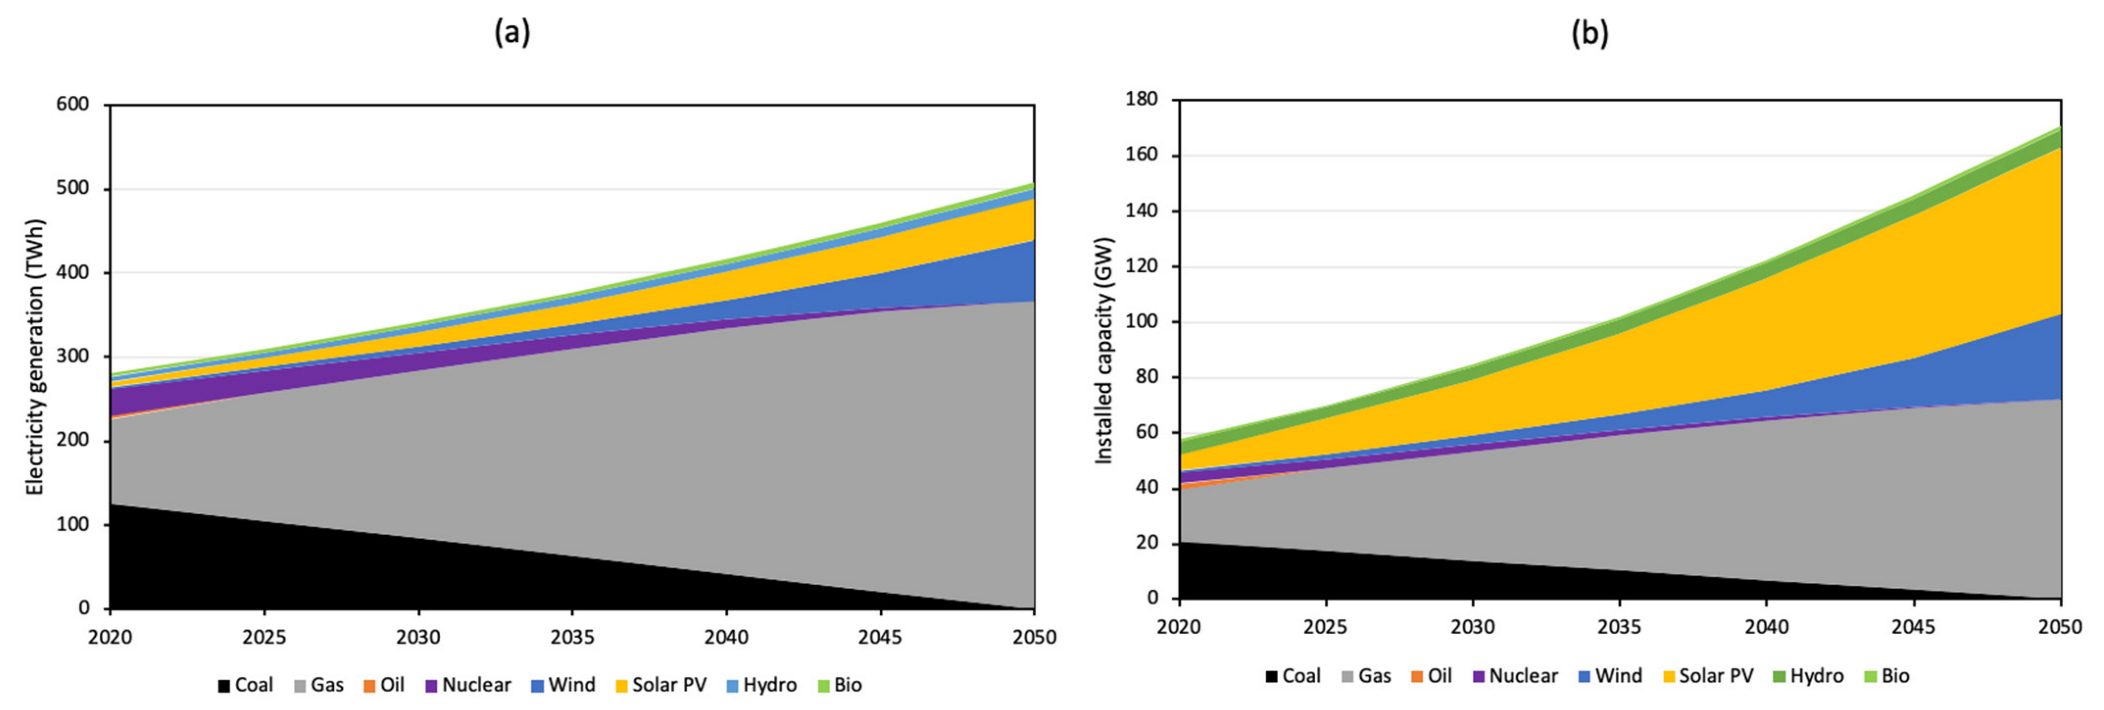
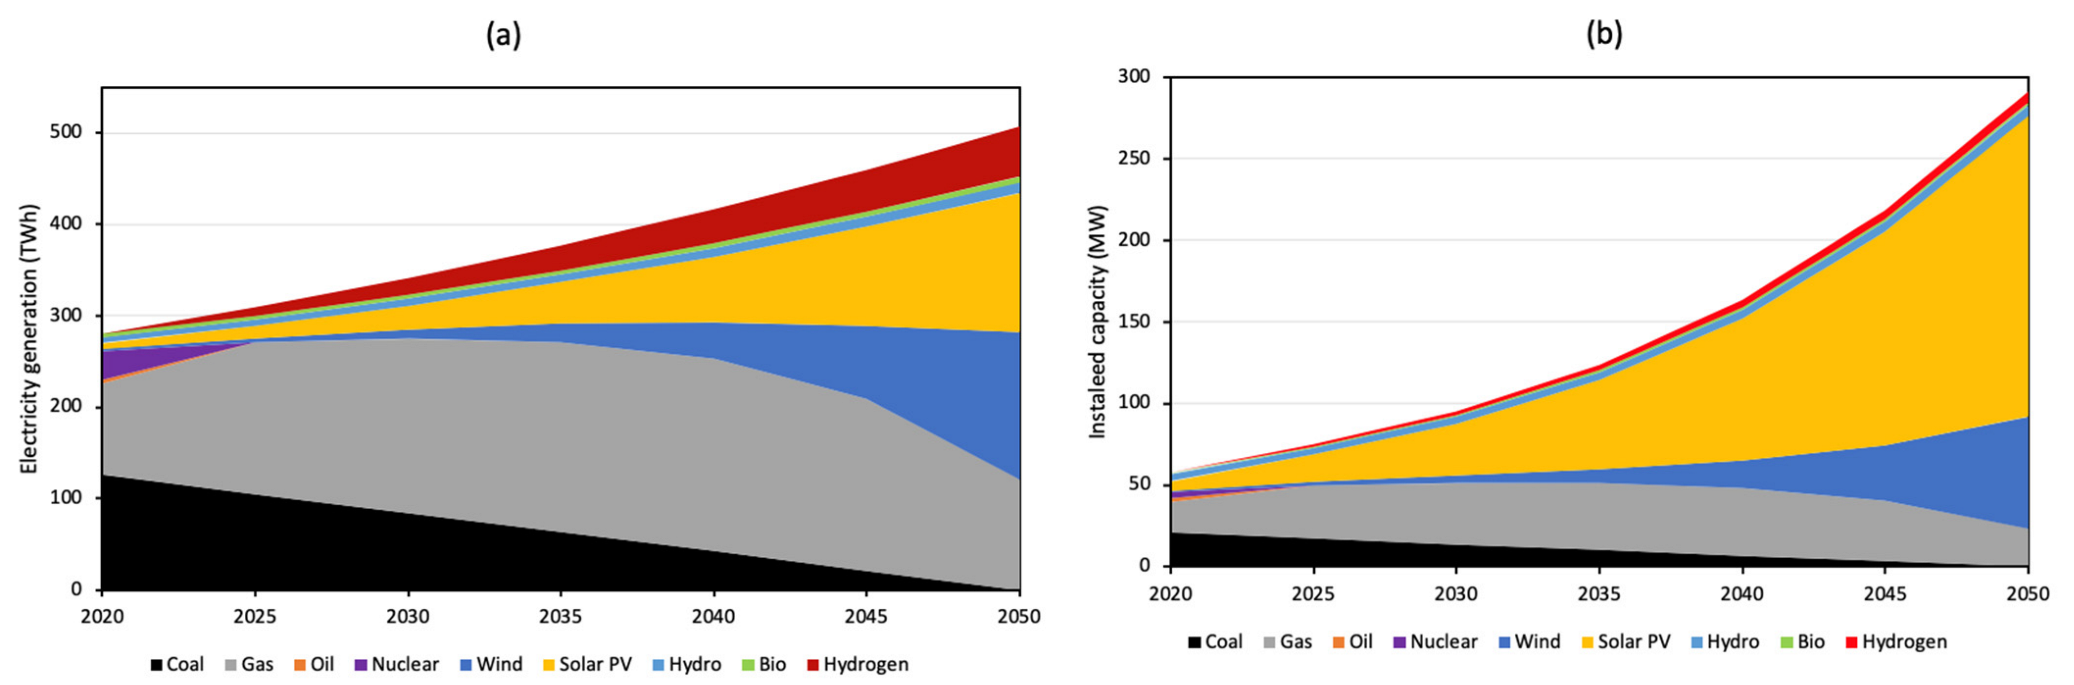
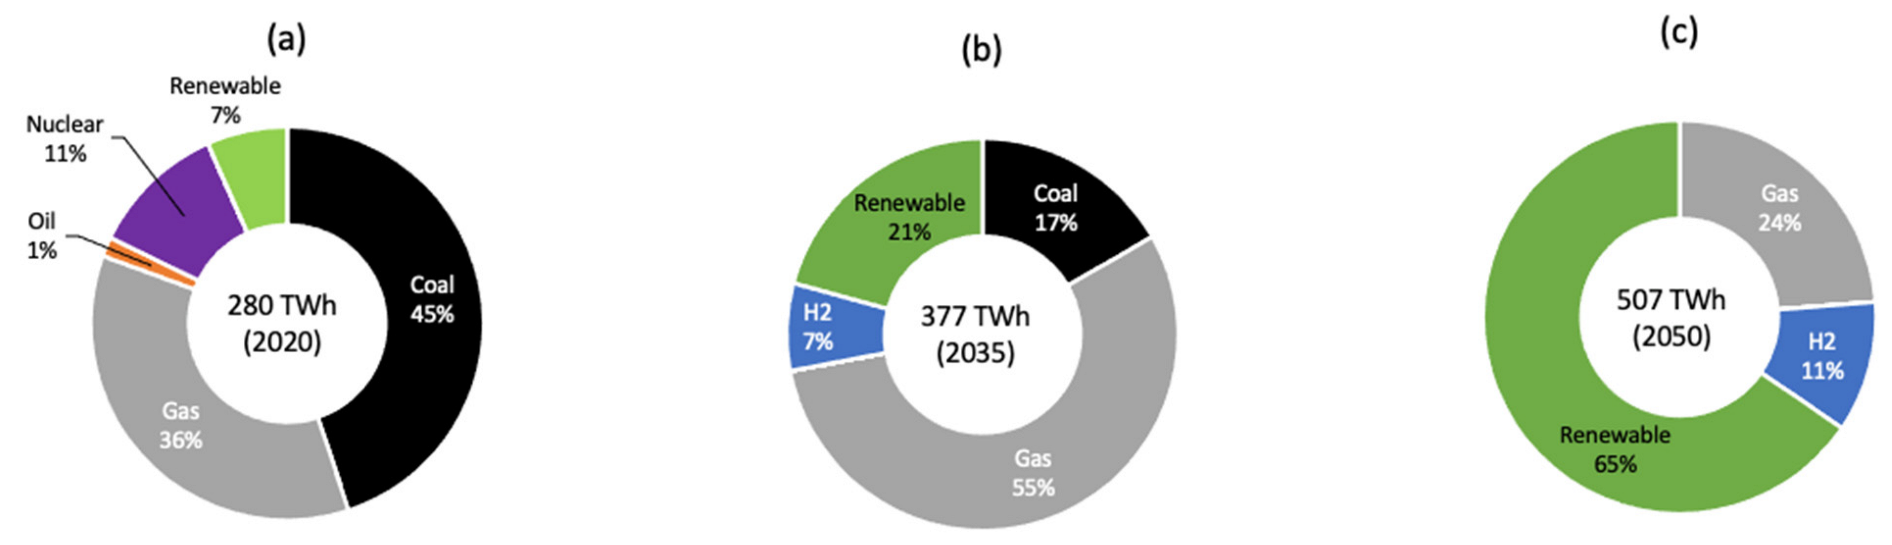
7.1.11. Proposed Decarbonization Roadmap for the Power Sector

Among decarbonization technologies, the ones that have the highest potential of making a difference in the power sector are: (1) GP-CCS, (2) coal→gas, (3) CP-CCS, (4) CCTs, and (5) nuclear energy (Table 3).
We propose a power sector decarbonization roadmap shown in Figure 24 and Figure 25. In constructing this roadmap, we make the following assumptions: (1) electricity generation will increase at average annual growth rate (AAGR) of 2% annually, (2) renewable electricity generation will grow at an AAGR of 7%, (3) oil-fired power plants will be phased out by 2025, (4) nuclear power plants will be phased out by 2050, (5) hydrogen will be used in the transport and industry sectors but not in the power sector, (6) coal-fired power plants will be phased out by 2050, and (7) CCS will be installed in coal- and gas-fired power plants as soon as possible. Assumptions (1), (3), and (6) are the same as those in NZE plan. Assumption (4) differs from the NZE plan, which will phase out nuclear energy by 2025. Assumption (7) differs from the NZE plan by bringing CCS forward. Assumption (2) is the major difference between this study and the NZE plan, which assumes an AAGR of 10.1% for renewable electricity generation.
The key features of this decarbonizing roadmap are as follows. First, renewables’ share in electricity generation increases from 7% in 2020 to 28% in 2050 (30 years) (Figure 24), while renewable electricity generation increases from 18 TWh to 141 TWh (Figure 25). This increase is shared by both solar PV and wind, with moderate increase in other forms of renewable energies (Figure 24a). Second, gas’ share in electricity generation increases from 36% in 2020 to 72% in 2050, while electricity generation from gas increases from 100 TWh in 2020 to 367 TWh in 2050 (Figure 25). Third, CCS is gradually increases to mitigate CO2 emission from gas-fired power plants, achieving 151 Mtpa CO2 by 2050. Fourth, between now and 2050, clean coal technologies and CCS are used to mitigate CO2 emission from coal-fired power plants.

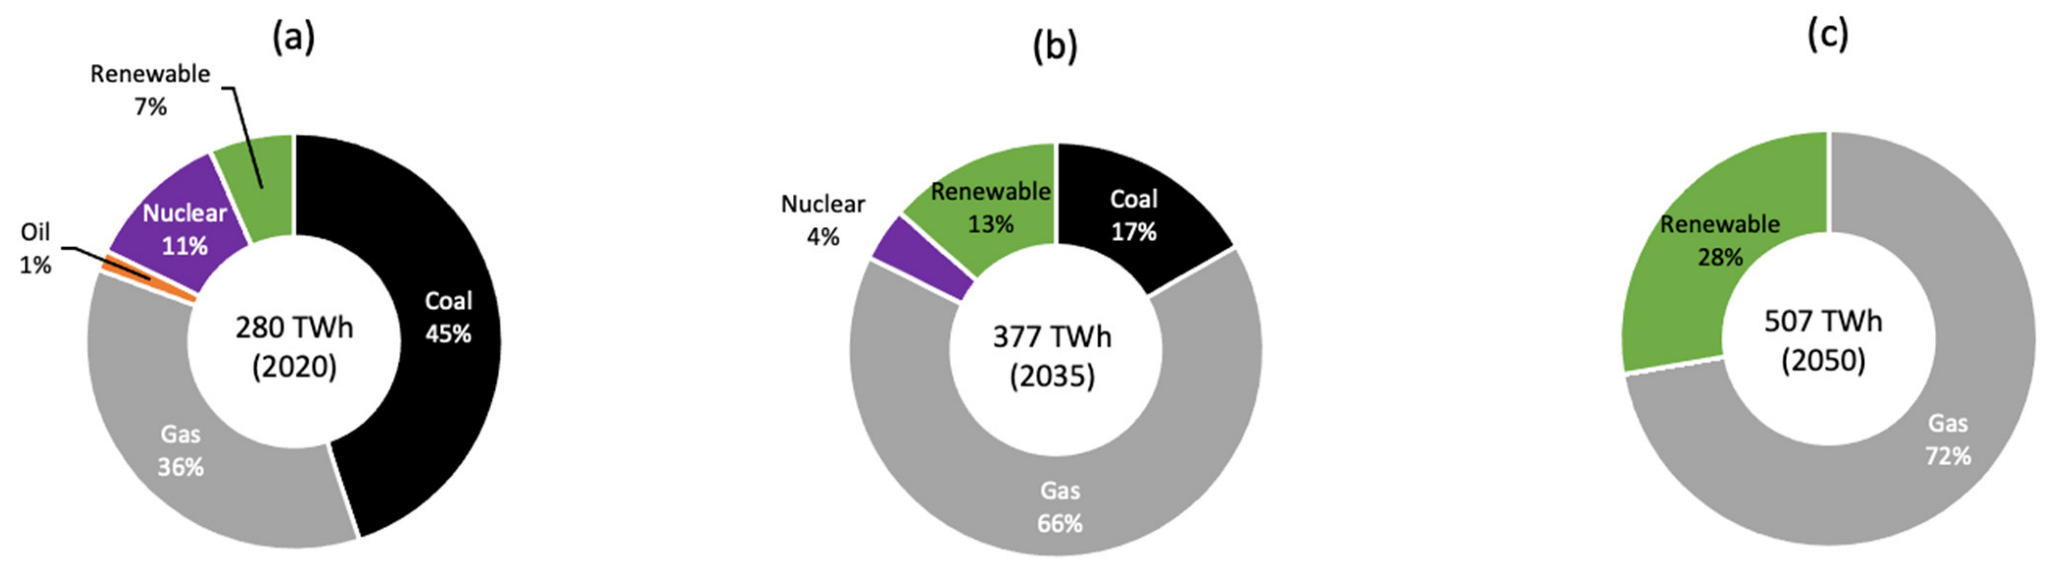
7.1.12. Comparison with Decarbonization Roadmap Announced by Taiwan’s NZE Plan

The power sector decarbonization roadmap announced by the NZE plan can be derived from Figure 1. Results are shown in Figure 26 and Figure 27. A comparison between them and Figure 24 and Figure 25 reveals several differences between the two roadmaps. First, the NZE roadmap relies heavily on renewable energy to replace nuclear and coal. In the NSE plan, renewable energy has an AAGR of 10.1%. We believe this is unachievable due to technology readiness and sustainability issues for both wind and solar PV discussed earlier. Second, in the NZE plan, CCS will not be installed in coal- and gas-fired power plants until 2040. On the other hand, this study proposes installing CCS in coal- and gas-fired power plants as soon as possible. Third, in the NZE plan, hydrogen will contribute to 11% of power generation by 2050 (Figure 25c). This study does not use hydrogen for power generation but instead for decarbonizing hard-to-decarbonize industries such as iron and steel mills and cement factories. Fourth, in the NZE plan, gas’ contribution to power generation increases from 36% in 2020 to 55% in 2035 and then decreases to 24% in 2050 (Figure 27). In the roadmap proposed by this study, gas’ contribution to electricity generation increases from 36% in 2020 to 66% in 2035 and then to 72% in 2050. The major difference between the two roadmaps is that the NZE roadmap relies more on wind and solar PV to replace coal and nuclear. This study’s roadmap relies heavily on gas to replace coal and nuclear while also allowing for significant increase in wind and solar PV capacity. In addition, CCS plays a key role and will be implemented as soon as possible. The differences between the two roadmaps are listed in Table 4. Although the NZE plan stipulates about 11% of electricity generation by hydrogen, no details of how to achieve this are given [8].

7.2. Transport Sector Decarbonization

For the transport sector, the major decarbonization approach is replacing internal combustion engine (ICE) vehicles with electric vehicles (EVs). The NZE plan calls for all new car and scooter sales to be electric by 2040. The increase in electricity demand due to electrification of road transport is assumed to be included in the 2 ± 0.5% AAGR in electricity generation. There is no mentioning of how marine and aviation transport are to be decarbonized. However, the plan proposed by this study differs from the NZE plan in advocating HFCV, H2-marine, and bio-aviation in the medium- to long-term future.

7.3. Industry Sector Decarbonization

In the industry sector, the NZE plan advocates using green hydrogen, biomass, and CCUS in the steelmaking, chemical, and cement industries, starting in 2040. This study advocates using CCS in these industries as soon as possible and using blue hydrogen in the medium future. Green hydrogen is produced by electrolysis of water using renewable electricity, whereas blue hydrogen is produced from either coal by coal gasification or natural gas by steam methane reforming, with CCS used to mitigate the produced CO2 [65,67]. In 2020, Taiwan emitted 65 Mtpa CO2 from steel and iron mills, 17 Mtpa CO2 from cement factories, and 17 Mtpa CO2 from refineries (Figure 21). These are also targets for CCS, to be implemented as soon as possible. In the medium term, use of blue hydrogen to decarbonize steelmaking and cement industries is preferred. Furthermore, in this study, CCS will play an important role due to its high technology-readiness level, while the role of CCU may be limited until its technology-readiness level is increased by more R&D.

8. Role of CCS in Decarbonization

CCS has an important role to play in the ongoing energy transition [67]. The International Energy Agency (IEA), Intergovernmental Panel on Climate Change (IPCC), and International Renewable Energy Agency (IRENA) have all stated that reaching a net-zero emissions economy will be impossible without CCS [75,76,77].
As of 2020, there were 28 large-scale CCS projects in operation worldwide, storing a total of 41 Mtpa CO2 [78], and more are being planned. Actual CCS projects being planned in Europe include the Longship project with a CCS target of 0.8–5.0 Mtpa CO2 [69,70], the UK’s East Coast Cluster project (27 Mtpa CO2) [79] and Acorn project (5–10 Mtpa CO2) [80], and the Netherlands’ Porthos CCS projects (2.5 Mtpa CO2) [81].
Recently, Zhang et al. (2022) estimated that there is 416 Gt of CO2 storage capacity in India, with 99% residing in saline aquifers. This is enough to store two centuries of CO2 emission from the power and industry sectors [82]. Bokka et al. (2022) estimate there is 141 Gt of subsurface CO2 storage capacity in the western states of Maharashtra and Gujarat in India, which is enough to store four centuries of CO2 emission from these states [83]. Zhang and Lau (2022) estimate there is 386 Gt of subsurface CO2 storage capacity within a 1000 km radius from Singapore, which is enough to store one century of stationary CO2 [84]. Zhang et al. (2022) estimate there is 79 Gt of subsurface CO2 storage capacity in Thailand which is enough to store 554 years of stationary CO2 emissions [85].
These authors have proposed establishing regional CCS corridors to facilitate implementation of CCS projects by using economies of scale [86]. Recently, the Indonesian government has been planning to install CCS in the depleted giant Arun gas field in North Sumatra [87,88].
Zhang et al. (2022) recently estimated that there is 3.6 Gt of CO2 storage capacity in saline aquifers in the West Taiwan basin, which can serve as storage sites for anthropogenic CO2 emission from the west coast of Taiwan [59]. Future work is needed to characterize these saline aquifers with respect to reservoir temperature and pressure, porosity, permeability, connectivity, seal integrity, reservoir boundaries, and existence of nearby faults. Reservoir simulations on pressure buildup and CO2 plume migration during CO2 injection will also be needed before field implementation. Nonetheless, such work is common in field development planning of oil and gas projects. In the NZE plan, CCS will be deployed beginning in 2040. In this study, we propose deploying CCS at scale as soon as possible, as it will play a critical role in Taiwan’s decarbonization.

9. Energy Policy Implications

9.1. Promulgating a Credible Carbon Tax

Taiwan currently has neither a carbon tax nor a carbon credit, although one is being planned for 2022. In Asia, Singapore is the only country with a carbon tax of USD 3.6/ton, which will be increased to USD 18/ton in 2024 and then USD 36–57/ton in 2030 [89]. Promulgating a credible carbon tax is the first step towards incentivizing companies, including state-owned utility companies, to reduce CO2 emission [22]. Revenue from the carbon tax can also be used to fund R&D in low-carbon technologies. However, it will take strong political will to impose a credible carbon tax. It is no wonder that countries that are planning large-scale implementation of CCS projects are those with the highest carbon tax [69,70,80,81].

9.2. Switching from Coal to Gas in Power Generation

Switching from coal to gas should be a key component of Taiwan’s energy transition plan. One major difference between the plan proposed by this report and the NZE plan is the role of gas in the energy transition. In the NZE plan, coal-fired power plants will be replaced by renewable power plants, mostly by wind and solar PV. In this study, they will be replaced mostly by gas-fired power plants equipped with CCS and secondarily by renewable power plants. Our proposal is based on our estimate that future increase in wind and solar PV capacities will be slower than that proposed by the NZE plan due to technology readiness and sustainability issues discussed earlier.
However, large-scale increase in gas-fired power plants will require building more LNG import terminals and acquiring additional long-term LNG contracts. It is also beneficial from an energy security viewpoint for Taiwan to diversify its LNG sources, e.g., by increasing its share of LNG import from the US.

9.3. Implementation of Clean Coal Technologies in Existing Coal-Fired Power Plants

The average age of Taiwan’s 20 coal-fired power plants is 19 years [90]. Only five of them use supercritical or ultra-supercritical technologies. The rest use subcritical technologies. Since it will take almost 30 years to totally phase out all of these coal-fired power plants, implementing CCTs such as supercritical steam, ultra-supercritical steam, IGCC, and pressurized fluidized bed combustion can reduce CO2 emission significantly. The Taichung and Mailiao coal-fired power plants are the biggest CO2 emitters using subcritical technologies. They are prime targets for CCTs.

9.4. Funding R&D in CCS

The decarbonization roadmap proposed by this report and the NZE plan both rely on CCS to mitigate CO2 emitted from fossil power and industry plants. However, in the roadmap proposed by this study, CCS will be implemented as soon as possible, whereas the NZE roadmap calls for CCS to be installed beginning in 2040. Since CCS is the key enabling technology for the power and industry sectors, public funding of CCS R&D is important. Much of the needed research will include detailed characterization of offshore saline aquifers on the West Taiwan Basin and identification of the candidate aquifers for CO2 storage. Geophysical, petrophysical, and reservoir data collection will be needed. In addition, creation of static and dynamic reservoir models will be needed to determine the storage capacity, well injectivity, and number of wells needed.

9.5. Installing CCS in Fossil Fuel Power Plants and Industrial Plants as Soon as Possible

Beyond CCTs, CCS will also be needed to achieve near-zero emissions. In fact, CCS is the only mature technology that can mitigate CO2 at the scale of millions of tons per year [65]. Our plan calls for implementing CCS as soon as possible, whereas the NZE plan stipulates CCS beginning in 2040. CCS implementation can be facilitated through use of CCS hubs, passing of CO2 injection regulations, raising acceptance of CCS by public engagement, funding CCS R&D, and using private–public partnership for financing and project management [67]. Public sector leadership in all these areas will be important.

9.6. Funding R&D in Offshore Wind

Among various forms of renewable energies, offshore wind has the highest potential to be applied on a large scale in the future. However, technology breakthroughs are needed in a number of areas, including typhoon-resilient wind turbines, high-voltage subsea cable design, floating structures beyond 120 m water depth, and smart grid integration [71,91]. Furthermore, sustainability issues related to offshore wind such as impact on marine life and coastal communities need to be resolved.

9.7. Delaying Phaseout of Nuclear Power

If all nuclear power plants are to be phased out by 2025 according to the NZE plan, Taiwan will probably face a shortage of electricity supply, as there will be inadequate addition of solar PV and wind capacity to replace nuclear capacity [55]. Consequently, gradually phasing out nuclear power plants by 2050 is recommended by this study.

9.8. Formulating a Hydrogen Strategy

Taiwan needs a hydrogen strategy as part of its decarbonization roadmap. To guide future public and private investment in hydrogen, this strategy should stipulate the form of hydrogen, its use in various sectors, need for hydrogen infrastructure, and routes for either domestic manufacturing or importing of hydrogen. As of 2020, ten countries have announced their hydrogen strategy [86]. It is expected that global production of hydrogen will increase from 88 Mt in 2020 to 212 Mt in 2030 [92].

10. Discussion

Based on a detailed analysis of the status of fossil and non-fossil energies in Taiwan and technology screening considering sustainability, security, affordability, technology readiness, and technology impact, this study proposes a decarbonizing roadmap for Taiwan different from the NZE plan. It calls for (1) a delayed phaseout of nuclear power until 2050, (2) implementing CCT in existing coal-fired power plants, (3) accelerating CCS implementation in the power and industry sectors, (4) more reliance on gas than wind and solar PV to replace coal and nuclear in electricity generation, and (5) use of blue instead of green hydrogen for decarbonizing the transport and industry sectors. In addition, implications of this roadmap for future R&D and energy policies are discussed.
Our work differs from previous studies in several aspects. First, we screen applicable decarbonization technologies on not one but six categories: sustainability, security, affordability, reliability, technology readiness, and technology impact. This approach is more comprehensive than that found in previous studies. Second, we estimate the likelihood of large-scale application of each technology based on issues identified from this screening. As a result, we find out that further implementation of onshore wind is limited by available land. Implementation of offshore wind awaits development of typhoon-resistant designs and availability of local expertise. Solar PV suffers from availability of suitable land and a low capacity factor. Further application of bioenergy suffers from competition for arable land and a lack of biocrop industry. Green hydrogen is, in the near to medium future, too expensive to be widely used, thus making blue hydrogen a good candidate for decarbonizing hard-to-decarbonize industries. Third, we analyze the published NZE plan and find that it requires an AAGR of 10.1% for renewable power generation. We estimate this is unlikely to be happen, given the issues identified for wind and solar PV. We therefore propose an alternative roadmap based on a more achievable 7% AAGR in renewable electricity generation. We then draw policy implications from the proposed roadmap. It is hoped that this proposed roadmap will contribute to the ongoing debate on choosing the energy transition roadmap to enable Taiwan to achieve net-zero by 2050.

11. Conclusions

The following conclusions can be made from this study.
  • Twenty decarbonization technologies have been screened for sustainability, security, affordability, reliability, technology readiness, and technology impact. Results show that for the power sector, the technology with the highest potential is GP-CCS. This is followed by coal→gas, CP-CCS, clean coal, and nuclear. For the transport sector, EV has the highest potential, followed by HFCV. For the industry sector, the technology with the highest potential is Ind-CCS. This is followed by gas→H2-CCS.
  • Based on these findings, a decarbonization roadmap for the power sector is proposed. This roadmap requires a 7% AAGR in renewable electricity generation, which is more achievable than the 10.1% required by the NZE plan.
  • In the power sector, the proposed roadmap improves on the NZE plan in the following aspects: (1) using clean coal technologies in existing coal-fired power plants, (2) relying more on gas than solar PV and wind in replacing coal and nuclear, (3) bringing forward CCS, and (4) delaying phaseout of nuclear until 2050.
  • For the transport sector, the major difference between the two roadmaps is the use of HFCV, H2-marine, and bio-aviation in the medium future in the roadmap proposed by this study. Both roadmaps advocate EVs as the major decarbonization method.
  • For the industry sector, the major differences between the roadmaps are (1) bringing forward CCS to decarbonize industrial plants and (2) using blue instead of green hydrogen for long-term decarbonization.
  • Energy policy implications from this study include (1) promulgating a credible carbon tax, (2) switching from coal to gas for power generation, (3) implementing clean coal technologies in existing coal-fired power plants, (4) funding R&D in CCS and offshore wind, (5) implementing CCS in existing fossil power and industry plants as soon as possible, and (6) delaying phaseout of nuclear energy until 2050.

Author Contributions

Conceptualization, H.C.L.; Data curation, S.C.T.; Formal analysis, H.C.L. and S.C.T.; Investigation, H.C.L. and S.C.T.; Methodology, H.C.L. All authors have read and agreed to the published version of the manuscript.

Funding

This research received no external funding.

Conflicts of Interest

The authors declare no conflict of interest.

Nomenclature

AAGRAverage annual growth rate
BioBioenergy
Bio-aviationBiofuels for aviation
Blue hydrogenHydrogen produced from fossil fuels with CCS
CCSCarbon capture and storage
CCTClean coal technology
CCUCarbon capture and utilization
Coal→gasReplacing coal by gas for power generation
Coal→H2-CCSHydrogen production by coal gasification with CCS
CO2Carbon dioxide
CO2-EGRCarbon dioxide enhanced gas recovery
CO2-EORCarbon dioxide enhanced oil recovery
CP-CCSCoal-fired power plant with carbon capture and storage
EGREnhanced gas recovery
EOREnhanced oil recovery
EVElectric vehicle
Gas→H2-CCSHydrogen production by methane steam reforming with CCS
GDPGross domestic product
GeoGeothermal energy
GP-CCSGas-fired power plant with CCS
Green H2Hydrogen produced by electrolysis with renewable electricity
Gt109 ton
GWh109 Wh
H2Hydrogen
H2-marineHydrogen as fuel for ships
HydroHydropower
ICEInternal combustion engine
IGCCIntegrated gasification combined cycle
Ind-CCSCCS in industrial plants
HFCVHydrogen fuel cell vehicle
Mtpa106 tons per year
MW106 W
NZENet-zero emissions
PECPrimary energy consumption
RERenewable energy
Solar PVSolar photovoltaic
TPESTotal primary energy supply
TWh1012 Wh
WindWind energy

Appendix A. Technology Ranking Criteria

Table A1. Description of sector-specific decarbonization technologies.
SectorTechnologyDescription
AllGreen H2Hydrogen produced from electrolysis of water by renewable electricity
CCUConverting captured CO2 to chemicals or products
PowerNuclearNuclear power plant
HydroHydroelectricity
Solar PVSolar photovoltaic for on-grid electricity generation
BioenergyBioenergy for electricity generation
Onshore windOnshore wind turbine for electricity generation
Offshore windOffshore wind turbine for electricity generation
GeothermalGeothermal power plant
Coal→gasSwitching from coal to gas for thermal power generation
CP-CCSUsing CCS to capture and store CO2 emitted from a coal-fired power plant
GP-CCSUsing CCS to capture and store CO2 emitted from a gas-fired power plant
Clean coal technologiesSupercritical or ultra-supercritical technologies to reduce CO2 emission in coal-fired power plants
TransportEVElectric vehicle
HFCVHydrogen fuel cell vehicle
H2-marineHydrogen as fuel for ships
Bio-aviationBiofuels as fuel for planes
IndustryInd-CCSUsing CCS to capture and store CO2 emitted from an industrial plant
Coal→H2-CCSBlue hydrogen generated from coal gasification (with CCS) for use in heating and/or feedstock in an industry plant
Gas→H2-CCSBlue hydrogen generated from steam methane reforming (with CCS) for use in heating and/or feedstock in an industry plant
Table A2. Ranking criteria for CO2 emission and material footprint.
CategoryLowMediumHigh
CO2 emission (kg/kWh)<0.370.37 to 0.45>0.45
Material footprint (t/TWh)<10001000 to 2000>2000
Notes: For benchmarking, CO2 emissions from US coal-, gas-, and oil-fired power plants are 1.011, 0.413, and 0.966 kg/kWh, respectively [93]. Material footprints for gas- and coal-fired power plants are 572 and 1185 t/TWh, respectively [94].
Table A3. Ranking criteria for impact on people and environment. Green, yellow and red colors signify low, medium, and high impact, respectively.
ConsequenceIncreasing Probability
SeverityImpact on PeopleImpact on
Environment
Has Occurred in IndustryHas Occurred in TaiwanOccurred Several Times a Year in Taiwan
0Zero injury or impactZero impactLowLowLow
1Slight injury or impactSlight impactLowLowMedium
2Minor injury or impactMinor effectLowMediumMedium
3Major injury or major impactLocal effectMediumMediumHigh
4Single fatality or single major impactMajor effectMediumHighHigh
5Multiple fatalities or massive impactMassive effectMediumHighHigh
Table A4. Ranking criteria for impact on animals. Green, yellow and red colors signify low, medium, and high impact, respectively.
ConsequenceIncreasing Probability
SeverityImpact on AnimalsHas Occurred in
Industry
Has Happened in
Taiwan
Has Happened
Multiple Times in
Taiwan
0Zero
injury
LowLowLow
1Slight
injury
LowLowMedium
2Single
fatality
LowMediumMedium
3Multiple
fatalities
MediumMediumHigh
4Single fatality to endangered speciesMediumHighHigh
5Multiple fatalities to endangered speciesMediumHighHigh
Table A3 and Table A4 are similar to risk assessment matrix for evaluating health, safety, and environmental risks commonly used in the oil and gas industry [95].
Table A5. Criteria for energy quadrilemma ranking.
Category\RankingLowMediumHigh
SecurityLacking in domestic energy resourcesSome domestic resources but import neededSufficient domestic resources to be import independent
AffordabilityToo expensive to be applied on a large scaleDue to high cost, application is limited in scopeReadily affordable for application on a large scale
SustainabilityRanked high in any category in Table A2, Table A3 and Table A4Ranked medium in any category in Table A2, Table A3 and Table A4. No category ranked low in Table A2, Table A3 and Table A4Ranked low in all categories in Table A2, Table A3 and Table A4
Reliability<20% capacity factor20–40% in capacity factor>40% capacity factor
Table A6. Criterion for ranking in technology readiness and impact.
CategorySector\RankingLowHigh
Technology readinessAllNever or unlikely to be usedUsed or readily used based on results from other countries
Technology impactPowerLow degree of power generationHigh degree of power generation
TransportUsable in some vehicles, ships, or planesUsable in most vehicles, ships, or planes
IndustryUsable in some industrial plantsUsable in most industrial plants
Table A7. Capacity factor for Taiwan’s power plants according to authors’ estimates using data from Reference [24].
CoalGasOilWindSolar PVHydroBioNuclear
78%55%30%28%11%20%57%83%

Appendix B. Technology Ranking Results

Table A8. Material footprint for various electricity generation technologies [94].
Materials (ton/TWh)GasNuclearBiomassCoalGeo-ThermalWindHydroSolar PV
Aluminum1063100350680
Cement0000750003700
Concrete4007607608701100800014,000350
Copper03012231850
Glass000009202700
Iron1541912000
Lead02000000
Plastic000001900210
Silicon000000057
Steel170100310330033001800677900
Total57287010805261526010,26014,06816,447
Table A9. Results of sustainability screening for Taiwan. Green, yellow and red colors signify low, medium and high impact, respectively.
SectorTechnologyCO2 EmissionMaterial
Footprint
Impact on
People
Impact on
Animals
Impact on
Environ.
PowerGreen H2NoneHigh due to power from wind or solarLowLow for solar power; Medium for wind powerLow for solar power; Medium for wind power;
CCUMinimumDepends on technologyLowLowLow
NuclearNoneLow(Table A8)Medium (Chernobyl, 1986; Fukushima, 2011 [96,97])Medium (Chernobyl, 1986; Fukushima, 2011 [96,97])Medium (Chernobyl, 1986; Fukushima, 2011 [96,97])
HydroNoneHigh
(Table A8)
Medium (Teton Dam, USA, 1976 [98])Medium (Teton Dam, USA, 1976 [98])Medium (Lawn Lake Dam, USA, 1982 [99])
Solar PVNoneHigh
(Table A8)
LowLowMedium (Used panels are solid waste per US EPA [100])
Onshore windNoneHigh
(Table A8)
LowMedium (Avian death [45])Medium (Turbine blades cannot be recycled [101])
Offshore windNoneHigh
(Table A8)
LowMedium (Avian death; endangered Indo-Pacific humpback dolphin [34])Medium (Turbine blades cannot be recycled [101])
BioMinimumMedium
(Table A8)
Medium (1st generation
biocrop affects food security)
Medium (affects biodiversity due to changed land usage)Medium (Clearing of forest for biocrop will have major impact)
GeothermalMinimumHigh
(Table A8)
LowLowLow
Coal→gasMedium (0.41 kg/kWh)Low
(Table A8)
LowLowLow
CP-CCSMinimumMedium
(Table A8)
LowLowLow
GP-CCSMinimumLow
(Table A8)
LowLowLow
Clean coalMedium (0.37–0.45 kg/kWh)Medium
(Table A8)
LowLowLow
TransportEVNoneHigh (226t of material extracted per EV battery [102])LowLowLow
HFCVMinimum (assuming blue or green H2)Low (assuming blue H2)Low (assuming blue H2 or green H2 from solar or wind electricity)Low (assuming blue H2 or green H2 from solar PV)Low (assuming blue H2)
H2-marineMinimum (assuming blue or green H2)Low (assuming blue H2)Low (assuming blue H2 or green H2 from solar or wind electricity)Low (assuming blue H2 or green H2 from solar PV)Low (assuming blue H2)
Bio-aviationMinimumMedium
(Table A8)
Medium (1st-generation biocrop affects food security)Medium (Changed land usage affects biodiversity)Medium (Clearing of forest for biocrop may have major impact)
IndustryCoal→H2-CCSMinimumMedium
(Table A8)
LowLowLow
Gas→H2-CCSMinimumLow
(Table A8)
LowLowLow
Ind-CCSMinimumLowLowLowLow
Notes: For CO2 emission column, “none” means no CO2 emission, “minimum” means a small amount of emission. For material footprint column, Table A8 is used for various type of electricity generation technologies [93]. For impact on people and environment columns, screening criteria in Table A3 are used. For impact on animals column, screening criteria in Table A4 are used.

References

  1. Portal of Taiwan. Economy. 2022. Available online: https://www.taiwan.gov.tw/content_7.php (accessed on 26 May 2022).
  2. Our World in Data. Taiwan: Energy Country Profile. 2022. Available online: https://ourworldindata.org/energy/country/taiwan (accessed on 26 May 2022).
  3. Our World in Data. Taiwan: CO2 Country Profile. 2022. Available online: https://ourworldindata.org/co2/country/taiwan (accessed on 26 May 2022).
  4. Feigenbaum, E.A.; Hou, J. Future of Taiwan’s Economic Competitiveness: Overcoming Taiwan’s Energy Trilemma; Carnegie Endowment for International Peace: Washington, DC, USA, 2020. [Google Scholar]
  5. Bureau of Energy (MOEA). Energy Statistics Handbook 2020. 2022. Available online: https://www.moeaboe.gov.tw/ECW_WEBPAGE/FlipBook/2020EnergyStaHandBook/index.html#p= (accessed on 26 May 2022).
  6. Country Economy. CO2 Emission. 2022. Available online: https://countryeconomy.com/energy-and-environment/co2-emissions (accessed on 26 May 2022).
  7. Wikipedia. Renewable Energy in Taiwan. 2022. Available online: https://en.wikipedia.org/wiki/Renewable_energy_in_Taiwan (accessed on 26 May 2022).
  8. National Development Council. Taiwan’s Roadmap to Net-Zero Emissions in 2050. 2022. Available online: https://www.NDC.gov.tw/en/Content_List.aspx?n=B927D0EDB57A7A3A (accessed on 25 May 2022).
  9. Bloomberg. Taiwan Vows $32 Billion Clean Energy Spree as It Lags on Targets. 2022. Available online: https://www.bloomberg.com/news/articles/2022-03-30/taiwan-vows-32-billion-clean-energy-spree-as-it-lags-on-targets#xj4y7vzkg (accessed on 26 June 2022).
  10. International Trade Administration. Taiwan Renewable Energy Market. United States Department of Commerce. 2021. Available online: https://www.trade.gov/market-intelligence/taiwan-renewable-energy-market (accessed on 26 June 2022).
  11. Chou, K.; Walther, D.; Liou, H. The Conundrums of Sustainability: Carbon Emissions and Electricity Consumption in the Electronics and Petrochemical Industries in Taiwan. Sustainability 2019, 11, 5664. [Google Scholar] [CrossRef] [Green Version]
  12. Yang, C.; Wang, C. The Energy Regulation and Markets Review: Taiwan. The Law Reviews 2021, Dentons. Available online: https://thelawreviews.co.uk/title/the-energy-regulation-and-markets-review/taiwan#:~:text=Taiwan’s%20electricity%20market%20has%20not,the%20future%20direction%20of%20reform (accessed on 27 May 2022).
  13. Taiwan Website Open Information Announcement. Promote Offshore Wind Actively. 2022. Available online: https://www.twtpo.org.tw/eng/Home/ (accessed on 27 May 2022).
  14. Tsay, I.; Chen, P. A Dual Market Structure Design for the Reform of An Independent Power Grid System-the Case of Taiwan. Energy Rep. 2019, 5, 1603–1615. [Google Scholar] [CrossRef]
  15. Huang, G.C.; Chen, R. Uncovering Regime Resistance in Energy Transition: Role of Electricity Iron Triangle in Taiwan. Environ. Pol. Gov. 2021, 31, 104–115. [Google Scholar] [CrossRef]
  16. Wakefield, B. (Ed.) Taiwan’s Energy Conundrum; Asia Program Special Report No.146; Woodrow Wilson International Center for Scholars: Washington, DC, USA, 2012; Available online: https://www.wilsoncenter.org/sites/default/files/media/documents/publication/SP%20Report%20146%20working%201-20-small.pdf (accessed on 6 July 2022).
  17. Tan, W. Overview of Wind Power Development Over the Two Past Decades (2000–2019) and Its Role in the Taiwan’s Energy Transition and Sustainable Development Goal. AIMS Energy 2021, 9, 342–354. [Google Scholar]
  18. Wang, C.; Lee, C.; Hong, Y.; Cheng, K. Assessment of Energy Transition Policy in Taiwan—A View of Sustainable Development Perspectives. Energies 2021, 14, 4402. [Google Scholar] [CrossRef]
  19. Feng, C.; Chang, K.; Lin, J.; Lee, R.T.; Lin, S. Toward Green Transition in the Post Paris Agreement Era: The Case of Taiwan. Energy Policy 2022, 165, 112996. [Google Scholar] [CrossRef]
  20. Chen, C.C. The Path to a 2025 Nuclear-free Taiwan: An Analysis of Dynamic Competition Among Emissions, Energy, and Economy. Energy Environ. 2021, 32, 668–689. [Google Scholar] [CrossRef]
  21. Kung, C.; McCarl, B.A. The Potential Role of Renewable Electricity Generation in Taiwan. Energy Policy 2020, 138, 111227. [Google Scholar] [CrossRef]
  22. Gao, A.M.; Huang, C.; Lin, J.; Su, W. Review of Recent Offshore Wind Power Strategy in Taiwan: Onshore Wind Power Comparison. Energy Strategy Rev. 2021, 38, 100747. [Google Scholar] [CrossRef]
  23. Gao, A.M.; Fan, C.; Liao, C. Application of German Energy Transition in Taiwan: A Critical Review of Unique Electricity Liberalization as a Core Strategy to Achieve Renewable Energy Growth. Energy Policy 2018, 120, 644–654. [Google Scholar] [CrossRef]
  24. International Renewable Energy Agency (IRENA). Data & Statistics. 2022. Available online: https://www.irena.org/en/Statistics (accessed on 27 May 2022).
  25. Power Technology. Yunlin Offshore Wind Farm, Taiwan Strait, Taiwan. 2022. Available online: https://www.power-technology.com/projects/yunlin-offshore-wind-farm-taiwan-strait-taiwan/ (accessed on 6 July 2022).
  26. Chong, A. Taiwan’s Biggest Offshore Wind Farm Generates First Power. Digitimes, Taipei. 2022. Available online: https://www.digitimes.com/news/a20220429VL201/offshore-wind-farm-orsted.html (accessed on 28 May 2022).
  27. United States Department of Energy (DOE). Offshore Wind Market Report: 2021 Edition. Office of Energy & Renewable Energy. 2021. Available online: https://www.energy.gov/sites/default/files/2021-08/Offshore%20Wind%20Market%20Report%202021%20Edition_Final.pdf (accessed on 6 July 2022).
  28. Harris, J. Taiwanese Offshore Wind Development Round 2021 Underway. Out-Law Analysis. Pinsent Masons. 2021. Available online: https://www.pinsentmasons.com/out-law/analysis/taiwanese-offshore-wind-development-round-2021 (accessed on 28 May 2022).
  29. United States Department of Energy (DOE). Wind Turbines in Extreme Weather: Solutions for Hurricane Resiliency. Office of Energy Efficiency & Renewable Energy. 2018. Available online: https://www.energy.gov/eere/articles/wind-turbines-extreme-weather-solutions-hurricane-resiliency#:~:text=Basically%2C%20the%20wind%20turbine%20is,contend%20with%20large%2C%20powerful%20waves (accessed on 28 May 2022).
  30. Rose, S.; Jaramillo, P.; Small, M.J.; Grossmann, I.; Apt, J. Quantifying the Hurricane Risk to Offshore Wind Turbines. PNAS 2012, 109, 3247–3252. [Google Scholar] [CrossRef] [PubMed] [Green Version]
  31. Matsunaka, Y. A Typhoon-Proof Wind Turbine is Generating an Energy Shift for Remote Islands. Autodesk. 2021. Available online: https://redshift.autodesk.com/typhoon-proof-wind-turbine/ (accessed on 28 May 2022).
  32. GE Renewable Energy. Riders On the Storm: GE is Building a Wind Turbine that Can Weather Violent Typhoons, Hurricanes. 2018. Available online: https://www.ge.com/news/reports/riders-storm-ge-building-wind-turbine-can-weather-violent-typhoons-hurricanes (accessed on 28 May 2022).
  33. Li, J.; Li, Z.; Jiang, Y.; Tang, Y. Typhoon Resistance Analysis of Offshore Wind Turbines: A Review. Atmosphere 2022, 13, 451. [Google Scholar] [CrossRef]
  34. Chung, H. Taiwan’s Offshore Wind Energy Policy: From Policy Dilemma to Sustainable Development. Sustainability 2021, 13, 10465. [Google Scholar] [CrossRef]
  35. Lin, S. Understanding Barriers to Solar Energy Use in Taiwan Using the Decision Making Trial and Evaluation Laboratory Integrated with the Technique of Order Preference by Similarity to an Ideal Solution. Smart Grid Renew. Energy 2021, 12, 137–162. [Google Scholar] [CrossRef]
  36. Asia Today. Taiwan’s Solar Power Dream Collides with Reality. 2020. Available online: http://asiatoday.com/pressrelease/taiwan%E2%80%99s-solar-power-dream-collides-reality (accessed on 28 May 2022).
  37. Lin, M.T. Taiwan’s Net-Zero Roadmap Promises $170 Billion in Spending, Renewable Expansion; More Could be Required. S&P Global. 2022. Available online: https://cleanenergynews.ihsmarkit.com/research-analysis/taiwans-netzero-roadmap-promises-170-billion-in-spending-renew.html (accessed on 18 May 2022).
  38. Jia, F.; Sun, H.; Koh, L. Global Solar Photovoltaic Industry: An Overview and National Competitiveness of Taiwan. J. Cleaner Production 2016, 126, 550–562. [Google Scholar] [CrossRef]
  39. Chen, C.; Yang, C. The Investability of PV Systems Under Descending Feed-In-Tariffs: Taiwan Case. Energies 2021, 14, 2728. [Google Scholar] [CrossRef]
  40. Liao, S.; Chang, S.; Cheng, T. Index-Based Renewable Energy Insurance for Taiwan Solar Photovoltaic Power Plants. Risk Manag. Insur. Rev. 2022, 25, 145–172. [Google Scholar] [CrossRef]
  41. Taipower. Overview of the Development of Renewable Energy. 2022. Available online: https://www.taipower.com.tw/en/page.aspx?mid=4495&cid=2827&cchk=ee217b56-d61e-430a-8a02-62862029bfab (accessed on 28 May 2022).
  42. American Institute in Taiwan (AIT). Renewable Energy Industry in Southern Taiwan 2018. United States Department of Commerce, US Commercial Service. 2018. Available online: https://2016.export.gov/taiwan/build/groups/public/@eg_tw/documents/webcontent/bg_tw_120850.pdf (accessed on 6 July 2022).
  43. Focus Taiwan. Taiwan’s Hydropower Plants Hard-Hit by Drought This Year. CNA English News. 2021. Available online: https://focustaiwan.tw/society/202105180028 (accessed on 28 May 2022).
  44. Chen, H.H.; Lee, A.H.I. Comprehensive Overview of Renewable Energy Development in Taiwan. Ren. Sustain. Energy Rev. 2014, 37, 215–228. [Google Scholar] [CrossRef]
  45. Boyle, G. Renewable Energy: Power for a Sustainable Future, 3rd ed.; Oxford University Press: Oxford, UK, 2012. [Google Scholar]
  46. Chang, K.; Lou, K.; Ko, C. Potential of Bioenergy Production from Biomass Wastes of Rice Paddles and Forest Sectors in Taiwan. J. Clean. Prod. 2019, 206, 460–476. [Google Scholar] [CrossRef]
  47. Focus Taiwan. Geothermal Power Set for New Commercial Beginning in Taiwan. CAN English News. 2021. Available online: https://focustaiwan.tw/business/202111160015 (accessed on 21 May 2022).
  48. Huang, T. Taiwan to See its First Geothermal Power Plant in 3 Decades. Taiwan News. 2021. Available online: https://www.taiwannews.com.tw/en/news/4346869 (accessed on 21 May 2022).
  49. Hanson, P. Geothermal Country Overview: Taiwan. GeoEnergy Marketing Services. 2019. Available online: https://www.geoenergymarketing.com/energy-blog/geothermal-country-overview-taiwan/ (accessed on 21 May 2022).
  50. Richter, A. Taiwan Geothermal Association on the Geothermal Potential of Taiwan. ThinkGeoEnergy. 2019. Available online: https://www.thinkgeoenergy.com/taiwan-geothermal-association-on-the-geothermal-potential-of-taiwan/#:~:text=The%20Geothermal%20Association%20of%20Taiwan,geothermal%20energy%20resources%20in%20Taiwan.&text=Taiwan%20is%20located%20in%20the%20middle%20of%20%E2%80%9CPacific%20Fire%20Ring%E2%80%9D (accessed on 21 May 2022).
  51. Song, S. The Geothermal Potential, Current and Opportunity in Taiwan. ADS. 2016. Available online: https://ui.adsabs.harvard.edu/abs/2016EGUGA..18.3376S/abstract (accessed on 21 May 2022).
  52. World Nuclear Association. Nuclear Power in Taiwan. 2021. Available online: https://world-nuclear.org/information-library/country-profiles/others/nuclear-power-in-taiwan.aspx (accessed on 21 May 2022).
  53. Nuclear Engineering International. Phasing Out Nuclear Power in Taiwan. 2021. Available online: https://www.neimagazine.com/features/featurephasing-out-nuclear-power-in-taiwan-9010839/ (accessed on 21 May 2022).
  54. GlobalData Energy. Power Generation in Taiwan in 2025 is Estimated to be Free from Nuclear Power. 2021. Available online: https://www.power-technology.com/comment/power-taiwan-2025-free-from-nuclear/ (accessed on 21 May 2022).
  55. Huang, G.C.; Chen, R. Injustices in Phasing Out Nuclear Power?: Exploring Limited Public Participation and Transparency in Taiwan’s Transition Away from Nuclear Energy. Energy Res. Soc. Sci. 2021, 71, 101808. [Google Scholar] [CrossRef]
  56. Shih, Y.; Shi, N.; Tseng, C.; Pan, S.; Chiang, P. Socioeconomic Costs of Replacing Nuclear Power with Fossil and Renewable Energy in Taiwan. Energy 2016, 114, 369–381. [Google Scholar] [CrossRef]
  57. Wu, K.; Huang, Y.; Wu, J. Impact of Electricity Shortages During Energy Transitions in Taiwan. Energy 2018, 151, 622–632. [Google Scholar] [CrossRef]
  58. Global Energy Monitor. Summary Tables. 2022. Available online: https://globalenergymonitor.org/projects/global-coal-plant-tracker/summary-tables/ (accessed on 21 May 2022).
  59. Zhang, K.; Lau, H.C.; Liu, S. Carbon Capture and Storage in the Coast Region of China between Shanghai and Hainan. Energy 2022, 247, 123470. [Google Scholar] [CrossRef]
  60. Worldometer. Taiwan CO2 Emissions. Available online: https://www.worldometers.info/co2-emissions/taiwan-co2-emissions/ (accessed on 21 May 2022).
  61. Taiwan News. World’s Worst Emissions Come from Taiwan. 2008. Available online: https://www.taiwannews.com.tw/en/news/730934 (accessed on 21 May 2022).
  62. Lau, H.C.; Zhang, K.; Bokka, H.K.; Ramakrishna, S. A Review of the Status of Fossil and Renewable Energies in Southeast Asia and Its Implications on the Decarbonization of Asia. Energies 2022, 15, 2152. [Google Scholar] [CrossRef]
  63. Lau, H.C. Decarbonization Roadmaps for ASEAN and Their Implications. Energy Rep. 2022, 8, 6000–6022. [Google Scholar] [CrossRef]
  64. Lau, H.C. Evaluation of Decarbonization Technologies for ASEAN Countries Via an Integrated Assessment Tool. Sustainability 2022, 14, 5827. [Google Scholar] [CrossRef]
  65. Lau, H.C. The Role of Fossil Fuels in a Hydrogen Economy. In Proceedings of the International Petroleum Technology Conference (IPTC-21162-MS), Virtual Event, 23 March–1 April 2021. [Google Scholar]
  66. International Energy Agency (IEA). Clean Coal Technologies: Accelerating Commercial and Policy Drivers for Deployment; International Energy Agency (IEA): Paris, France, 2008. [Google Scholar]
  67. Lau, H.C.; Ramakrishna, S.; Zhang, K.; Radhamani, A.V. The Role of Carbon Capture and Storage in the Energy Transition. Energy Fuels 2021, 35, 7364–7386. [Google Scholar] [CrossRef]
  68. Gas Processing News. Taiwan’s State Energy Firm to Start Building Third LNG Terminal. 2021. Available online: http://gasprocessingnews.com/news/taiwan%E2%80%99s-state-energy-firm-to-start-building-third-lng-terminal.aspx#:~:text=Taiwan’s%20state%20energy%20firm%20CPC,to%20a%20senior%20company%20official (accessed on 28 May 2022).
  69. Equinor. Northern Lights Project Concept Report RE-PM673-00001; Equinor: Stavanger, Norway, 2019. [Google Scholar]
  70. Equinor. North Lights CCS. 2022. Available online: https://www.equinor.com/energy/northern-lights (accessed on 23 May 2022).
  71. Lau, H.C. Offshore Wind Energy in Asia: Technical Challenges and Opportunities. In Proceedings of the Offshore Technology Conference (OTC-30244-MS), Virtual Event, 17–19 August 2020. [Google Scholar]
  72. Chen, F.; Lu, S.; Tseng, K.; Lee, S.; Wang, E. Assessment of Renewable Energy Reserves in Taiwan. Renew. Sustain. Energy Rev. 2010, 14, 2511–2528. [Google Scholar] [CrossRef]
  73. Yue, C.; Huang, G. An Evaluation of Domestic Solar Energy Potential in Taiwan Incorporating Land Use Analysis. Energy Policy 2011, 39, 7988–8002. [Google Scholar] [CrossRef]
  74. Ko, L.; Wang, J.; Chen, C.; Tsai, H. Evaluation of the Development Potential of Rooftop Solar Photovoltaic in Taiwan. Renew. Energy 2015, 76, 582–595. [Google Scholar] [CrossRef]
  75. International Energy Agency (IEA). Special Report on Carbon Capture Utilization and Storage—CCUS in Clean Energy Transitions. Energy Technology Perspectives. 2020. Available online: https://www.iea.org/reports/ccus-in-clean-energy-transitions (accessed on 6 July 2022).
  76. Intergovernmental Panel on Climate Change (IPCC). IPCC Special Report on Carbon Dioxide Capture and Storage; Cambridge University Press: Cambridge, UK, 2005; Available online: https://archive.ipcc.ch/pdf/special-reports/srccs/srccs_wholereport.pdf (accessed on 6 July 2022).
  77. International Renewable Energy Agency (IRENA). Reaching Zero with Renewables: Eliminating CO2 Emissions from Industry and Transport in Line with the 1.5 °C Climate Goal. 2020, Abu Dhabi, United Emirates. Available online: https://www.irena.org/-/media/Files/IRENA/Agency/Publication/2020/Sep/IRENA_Reaching_zero_2020.pdf (accessed on 6 July 2022).
  78. Global CCS Institute. Global Status of CCS 2020; Global CCS Institute: Melbourne, Australia, 2020. [Google Scholar]
  79. S&P Global. UK Government Approves BP-Led East Coast CCS Cluster. 2021. Available online: https://www.spglobal.com/commodityinsights/en/market-insights/latest-news/energy-transition/101921-uk-government-approves-bp-led-east-coast-ccs-cluster (accessed on 25 May 2022).
  80. The Acorn Project. Acorn Unlocks the Carbon Capture and Storage and Hydrogen Infrastructure Essential for Meeting Our Net Zero Targets. 2022. Available online: https://theacornproject.uk/about/ (accessed on 25 May 2022).
  81. NS Energy. Porthos Carbon Capture and Storage (CCS) Project. 2022. Available online: https://www.nsenergybusiness.com/projects/porthos-carbon-capture-and-storage-ccs-project/ (accessed on 25 May 2022).
  82. Zhang, K.; Lau, H.C.; Bokka, H.K.; Hadia, N.J. Decarbonizing the Power and Industry Sectors in India by Carbon Capture and Storage. Energy 2022, 245, 123751. [Google Scholar] [CrossRef]
  83. Bokka, H.K.; Zhang, K.; Lau, H.C. Carbon Capture and Storage Opportunities in the West Coast of India. Energy Rep. 2022, 8, 3930–3947. [Google Scholar] [CrossRef]
  84. Zhang, K.; Lau, H.C. Regional Opportunities for CO2 Capture and Storage in Southeast Asia. Int. J. Greenh. Gas Control. 2022, 116, 103628. [Google Scholar] [CrossRef]
  85. Zhang, K.; Bokka, H.K.; Lau, H.C. Decarbonizing the Energy and Industry Sectors in Thailand by Carbon Capture and Storage. J. Pet. Sci. Eng. 2022, 209, 109979. [Google Scholar] [CrossRef]
  86. Lau, H.C.; Ramakrishna, S.; Zhang, K.; Hameed, M.Z.S. A Decarbonization Roadmap for Singapore and Its Energy Policy Implications. Energies 2021, 14, 6455. [Google Scholar] [CrossRef]
  87. Upstream Energy Explored. Reinvigorating Indonesian Giant as CCS Project: New Lease of Life under Evaluation for Arun Field. 2022. Available online: https://www.upstreamonline.com/energy-transition/reinvigorating-indonesian-giant-as-ccs-project/2-1-1190849 (accessed on 25 May 2022).
  88. Zhang, K.; Lau, H.C. Utilization of a High-Temperature Depleted Gas Condensate Reservoir for CO2 Storage and Geothermal Heat Mining: A Case Study of the Arun Gas Reservoir in Indonesia. J. Clean. Prod. 2022, 343, 131006. [Google Scholar] [CrossRef]
  89. S&P Global. Singapore’s Carbon Tax Increase of Up to 16-fold Will Make Low Carbon Technologies and Power Imports Cost Competitive. 2022. Available online: https://ihsmarkit.com/research-analysis/singapores-carbon-tax-increase-of-up-to-16fold-will-make-low-c.html#:~:text=This%20aggressive%20increase%20in%20carbon,%2FMWh%20to%20%2422%2FMWh (accessed on 25 May 2022).
  90. Taipower. Brief Introduction of Thermal Power Plants. 2022. Available online: https://www.taipower.com.tw/en/page.aspx?mid=4493&cid=2889&cchk=8204f7cc-51d1-41a1-bc50-fb7472d64385#b03 (accessed on 28 May 2022).
  91. Lau, H.C.; Piriyev, S. Decarbonizing FPSO Operations in West Africa by Offshore Wind Energy. In Proceedings of the Offshore Technology Conference (OTC-31953-MS), Houston, TX, USA, 2–5 May 2022. [Google Scholar]
  92. International Energy Agency (IEA). Hydrogen Report. 2021. Available online: https://www.iea.org/reports/hydrogen (accessed on 2 June 2022).
  93. United States Energy Information Administration (EIA). How Much Carbon Dioxide is Produced per Kilowatt Hour of U.S. Electricity Generation? 2022. Available online: https://www.eia.gov/tools/faqs/faq.php?id=74&t=11#:~:text=In%202020%2C%20total%20U.S.%20electricity,CO2%20emissions%20per%20kWh (accessed on 2 July 2022).
  94. United States Department of Energy (DOE). Quadrennial Technology Review: An Assessment of Energy Technologies and Research Opportunities; United States Department of Energy (DOE): Washington, DC, USA, 2015; 390p.
  95. Tian, D.; Yang, B.; Chen, J.; Zhao, Y. A Multi-Experts and Multi-Criteria Risk Assessment Model for Safety Risks in Oil and Gas Industry Integrating Risk Attitudes. Knowl. Based Syst. 2018, 156, 62–73. [Google Scholar] [CrossRef]
  96. World Nuclear Association. Chernobyl Accident 1986. 2022. Available online: https://world-nuclear.org/information-library/safety-and-security/safety-of-plants/chernobyl-accident.aspx (accessed on 2 July 2022).
  97. World Nuclear Association. Fukushima Daiichi Accident. 2022. Available online: https://world-nuclear.org/information-library/safety-and-security/safety-of-plants/fukushima-daiichi-accident.aspx (accessed on 2 July 2022).
  98. United States Department of Interior Bureau of Reclamation. Teton Dam History & Facts. 2022. Available online: https://www.usbr.gov/pn/snakeriver/dams/uppersnake/teton/factsheet.pdf (accessed on 2 July 2022).
  99. Baker, M.E. Case Study: Lawn Lake Dam (Colorado, 1982). Association of State Dam Safety Officials. 2022. Available online: https://damfailures.org/case-study/lawn-lake-dam-colorado-1982/ (accessed on 2 July 2022).
  100. United States Environmental Protection Agency (EPA). Solar Panel Frequent Questions. 2022. Available online: https://www.epa.gov/hw/solar-panel-frequent-questions#Are%20solar%20panels%20hazardous%20waste? (accessed on 2 July 2022).
  101. Paulsen, E.B.; Enevoldsen, P. A Multidisciplinary Review of Recycling Methods for End-of-Life Wind Turbine Blades. Energies 2021, 14, 4247. [Google Scholar] [CrossRef]
  102. Mills, M. Mines, Minerals, and “Green” Energy: A Reality Check. Manhattan Institute. 2020. Available online: https://www.manhattan-institute.org/mines-minerals-and-green-energy-reality-check (accessed on 2 July 2022).
Figure 1. Taiwan’s 2050 net-zero emissions plan [8].
Sustainability 14 08425 g001
Figure 2. History of (a) electricity consumption and (b) share of GDP by industry in Taiwan [5,11].
Sustainability 14 08425 g002
Figure 3. Methodology of study.
Sustainability 14 08425 g003
Figure 4. History of Taiwan’s primary energy consumption (a) cumulatively and (b) by fuel type [2].
Sustainability 14 08425 g004
Figure 5. Taiwan’s (a) PEC by fuel type in 2020, and (b) history of renewable energies’ share of PEC [2].
Sustainability 14 08425 g005
Figure 6. History of Taiwan’s electricity generation (a) cumulatively and (b) by fuel type [24].
Sustainability 14 08425 g006
Figure 7. (a) Electricity generation by fuel type in 2020, and (b) history of renewables’ share of electricity generation [24].
Sustainability 14 08425 g007
Figure 8. History of Taiwan’s installed electricity capacity (a) cumulatively and (b) by fuel type [24].
Sustainability 14 08425 g008
Figure 9. History of Taiwan’s CO2 emission (a) cumulatively and (b) by fuel type [3].
Sustainability 14 08425 g009
Figure 10. Taiwan’s CO2 emission by source in 2020 [3].
Sustainability 14 08425 g010
Figure 11. History of (a) renewable electricity generation and (b) renewable electricity capacity in Taiwan [24].
Sustainability 14 08425 g011
Figure 12. History of (a) electricity generation by and (b) installed capacity for wind in Taiwan [24].
Sustainability 14 08425 g012
Figure 13. History of (a) electricity generation by and (b) installed capacity for solar PV in Taiwan [24].
Sustainability 14 08425 g013
Figure 14. History of (a) electricity generation by and (b) installed capacity for hydropower in Taiwan [24].
Sustainability 14 08425 g014
Figure 15. History of (a) electricity generation by and (b) installed capacity for bioenergy in Taiwan [24].
Sustainability 14 08425 g015
Figure 16. History of nuclear (a) electricity generation and (b) installed capacity in Taiwan [24].
Sustainability 14 08425 g016
Figure 17. History of fossil (a) electricity generation and (b) installed capacity in Taiwan [24].
Sustainability 14 08425 g017
Figure 18. CO2 emission and capacity of coal-fired power plants in Taiwan.
Sustainability 14 08425 g018
Figure 19. CO2 emission and installed capacity of gas-fired power plants in Taiwan.
Sustainability 14 08425 g019
Figure 20. Taiwan’s (a) history of fossil-related CO2 emission by sector and (b) in year 2011 [60,61].
Sustainability 14 08425 g020
Figure 21. CO2 emission from the power and industry sectors of Taiwan in 2020 [59].
Sustainability 14 08425 g021
Figure 22. Technology mapping for decarbonizing Taiwan.
Sustainability 14 08425 g022
Figure 23. Composite ranking of decarbonization technologies for Taiwan.
Sustainability 14 08425 g023
Figure 24. Proposed decarbonization roadmap for (a) electricity generation and (b) installed capacity.
Sustainability 14 08425 g024
Figure 25. Proposed decarbonizing roadmap for the power sector in (a) 2020, (b) 2035, and (c) 2050.
Sustainability 14 08425 g025
Figure 26. Decarbonization roadmap for (a) electricity generation, and (b) installed capacity in the NZE plan.
Sustainability 14 08425 g026
Figure 27. Power sector decarbonization roadmap in the NZE plan in (a) 2020, (b) 2035, and (c) 2050.
Sustainability 14 08425 g027
Table 3. Ranking of decarbonization technologies.
Power SectorTransport SectorIndustry Sector
Tier 1 technology (highest potential)GP-CCS 2EV 1Ind-CCS
Tier 2 technology
(high potential)
Coal→gas 1,2
CP-CCS 1,2
Clean coal 1,2
Nuclear 1,2
HFCV 5Gas→H2-CCS 2,3,5
Tier 3 technology (moderate potential)Solar PV 1,4
Onshore wind 1,4,6
Offshore wind 1,4,5,6
Hydro 1,4
Bio 1,6
H2-marine 3,5
Bio-aviation 1,3,6
Coal→H2-CCS 1,2,3,5
1 sustainability, 2 security, 3 affordability, 4 reliability, 5 technology readiness, 6 technology impact issues exist.
Table 4. Comparison between decarbonization roadmaps for power sector proposed by NZE plan (peach color) and this study (blue color).
NZE PlanThis Study
Unit20202025203520502020202520352050
Non-renewable generationTWh262279299175262283326367
CoalTWh126105630126105630
GasTWh100166209121100152247367
OilTWh40004000
NuclearTWh310003126160
H2TWh0927550000
Renewable generationTWh183078332182651141
WindTWh2520161241373
Solar PVTWh614451536112450
HydroTWh6781167811
BioenergyTWh44574457
GeothermalTWh00000000
Total generationTWh280309377507280309377507
RE share%7102165781428
Non-renewable capacityGW4651553146516172
CoalGW21171002117100
GasGW1933412419304972
OilGW20002000
NuclearGW40004320
H2GW01370000
Renewable capacityGW12246926112204199
WindGW1286812631
Solar PVGW617541846132960
HydroGW54575457
BioenergyGW11111111
GeothermalGW00000000
Total capacityGW58751242915870102171
RE share in capacity%2132568921284058
CO2 to be mitigated by CCSMtpa17317515050173169166151
Publisher’s Note: MDPI stays neutral with regard to jurisdictional claims in published maps and institutional affiliations.

