Article

A Comparative Analysis of Plant-Based Milk Alternatives Part 2: Environmental Impacts

1
Division of Ecology of Livestock Production, Department of Animal Sciences, Faculty of Agriculture, University of Goettingen, 37075 Goettingen, Germany
2
Division of Quality of Plant Products, Department of Crop Sciences, Faculty of Agriculture, University of Goettingen, 37075 Goettingen, Germany
3
Division Livestock Systems, Department of Animal Sciences, Faculty of Agriculture, University of Goettingen, 37075 Goettingen, Germany
*
Author to whom correspondence should be addressed.
Sustainability 2022, 14(14), 8424; https://doi.org/10.3390/su14148424
Submission received: 8 June 2022 / Revised: 4 July 2022 / Accepted: 5 July 2022 / Published: 9 July 2022
(This article belongs to the Section Sustainable Forestry)

Abstract

:
Human food production is the largest cause of global environmental changes. Environmental benefits could be achieved by replacing diets with a high amount of animal-sourced foods with more plant-based foods, due to their smaller environmental impacts. The objective of this study was to assess the environmental impacts of the three most common plant-based milk alternatives (PBMAs)—oat, soy, and almond drink—in comparison with conventional and organic cow milk. Life cycle assessments (LCA) were calculated by the ReCiPe 2016 midpoint method, in addition to the single issue methods “Ecosystem damage potential” and “Water scarcity index”. PBMAs achieved lower impact values in almost all 12 of the calculated impact categories, with oat drink and the organic soy drink being the most environmentally friendly. However, when LCA results were expressed per energy and by the protein content of the beverages, the ranking of the beverages, in terms of their environmental impacts, changed greatly, and the results of PBMAs approached those of milk, particularly with regard to the protein index. The study highlights the importance of considering a broader range of impact categories when comparing the impacts of PBMAs and milk.

Graphical Abstract

1. Introduction

In the concept of global sustainability, Rockström et al. [1] defined planetary boundaries as biophysically safe operating spaces for environmental processes and systems, within which the humanity can operate safely. Outside of these boundaries, the stability and resilience of the earth system is not given, and human-induced environmental changes can have catastrophic impacts on the earth system. Rockström et al. [1] also proposed the quantification of boundaries for: climate change, ocean acidification, stratospheric ozone, the nitrogen cycle, the phosphorus cycle, global freshwater use, land system change, and the rate of biodiversity loss. Three boundaries are estimated to have already been transgressed, i.e., for climate change, the global nitrogen cycle, and the rate of biodiversity loss [1]. Against this background, human food production is of vital importance, as it is the largest cause of global environmental changes [2]. The major environmental processes and systems, which are involved in food production, relate to climate and land-system change, nitrogen and phosphorus cycles, biodiversity loss, and freshwater use, are mainly within the frame of agricultural activities [2].
The human food supply chain causes 26% of the anthropogenic greenhouse gases (GHG) emissions [3], and it is a main source of global methane (CH4) and nitrous oxide (N2O), with 56 and 280 times higher global warming potential (GWP) than carbon dioxide (CO2), respectively [4]. In food production, carbon dioxide is released through various agricultural activities, such as the conversion of natural ecosystems to arable land, burning to clear the land, tillage of soils, burning of fossil fuels by agricultural machinery, transport of agricultural products, and the production of synthetic fertilizers and crop protection agents. Nitrous oxide is mainly emitted through the activity of soil microbes in pastures and cropland, while methane mostly originates from the enteric fermentation of ruminant livestock [2].
The FAO (Food and Agricultural Organization of the United Nations) publication, “Livestock’s Long Shadow” [5], was the first comprehensive study on the global impact of livestock production, and it drew public attention to the sustainability of human food production. In fact, within the food web, only about 10% of the consumed energy is stored in the biomass of the next trophic level [6,7]. Accordingly, when human diets are mainly based on plants, more people can be fed per limited resources than through animal products [7].
Globally, the livestock sector is a major stressor for many ecosystems. It is a key player in increasing water use and a leading causal factor for biodiversity and species loss [5]. According to IPCC [8], the livestock sector contributes to 14.5% of the total human-induced greenhouse gas emissions. Animal products, such as meat and dairy use approximately 83% of the world’s farmland and contribute 56–58% to food´s different emissions, while they provide only 18% of the calories and 37% of the protein in human diets [3]. As the environmental impacts of animal-sourced foods clearly go beyond those of plant-based products (e.g., [9,10]), environmental benefits would be achieved by replacing diets with a high amount of animal-sourced foods with more plant-based foods, e.g., [11,12,13,14].
In the last decade, a growing market emerged for substitutes of animal products with plant-based ones. In particular, plant-based milk alternatives (PBMAs) to cow milk are becoming increasingly popular in Europe and other industrialized countries, e.g., the United States [15,16]. The most consumed PBMAs are oat, almond, and soy drink, followed by coconut and rice drink [16,17,18,19]. According to a survey (N = 1712, [17]) in Germany, 86% of the respondents consumed cow milk and 34% consumed PBMAs (multiple answers were possible), while 37% partially waived milk products deliberately. Reasons for the reduction in milk products were animal welfare (50%), environmental and climate protection (38%), food intolerances (28%), special diets (26%), and health reasons (24%). Similarly, in a consumer survey of Grunert et al. [20], respondents (N = 4408) showed a medium to high level of concern for the sustainability of food production.
The present study focused on plant-based milk alternatives to evaluate their possible contribution to reducing environmental impacts caused by human food production. In the last decades, a growing number of food life cycle assessment (LCAs) studies have been published. However, while numerous LCAs for cow milk are available, information on environmental impacts of PBMAs is limited (Table 1). Nijdam et al. [21] calculated, from 12 dairy milk LCA studies for Northern European countries and Canada, the GWP of milk to be 1–2 kg CO2 eq/kg. In a comprehensive meta-analysis of global data, mean GHG emission for cow milk was calculated as 3.2 kg CO2 eq/L, with a broad range of 1.7–4.8 kg and a median of 2.8 kg CO2 eq/L, respectively [3]. Differences between results for cow milk are due to the feed composition [22], the production system and country [21,23], and the manure management [24]. In comparison, the published GHG emissions of soy drinks (n = 354) were considerably smaller, with a median of approximately 1.0 kg CO2 eq/L and a range of a 0.6–1.5 kg CO2 eq/L [3].
With regards to land use, Poore and Nemecek [3] reported a mean of 8.9 m²/year/L milk (range: 1.1–9.0, median 2 m²/year/L). In contrast, the soy drink [3] had a clearly smaller land use, with a mean of 0.7 m²/year/L (range: 0.3–0.9, median 0.7 m²/year/L). Nijdam et al. [21] found a slightly higher land use of about 1–2 m²/year/kg soy drink.
The objective of this study was to assess the environmental impacts of the three most common PBMAs—oat drink, soy drink and almond drink—in comparison with conventional and organic cow milk. For consumers, environmental product declarations (EPDs) have been developed, focusing on carbon, water, or ecological footprint. However, such labelling does not cover the entire breadth of environmental impacts [9,25,26]. In addition, LCA results from different studies are only partly comparable due to different LCA methods, databases, diverse production methods of a beverage of the same type, transportation scenarios, different system boundaries, and cut offs of LCAs [9]. Taking into account these drawbacks, a variety of environmental impacts were evaluated by applying the multifactorial life cycle assessment method, ReCiPe 2016 midpoint [27], the two single issue methods water scarcity index (WSI), according to Hoekstra et al. [28], and the ecosystem damage potential (EDP) defined by Koellner and Scholz [29,30]. This approach allows for a comparison of the environmental impacts within and between PBMAs and milk on a broader breadth. Thus, the results of this study elucidate which contribution PBMAs can make to reducing the environmental impacts of human nutrition. Finally, comparing the food impacts of the beverages contributes to inform consumers in their dietary choice.
Table 1. Global Warming Potential (GWP) from life cycle assessment (LCA) studies for plant-based milk alternatives and cow milk.
BeverageGWPSystem Boundary/OriginMethodReference
Oat drink0.21 kg CO2 eq/L drinkup to supermarketstudy[31]
0.45–0.48 kg CO2 eq/kg drinkup to supermarketstudy[32]
Soy drink0.22 kg CO2 eq/L drinkup to consumerstudy[33]
0.66–1.40 kg CO2 eq/kg drinkvarying system boundariesmeta-analysis[9]
Almond drink0.50 kg CO2 eq/L drinkup to factory gatestudy[34]
0.39–0.44 kg CO2 eq/kg drinkvarying system boundariesmeta-analysis[9]
Cow milk1.20–1.35 kg CO2 eq/L milkup to gravestudy[35]
1.77–2.40 kg CO2 eq/kg FPCMup to gravestudy[36]
0.54–7.50 kg CO2 eq/L milkworldwidemeta-analysis[9]
0.54–2.39 kg CO2 eq/L milkaverage Europemeta-analysis[9]
1.7 kg CO2 eq/kg FPCMOECD countriesstudy[37]
FPCM: fat and protein corrected milk.

2. Materials and Methods

2.1. Databases

The calculation of LCA for diverse foods in human nutrition, especially substitute products, is hampered by gaps in the available databases. For the present study, the software SimaPro® created by PRé Sustainability (Amersfoort, The Netherlands) in the Sima Pro PhD version, Release 9.9.0.49 and the supplied Ecoinvent database 3.5. (November 2018) were used. In addition, the ESU World food LCA database (October 2019) was used for oat drink, conventional and organic soy drink, almond drink, and conventional and organic milk. Fortified PBMAs differ largely in their additives (Pointke et al.) [38]. Taking into account these differences, only data sets from unfortified PBMAs with similar percentages of plant-based raw material were used (Table 2).
The functional unit was set at 1 kg of a PBMA or cow milk. The system boundary of every product was defined from cradle to supermarket. Original datasets, expressed as 1 kg/drink, were converted to 1 L/drink. Production system (conventional or organic) and origin of the main ingredients of the beverages are summarized in Table 2. For processing (factory, dairy) and distribution of the drinks, data from Switzerland were used.
The following definitions and modifications were made to harmonize the datasets:
  • Soy drinks: although the term ‘soy milk’ is widely used, it is not a milked drink, so the term ‘soy drink’ is used here instead. The original soy drink data set was based on chilled drinks, as well as cooling during the transport and in the supermarket. For the present analyses, cooling was replaced by a non-refrigerated storage and transport, as for the other PBMAs.
  • Milk: In the present study, the term ‘milk’ refers to cow milk only. The functional unit of 1 kg of milk refers to fat and protein corrected milk (FPCM), with 3.5% fat and 3.3% protein. The original milk data included only a system boundary until dairy. Therefore, a typical transport route for milk was added. From farm to dairy, there was a non-refrigerated transport of 150 km, and from dairy to supermarket a transportation route of 200 km was assumed. For an in-depth analysis of different milk products, data sets from conventional and organic milk production were included. In addition, milk processing was considered by creating two new datasets for ultra-high temperature (UHT) conventional and organic milk based on the respective datasets. For UHT milk products, the refrigerated transport from dairy to supermarket was converted to a non-refrigerated transport, saving 1.01 MJ/kg energy. On the other hand, UHT milk is processed by heating to at least 135 °C for a few seconds, corresponding to a higher energy demand of 0.29 MJ/kg compared to fresh milk. The absence of a cold chain allows for a better comparison of UHT results with those from unrefrigerated PBMAs.

2.2. Life Cycle Inventories and Impact Assessment

The datasets were modeled by means of the software tool SimaPro® (Release 9.9.0.49), by PRé Consultants, to calculate the environmental impacts of the target beverages. For impact assessment, the method ReCiPe Midpoint 2016 (v1.1) was chosen [27]. From the three ReCiPe Midpoint perspectives—‘individualist’, ‘hierarchist’, and ‘egalitarian’—the hierarchist (H) perspective was applied, with an average time horizon of 100 years and global normalization factors for the reference year 2010.
LCAs in ReCiPe can be conducted by midpoint impact categories or endpoint indicators. From a total of 18 midpoint impact categories, 9 damage pathways are derived, which are summarized in 3 endpoint areas of protection: ‘damage to human health’, ‘damage to ecosystems’, and ‘damage to resource availability’ [27]. In this study, the 10 midpoint impact categories, corresponding to the endpoint area ‘damage to ecosystems’, were applied, as detailed, in Table 3.
In addition to the ReCiPe 2016 categories, the water scarcity index (WSI, [28]) and the ecosystem damage potential (EDP, [29,30]) were calculated to evaluate the environmental sustainability. In contrast to ReCiPe 2016, these methods include only one single impact category.

2.3. Water Scarcity Index (WSI)

The WSI [28] is based on a consumption-to-availability ratio and is calculated as the fraction between consumed and available water. The consumed water only relates to the blue water footprint (defined as surface and groundwater by Hoekstra et al.) [39] and also considers the water scarcity in the producing region for the main watersheds worldwide. However, the WSI is not identical to the impact category ‘Water consumption’ in ReCiPe 2016, which only indicates the water consumption necessary for the production of a special product.

2.4. Ecosystem Damage Potential (EDP)

The ReCiPe 2016 does not cover specific information about species diversity/biodiversity and land transformation. In the light of the importance of the planetary boundary biodiversity loss, the method EDP [29,30] was applied. The EDP characterizes land occupation and transformation, and it considers diversity of plant species, threatened plant species, moss, and molluscs. The mean species number in the regions is used as a reference to evaluate whether specific land use types result in more or less species diversity per area [40,41].

2.5. Life Cycle Assessment Nutritional Value—Index

Both PBMAs and milk beverages differ in their nutritional composition, as shown by Pointke et al. [38]. Accordingly, LCA results were expressed and related to the major dietary components: contents of energy (kcal) and protein (g) of the beverages. The following impact categories were chosen to calculate a Life Cycle Assessment Nutritional Value—Index: global warming, land use, and water consumption from ReCiPe 2016 midpoint analyses and the EDP. For the index, LCA and EDP results were divided by the amount of energy or protein for each 100 g of the beverage. As an approximation for the nutrient composition of PBMAs and milk beverages, the average nutrient composition of commercially available products was used. Each of seven commercial products per drink were purchased from the German food market, and the mandatory nutrient information of the respective packages was averaged per drink. For PBMAs, only unfortified beverages were chosen. The same nutritional composition was assumed for the soy drinks from BR/USA and CH. Calculated averages for the declared contents of protein and energy are shown in Table 4.

3. Results and Discussion

The LCA results based on the three methods—ReCiPe 2016, WSI, and EDP—are summarized in Table 5 for each impact category. The color scale of the laid-over heat map ranges from dark green for the lowest impact to the red color for the highest impact value, and it corresponds to qualitative similarity. Neither PBMA nor milk products achieved the lowest impact values in all categories (Table 5). However, in general, higher impact values were found for the different milk beverages compared to the PBMAs (Table 5). On the other hand, there are some extremely high values of PBMAs in various impact categories, which are discussed in more detail below.
In addition, for a detailed analysis of the LCA results for milk beverages, conventional milk was set as reference, and the relative changes between organic and the respective UHT milk are shown in Table 6. UHT milk had lower environmental impacts than the respective conventional or organic fresh milk (Table 6).

3.1. Global Warming Potential (GWP)

In crop production, the release of GHG through fire clearance, industrial synthesis of nitrogen fertilizers, waste management, and the combustion of fossil fuels are the primary contributions to the global warming potential (GWP) [2]. GWP was quite similar for oat and soy drinks, whereas higher values were found for almond drinks (Table 4). Compared to milk products, GWP was about two to three times lower in PBMAs. This difference is mainly due to the high methane emissions from ruminant enteric fermentation [42]. The values for the oat drink (Table 5) were slightly higher than those of Smedman et al. [31] but in line with those of CarbonCloud [32] and Röös et al. [42]. The results for the soy drink used in this study ranged between values of Birgersson et al. [33] and Clune et al. [9], who used different origins, system boundaries, transports, and methods. The calculated GWP of almond drinks was slightly higher compared to those of Winans et al. [34] and Clune et al. [9], due to other methods, datasets, and system boundaries.
The highest proportion of the GWP, for PBMAs with about 45%, arose up to the factory gate and included the cultivation of the raw products, as well as the production of the drink. The differences in GWP between the PBMA can be explained by the different cultivation methods of the raw products, e.g., by a lower need for nitrogen fertilizer when growing oats [43]. For the calculation of the soy drink from BR/USA, the provision of stubbed land flowed into the production of Brazilian soybeans, whereas the soy beans from CH required only green manure. The lower performance of the almond drink was due to the higher usage of nitrogen fertilization, which accounted for 18% of the almond drinks’ GWP. In addition, electricity was required for the irrigation with water pumps. On average, for all PBMAs, a share of about 25% of the GWP originated from the packaging; further, 9% of the GWP was generated by transport. For non-regionally produced drinks, the additional GWP for transport by lorry within the country of production (5% for soy from BR/USA, 8% for almonds) and transoceanic transport (4% for almonds) must be considered. Long road transports by trucks emit more GHG (about 68 g CO2/tkm) than the transport by transatlantic shipping (17 g CO2/tkm) because bulk carriers can transport larger volumes of foods more efficiently [44]. The air freight has the biggest impact on the climate and emits five times more GHG emissions than trucks [45]. Thus, the oat and the Swiss soy drink, originating from regional production, are advantageous in terms of their GWP.
The reported GWP for milk varies worldwide within a broad range. In industrialized countries, average emission for milk production is lower than that under extensive production systems, e.g., [46,47], due to higher milk yield/cow and concentrate feeding with higher digestibility [37]. The present GWP values (see Table 5) are in the middle of those reported by Meneses et al. [35] and Thoma et al. [36] (Table 1). In the present study, a share of around 80% of the raw milk at dairy accounted for the GWP of the milk at the supermarket. From the GWP of the whole milk at dairy, around 75% were caused by the raw milk at farm. Moreover, packaging, refrigerated transport, and cold storage contributed 7%, 9%, and 4% to the GWP, respectively. The share of transport decreased by about 5.9–8.2% for unrefrigerated UHT milk (Table 6). In addition, the allocation between milk and co-products (i.e., meat) should be considered to reduce total GHG emissions [48,49] in dairy production.
The GWP of milk is largely due to methane emissions from the cows, which, in this case, was about 2.3% higher for organic milk (51.2% of the GWP) than for conventional milk, with 48.6% of the GWP (Table 6). These results fit to those of de Boer [50], who found, in a meta-analysis, that 48–65% of the GWP for milk production was due to the emission of methane, with higher methane emissions in organic milk production. This difference in milk production systems can be partly explained by different feeding, productivity, genetics, and life spans [51].
Although a broad range of LCA methods have been developed, aspects of soil carbon changes are not sufficiently taken into account in GWP calculations. This applies to the management impact, in both arable and dairy farming systems, on soil organic matter levels. Organic farming can improve soil humus [51], including carbon storage in the soil via plant roots [52]. Grasslands play an important role for carbon storage and sequestration [53,54]. As pointed out by Knudsen et al. [55], only a few LCA studies included soil carbon changes in the evaluation of milk production impact. In their study, the calculated GWP was reduced by 5–18%, particularly for dairy systems with pasture based feeding. Thus, GWP for milk beverages in this study is possibly overestimated. Similarly, consideration of carbon storage by almond trees could improve the GWP of the present almond drink.

3.2. Land Use

The PBMAs required only half the land resources of milk for the production of 1 L drink (Table 5). Among PBMAs, the land use for the almond drink was most efficient. This is probably because almond trees make better use of the vertical space above the same ground surface. Organic soy drinks (CH) required more land than drinks from conventional production in Brazil and USA, due to the lower yields of soybeans [56]. Additional land was required for wood for the production of the tetra bricks.
In the case of milk, land was mainly used to grow fodder and for cattle breeding, e.g., replacement heifers. Fodder may be derived from grassland and partly from arable land [57,58]. Organically produced milk required more land, as milk yields are lower than in the conventional system, but the proportion of milk produced from grasslands is higher.
In view of the global constraints on land, the opportunity costs of producing feed and rearing livestock, instead of directly growing food for human consumption, must be considered [59]. For global feed production, 2.5 billion ha of land are required, which is about half of the global agricultural area. Among these, 2 billion ha are grassland; of these, 1.3 billion ha cannot be converted to cropland. Thus, 57% of the land used for global feed production is not suitable for human food production [60]. The advantage of cows is given by their capacity to convert forages, agricultural by-products, and crop residues into milk of high nutritional value. A large part of European extensive semi-natural grasslands is only suitable for grazing [21], and it is predestined for the use of soils which cannot be utilized for crop cultivation.

3.3. Acidification

In addition to natural influences on soil pH, anthropogenic factors, such as acid rain and excessive inputs of fertilizers, are the main causes leading to soil acidification [61]. The acidification potential varies with plant species, the form of nitrogen fertilization, uptake and leaching of nutrients, location, and climate [61,62]. In the present study, the organic soy drink had the lowest potential for acidification, due to the capacity of soybeans to fix atmospheric nitrogen with the help of symbiotic bacteria inside the root nodules. Therefore, soybeans are largely independent from nitrogen fertilization, and green manure is sufficient [56]. Among PBMAs, the almond drink ranked highest. Almond trees require high amounts of nitrogen, particularly during fruit growth and development. The common practice of injecting water-soluble fertilizer through the irrigation system might explain the high acidification potential of almond trees [63].
Farm manure and mineral fertilizers, together, account for 50% of ammonia emissions in agriculture. The 3–10 times higher potential (Table 5) for terrestrial acidification of milk compared to PBMAs was mainly due to the volatilization of ammonia from manure in dairy farming [50]. Most of the ammonia emissions in dairy cattle are caused by the application of excrements, while the rest is distributed among the barn, storage, and to a small extent, pasture [64]. The acidification potential is somewhat higher in organic dairy farming because more excrements/milk output are produced than with conventional cows.

3.4. Eutrophication

Eutrophication of soils and water has become a major problem in large parts of Europe [65]. Since the 1960s, the use of synthetic phosphorus fertilizers has tripled, and the usage of nitrogen fertilizers has increased nine- fold globally [66]. Phosphorus and nitrogen, mainly originating from agricultural activities, especially with synthetic fertilizers and manure, are the main drivers of freshwater eutrophication and marine eutrophication, respectively [66]. Urban sewage discharges also have a share in the eutrophication process [66,67]. In the present study, PBMAs were clearly superior to milk variants in terms of their freshwater eutrophication potential. Among PBMAs, the highest values were found for both soy drinks, and the lowest was found for the almond drink. The impact of phosphorus fertilization in soybeans depends on the soil, leaching conditions, and the yield. Lower P fertilizer use can explain the better rating of the organic soy drink from CH compared to that from BR/USA. The twice as high freshwater eutrophication potential of milk, compared to the PBMAs, is partly related to the accumulation of phosphorus from the manure. In addition, phosphorus fertilization for the fodder cultivation in dairy farming may contribute to freshwater eutrophication. The slightly higher manure application/L of organic milk explains its increased freshwater eutrophication values compared to the conventional milk.
Marine eutrophication potential of PBMAs and milk is closely linked to the use of nitrogen fertilizers in the production of the raw materials and varied considerably between PBMAs. The use of little or no N fertilizer and less N leaching are the reasons for the low values calculated for the soy drink from BR/USA, as well as the oat drink. The nearly doubled impact of organic soy from CH, compared to the soy drink from BR/USA, was exceptionally high. This can be explained by higher yields in conventional soy cultivated in BR/USA under more favorable climate conditions, resulting in a lower load per produced unit. In addition, under Swiss conditions, the green manure in organic soybean production, as well as partly lower soil cover in winter, can lead to a higher risk of nitrogen leaching. Additionally, the application of liquid manure as low starter fertilization, to support the initial growth of soy in cold soils where symbiosis is delayed, might also increase nitrogen leaching [68]. The high marine eutrophication potential of the almond drink reflects the intensive nitrogen fertilization required for fruit growth [63]. It is worth noting that all milk beverages had lower impacts than the worst-performing PBMAs, i.e., organic soy and almond drink. The better performance of the organic milk variants, compared to the conventional milk beverages, by about 6% (Table 6) is related to lower fertilizer application rates, as also shown by de Boer [50].

3.5. Ecotoxicity

The three impact categories—terrestrial, freshwater, and marine ecotoxicity—assess the emission of chemicals and metals [27]. For all impact categories, lower impacts were calculated for PBMAs than for milk beverages, with the exception of the highest value found for freshwater ecotoxicity in almond drink. Between PBMAs, results for the three impact categories varied considerably. While for all three ecotoxicity categories, the organic soy drink from CH and the oat drink had the lowest impact, the high freshwater ecotoxicity of the soy drink from BR/USA calls attention. Comparing the milk beverages, the organic milk variants had lower impact potentials than the conventional ones in all ecotoxicity categories. This is most obvious for freshwater ecotoxicity, where organic milk caused a 51% lower contamination than conventional milk (Table 6). These results are in line with the study of Knudsen et al. [55] on European conventional and organic milk production. The slightly better results of the UHT milk, compared to the fresh milk, can be explained by the omission of the refrigerated transport.
The high ecotoxicity values are mainly due to the application of chemical agents for crop protection in agricultural cultivation [69]. The use of synthetic crop protection agents is banned in organic farming [70], explaining the consistently better performance of organic milk compared to the conventional one, as well as the lower pollution levels in the cultivation of organic soy from CH compared to conventional soy from BR/USA. According to Nordborg et al. [71], the soy production in BR involves more use of chemical agents compared to European crop production. High temperatures and more rainfall, in combination with a weak legislation, contribute to high ecotoxic exposure in Brazil [71]. In conventional milk, the present higher ecotoxicity, compared to organic milk, was partly due to the use of Brazilian-grown soybeans as fodder. Ecotoxicity was also influenced by the packaging of the drinks in tetra bricks. The use of special low-density polyethylene (LDPE) foil, with the accompanying disposal of polyethylene, as well as the utilization of kraft paper containing zinc, had an additional impact.

3.6. Terrestrial Ozone Formation

Ozone is formed due to photochemical reactions of NOx and NMVOCs (Non Methane Volatile Organic Compounds) [27], mainly originating from traffic, combustion of power plants and industry, and solvents [72]. Interestingly, milk beverages performed similarly low as the oat and the conventional soy drink. The low ozone formation values of the soy drinks were mainly due to transport, harvesting processes, and packaging. The oat drink and, especially, the almond drink were affected by emissions from nitrogen fertilizers. For the non-regionally produced almonds and soybeans from BR/USA, ship and truck transports had high impacts on ozone formation. Considering the different milk beverages, the UHT milk variants performed about 17–19% better than the fresh milk ones (Table 6) because UHT milk does not require refrigerated transport and the associated use of refrigerants affecting the ozone formation.

3.7. Water Consumption and Water Scarcity Index

Water consumption, calculated according to the ReCiPe 2016 method, only refers to the blue water footprint, which originates from the use of surface and groundwater [39]. Compared to milk beverages, the PBMAs had low water consumption, whereas the fresh milk required about four times more water. In PBMAs, water consumption was mainly due to electricity (also hydropower) and tap water [73] for drink production, packaging, distribution, and transport. Regarding the almond drink, water for irrigation of the almond trees was required. In milk production, a large part of the water consumption occurred in dairy farming. Electricity was also needed for cattle breeding, milking, and packaging. For fresh milk, cold storage in the dairy, during transport, and in the supermarket accounted for the largest share of water consumption due to the electricity required. Cold storage and transport was not necessary for UHT milk, which explains their over 30% (Table 6) lower water consumption compared to fresh milk.
The comparison of the water consumption by the ReCiPe 2016 method and the WSI [28] is of particular interest because the WSI does not only consider the water consumption but also the regional water availability. For PBMAs, favorable consumption-to-availability ratios were found for the soy drinks and the oat drink. The immensely high WSI of the almond drink resulted from the fact that 97% of the water consumption was based on the irrigation of the almond trees, and water is scarce in the production country of California. It is noteworthy that the WSI for all milk variants was more favorable than that of the almond drink. Contrary to the water consumption calculated by the ReCiPe 2016 method, WSIs were quite similar for all milk beverages. Thus, the consideration of the good water availability in Central European dairy regions results in completely different rankings of the milk beverages compared to PBMAs.

3.8. Ecosystem Damage Potential (EDP)

The biodiversity has a paramount importance for the stability of ecosystems, as well as all ecosystem functions and services, such as the provisions of crop and fodder, the storage of carbon in soils, and the absorbance of nutrients from soils [2,74]. In particular, agricultural biodiversity is closely linked to dietary health and human wellbeing [2]. As outlined by Koellner and Scholz [30], highly intensive agriculture preserves the lowest species richness, and low-intensity agriculture preserves the highest biodiversity.
The total EDP [30] is defined as the unweighted sum of the scores, for land occupation and land transformation, for each of the tested beverages (Table 7). Land use calculated by the ReCiPe 2016 method (Table 5) and land occupation determined by the EDP yielded comparable rankings within and between beverages, with the exception of the very low EDP value for the organic soy drink. Thus, for a comparison between beverages, the impact of land transformation on the ecosystem is of particular interest.
With the exception of the conventional soy drink, PBMAs outperformed the milk beverages in terms of their better total EDP scores. Among PBMAs, the organic soy drink from Switzerland achieved the lowest total score because the least land transformation was required. The highest EDP of all beverages was found for the soy drink from BR/USA, with their favorable values in land occupation being offset by extraordinarily high values in land transformation, especially in Brazil. The slash-and-burn cultivation of arable land for soy in Brazil, is highly reducing or destroying species diversity and biodiversity (e.g., [75]. Almond trees, as a permanent crop, are rated as better than annual crops such as oats by the EDP method. However, the good total rating of the almond drink must be interpreted with caution, because the EDP method was developed for plant production in Central Europe [29]. Possible environmental damages due to almond cultivation in large monocultures is not taken into account, so the assessment of almond production in California is probably too favorable. For all beverages, the present EDP also included the land required for packaging material, such as kraft paper for the tetra brick, mostly made from Scandinavian wood.
The four milk types achieved similar values for land occupation, whereas large differences between milk beverages originated from land transformation associated with different feeding regimens in milk production systems. Organic milk production is mainly based on pasture-based feeding, whereas in conventional milk production, higher amounts of concentrates including soybean meal are fed. As outlined before, soybeans from Brazil are charged with ecosystem damage due to land transformation. Pasture use for feeding is valued higher in the EDP method than the use of land for annual forage crops. Accordingly, the total EDP of organic milk about 46% better than conventional milk production. This result agrees with Knudsen et al. [55] who calculated much lower biodiversity damage of organically produced milk compared to conventional one in Europe. It is of particular interest to note that the EDP for land transformation of the organic milk beverage was very close to those of almond and oat drink. This draws attention to the importance of permanent grassland for biodiversity. In particular, more extensive grazing systems, such as in organic milk production, preserve biodiversity and contribute to species richness [52,76].

3.9. Life Cycle Assessment Nutritional Value—Index

The energy content of the plant drinks is lower than that of the milk variants. In terms of protein content, the soy drink is comparable to milk, while oat and almond drink have a lower protein content (Table 4). Accordingly, the Nutritional Value-Index values differed, quite clearly, from the previous LCA results (Table 5) of the corresponding impact categories: global warming, land use, water consumption and EDP (Table 8 and Table 9). The color scale of the laid-over heat map ranges from dark green for the lowest impact to red color for the highest impact value and corresponds to qualitative similarity.
For both energy and protein content, the organic soy drink achieved the lowest impacts. The almond drink stands out due to its high values for both indexes. The oat drink showed low impact values for the energy index, while the results for the protein index were comparably poor to those of the almond drink. In comparison, all milk variants improved in their indexes compared to the previous LCA results. Regarding the protein index, milk beverages performed better than oat and almond drink. This superiority underlines the high efficiency of cows in converting natural resources into protein.

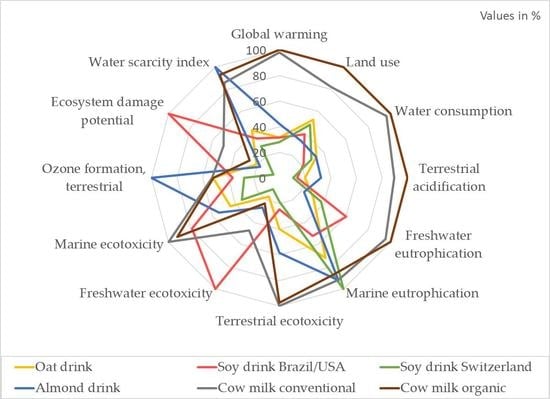
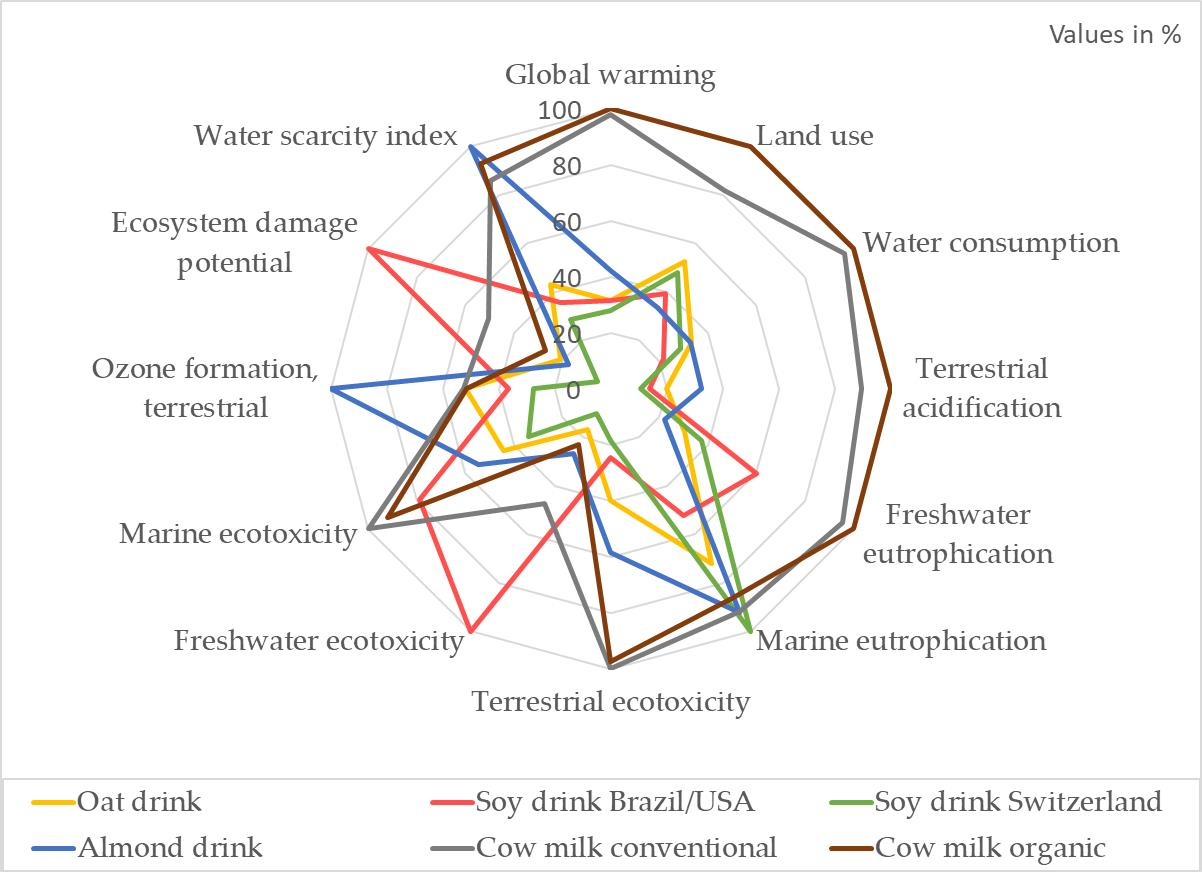
3.10. Comparison between Beverages

General conclusions on the possible suitability of PBMAs to substitute cow milk, in terms of sustainability, are hampered in various aspects. The available databases only dispose of limited data sets for PBMAs and their ingredients. In particular, data on organically produced food are scarce. However, the influence of the production system is best shown by the mostly better results of the present study for the organic soy drink compared to the conventional one from BR/USA. Similarly, the comparison with oat and almond drinks, based on organic production, would be of interest.
When comparing the present beverages by their LCAs, it should be considered that individual impact categories and various planetary boundaries are interlinked and mutually dependent. Thus, the question arises: which categories have a relative superiority over others? It is suggested to focus on the three planetary boundaries which have already been transgressed, according to Rockström et al. [1], i.e., climate change, global nitrogen cycle and rate of biodiversity loss, to which the present LCA results for global warming, marine eutrophication, and ecosystem damage potential would best correspond. Assuming the same valence for these impact categories, the present beverages can be ranked based on the respective summarized ranks for each category, as follows: oat drink (1), soy drink CH (2), soy drink BR/USA (3), almond drink (4), UHT milk organic (5), UHT milk conventional (6), milk organic (7), and milk conventional (8).
However, such an approach does not take into consideration the large differences in nutrient content between beverages. In contrast to milk, PBMAs do not have a standardized composition, which makes a valid comparison difficult. While milk is offered by the dairy with fairly constant fat and protein content, ingredients of PBMAs differ largely between products [77]. The energy content of the plant drinks is considerably lower than that of the milk variants. In terms of protein content, the soy drink is comparable to cow milk, while the oat and almond drinks have a lower protein content. Accordingly, as shown by the Life Cycle Assessment Nutritional Value—Indexes for energy and protein, the ranking of the beverages, in terms of their environmental impacts, changed greatly, and the impacts of PBMAs were approaching those of milk, particularly with regards to the protein index. However, the comparison of the present Nutritional Value—Indexes, in terms of quantity, is limited, as it does not take into account the protein quality of the drinks: in particular, the higher provision with essential amino acids in milk compared to PBMAs [78].
In the Western diet, milk is an important supplier of protein, vitamins A, B2, B12, and calcium. However, PBMAs are not equivalent to cow milk, due to their lower contents of proteins, minerals, and vitamins. However, if they are fortified with nutrients, plant-based substitutes can offer an alternative to dairy products [77]. In the case of fortified PBMAs, the nutritional composition may be quite different from the present data sets. Thus, some commercial oat beverages are already supplemented with pea isolates to increase the content of essential amino acids [79]. Accordingly, LCAs for fortified PBMAs would differ from the present results, as the environmental impacts of the additives have to be included. In addition, for a valid comparison between fortified PBMAs and milk, possible health risks, due to a lower bioavailability of additives, have to be considered [78].
From an environmental perspective, the substitution of milk by PBMAs provides a limited contribution, depending on the amount consumed. Tukker et al. [80] estimated a GWP of 7.10 kg CO2 eq/capita/day for an average European diet. Based on the present results, the daily consumption of one glass (0.25 kg) of soy drink or conventional milk would add 0.1 kg or 0.35 kg CO2 eq to this amount, respectively. Thus, by replacing 0.25 kg conventional milk with 0.25 kg organic soy drink, 0.25 kg CO2eq/capita/day could be saved.

4. Conclusions

In the present study, a range of different impacts from multifactorial and single issue LCA methods, for an in-depth comparison between PBMAs and milk beverages, were calculated. PBMAs achieved lower impact values in almost all of the calculated 12 impact categories, with oat drink and organic soy drink being the most environmentally friendly. In the case of milk, clear differences between the variants could be shown. UHT milk showed advantages over fresh milk in almost every environmental category.
However, when comparing the present beverages by their LCAs, the large differences between beverages in nutrient content have to be taken into consideration. Accordingly, as shown by the Life Cycle Assessment Nutritional Value—Indexes for energy and protein, the ranking of the beverages in terms of their environmental impacts changed greatly and the impacts of milk were approaching those of PBMAs, particularly with regard to the protein index. It is noteworthy that, while consumers showed in surveys a medium to a high level of concern for the sustainability of food production, animal welfare was cited first as a motivation for milk substitution. In consideration of the present results, milk produced under high animal welfare standards, e.g., organic UHT milk, could also be a suitable alternative for environmental reasons. Finally, the present study highlights the importance of considering a broader range of impact categories and the nutritional composition when comparing the impacts of PBMAs and milk.

Author Contributions

Conceptualization, K.G., M.P., I.T. and M.G.; methodology, K.G. and E.H.A.; software, K.G. and E.H.A.; validation, M.G.; formal analysis, K.G.; investigation, K.G.; data curation, K.G. and E.H.A.; writing—original draft preparation, K.G. and M.G.; writing—review and editing, K.G., E.H.A., M.P., E.P., M.G. and I.T.; visualization, K.G.; supervision, M.G. and I.T.; project administration, K.G., M.G. and I.T.; Funding Acquisition, M.G. and E.P. All authors have read and agreed to the published version of the manuscript.

Funding

This research was part of the NES project (Pflanzlich orientierte Ernährungsstile als Schlüssel zur Nachhaltigkeit—Nachhaltige Ernährungsstile), which was funded by the Volkswagenstiftung, grant number number ZN3382 and the Ministry for Science and Culture of Lower Saxony, grant number VWZN3255.

Institutional Review Board Statement

Not applicable.

Informed Consent Statement

Not applicable.

Data Availability Statement

Data from measurements are available upon request from the corresponding author.

Acknowledgments

The authors acknowledge the support by the Open Access Publication Funds of Goettingen University.

Conflicts of Interest

The authors declare no conflict of interest. The funders had no role in the design of the study; in the collection, analyses, or interpretation of data; in the writing of the manuscript, or in the decision to publish the results.

References

  1. Rockström, J.; Steffen, W.; Noone, K.; Persson, Å.; Chapin, F.S.I.; Lambin, E.; Lenton, T.M.; Scheffer, M.; Folke, C.; Schellnhuber, H.J.; et al. Planetary Boundaries: Exploring the Safe Operating Space for Humanity. Ecol. Soc. 2009, 14, art32. [Google Scholar] [CrossRef]
  2. Willett, W.; Rockström, J.; Loken, B.; Springmann, M.; Lang, T.; Vermeulen, S.; Garnett, T.; Tilman, D.; DeClerck, F.; Wood, A.; et al. Food in the Anthropocene: The EAT–Lancet Commission on Healthy Diets from Sustainable Food Systems. Lancet 2019, 393, 447–492. [Google Scholar] [CrossRef]
  3. Poore, J.; Nemecek, T. Reducing Food´s Environmental Impact through Producers and Consumers. 2018, 360, 987–992. Science 2018, 360, 987–992. [Google Scholar] [CrossRef] [PubMed] [Green Version]
  4. Pachauri, R.K.; Meyer, L.A. IPCC 2014a. Climate Change 2014: Synthesis Report, Contribution of Working Groups I, II and III to the Fifth Assessment Report of the Intergovernmental Panel on Climate Change; IPCC: Geneva, Switzerland; p. 151.
  5. Steinfeld, H.; Gerber, P.; Wassenaar, T.D.; Castel, V.; Rosales M., M.; Haan, C. de Livestock’s Long Shadow: Environmental Issues and Options; Food and Agriculture Organization of the United Nations: Rome, Italy, 2006; ISBN 978-92-5-105571-7. [Google Scholar]
  6. Lindeman, R.L. The Trophic-Dynamic Aspect of Ecology. Ecology 1942, 23, 399–417. [Google Scholar] [CrossRef]
  7. Bick, H. Ökologie: Grundlagen-Terrestrische Und Aquatische Ökosysteme-Angewandte Aspekte, 2nd ed.; G. Fischer: Stuttgart, Germany; Jena, Germany; New York, NY, USA, 1993. [Google Scholar]
  8. Barros, V.R.; Field, C.B.; Dokken, D.J.; Mastrandrea, M.D.; Mach, K.J.; Bilir, T.E.; Chatterjee, M.; Ebi, K.L.; Estrade, Y.O.; Genova, R.C.; et al. IPCC 2014b. Climate Change 2014: Impacts, Adaptation, and Vulnerability. Part B: Regional Aspects, Contribution of Working Group II to the Fifth Assessment Report of the Intergovernmental Panel on Climate Change; Cambridge University Press: Cambridge, UK; New York, NY, USA; p. 688.
  9. Clune, S.; Crossin, E.; Verghese, K. Systematic Review of Greenhouse Gas Emissions for Different Fresh Food Categories. J. Clean. Prod. 2017, 140, 766–783. [Google Scholar] [CrossRef] [Green Version]
  10. Tilman, D.; Clark, M. Global Diets Link Environmental Sustainability and Human Health. Nature 2014, 515, 518–522. [Google Scholar] [CrossRef] [PubMed]
  11. Aleksandrowicz, L.; Green, R.; Joy, E.J.M.; Smith, P.; Haines, A. The Impacts of Dietary Change on Greenhouse Gas Emissions, Land Use, Water Use, and Health: A Systematic Review. PLoS ONE 2016, 11, e0165797. [Google Scholar] [CrossRef] [Green Version]
  12. Hallström, E.; Carlsson-Kanyama, A.; Börjesson, P. Environmental Impact of Dietary Change: A Systematic Review. J. Clean. Prod. 2015, 91, 1–11. [Google Scholar] [CrossRef]
  13. Nelson, M.E.; Hamm, M.W.; Hu, F.B.; Abrams, S.A.; Griffin, T.S. Alignment of Healthy Dietary Patterns and Environmental Sustainability: A Systematic Review. Adv. Nutr. Int. Rev. J. 2016, 7, 1005–1025. [Google Scholar] [CrossRef] [Green Version]
  14. Springmann, M.; Godfray, H.C.J.; Rayner, M.; Scarborough, P. Analysis and Valuation of the Health and Climate Change Cobenefits of Dietary Change. Proc. Natl. Acad. Sci. USA 2016, 113, 4146–4151. [Google Scholar] [CrossRef] [Green Version]
  15. Wolf, C.A.; Malone, T.; McFadden, B.R. Beverage Milk Consumption Patterns in the United States: Who Is Substituting from Dairy to Plant-Based Beverages? J. Dairy Sci. 2020, 103, 11209–11217. [Google Scholar] [CrossRef] [PubMed]
  16. Project, S.P. Plant-Based Foods in Europe: How Big Is the Market? Available online: https://smartproteinproject.eu/plant-based-food-sector-report/ (accessed on 4 May 2022).
  17. POSpulse Milchersatzprodukte im LEH. Available online: https://www.pospulse.com/milchersatzprodukte2021 (accessed on 3 December 2021).
  18. TÜV Süd and YouGov Deutschland GmbH Umfrage Kuhmilch. Available online: https://www.tuvsud.com/de-de/presse-und-medien/2020/juni/tuev-sued-umfrage-kuhmilch-ist-weiterhin-beliebt-bei-verbrauchern (accessed on 2 December 2021).
  19. Biopinio Studie Zur Verwendung von Milchalternativen, Research & Results 26./27.10.2016, Mobile, Schnelle Marktforschung: Veganer, Vegetarier Und Omnivore Zu Pflanzlichen Milchalternativen. Available online: https://biopinio.de/studie-milchalternativen/ (accessed on 20 April 2022).
  20. Grunert, K.G.; Hieke, S.; Wills, J. Sustainability Labels on Food Products: Consumer Motivation, Understanding and Use. Food Policy 2014, 44, 177–189. [Google Scholar] [CrossRef] [Green Version]
  21. Nijdam, D.; Rood, T.; Westhoek, H. The Price of Protein: Review of Land Use and Carbon Footprints from Life Cycle Assessments of Animal Food Products and Their Substitutes. Food Policy 2012, 37, 760–770. [Google Scholar] [CrossRef]
  22. Vergé, X.P.C.; Dyer, J.A.; Desjardins, R.L.; Worth, D. Greenhouse Gas Emissions from the Canadian Beef Industry. Agric. Syst. 2008, 98, 126–134. [Google Scholar] [CrossRef]
  23. Haas, G.; Wetterich, F.; Köpke, U. Comparing Intensive, Extensified and Organic Grassland Farming in Southern Germany by Process Life Cycle Assessment. Agric. Ecosyst. Environ. 2001, 83, 43–53. [Google Scholar] [CrossRef] [Green Version]
  24. Weiske, A.; Vabitsch, A.; Olesen, J.E.; Schelde, K.; Michel, J.; Friedrich, R.; Kaltschmitt, M. Mitigation of Greenhouse Gas Emissions in European Conventional and Organic Dairy Farming. Agric. Ecosyst. Environ. 2006, 112, 221–232. [Google Scholar] [CrossRef]
  25. Peters, G.M.; Rowley, H.V.; Wiedemann, S.; Tucker, R.; Short, M.D.; Schulz, M. Red Meat Production in Australia: Life Cycle Assessment and Comparison with Overseas Studies. Environ. Sci. Technol. 2010, 44, 1327–1332. [Google Scholar] [CrossRef]
  26. Röös, E.; Sundberg, C.; Tidåker, P.; Strid, I.; Hansson, P.-A. Can Carbon Footprint Serve as an Indicator of the Environmental Impact of Meat Production? Ecol. Indic. 2013, 24, 573–581. [Google Scholar] [CrossRef]
  27. Huijbregts, M.A.J.; Steinmann, Z.J.N.; Elshout, P.M.F.; Stam, G.; Verones, F.; Vieira, M.D.M.; Hollander, A.; Zijp, M.; van Zelm, R. ReCiPe2016v1.1. \textbar RIVM A Harmonized Life Cycle Impact Assessment Method at Midpoint and Endpoint Level Report I: Characterization; National Institute for Public Health and the Environment: Bilthoven, The Netherlands, 2016. [Google Scholar]
  28. Hoekstra, A.Y.; Mekonnen, M.M.; Chapagain, A.K.; Mathews, R.E.; Richter, B.D. Global Monthly Water Scarcity: Blue Water Footprints versus Blue Water Availability. PLoS ONE 2012, 7, e32688. [Google Scholar] [CrossRef]
  29. Koellner, T.; Scholz, R. Assessment of Land Use Impact on the Natural Environment: Part 1: An Analytical Framework for Pure Land Occupation and Land Use Change. J. Life Cycle Assess. 2007, 12, 16–23. [Google Scholar]
  30. Koellner, T.; Scholz, R. Assessment of Land Use Impact on the Natural Environment: Part2: Generic Characterization Factors for Local Species Diversity in Central Europe. J. Life Cycle Assess. 2007, 13, 32–48. [Google Scholar]
  31. Smedman, A.; Lindmark-Månsson, H.; Drewnowski, A.; Edman, A.-K.M. Nutrient Density of Beverages in Relation to Climate Impact. Food Nutr. Res. 2010, 54, 5170. [Google Scholar] [CrossRef] [PubMed] [Green Version]
  32. CarbonCloud. Available online: https://apps.carboncloud.com/climatehub/search?q=Oat%20drink&gate=StoreShelf (accessed on 5 May 2022).
  33. Birgersson, S.; Karlsson, B.-S.; Söderlund, L. Soy Milk—An Attributional Life Cycle Assessment Examining the Potential Environmental Impact of Soy Milk; Stockholm University: Stockholm, Sweden, 2009. [Google Scholar]
  34. Winans, K.S.; Macadam-Somer, I.; Kendall, A.; Geyer, R.; Marvinney, E. Life Cycle Assessment of California Unsweetened Almond Milk. Int. J. Life Cycle Assess. 2020, 25, 577–587. [Google Scholar] [CrossRef] [Green Version]
  35. Meneses, M.; Pasqualino, J.; Castells, F. Environmental Assessment of the Milk Life Cycle: The Effect of Packaging Selection and the Variability of Milk Production Data. J. Environ. Manag. 2012, 107, 76–83. [Google Scholar] [CrossRef] [PubMed]
  36. Thoma, G.; Popp, J.; Nutter, D.; Shonnard, D.; Ulrich, R.; Matlock, M.; Kim, D.S.; Neiderman, Z.; Kemper, N.; East, C.; et al. Greenhouse Gas Emissions from Milk Production and Consumption in the United States: A Cradle-to-Grave Life Cycle Assessment circa 2008. Int. Dairy J. 2013, 31, S3–S14. [Google Scholar] [CrossRef] [Green Version]
  37. Mottet, A.; Henderson, B.; Opio, C.; Falcucci, A.; Tempio, G.; Silvestri, S.; Chesterman, S.; Gerber, P.J. Climate Change Mitigation and Productivity Gains in Livestock Supply Chains: Insights from Regional Case Studies. Reg. Environ. Change 2017, 17, 129–141. [Google Scholar] [CrossRef]
  38. Pointke, M.; Albrecht, E.H.; Geburt, K.; Gerken, M.; Traulsen, I.; Pawelzik, E. A Comparative Analysis of Plant-Based Milk Alternatives Part 1: Composition, Sensory and Nutritional Value. Sustainability 2022, 14, 7996. [Google Scholar] [CrossRef]
  39. Hoekstra, A.Y.; Chapagain, A.K.; Aldaya, M.M.; Mekonnen, M.M. The Water Footprint Assessment Manual: Setting the Global Standard; Earthscan: London, UK, 2011. [Google Scholar]
  40. Frischknecht, R.; Jungbluth, N.; Althaus, H.J.; Doka, G.; Dones, R.; Heck, T.; Hellweg, S.; Hischier, R.; Nemecek, T.; Rebitzer, G.; et al. Overview and Methodology, Final Report Ecoinvent v2.0 No. 1; Swiss Centre for Life Cycle Inventories: Dübendorf, Switzerland, 2007. [Google Scholar]
  41. Hischier, R.; Weidema, B.; Althaus, H.-J.; Bauer, C.; Doka, G.; Dones, R.; Frischknecht, R.; Hellweg, S.; Humbert, S.; Jungbluth, N.; et al. Implementation of Life Cycle Impact Assessment Methods. Ecoinvent Report No. 3, v2.2; Swiss Centre for Life Cycle Inventories: Dübendorf, Switzerland, 2010. [Google Scholar]
  42. Röös, E.; Patel, M.; Spångberg, J. Producing Oat Drink or Cow’s Milk on a Swedish Farm—Environmental Impacts Considering the Service of Grazing, the Opportunity Cost of Land and the Demand for Beef and Protein. Agric. Syst. 2016, 142, 23–32. [Google Scholar] [CrossRef] [Green Version]
  43. Schilling, G. Pflanzenernährung Und Düngung; UTB Eugen Ulmer: Stuttgart, Germany, 2000. [Google Scholar]
  44. UBA Carbon Footprint—Teilgutachten, Monitoring Für Den CO2-Ausstoß in Der Logistikkette. Available online: http://www.uba.de/uba-info-median/4306.html (accessed on 1 February 2022).
  45. Spielmann, M.; Bauer, C.; Dones, R.; Tuchschmid, M. Ecoinvent, Transport Services Data v2.0, Ecoinvent Report No. 14; Swiss Centre for Life Cycle Inventories: St. Gallen, Switzerland; Villigen, Germany; Uster, Switzerland, 2007. [Google Scholar]
  46. Mc Geough, E.J.; Little, S.M.; Janzen, H.H.; McAllister, T.A.; McGinn, S.M.; Beauchemin, K.A. Life-Cycle Assessment of Greenhouse Gas Emissions from Dairy Production in Eastern Canada: A Case Study. J. Dairy Sci. 2012, 95, 5164–5175. [Google Scholar] [CrossRef] [PubMed] [Green Version]
  47. Basset-Mens, C.; Ledgard, S.; Boyes, M. Eco-Efficiency of Intensification Scenarios for Milk Production in New Zealand. Ecol. Econ. 2009, 68, 1615–1625. [Google Scholar] [CrossRef]
  48. Yan, M.-J.; Humphreys, J.; Holden, N.M. Life Cycle Assessment of Milk Production from Commercial Dairy Farms: The Influence of Management Tactics. J. Dairy Sci. 2013, 96, 4112–4124. [Google Scholar] [CrossRef] [PubMed]
  49. Rotz, C.A.; Montes, F.; Chianese, D.S. The Carbon Footprint of Dairy Production Systems through Partial Life Cycle Assessment. J. Dairy Sci. 2010, 93, 1266–1282. [Google Scholar] [CrossRef] [PubMed]
  50. De Boer, I.J.M. Environmental Impact Assessment of Conventional and Organic Milk Production. Livest. Prod. Sci. 2003, 80, 69–77. [Google Scholar] [CrossRef]
  51. Frank, H.; Schmid, H.; Hülsbergen, K.J. Modelling Greenhouse Gas Emissions from Organic and Conventional Dairy Farms. J. Sustain. Org. Agric. Syst. 2019, 69, 37–46. [Google Scholar]
  52. Rutledge, S.; Wall, A.M.; Mudge, P.L.; Troughton, B.; Campbell, D.I.; Pronger, J.; Joshi, C.; Schipper, L.A. The Carbon Balance of Temperate Grasslands Part I: The Impact of Increased Species Diversity. Agric. Ecosyst. Environ. 2017, 239, 310–323. [Google Scholar] [CrossRef]
  53. O’Mara, F.P. The Role of Grasslands in Food Security and Climate Change. Ann. Bot. 2012, 110, 1263–1270. [Google Scholar] [CrossRef] [PubMed] [Green Version]
  54. Idel, A. Die Kuh Ist Kein Klima-Killer! Agrarkultur Im 21. Jahrhundert, 6th ed.; Schweinsfurth Stiftung, Metropolis-Verlag: Marburg, Germany, 2016. [Google Scholar]
  55. Knudsen, M.T.; Dorca-Preda, T.; Djomo, S.N.; Pena, N.; Nadel, S.; Smith, L.G.; Zollitsch, W.; Hörtenhuber, S.; Hermansen, J.E. The Importance of Including Soil Carbon Changes, Ecotoxicity and Biodiversity Impacts in Environmental Life Cycle Assessments of Organic and Conventional Milk in Western Europe. J. Clean. Prod. 2019, 215, 433–443. [Google Scholar] [CrossRef]
  56. FiBL Merkblatt Biosoja. Available online: https://www.fibl.org/de/shop (accessed on 12 May 2022).
  57. Lesschen, J.P.; van den Berg, M.; Westhoek, H.J.; Witzke, H.P.; Oenema, O. Greenhouse Gas Emission Profiles of European Livestock Sectors. Anim. Feed Sci. Technol. 2011, 166–167, 16–28. [Google Scholar] [CrossRef]
  58. Westhoek, H.; Rood, T.; Van den Berg, M.; Janse, J.; Nijdam, D.; Reudink, M.; Stehfest, E. The Protein Puzzle: The Consumption and Production of Meat, Dairy and Fish in the European Union; PBL Netherlands Environmental Assessment Agency: The Hague, The Netherlands, 2011; ISBN 978-90-78645-61-0. [Google Scholar]
  59. Garnett, T. Livestock-Related Greenhouse Gas Emissions: Impacts and Options for Policy Makers. Environ. Sci. Policy 2009, 12, 491–503. [Google Scholar] [CrossRef]
  60. Mottet, A.; de Haan, C.; Falcucci, A.; Tempio, G.; Opio, C.; Gerber, P. Livestock: On Our Plates or Eating at Our Table? A New Analysis of the Feed/Food Debate. Glob. Food Secur. 2017, 14, 1–8. [Google Scholar] [CrossRef]
  61. Scheffer, F.; Schachtschabel, P. Lehrbuch Der Bodenkunde, 12th ed.; Enke Verlag: Stuttgart, Germany, 1989. [Google Scholar]
  62. LFU. Handbuch Boden, Bodenversauerung Ursachen—Auswirkungen—Maßnahmen Literaturstudie; Landesanstalt für Umweltschutz Baden-Württemberg: Karlsruhe, Germany, 1997. [Google Scholar]
  63. Micke, W.C.; University of California (System); Division of Agriculture and Natural Resources. Almond Production Manual; University of California, Division of Agriculture and Natural Resources: Oakland, CA, USA, 1996; ISBN 978-1-879906-22-8. [Google Scholar]
  64. LFU. UmweltWissen—Schadstoffe, Ammoniak Und Ammonium, Bayrisches Landesamt Für Umwelt; Bayrisches Landesamt für Umwelt: Augsburg, Germany, 2018. [Google Scholar]
  65. Cambridge University Press. The European Nitrogen Assessment: Sources, Effects, and Policy Perspectives; Sutton, M.A., Ed.; Cambridge University Press: Cambridge, UK; New York, NY, USA, 2011; ISBN 978-1-107-00612-6. [Google Scholar]
  66. Centre for Ecology & Hydrology. Our Nutrient World: The Challenge to Produce More Food and Energy with Less Pollution; [Global Overview on Nutrient Management; Sutton, M.A., UNEP, Eds.; Centre for Ecology & Hydrology: Edinburgh, Scotland, 2013; ISBN 978-1-906698-40-9. [Google Scholar]
  67. Carpenter, S.R.; Caraco, N.F.; Correll, D.L.; Howarth, R.W.; Sharpley, A.N.; Smith, V.H. NONPOINT POLLUTION OF SURFACE WATERS WITH PHOSPHORUS AND NITROGEN. Ecol. Appl. 1998, 8, 559–568. [Google Scholar] [CrossRef]
  68. Klaiss, M.; Schmid, N.; Betrix, C.-A.; Baux, A.; Charles, R.; Messmer, M.M. Organic Soybean Production in Switzerland. OCL 2020, 27, 64. [Google Scholar] [CrossRef]
  69. Berthoud, A.; Maupu, P.; Huet, C.; Poupart, A. Assessing Freshwater Ecotoxicity of Agricultural Products in Life Cycle Assessment (LCA): A Case Study of Wheat Using French Agricultural Practices Databases and USEtox Model. Int. J. Life Cycle Assess. 2011, 16, 841–847. [Google Scholar] [CrossRef]
  70. Commission Implementing Regulation (EU) 2021/1165 of 15. Juli 2021 Authorising Certain Products and Substances for Use in Organic Production and Establishing Their Lists; Official Journal of the European Union; European Union: Maastricht, The Netherlands, 2021. [Google Scholar]
  71. Nordborg, M.; Davis, J.; Cederberg, C.; Woodhouse, A. Freshwater Ecotoxicity Impacts from Pesticide Use in Animal and Vegetable Foods Produced in Sweden. Sci. Total Environ. 2017, 581–582, 448–459. [Google Scholar] [CrossRef] [PubMed] [Green Version]
  72. LFU. UmweltWissen—Bodennahes Ozon Und Sommersmog; Bayrisches Landesamt Für Umwelt: Augsburg, Germany, 2020. [Google Scholar]
  73. Paul, A.A.; Kumar, S.; Kumar, V.; Sharma, R. Milk Analog: Plant Based Alternatives to Conventional Milk, Production, Potential and Health Concerns. Crit. Rev. Food Sci. Nutr. 2020, 60, 3005–3023. [Google Scholar] [CrossRef] [PubMed]
  74. Cardinale, B.J.; Duffy, J.E.; Gonzalez, A.; Hooper, D.U.; Perrings, C.; Venail, P.; Narwani, A.; Mace, G.M.; Tilman, D.; Wardle, D.A.; et al. Biodiversity Loss and Its Impact on Humanity. Nature 2012, 486, 59–67. [Google Scholar] [CrossRef]
  75. Fearnside, P.M. Soybean Cultivation as a Threat to the Environment in Brazil. Environ. Conserv. 2001, 28, 23–38. [Google Scholar] [CrossRef] [Green Version]
  76. Blanco-Canqui, H.; Blanco, H.; Lal, R. Principles of Soil Conservation and Management; Springer: New York, NY, USA, 2010; ISBN 978-1-4020-8709-7. [Google Scholar]
  77. Mäkinen, O.E.; Wanhalinna, V.; Zannini, E.; Arendt, E.K. Foods for Special Dietary Needs: Non-Dairy Plant-Based Milk Substitutes and Fermented Dairy-Type Products. Crit. Rev. Food Sci. Nutr. 2016, 56, 339–349. [Google Scholar] [CrossRef]
  78. Scholz-Ahrens, K.E.; Ahrens, F.; Barth, C.A. Nutritional and health attributes of milk and milk imitations. Eur. J. Nutrrition 2020, 59, 19–34. [Google Scholar] [CrossRef] [PubMed]
  79. Gorissen, S.H.M.; Crombag, J.J.R.; Senden, J.M.G.; Waterval, W.A.H.; Bierau, J.; Verdijk, L.B.; van Loon, L.J.C. Protein Content and Amino Acid Composition of Commercially Available Plant-Based Protein Isolates. Amino Acids 2018, 50, 1685–1695. [Google Scholar] [CrossRef] [Green Version]
  80. Tukker, A.; Goldbohm, R.A.; de Koning, A.; Verheijden, M.; Kleijn, R.; Wolf, O.; Pérez-Domínguez, I.; Rueda-Cantuche, J.M. Environmental Impacts of Changes to Healthier Diets in Europe. Ecol. Econ. 2011, 70, 1776–1788. [Google Scholar] [CrossRef]
Table 2. Data sets: description and origin of the main ingredients of the beverages.
BeverageOrigin of Main Ingredient% of Main Ingredient
Oat drink CH12.4% oat
Soy drink BR/USA 50% BR, 45% USA, 5% CH12.5% soy
Soy drink CH (organic) CH12.5% soy
Almond drink USA13.1% almond
Cow milk conv. CH3.5% fat
Cow milk organic CH3.5% fat
BR: Brazil; CH: Switzerland; conv: conventional.
Table 3. Impact categories, equivalence unit, included compounds and corresponding factors (in brackets) in the H-perspective of ReCiPe 2016 v1.1, according to Huijbregts et al. [27].
Impact CategoryEquivalence UnitIncluded Compounds and Corresponding Factor
Global warmingCO2-eCO2 (1)CH4 (34)N2O (298)
Land usem²a crop -e
Terrestrial acidificationSO2-eSO2 (1)NOx (0.36)NH3 (1.96)
Freshwater eutrophicationP-eP (1)PO4³⁻ (0.33)
Marine eutrophicationN-eN (1)NH4⁺ (0.78)NO2 (0.3)
Terrestrial ecotoxicity1.4-DCB-e1.4-DCB (1)Nickel (37)
Freshwater ecotoxicity1.4-DCB-e1.4-DCB (1)Nickel (46)
Marine ecotoxicity1.4-DCB-e1.4-DCB (1)Nickel (320)
Ozone formationNOx-eNOx (1)NMVOC (0.29)
Water consumptionm3
1.4-DCB-e: 1.4-dichlorbenzene-equivalent; NMVOC: Non Methane Volatile Organic Compounds.
Table 4. Nutritional composition of plant-based milk alternatives and milk beverages used for calculation of Life Cycle Assessment Nutritional Value—Indexes.
Nutrient Composition/OatSoyAlmondCow MilkCow MilkUHT MilkUHT Milk
100 g BeverageDrinkDrinkDrinkConventionalOrganicConventionalOrganic
Energy in kcal43.441.524.165.165.164.464.4
Protein in g0.63.40.63.33.33.33.3
UHT: Ultra-high temperature.
Table 5. LCA results for all beverages, analyzed by method and impact category.
MethodImpact CategoryUnitOat DrinkSoy Drink BR/USASoy Drink
CH
Almond DrinkCow Milk
Conv
Cow Milk
Organic
UHT Milk
Conv
UHT Milk
Organic
ReCiPeGlobal warmingkg CO2 eq0.460.460.400.611.411.451.301.33
2016Land usem2a crop eq0.660.490.600.421.021.251.021.25
Terrestrial acid.kg SO2 eq2.10 × 10−31.45 × 10−31.14 × 10−33.42 × 10−39.46 × 10−31.06 × 10−29.20 × 10−31.03 × 10⁻²
Freshwater eutrophic.kg P eq2.81 × 10−55.55 × 10−53.43 × 10−52.05 × 10−58.82 × 10−59.21 × 10−58.51 × 10−58.91 × 10⁻⁵
Marine eutrophic.kg N eq5.67 × 10−44.09 × 10−47.86 × 10−47.24 × 10−47.22 × 10−46.80 × 10−47.22 × 10−46.79 × 10⁻⁴
Terrestrial ecotox.kg 1,4-DCB0.740.460.351.091.861.811.751.70
Freshwater ecotox.kg 1,4-DCB7.50 × 10−44.45 × 10−34.50 × 10−41.19 × 10−32.11 × 10−31.03 × 10−32.09 × 10−31.02 × 10⁻³
Marine ecotox.kg 1,4-DCB1.15 × 10−32.06 × 10−38.89 × 10−41.42 × 10−32.61 × 10−32.40 × 10−32.52 × 10−32.31 × 10⁻³
Ozone formationkg NOx eq1.87 × 10−31.32 × 10−39.94 × 10−43.60 × 10−31.89 × 10−31.85 × 10−31.57 × 10−31.54 × 10⁻³
Water consumptionm32.551.662.222.527.377.664.855.14
WSIWater scarcity indexm36.00 × 10−35.00 × 10−34.00 × 10−31.40 × 10−11.20 × 10−21.30 × 10−21.00 × 10−21.10 × 10⁻²
EDPEcosystem damagepoints0.723.480.190.621.760.951.760.94
WSI: Water scarcity index; EDP: Ecosystem damage potential; acid.: acidification; eutropic.: eutrophication; ecotox.: ecotoxicity; 1,4-DCB-e: 1.4-dichlorbenzene-equivalent; BR: Brazil; CH: Switzerland; conv: conventional; UHT: Ultra-high temperature; the color scale ranges from dark green for the lowest to red for the highest impact value and corresponds to qualitative similarity.
Table 6. Relative changes (%) in LCA results for the organic and UHT cow milk in relation to conventional milk.
MethodImpact CategoryUnitCow Milk ConvCow Milk OrganicUHT Milk ConvUHT Milk Organic
ReCiPe 2016Global warmingkg CO2 eq1.412.3%−8.2%−5.9%
Land usem²a crop eq1.0222.5%−0.1%22.4%
Terrestrial acidificationkg SO2 eq9.46 × 10−311.7%−2.8%8.9%
Freshwater eutrophicationkg P eq8.82 × 10−54.5%−3.5%1.0%
Marine eutrophicationkg N eq7.22 × 10−4−5.8%−0.1%−5.9%
Terrestrial ecotoxicitykg 1,4-DCB1.86−2.7%−5.9%−8.6%
Freshwater ecotoxicitykg 1,4-DCB2.11 × 10−3−51.0%−0.6%−51.6%
Marine ecotoxicitykg 1,4-DCB2.61 × 10−3−8.0%−3.6%−11.6%
Ozone formation, terr.kg NOx eq1.89 × 10−3−1.8%−16.8%−18.6%
Water consumption7.373.8%−34.2%−30.3%
WSIWater scarcity index1.20 × 10−28.3%−16.7%−8.3%
EDPEcosystem damage potentialpoints1.76−46.0%0.0%−46.6%
WSI: Water scarcity index; EDP: Ecosystem damage potential; 1,4-DCB-e: 1.4-dichlorbenzene-equivalent; BR: Brazil; CH: Switzerland; conv: conventional; UHT: Ultra-high temperature.
Table 7. Ecosystem damage potential (EDP) by beverage.
Ecosystem Damage PotentialUnitOat DrinkSoy Drink BR/USASoy Drink
CH
Almond DrinkCow Milk
Conv
Cow Milk
Organic
UHT Milk
Conv
UHT Milk
Organic
Land occupationpoints0.670.390.170.570.910.890.910.88
Land transform.points0.053.090.020.050.850.060.850.06
Total EDPpoints0.723.480.190.621.760.951.760.94
BR: Brazil; CH: Switzerland; conv: conventional; UHT: Ultra-high temperature; Land transform.: Land transformation.
Table 8. Life Cycle Assessment Nutritional Value—Index for energy content (kcal) of beverages.
IndexUnitOat DrinkSoy Drink BR/USASoy Drink CHAlmond DrinkCow Milk ConvCow Milk OrganicUHT Milk ConvUHT Milk Organic
GW/Energyg CO2 eq/kcal1.031.080.952.482.132.181.982.00
Land use/Energym²a crop eq/kcal1.48 × 10−31.16 × 10−31.42 × 10−31.70 × 10−31.54 × 10−31.89 × 10−31.55 × 10−31.91 × 10⁻³
Water cons./Energym³/kcal5.76 × 10−33.93 × 10−35.24 × 10−31.02 × 10−21.11 × 10−21.15 × 10−27.40 × 10−37.80 × 10⁻³
EDP/Energypoints / kcal1.67 × 10−38.42 × 10−34.58 × 10−42.54 × 10−32.70 × 10−31.44 × 10−32.70 × 10−31.46 × 10⁻³
GW: Global warming; Water cons.: Water consumption; EDP: Ecosystem damage potential; BR: Brazil; CH: Switzerland; conv: conventional; UHT: Ultra-high temperature; the color scale ranges from dark green for the lowest to red for the highest impact value and corresponds to qualitative similarity.
Table 9. Life Cycle Assessment Nutritional Value—Index for protein content (g) of beverages.
IndexUnitOat DrinkSoy Drink BR/USASoy Drink CHAlmond DrinkCow Milk ConvCow Milk OrganicUHT Milk ConvUHT Milk Organic
GW/Proteing CO2 eq/g75.9113.0511.59101.5441.5942.5438.5839.14
Land use/Proteinm²a crop eq/g0.110.010.020.070.030.040.030.04
Water cons./Proteinm³/g0.430.050.060.420.220.230.140.15
EDP/Proteinpoints/g0.120.100.010.100.050.030.050.03
GW: Global warming; Water cons.: Water consumption; EDP: Ecosystem damage potential; BR: Brazil; CH: Switzerland; conv: conventional; UHT: Ultra-high temperature; the color scale ranges from dark green for the lowest to red for the highest impact value and corresponds to qualitative similarity.
Publisher’s Note: MDPI stays neutral with regard to jurisdictional claims in published maps and institutional affiliations.

